ISBN 978-0-9737377-9-0 - Institute for … 6 AR 6 Path to the 2020 Prosperity Agenda Path to the...
68
AR 6 AR 6 Path to the 2020 Prosperity Agenda Path to the 2020 Prosperity Agenda Task Force on Competitiveness, Productivity and Economic Progress SIXTH ANNUAL REPORT, NOVEMBER 2007
Transcript of ISBN 978-0-9737377-9-0 - Institute for … 6 AR 6 Path to the 2020 Prosperity Agenda Path to the...

AR
6AR
6 P
ath to the 2020 Prosp
erity Agend
a
Path to the 2020 Prosperity Agenda
ISBN 978-0-9737377-9-0
Task Force on Competitiveness, Productivity and Economic Progress
Task Force on Competitiveness, Productivity and Economic ProgressSIxTH ANNUAL REPORT, NOVEMBER 2007

The Task Force on Competitiveness, Productivity and Economic Progress was announced in the April 2001 Speech from the Throne. Its mandate is to measure and monitor Ontario’s competitiveness, productivity, and economic progress compared to other provinces and US states. In the 2004 Budget, the Government asked the Task Force to incorporate innovation and commercialization issues into its mandate. The Task Force reports directly to the public.
It is the aspiration of the Task Force to have a significant influence in increasing Ontario’s competitiveness, productivity, and capacity for innovation. This, we believe, will help ensure continued success in the creation of good jobs, increased prosperity, and a high quality of life for all Ontarians.
The Institute for Competitiveness & Prosperity is an independent organization established in 2001 to serve as the research arm of the Task Force. Working Papers and research published by the Institute are primarily intended to inform the work of the Task Force. In addition, they are designed to deepen public understanding of macro and microeconomic factors behind Ontario’s economic progress and stimulate debate on a range of issues related to competitiveness and prosperity.
Comments on this Sixth Annual Report are encouraged and should be directed to the Institute for Competitiveness & Prosperity. The Task Force and the Institute are funded by the Government of Ontario through the Ministry of Economic Development and Trade.
Copyright © November 2007
The Institute for Competitiveness & Prosperity
ISBN 978-0-9737377-9-0
How to contact us
To learn more about the Institute and the Task Force please visit us at: www.competeprosper.ca
Should you have any questions or comments, you may reach us through the web site or at the following address:
The Institute for Competitiveness & Prosperity180 Bloor Street West, Suite 1100Toronto, Ontario M5S 2V6Telephone 416.920.1921Fax 416.920.1922
Executive Director
James Milway416 920 1921 [email protected]
Researchers
Lance Bialas416 920 1921 [email protected]
Usman Naeem416 920 1921 [email protected] Sana Nisar416 920 1921 [email protected]
Daniela Scur 416 920 1921 [email protected]
Design Hambly & Woolley Inc. www.hamblywoolley.comIllustrations Dan Page
ChairmanRoger L. Martin
Joseph L. Rotman School of
Management
MembersJim Balsillie
Research in Motion Ltd.
Timothy Dattels
Newbridge Capital
Lisa de Wilde
TVOntario
David Folk
Jefferson Partners
Dr. Suzanne Fortier
Natural Sciences and Engineering
Research Council
Gordon Homer
Gordon J. Homer Advisory Services
David Johnston
University of Waterloo
David Keddie
National Compressed Air
Mark Mullins
Fraser Institute
Tim Penner
Procter & Gamble Inc.
Daniel Trefler
University of Toronto
Task Force on Competitiveness, Productivity and Economic Progress

Path to the 2020 Prosperity AgendaTask force on compeTiTiveness, producTiviTy and economic progress SIXTH AnnuAl rePorT, november 2007
exhibit 1 outside north america, ontario is more prosperous than most regions of similar size 8
exhibit 2 ontario has a significant prosperity gap with its north american peers 9
exhibit 3 The prosperity gap widened in 2006 10
exhibit 4 closing the prosperity gap affords increased public expenditure and tax reduction in ontario 11
exhibit 5 income in ontario exceeds peer states at bottom of distribution; but this advantage has faded 12
exhibit 6 The current steep rise of the canadian dollar is unprecedented 13
exhibit 7 ontario’s 2020 prosperity agenda closes the prosperity gap 14
exhibit 8 The Task force measures four components of prosperity 20
exhibit 9 productivity and intensity are the main sources of ontario’s prosperity gap 21
exhibit 10 growing productivity and intensity gaps have driven the prosperity gap 23
sidebar prosperity and productivity lag in ontario cities 24
exhibit 11 over the past five years ontario has maintained its prosperity lead over international peers 28
sidebar Why productivity is important for our prosperity 29
exhibit 12 aims drives prosperity; prosperity drives aims 34
exhibit 13 ontarians respond to the case for closing the gap 35
exhibit 14 ontario businesses invest much less in machinery and equipment per worker than their us counterparts 39
exhibit 15 ontario’s public investment in education trails us expenditure 40
exhibit 16 ontario out invests peer states in university r&d 42
exhibit 17 student-faculty ratios are much higher in ontario universities than at comparable schools in the peer states 43
exhibit 18 Taxation of new business investment is higher in ontario than nearly all oecd countries – despite reductions by the federal government in the march budget 47
exhibit 19 specialized support and competitive pressure drive innovative strategies by firms 49
exhibit 20 venture capital returns in canada are well below those in the united states 51
sidebar encouraging world-leading innovativeness and growth in Toronto’s financial services cluster 53
exhibits

Foreword and acknowledgements 4
Tackling The 2020 prosperiTy agenda challenge 7
ontario out performs most jurisdictions outside north america 8
ontario trails leading north american jurisdictions 9
ontarians should not be complacent 10
The gap could widen significantly 13
a near term action plan is a step toward achieving ontario’s 2020 prosperity agenda 14
The prosperiTy gap 19
Lagging intensity and productivity remain the biggest hurdles 20
productivity gap continues to be important 27
ontario’s prosperity compares well globally, though productivity still trails 27
aims and prosperiTy 33
Attitudes: Accept the challenge; overcome complacency 35
We are more concerned about not achieving potential than the prosperity gap 35
views on taxation of business investment are ambiguous 35
many do not recognize problems of personal taxation for low income canadians 36
many are unwilling to shift government spending from consumption to investment 36
respondents split evenly on the benefits and threats of free trade 37
Investment: Focus on technology and people 38
increase investment in machinery and equipment, particularly information
and communication technology 38
raise our investment in human capital 38
Motivations: Pursue smarter taxation 45
Lower taxes on new business investment 45
reduce personal taxes that punish low income earners 48
Structures: Place a premium on creativity and innovation 49
Build stronger management capabilities 49
attract more sophisticated venture capital 51
identify opportunities for encouraging Toronto’s financial services cluster 52
continue to pursue bilateral free trade agreements 56
paTh To The 2020 prosperiTy agenda 59
References 62
Previous publications 64
Contents

We see an unparalleled opportunity to engage Ontarians on the importance of competitiveness and prosperity and to embark on new initiatives that continue the journey to realize our prosperity potential.
on behalf of ontario’s Task force on competitiveness, productivity and economic progress, i am pleased to present our sixth annual report to the ontario public.
This report continues the themes from our fifth annual report, where we set out a long term prosperity agenda for ontario to achieve its prosperity potential by 2020. We observed that ontario’s competitiveness and prosperity did not figure prominently in the recent election, and this was disappointing to the Task force. now, as the government prepares its own agenda following its re-election, we urge it to place a high priority on this important work. The government has the opportunity to advance some breakthrough ideas for consideration by the Legislature and the public. in this report, we recommend priorities as the government begins its new mandate. all ontarians need to be active partners in that dialogue because our government cannot tackle the 2020 prosperity agenda on its own. continued complacency will hamper our progress.
We remain convinced that this agenda is critical for ontarians. as we show in this report, ontario is one of the most prosperous jurisdictions in the world, especially when compared to regions outside north america.
and yet, we could do better. We continue to lag our prosperity potential, as defined by the gap in gdp per capita with our north american peers. realizing this potential would mean that our families could afford a better standard of living. our governments could invest more in social and physical investments that would address poverty and ensure we leave our children a better ontario than we inherited. our work also shows that missing our potential has costs for our most vulnerable citizens. our prosperity gap means more involuntary part-time jobs for those who need to work. it also means that those at the bottom of the economic ladder are at risk of falling behind their us counterparts.
as the government develops the legislative agenda and budget, we recommend placing a high priority on a few items. in taxation, we urge a fundamental rethink of how we tax. it is fair to say that ontario has one of the worst regimes for new business investment. Lowering taxes on business investment would stimulate greater economic activity in the private sector thereby strengthening our economy. new evidence points to another compelling reason – that lower corporate taxes could actually increase government revenue.
Foreword and acknowledgements
4 task force on competitiveness, productivity and economic progress
“
”

an immediate priority for ontario is to move toward harmonizing our provincial sales tax with the federal gsT, converting it to a value added tax. research by us and others shows that this is the most effective tax change to stimulate investment and job creation. on the personal side, we need to find ways of reducing the marginal tax burden on lower income ontarians and strengthening the incentives for work.
We have been heartened by the government’s recognition of the importance of post secondary education for competitiveness and prosperity. We are also encouraged by its commitments to expand skills development for immigrants and apprenticeship opportunities. in the coming year, we recommend deeper exploration of the balance between teaching and research in post secondary education. our recent research indicated the need for innovative investments targeted to reduce poverty among specific high risk groups – we urge the government to take up this challenge.
finally, looking at the structures that drive innovation and upgrading, we urge the government to continue assessing whether ontario’s innovation agenda is adequately supported in the area of management education.
realizing our prosperity potential is a marathon, not a sprint. We have been encouraged by many of the initiatives already taken by the government in ontario. But more needs to be done. at the outset of its new mandate, we see an unparalleled opportunity to engage ontarians in the importance of competitiveness and prosperity and to embark on new initiatives that continue the journey to realize our prosperity potential.
We gratefully acknowledge the research support from the institute for competitiveness & prosperity and the funding support from the ministry of economic development and Trade. We look forward to sharing and discussing our work and findings with all ontarians. We welcome your comments and suggestions.
roger L. martin, chairman Task force on competitiveness, productivity and economic progress dean, Joseph L. rotman school of management, university of Toronto
5


path to the 2020 prosperity agenda 7
As the Ontario Government begins its new mandate, we see great opportunities for starting to tackle the challenge of the 2020 Prosperity Agenda
in our fifTh annual reporT, we drew on our accumulated research to set out an ambitious 2020 prosperity agenda for ontario to realize its full prosperity potential. The key challenge ontarians face is to take the actions that will drive a very successful economy towards its full potential. as in other walks of life, it is difficult to develop a shared determination unless there is a sense of urgency based on readily recognized problems. The fact that ontario’s prosperity did not feature prominently in the recent election is evidence of this. ironically, our success is our biggest barrier to accepting the prosperity challenge we have set out. more important, our economic success is good news – we do not have to take drastic, painful actions to set our economic course right.
nevertheless, with the just re-elected government preparing for its renewed mandate, we think this is an opportune time for everyone to begin the process of taking serious action to realize our full prosperity potential.
Tackling the 2020 Prosperity Agenda challenge
Ontario out performs most jurisdictions outside North America
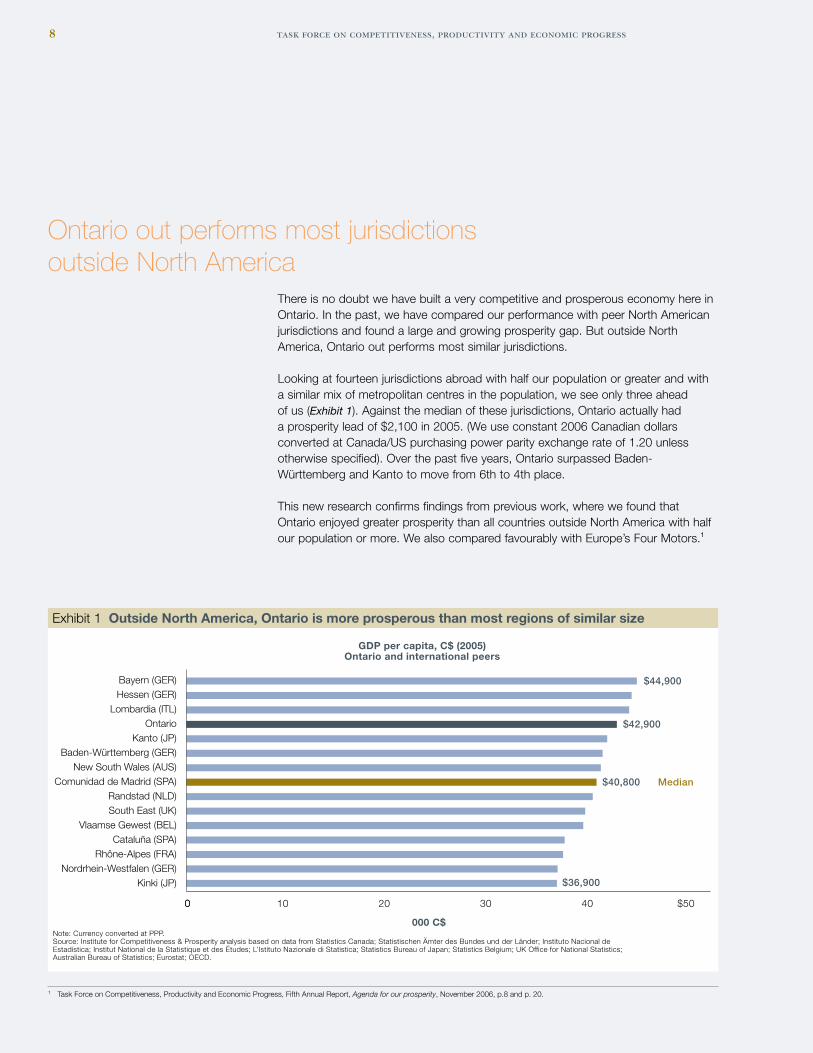
There is no doubt we have built a very competitive and prosperous economy here in ontario. in the past, we have compared our performance with peer north american jurisdictions and found a large and growing prosperity gap. But outside north america, ontario out performs most similar jurisdictions.
Looking at fourteen jurisdictions abroad with half our population or greater and with a similar mix of metropolitan centres in the population, we see only three ahead of us (Exhibit 1). against the median of these jurisdictions, ontario actually had a prosperity lead of $2,100 in 2005. (We use constant 2006 canadian dollars converted at canada/us purchasing power parity exchange rate of 1.20 unless otherwise specified). over the past five years, ontario surpassed Baden-Württemberg and kanto to move from 6th to 4th place.
This new research confirms findings from previous work, where we found that ontario enjoyed greater prosperity than all countries outside north america with half our population or more. We also compared favourably with europe’s four motors.1
8 task force on competitiveness, productivity and economic progress
10 20 30 40 $500
Bayern (GER)Hessen (GER)
Lombardia (ITL)Ontario
Kanto (JP)Baden-Württemberg (GER)
New South Wales (AUS)Comunidad de Madrid (SPA)
Randstad (NLD)South East (UK)
Vlaamse Gewest (BEL)Cataluña (SPA)
Rhône-Alpes (FRA)Nordrhein-Westfalen (GER)
Kinki (JP)
$44,900
$42,900
$40,800 Median
$36,900
Note: Currency converted at PPP.Source: Institute for Competitiveness & Prosperity analysis based on data from Statistics Canada; Statistischen Ämter des Bundes und der Länder; Instituto Nacional de Estadística; Institut National de la Statistique et des Études; L’Istituto Nazionale di Statistica; Statistics Bureau of Japan; Statistics Belgium; UK Office for National Statistics; Australian Bureau of Statistics; Eurostat; OECD.
GDP per capita, C$ (2005)Ontario and international peers
000 C$
0
Exhibit 1 Outside North America, Ontario is more prosperous than most regions of similar size
1 Task force on competitiveness, productivity and economic progress, fifth annual report, Agenda for our prosperity, november 2006, p.8 and p. 20.

path to the 2020 prosperity agenda 9
This success in a global setting is based on our highly skilled and culturally diverse work force, our mix of productive industries, our macroeconomic strengths, including low inflation, low unemployment, and a balanced fiscal situation. But the story is different in north america.
Ontario trails leading North American jurisdictionsWhen we look closer to home to determine ontario’s competitiveness and pros-perity versus similar north american jurisdictions, we still find unmet potential. We trail the median gdp per capita of these jurisdictions by a significant margin – fully $6,000 per capita in 2006 (Exhibit 2). and we lag the leading jurisdictions, new york, massachusetts, and new Jersey by nearly $20,000 per capita.
This $6,000 difference with the median represents prosperity potential that we are not achieving but should be aspiring to attain. in the not too distant past, ontario was at the median of these world leading jurisdictions. since 1989, we have drifted further behind these us states. our prosperity gap opened most dramatically during and after the 1990–92 recession, and we still have not recovered (Exhibit 3). The prosperity gap reached its maximum in 1998 and fell until 2002, when it began to widen again. in 2006, the gap widened for the fourth year in a row, growing from $5,500 in 2005.2
GDP per capita, C$ (2006)
0 10 20 30 40 50 60 $70
$63,400
$49,900
$43,900
New YorkMassachusetts
New JerseyVirginia
CaliforniaIllinoisTexas
North CarolinaMedian
PennsylvaniaGeorgia
OhioFloridaIndiana
MichiganOntarioQuébec
Note: Currency converted at PPP.Source: Institute for Competitiveness & Prosperity analysis based on data from Statistics Canada, Provincial Economic Accounts (CANSIM Table 384-0002); US Department of Commerce, Bureau of Economic Analysis, National Income and Product Accounts.
000 C$
Exhibit 2 Ontario has a significant prosperity gap with its North American peers
2 in last year’s annual report we calculated the prosperity gap to be $6,100 (2005 dollars). minor re-estimates by government agencies in canada and the united states, an update of the purchasing power parity (ppp) at which we convert us dollars into canadian dollars, and a shift to a 2006 base have resulted in an adjusted 2005 gap of $5,500 when expressed in 2006 canadian dollars.

10 task force on competitiveness, productivity and economic progress
given that our performance matched the prosperity of the median of this group of world leading north american jurisdictions less than a generation ago, we think it is reasonable to conclude that the $6,000 per capita gdp gap is unmet potential. so, as satisfying as it is to see our success against jurisdictions outside north america, we continue to believe that we can do better still.
Ontarians should not be complacentBut is this unmet potential simply an abstract economic measure? What does it have to do with the average ontarian?
a lot.
as we have seen in previous reports, if ontario were successful in achieving its prosperity potential, the average household in the province would see an increase in personal disposable income of $8,600. This would readily pay for many important consumer spending items or investments in their future. for example, the average ontario household with a mortgage pays $12,300 annually; the average renting household pays $8,500 in rent. The average household spends $4,200 on
0
10
20
30
40
50
60
$70
GDP per capita, C$ (2006) 1981–2006
’818th
$500
YearOntario rankProsperity lead / (gap)
’859th
($200)
’9012th
($1,500)
’9515th
($5,000)
’0014th
($6,300)
’0314th
($5,100)
’0515th
($5,500)
’0615th
($6,000)
000C$
Note: Currency converted at PPP; 1997 shows the break in the US method of calculating state-level GDP from SIC-based to NAICS-based; numbers are adjusted by provincial/state deflators. Source: Institute for Competitiveness & Prosperity analysis based on data from Statistics Canada, Provincial Economic Accounts (CANSIM Table 384-0002); US Department of Commerce, Bureau of Economic Analysis, National Income and Product Accounts.
Peer leader
Peer median
Ontario
Exhibit 3 The prosperity gap widened in 2006
path to the 2020 prosperity agenda 11
vacations and recreation. Those investing in post secondary education pay $4,600 in annual tuition. Those contributing to an rrsp invest about $4,000 annually. These expenses would be partially offset by the gain in our prosperity.
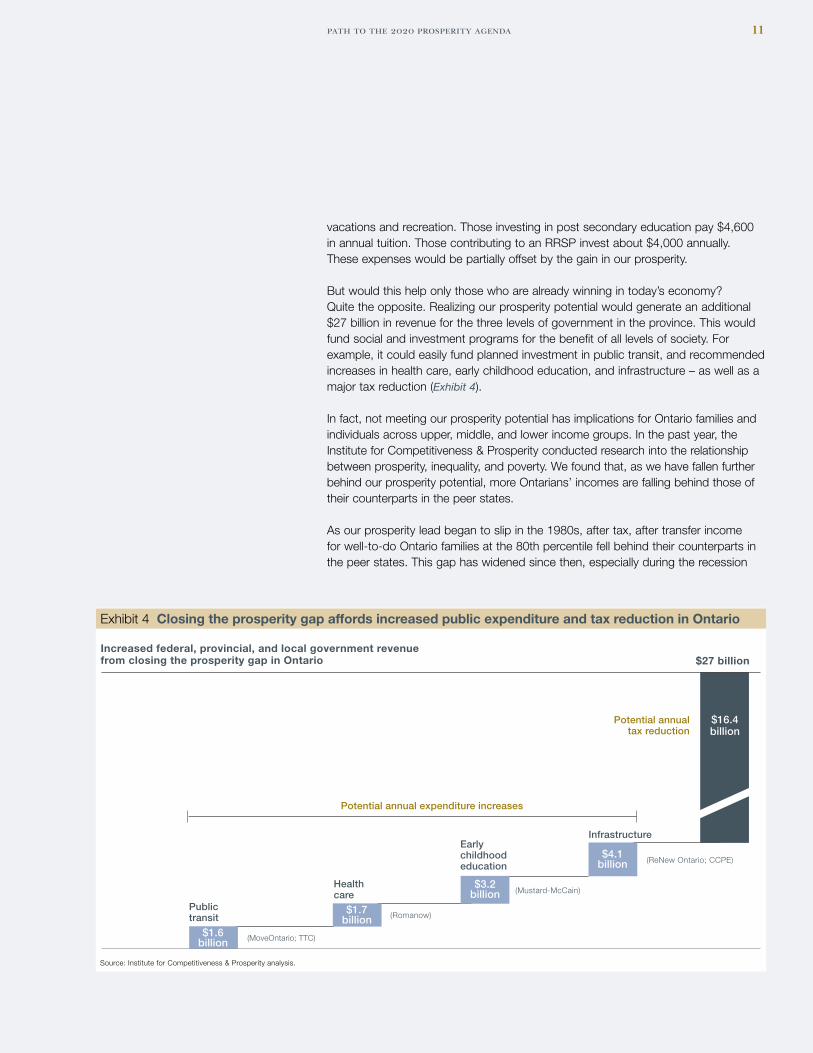
But would this help only those who are already winning in today’s economy? Quite the opposite. realizing our prosperity potential would generate an additional $27 billion in revenue for the three levels of government in the province. This would fund social and investment programs for the benefit of all levels of society. for example, it could easily fund planned investment in public transit, and recommended increases in health care, early childhood education, and infrastructure – as well as a major tax reduction (Exhibit 4).
in fact, not meeting our prosperity potential has implications for ontario families and individuals across upper, middle, and lower income groups. in the past year, the institute for competitiveness & prosperity conducted research into the relationship between prosperity, inequality, and poverty. We found that, as we have fallen further behind our prosperity potential, more ontarians’ incomes are falling behind those of their counterparts in the peer states.
as our prosperity lead began to slip in the 1980s, after tax, after transfer income for well-to-do ontario families at the 80th percentile fell behind their counterparts in the peer states. This gap has widened since then, especially during the recession
Infrastructure
(ReNew Ontario; CCPE)$4.1
billion
Increased federal, provincial, and local government revenue from closing the prosperity gap in Ontario
Potential annual expenditure increases
$27 billion
Publictransit
Healthcare
Earlychildhood education
Potential annualtax reduction
(MoveOntario; TTC)
(Romanow)
(Mustard-McCain)
$16.4 billion
$1.6 billion
$3.2billion
$1.7billion
Source: Institute for Competitiveness & Prosperity analysis.
Exhibit 4 Closing the prosperity gap affords increased public expenditure and tax reduction in Ontario

12 task force on competitiveness, productivity and economic progress
of the early 1990s (Exhibit 5). middle income ontario families did better than their peer state counterparts until 1990 when the growing prosperity gap caused them to fall behind. To be sure, the median in ontario has stayed close to the median in the peer states. But our growth has trailed us growth considerably.
Low income ontario families at the 20th percentile of family income, continue to out perform their counterparts in the peer states – but the margin is shrinking. in 1980, income for ontario families at the 20th percentile exceeded their peer state coun-terparts by $7,500 per family. in 2005, this lead had fallen to $3,500. it is a point of pride for canadians and ontarians that the structure of our economy, combined with our tax and transfer system, results in better outcomes for those at the bottom of the economic ladder. But we will be able to sustain this advantage and continue to protect the poorest ontario families only if we reverse current trends in relative average prosperity.
other research has shown the importance of realizing our prosperity potential for the economically vulnerable. in our research into hours worked, we found that a significant percentage of our labour force (relative to us peer states) worked on a part-time basis because they were unable to find full-time work. This was a more significant problem for less skilled ontarians. We found that this involuntary part-time gap was associated with sluggish economic performance.3
3 institute for competitiveness & prosperity, Working paper 9, Time on the job: Intensity and Ontario’s prosperity gap, september 2006.
After-tax income of economic families of 2 or more, by selected percentiles Ontario and peer states, 1980–2005
Note: US$ converted to C$ using the bilateral 2005 household consumption expenditure PPP.Source: Institute for Competitiveness & Prosperity based on data from Statistics Canada, National Income and Expenditure Accounts (CANSIM Table 380-0057), Survey of Labour and Income Dynamics (CANSIM Table 202-0604); US Department of Commerce, Bureau of the Census, Annual Social and Economic Supplement of the Current Population Survey.
14 peer states
Ontario
Prosperity gap (GDP per capita)
80th Percentile
Median
20th Percentile
Exhibit 5 Income in Ontario exceeds peer states at bottom of distribution; but this advantage has faded
1980 1985 1990 1995 2000 2005
000C$ (2005)
0
-20
20
40
60
80
100
$120
path to the 2020 prosperity agenda 13
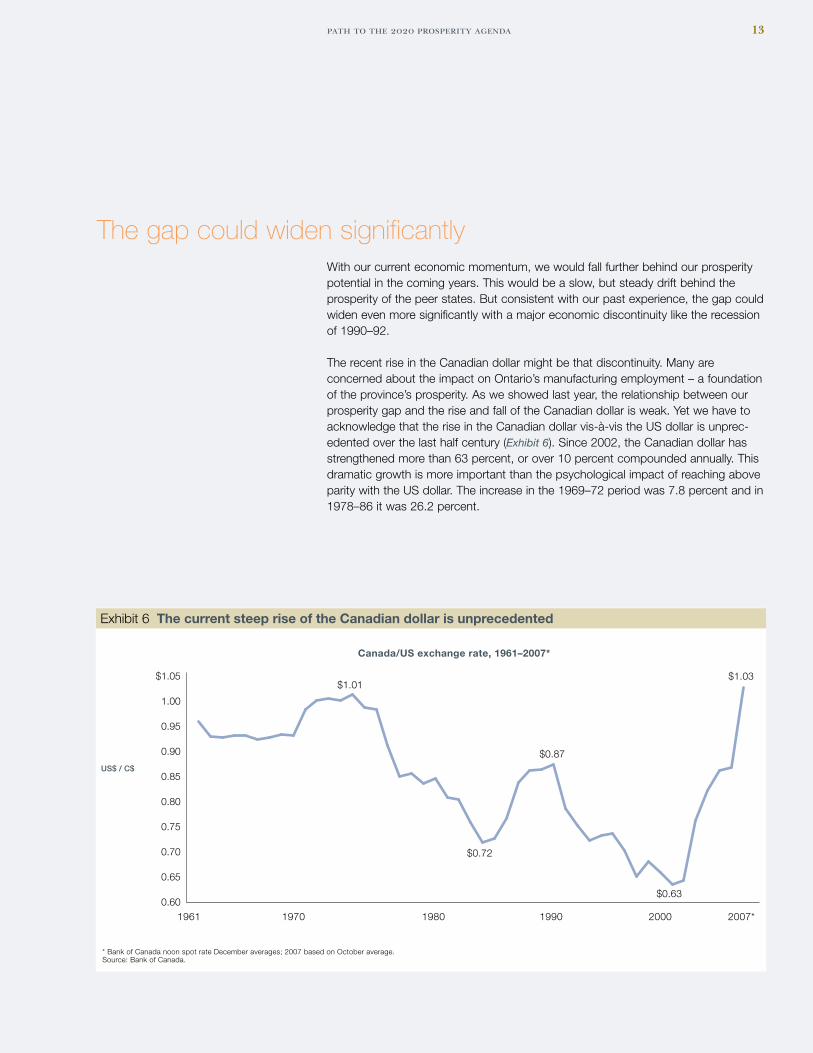
The gap could widen significantlyWith our current economic momentum, we would fall further behind our prosperity potential in the coming years. This would be a slow, but steady drift behind the prosperity of the peer states. But consistent with our past experience, the gap could widen even more significantly with a major economic discontinuity like the recession of 1990–92.
The recent rise in the canadian dollar might be that discontinuity. many are concerned about the impact on ontario’s manufacturing employment – a foundation of the province’s prosperity. as we showed last year, the relationship between our prosperity gap and the rise and fall of the canadian dollar is weak. yet we have to acknowledge that the rise in the canadian dollar vis-à-vis the us dollar is unprec-edented over the last half century (Exhibit 6). since 2002, the canadian dollar has strengthened more than 63 percent, or over 10 percent compounded annually. This dramatic growth is more important than the psychological impact of reaching above parity with the us dollar. The increase in the 1969–72 period was 7.8 percent and in 1978–86 it was 26.2 percent.
0.60
0.75
0.70
0.65
0.80
0.85
0.90
0.95
1.00
$1.05
Canada/US exchange rate, 1961–2007*
US$ / C$
* Bank of Canada noon spot rate December averages; 2007 based on October average. Source: Bank of Canada.
1961 1980 20001970 1990 2007*
Exhibit 6 The current steep rise of the Canadian dollar is unprecedented
$1.01
$0.72
$0.63
$1.03
$0.87

14 task force on competitiveness, productivity and economic progress
This rise of the canadian dollar shows that our economic environment can change suddenly. We need to ensure that our economy is as robust as possible to with-stand the buffeting winds of external forces. not achieving our current prosperity potential means we are vulnerable to downturns.
By our estimates the current trends in productivity and intensity could expand our prosperity gap from the current $6,000 per capita to more than $12,000 in constant dollars by 2020. But a recurrence of an adverse event like the 1990–92 recession could take the gap as high as $17,000.
A near term action plan is a step toward achieving Ontario’s 2020 Prosperity Agenda
in last year’s annual report, we set out the 2020 prosperity agenda as an approach for realizing our economic potential (Exhibit 7). The agenda is based on our aims – attitudes, investment, motivations, and structures – framework for analyzing the elements of that potential. By its nature, the long term perspective of the agenda means that it will take time to implement. in this year’s plan, we specify an action plan for the coming year as the government begins its new mandate. We think this constitutes a realistic set of items for the ontario government to continue its existing work or to initiate new avenues for activity.
Current Target 2020THE GOAL
Close the prosperity gap
15th in peer group in 2006
At the median – 8th by 2020
Attitudes
Investment
Motivations
Structures
Collective complacency
Consume today
Unwise taxation
Preserve status quo
Shared determination to close the gap
Invest for tomorrow’s prosperity
Smart taxation
Encourage creativity and growth
Exhibit 7 Ontario’s 2020 Prosperity Agenda closes the prosperity gap

path to the 2020 prosperity agenda 15
attitudes: accept the challenge; overcome complacency
public research conducted earlier this year indicates that canadians are concerned about whether future generations will enjoy a higher standard of living than we do. it also indicates that we do not want economic growth simply to match us results. However, a majority of ontarians agree that our unmet prosperity potential is a problem that requires action soon or even immediately. We encourage the premier and business, civic, and academic leaders to raise the profile of our unmet pros-perity potential with ontarians. We can no longer be complacent.
investment: focus on people and technology
a recurring theme from our work has been the need to step up our investments for future prosperity, and we are heartened by the increased expenditure on post secondary education in the government’s previous mandate. as well, in its new mandate, the government has committed to increasing spending on apprentice-ships. yet we need to ensure that education is adequately funded – over the past decade and a half, we have significantly shifted our public spending balance away from education toward health care. We encourage the government to continue its commitment to post secondary education overall.
But we also are suggesting that the government evaluate the balance between research and teaching in our universities. We are concerned that the public policy emphasis on research and development in our universities is coming at the expense of the quality of the student experience, as evidenced by student surveys and student to faculty ratios. universities contribute to innovation and prosperity not simply by doing research, but also by educating and training our future scientists, managers, and citizens. as we acknowledge in this report, our latest research is indicative, not conclusive – but we think it is worth understanding whether or not we have the right balance between research and time spent teaching students.

16 task force on competitiveness, productivity and economic progress
We also urge the government to ensure that its current investments in reducing poverty are as productive as they can be. in the past year, we deepened our understanding of the relationship between overall prosperity and inequality and poverty. We were struck by the incidence of poverty among some specific groups – high school dropouts, recent immigrants, lone parents, the disabled, unattached individuals, and aboriginals. These groups account for a significant percentage of low income ontarians; each has its own poverty challenges. We encourage the government to review its current poverty agenda to ensure that it has the appropriate balance between general and targeted programs.
motivations: pursue smarter taxation
ontario’s tax regime is one of the least conducive to business investment in the developed world. We renew our call for immediate elimination of the capital tax, now scheduled for elimination by 2010. We urge the government to pursue as quickly as possible the conversion of the provincial sales tax to a value added tax and harmonizing it with the federal gsT. a value added tax is the most conducive to investment and prosperity. The federal government’s reduction of the gsT to 5 percent in its recent economic update is an unwise move. The provincial government can mitigate some of the harm it will do to investment and job creation by harmonization. The ontario government also needs to evaluate the impact of its corporate income tax rates. Work done by international tax expert, Jack mintz, indicates that a reduction in these rates would actually increase tax revenue through greater business activity and international tax planning by corporations. This should be pursued further.
on the personal side, we continue to urge the federal and provincial governments to find ways to reduce the high effective marginal tax rates faced by lower income ontarians. ontario should assess the benefits of the federal Working income Tax Benefit for the working poor in ontario.

path to the 2020 prosperity agenda 17
structures: place a premium on creativity and innovation
We see two priorities early in the new mandate for strengthening market structures for innovation and prosperity in ontario.
first, we encourage the ongoing assessment of the importance of management capabilities in our innovation policy. We conclude that successful innovation comes from the interaction of both general and specialized support and competitive pres-sure. We need to ensure that we continue to produce qualified scientists and engineers, as well as publicly support research and development. and we need to ensure that we are building the sophistication of our management cadre. The current strategy of the ministry of research and innovation recognizes the impor-tance of a “culture of commerce” for innovation. We urge it to continue assessing the importance of management education and research.
second, we encourage the province to find ways to increase competitive pressure. our work in the financial services clusters this year identified the negative impact of our regulatory framework. This is a federal jurisdiction, but because of its importance to ontario, we recommend that the government increase its focus on the impor-tance of this sector to ontario’s prosperity – as is currently underway at the ministry of economic development and Trade.
We do not, however, want the government to change its policy in the area of Labour sponsored investment funds. it has committed to ending their special tax treatment by the 2010 tax year. We expect there will be pressure from some quar-ters to reconsider this, based on the argument that we need more venture capital. ontario’s priority has to be to raise the quality of venture capital – and prolonging the unsuccessful experiment with Lsifs would detract from that.
ontarians live in one of the most prosperous and dynamic economies in the world. This is the legacy of previous generations and the fruits of our own efforts today. but if we want to ensure our children inherit an economy that is thriving – not just surviving – in a global setting, we need to accept the challenges of meeting our prosperity potential. The 2020 prosperity agenda is aggressive. We should start on it now.


path to the 2020 prosperity agenda 19
Missing our prosperity potential is a lost opportunity for all Ontarians
in carrying ouT iTs mandaTe to measure and monitor ontario’s competitiveness and prosperity, the Task force has focused on gross domestic product (gdp) per capita as the summary measure of success. it is important to note that gdp represents the value added to our endowed base of human, physical, and natural resources. The value we add is driven by our ability to develop and produce products and services that others want to buy – here in ontario, across canada, and around the world. prosperity can be raised by expending more labour effort to increase the goods and services produced in ontario. it can also be raised by being more productive. productivity growth comes about by finding more efficient ways to produce the same amount of goods and services with the same effort; or by creating higher value added products, services, and features for which consumers will pay higher prices.
gdp is an imperfect measure. it does not measure quality of life or happiness. it focuses strictly on things that can have a dollar value attached to them. and it does not place a value on leisure time.
But it is useful to the extent that a more prosperous economy creates the opportunity for greater quality of life through better health, increased life expectancy, and literacy. and, as long as we maintain the perspective that our focus is on competitiveness and prosperity – which are by nature economic concepts – we conclude that gdp per capita is a sound measure of economic results.
as we have seen, outside of north america, only three regions have greater prosperity per capita than ontario (see Exhibit 1). But closer to home we continue to trail our north american counterparts considerably. Within our peer group of the sixteen north american jurisdictions that have half ontario’s 12.5 million population or more, ontario stands fifteenth, trailing all four teen us peer states and ahead of only Québec (see Exhibit 2).
The prosperity gap
20 task force on competitiveness, productivity and economic progress
ontario’s prosperity gap did not exist twenty years ago when we held a middle position among these highly competitive and prosperous jurisdic-tions. starting with 1990–92 recession, ontario began to fall behind the peer states, and we have not been able to resume our earlier standing (see exhibit 3). This prosperity gap matters to ontarians. it represents lost potential for our residents to gain economic secu-rity and well being and for our public institu tions to provide services and investments for future prosperity.
lagging intensity and productivity remain the biggest hurdles
To understand the reasons behind our prosperity gap with the peer jurisdic-tions, we draw on the same framework we have used in our previous reports.
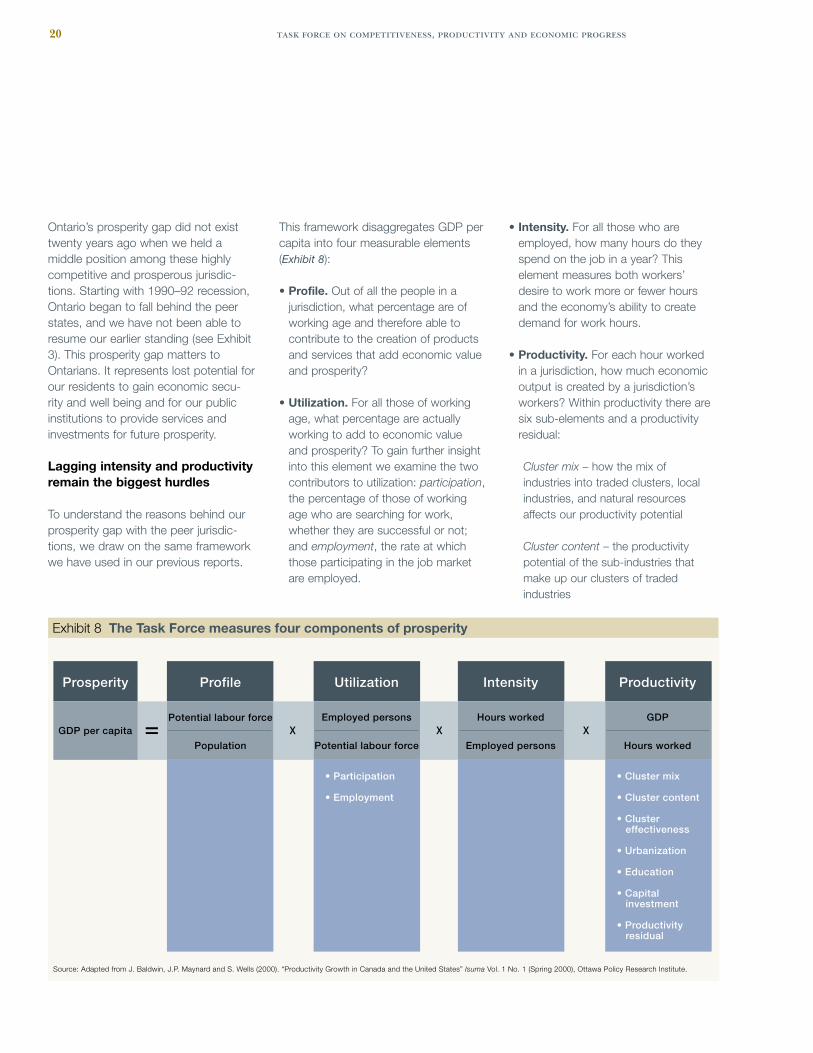
This framework disaggregates gdp per capita into four measurable elements (Exhibit 8):
• Profile. out of all the people in a jurisdiction, what percentage are of working age and therefore able to contribute to the creation of products and services that add economic value and prosperity?
• Utilization. for all those of working age, what percentage are actually working to add to economic value and prosperity? To gain further insight into this element we examine the two contributors to utilization: participation, the percentage of those of working age who are searching for work, whether they are successful or not; and employment, the rate at which those participating in the job market are employed.
• Intensity. for all those who are employed, how many hours do they spend on the job in a year? This element measures both workers’ desire to work more or fewer hours and the economy’s ability to create demand for work hours.
• Productivity. for each hour worked in a jurisdiction, how much economic output is created by a jurisdiction’s workers? Within productivity there are six sub-elements and a productivity residual:
Cluster mix – how the mix of industries into traded clusters, local industries, and natural resources affects our productivity potential
Cluster content – the productivity potential of the sub-industries that make up our clusters of traded industries
Source: Adapted from J. Baldwin, J.P. Maynard and S. Wells (2000). “Productivity Growth in Canada and the United States” Isuma Vol. 1 No. 1 (Spring 2000), Ottawa Policy Research Institute.
GDP per capita
Population
Potential labour force
Potential labour force
Employed persons
Employed persons
Hours worked
Hours worked
GDP
effectiveness
investment
residual
Prosperity Profile Intensity Productivity
Exhibit 8 The Task Force measures four components of prosperity

path to the 2020 prosperity agenda 21
Cluster effectiveness – how well our clusters of traded industries compete
Urbanization – the proportion of our population that lives in urban areas, which typically increases a jurisdic-tion’s productivity
Education – the educational attain-ment of our population and its impact on productivity
Capital investment – the degree to which physical capital supports our workers’ productivity
Productivity residual – a residual value that relates to productivity but remains unexplained.
note that the first three factors – profile, utilization, and intensity – add up to our
labour effort, or the hours worked per capita. That captures the human effort ontarians are expending to create economic value. The fourth factor – productivity – measures how effec tively our labour efforts turn resources into economic value and prosperity. ontario’s divergence from the prosperity performance of our peer states occurred during the reces sion of the early 1990s. during that time the key factor driving our economic weakness was labour effort, especially utilization and its two sub-elements, participation and employment. since 1995, we have been successfully recov ering to 1990 performance levels. But, at the same time, a growing productivity gap has emerged relative to the peer states. if we are to close the prosperity gap, a prosperity agenda has to be a priority for all stakeholders.
ontario has mixed labour effort performanceontario continues to have a demo-graphic profile advantage versus the peer states, an advantage in utilization, but a significant intensity gap (Exhibit 9).
Profile remains an advantage for Ontario. The first factor in a jurisdic-tion’s prosperity creation potential is its demographics. The percentage of the population that is of working age – aged 15 to 64 – is a base for prosperity. With more people in that age range, a higher percentage of the population can work and create economic value. in ontario, this ratio has been stable over the short run and has had no appreciable impact on changes in our prosperity gap versus our peer states. nevertheless, it does create an ongoing starting advantage in ontario’s prosperity.
$49,900$1,200 $1,200
$300$4,000
$2,400 $400
$2,400$1,500
$1,000 $800 $1,200
$43,900
Median GDPper capita
Profile Participation Employment Intensity Clustermix
Clustercontent
Clustereffectiveness
Urbanization Education Capitalinvestment
Productivityresidual
Ontario’sCurrent GDP
per capita(88% ofmedian)Profile Utilization Intensity Productivity
$1,900 $4,100
Elements of GDP per capita, C$ (2006)
Note: Currency converted at PPP; median of 16 peer jurisdictions.Source: Institute for Competitiveness & Prosperity analysis based on data from Statistics Canada; US Department of Commerce, Bureau of Economic Analysis.
Prosperity Gap$6,000 or 12% of
median GDP per capita
Exhibit 9 Productivity and intensity are the main sources of Ontario’s prosperity gap

22 task force on competitiveness, productivity and economic progress
in 2006, 69.2 percent of ontarians were aged 15 to 64. among the peer jurisdictions, only Québec has a higher percentage of working age popula-tion. all fourteen peer states have a smaller percentage. relative to the 67.5 percent median of the sixteen peer jurisdictions, ontario has a 2.4 percent potential profile advantage.4 Holding all other factors constant, we calculate this advantage to be worth $1,200 in per capita gdp. in other words, because we have a higher proportion of our population able to add to our prosperity, we have a profile advantage versus our peer jurisdictions worth about $1,200 to our prosperity (see Exhibit 9).
as we discussed in our fourth annual report, demographic projections indi-cate that the proportion of ontarians of working age will decline over the coming decades as baby boomers retire and are not being replaced by equal numbers in subsequent genera-tions. still, the projections indicate that ontario will maintain its advantage versus its peers.
5
nevertheless, ontario will have fewer workers to create prosperity in the coming years. We estimate that by 2025 the smaller percentage of working aged ontarians will reduce gdp per capita potential by $2,300.
6 as we
discussed in our Working paper on intensity, we will need creative retire-ment solutions to address this decline in our prosperity potential.
7
Ontario utilization out performs peers. as we discussed in the 2005 annual report, ontario successfully reversed a decline in its utilization of its working aged population during the latter part of the 1990s.
in 1990, ontario led all its peers in participation. ontarians were more eager to work than people in any other state or province in its peer group. However, through the 1990–92 reces-sion and continuing until 1995, ontario’s participation rate plunged dramatically. By 1995, ontario’s participation rate ranked eleventh among the sixteen peers. clearly, the economic weak-ness of the early 1990s created many discouraged workers – people who simply stopped looking for work and were no longer recorded as participants in the labour force. as economic condi-tions improved, more adult ontarians rejoined the labour force, contributing to our economic potential. The province’s participation rate increased every year until 2003, when ontario once again ranked first among the peers. in 2006, 66.0 percent of ontarians 15 years of age and older
8 worked or sought work.
among the peer jurisdictions we ranked second to ohio. The median partici-pation rate was 64.4 percent. This 1.6 percent advantage translates into $1,200 in gdp per capita.
in the other component of utilization, employment, ontario has traditionally trailed its peers, but the gap versus the peer median accounts for only a small part of our prosperity gap. as with participation, the 1990–92 recession adversely affected ontario’s unem ploy-ment rate, which increased both on an absolute basis and relative to that in our peer jurisdictions. in 1990, before the recession, 94.3 percent of ontarians in the labour force held jobs, just above the 94.2 percent rate for the median peer jurisdiction. By 1993, ontario’s employment rate fell to 89.8 percent – that is, the unemployment rate reached 10.2 percent – while the rate in the median peer state was 92.7 percent.
from that point, ontario’s unemploy-ment rate trended down. By 2006, 94.4 percent of the ontario labour force was employed – 0.6 percentage points lower than the median of the peer juris-dictions. This cost us $300 in lower gdp per capita in 2006.
The combined effect of more discouraged workers and increased unemployment in the first half of the 1990s was a key driver of ontario’s growing prosperity gap during those years. Beginning in 1995, ontario successfully increased the utilization of its human capital; by 2006, ontario employed 62.3 percent of its working age population, ranking fourth among the sixteen peer jurisdictions and above the peer median of 61.0 percent. This superior performance translates to a $900 utilization advantage (the net effect of a $1,200 participation advantage and a $300 employment disadvantage) in gdp per capita.
Intensity is a significant part of our prosperity gap. While ontario out performs the peer states in profile and utilization, we have a significant intensity gap – our workers work fewer hours in a year than their counterparts in the peer states. in 2006, the average ontario worker worked 1,704 hours while in the median of the peer states the average worker worked 1,865 hours. This gap of 161 hours, or 4.3 weeks annually, widened from 2005 when ontario trailed the peer median by 137 hours weekly or 3.7 weeks. consequently, the impor-tance of intensity on ontario’s prosperity gap grew from $3,400 in 2005 to $4,000 in 2006, almost as much as our productivity gap of $4,100.
Last year, the institute conducted signifi-cant research into differ ences in intensity between ontario workers and their
4 calculated as [1 minus (67.5 (peers) / 69.2 (ontario))] = 2.4 percent.5 fourth annual report, Rebalancing priorities for Ontario’s prosperity, november 2005, p. 29.6 This comparison is between ontario’s gdp per capita in 2005 and its potential in 2025; not the difference between ontario and its peer group.7 Working paper 9, Time on the job, september 2006 ,p. 21.8 Labour statistics base participation, unemployment, and hours estimates on all workers including those who are 65+; we follow this convention for utilization and intensity.

path to the 2020 prosperity agenda 23
counterparts in the peer states.9 We
found that half of the intensity gap is due to more weeks of vacation taken by ontario workers and half is due to fewer hours worked when workers are on the job. Within this shorter work week, we found that the largest component, about half, was the result of more ontarians working part time. This gap, in turn, was due to an inability of our part-time employees to find full-time work. fully 32 percent of part-time workers in ontario over the 1997–2004 period indi-cated that they worked part-time because they could not find full-time work. across the peer states this pro-portion was only 16 percent. much of our intensity gap reflects the desires of ontarians to take more vacation, which is a preference, not a weakness.
10 But
nearly a quarter of the gap is because our economy does not create adequate opportunities for full-time work.
productivity continues to be the key to closing ontario’s prosperity gapas we have seen, in the three labour effort factors, ontario’s advantage in the percentage of our population of working age has strengthened slightly, and we have made remarkable progress in the percentage of ontarians who are working. still, differences in the number of hours worked continue to be a major contributor to our prosperity gap. even with the overall gains in utilization, our prosperity gap persists (Exhibit 10). over the last decade, productivity has accounted for the greatest share of the prosperity gap with our peers. in the last three years, our productivity gap has closed very slightly. However, both intensity and utilization have fallen back versus the peer states. The net effect is a widening of the prosperity gap.
We assess the six sub-elements of productivity to determine the impact of this key driver of our prosperity gap.
Cluster mix and cluster content contribute positively to our productivity. The Task force continues to conclude that ontario benefits from a good cluster mix of traded industries
11
that are typically concen trated in specific geographic areas and sell to markets beyond their local region. research by michael porter of the Harvard-based institute for strategy and competitiveness has shown that clus-ters of traded industries increase productivity and innovation. in addition, the presence of clusters in a region has a spillover effect, in that they typically generate opportunities for increased success of the local economy.
9 Working paper 9, Time on the job, september 2006.10 Ibid. p. 34.11 institute for competitiveness & prosperity, Working paper 1, A View of Ontario: Ontario’s clusters of innovation, april 2002 and Working paper 5, Strengthening structures: Upgrading specialized support
and competitive pressure, July 2004.
-10,000
-8,000
-6,000
-4,000
-2,000
0
2,000
$4,000
Profile lead
Prosperitylead*
Prosperitygap*
Utilization lead/gap
Intensity gap
Productivity gap
Prosperity gap
Decomposition of prosperity gap, C$ (2006)1981–2006
* Versus median of 16 jurisdictions Note: 1997 shows the break in US method of calculating state-level GDP from SIC-based to NAICS-based; currency converted at PPP. Source: Institute for Competitiveness & Prosperity analysis based on data from Statistics Canada; US Department of Commerce, Bureau of Economic Analysis; US Department of Labor, Bureau of Labor Statistics; US Census Bureau; and OECD.
200620001995199019851981
Exhibit 10 Growing productivity and intensity gaps have driven the prosperity gap
C$

24 task force on competitiveness, productivity and economic progress
Prosperity and productivity lag in ontario cities
Urbanization is a significant factor in a region’s productivity and prosperity. As we have seen, the percentage of Ontario’s population living in metropolitan areas lags the rate in the peer states, and this is part of our prosperity gap.
New JerseyMassachusetts
New YorkVirginiaIllinois
CaliforniaPennsylvania
AverageFlorida
MichiganTexasOhio
North CarolinaGeorgiaIndianaOntarioQuébec
Urban GDP per capita, C$ (2005)
$61,200
$44,800
$51,400
0 10 20 30 40 50 60 $70000 C$
$40,700
$40,900
$39,100
IndianaNew York
OntarioPennsylvania
North CarolinaIllinois
MichiganOhio
AverageVirginia
TexasFlorida
GeorgiaQuébec
Rural GDP per capita, C$ (2005)
Note: Currency converted at PPP; “urban” refers to metropolitan areas; “rural” refers to non-metropolitan areas.Source: Insitute for Competitiveness & Prosperity analysis based on data from Statistics Canada, Income Trends in Canada, 1980-2005, May 2007; US Bureau of Economic Analysis, Regional Economic Accounts.
Exhibit A Ontario’s prosperity gap is centred in our urban areas

path to the 2020 prosperity agenda 25
out of 53. Inside North America, Toronto trails all 23 US cities and exceeds Montreal and Vancouver, the only other two Canadian cities on the list. And as with Ontario experience, Toronto’s challenge is lagging productivity. Hours worked per capita in the Toronto CMA are higher than in nearly every other large city region around the world. But Toronto is less productive than cities in most of the developed world.
GDP per capita in Ontario’s metropol-itan areas trails that in the peer states considerably, while outside the metro-politan areas, Ontario is actually one of the more prosperous jurisdictions (Exhibit A).
This is consistent with our research in other areas. The productivity and wage premiums for highly educated people are higher in cities, and the impact of our lower educational attainment returns is experienced more in urban areas. In
addition, the distribution of income is much flatter in Ontario than in the peer states which is consistent with smaller differences between rural and urban economic performance.
Internationally, our largest metropolitan area, Toronto, is in the middle of the global pack in GDP per capita – it ranks 36th out of the largest 78 global metro-politan areas (Exhibit B). As with Ontario, Toronto does well against city regions outside North America – ranking 13th
* Toronto, Montreal, Vancouver Note: Labour productivity defined as GDP per worker, not GDP per hour worked; currency converted at PPP. Source: Institute for Competitiveness & Prosperity analysis based on data from OECD Territorial Reviews, Competitive Cities in the Global Economy; Statistics Canada, Labour Force Survey (CANSIM Table 282-0053), Estimates of Population (CANSIM Table 051-0036); Bureau of Labor Statistics, Current Population Survey.
Canadian Cities (3)*
Australia,New Zealand (3)
Global Average (78)
Toronto CMA
Europe (35)
Middle East, Asia,Latin America (14)
US Cities (23)
Canadian Cities (3)*
Australia,New Zealand (3)
Global Average (78)
Toronto CMA
Europe (35)
Middle East, Asia,Latin America (14)
US Cities (23)
$117,700
$80,200
$80,400
$84,600
$75,400
$84,700
$57,000
ProductivityGDP per worker, C$ (2004)
52.2%
46.3%
50.1%
51.5%
44.3%
44.7%
50.0%
Labour effort% of population working
Canadian Cities (3)*
Australia,New Zealand (3)
Global Average (78)
Toronto CMA
Europe (35)
Middle East, Asia,Latin America (14)
US Cities (23) $58,800
$41,900
$40,300
$39,100
$38,800
$37,500
$25,500
ProsperityGDP per capita, C$ (2004)
Exhibit B Toronto’s productivity lags city regions globally
26 task force on competitiveness, productivity and economic progress
drawing on porter’s methodology, the institute has determined that fully 39.8 percent of employment in ontario is in traded industries versus 31.4 percent in the peer jurisdictions. ontario’s employ ment strength in finan-cial services, automotive, metal manufacturing, publishing and printing, and others has created an attractive mix of traded industries. our analysis of ontario’s cluster mix indicates a $2,400 per capita advantage over our peers. This benefit is derived from a higher output than would be likely if ontario’s mix were the same as the peers’ mix.
12
in the sub-clusters that make up each cluster of traded industries,
13 there are
also wage and productivity differences. as we compare these with those in the peer states, we conclude that our cluster content creates a $400 advan-tage for ontario.
Cluster under performance is a significant part of Ontario’s produc tivity gap. While ontario has excellent cluster mix and content, cluster effec tiveness is much lower than in the peer states. in ontario and the peer states, traded clusters are more productive than local industries, as represented by wages. in ontario, the productivity premium is 46.7 percent.
14
But across the peer states, the median produc tivity premium is 63.3 percent. Taking the prevailing wage in local industries as a given, our clusters are under performing their counterparts in the us peers by 11.3 percent (the difference in the peer performance index of 1.63 versus ontario’s 1.47).
porter has observed that greater competitive intensity comes from sophisticated customers and vigorous rivals. in addition, specialized support from excellent factor conditions, capable suppliers, and related indus tries pushes productivity higher in traded clusters. as we discussed in our 2004 annual report,
15 our structures of specialized
support and competitive pressure are inadequate relative to the experience in clusters of traded indus tries in the peer states.
if ontario clusters were as effective as us clusters, wages would be $5,700 per worker higher. as traded clusters account for 39.8 percent of ontario employment and given the relationship between wages and productivity, our overall productivity would rise by 6.4 percent.
16 from this, we estimate the
productivity loss from our weaker clus-ters to be $2,400 per capita.
adding together the effects of cluster mix (+$2,400), content (+$400), and effectiveness (-$2,400) ontario’s clus ters provide a net benefit of $400 in gdp per capita versus the peer states.
Relatively low urbanization is a signifi cant contributor to our produc-tivity and prosperity gap. in our work, we have established the higher level of productivity that results from greater rates of urbanization. This is the result of the increased social and economic interaction of people in firms in metro-politan areas, the cost advantages of larger scale markets, and a more diversified pool of skilled labour. The interplay of these factors promotes innovation and growth in an economy.
since fewer people in ontario live in metropolitan areas than in the peer states, our relative productivity and prosperity potential are reduced (see Prosperity and productivity lag in Ontario cities). our analysis this year indicates that we have a $1,500 per capita disadvantage against the peer median related to our lower level of urbanization.
17 note that this disadvan-
tage is much lower than what we have found in previous reports – for example, our estimate in last year’s annual report was $2,900. The difference is the result of the addition by statistics canada of three new census metropolitan areas in ontario based on the 2006 census. These are Barrie, Brantford, and peterborough. The addition of these three cities raises the percentage of ontario’s population living in metro-politan areas from 74.4 to 78.9 percent. it should be noted that the improvement we report is due more to better data than to a performance improvement. in other words, we have been over stating ontario’s urbanization disadvantage in previous years. But this is unavoid-able given the way statistical agencies update lists of cmas in canada and metropolitan statistical areas in the united states.
Lower educational attainment weakens our productivity. economists agree that a better educated workforce will be more productive. education increases workers’ base level of knowledge necessary for improved job performance. it increases workers’ flex-ibility so that they are able to gain new skills throughout their lifetime. many studies show the increased wages that accrue to more highly educated individ-uals.
18 and higher wages are the result
12 it is important to note that our measure focuses on the mix of industries only. it calculates the productivity performance we could expect in ontario if each cluster were as productive as its us counterpart. it does not measure the effectiveness of each cluster in ontario.
13 Working paper 1, A View of Ontario, april 2002, pp. 18-20.14 Working paper 5, Strengthening structures, July 2004, p. 26.15 Third annual report, Realizing our prosperity potential, november 2004, pp. 40-48.16 We have netted out the effects of ontario’s lower urbanization, our under investment in capital, and our lower educational attainment in this calculation.17 first annual report, Closing the prosperity gap, november 2002, p. 26 for a discussion of our methodology in measuring the productivity disadvantage resulting from our lower rate of urbanization.18 for example, see ana W. ferrer and W. craig riddell, “The role of credentials in the canadian Labour market,” Canadian Journal of Economics, 2002 vol. 35, no.4 and
statistics canada, “education and earnings,” Perspectives on Labour and Income, 2006 vol. 38, no. 03.
path to the 2020 prosperity agenda 27
19 capital investment results are not available at the state level. our analysis uses us results to estimate peer state investments and compares these to ontario.20 annual report 5, Agenda for our prosperity, pp. 34-35. see also andrew sharpe, “What explains the canada-us icT investment intensity gap?” centre for the study of the Living standards,
december 2005.21 fifth annual report, Agenda for our prosperity, p. 20.
of higher productivity (see Exhibit D in Why productivity is important for our prosperity). ontario’s population has, on average, a lower level of educational attainment compared to those living in the peer states, particularly at the university graduate level. adjusting the mix of educational attainment in ontario to match the us mix and holding wages constant at each attainment level, ontario’s productivity would be higher by $1,000 per capita.
Under investment in capital lowers productivity. ontario businesses have under invested in machinery, equip-ment, and software relative to their counterparts in the united states
19
so that the capital base that supports workers in ontario is not as modern as that of their counterparts in the peer states. as a result, ontario workers are not as productive. We estimate this under investment in capital equipment lowers ontario’s productivity by $800 per capita. This estimate is based on our simulation of ontario gdp if we had matched the rate at which the us private sector invested in machinery, equipment, and software. for our esti-mate, we assumed that higher growth in this investment would trans late directly into higher growth in gdp. The primary source of this capital investment gap is in information and communications technology (icT). canada’s businesses invest about a third less per dollar of gdp in icT and slightly more in non-icT machinery, equipment, and software.
20
The residual is related to productivity. We have been able to account for the impact of profile, utilization, and intensity on prosperity. We have also accounted
for the effects of several elements of productivity. The $1,200 per capita gap that remains is related to productivity on the basis of like-to-like cluster mix and strength, urbanization, education, and capital intensity
productivity gap continues to be important
as we have seen, through most of the 1980s ontario’s prosperity was close to the median of the peer states. during that period, we had a productivity and intensity disadvantage versus our peers – but our utilization advantage compen-sated for this. our prosperity gap began to develop at the outset of the 1990–92 recession. it was driven mostly by our poor utilization performance – both participation and employment worsened significantly with the recession. our utilization problem began to dissipate around 1997 and by 2001 it was an advantage again. However, our produc-tivity disadvantage began to grow in 1995 and by 2005 it had more than doubled. since that time, it has essen-tially held steady. at the same time, our inten sity gap has continued to widen and contribute to the prosperity gap.
in summary, against our north american peers, ontario has a wide and growing prosperity gap; sluggish productivity growth is a critical reason we are not realizing our prosperity potential. as we broaden our perspective beyond north america, we see that ontario has a prosperity lead, but we still lag in productivity.
ontario’s prosperity compares well globally, though productivity still trails
in previous annual reports, we have compared ontario’s prosperity to the four motors, a group of prosperous european regions that collaborate in cultural and economic spheres to enhance their competitiveness and quality of life. ontario’s prosperity as measured by gdp per capita has compared well to these leading regions.
21
This year the institute expanded its international peer group to include all regions with half of ontario’s popula-tion or greater – similar to our criterion for identifying north american peers. few regions are like canadian prov-inces and us states in that they are part of a federal state and have their own economic policy levers, including a wide range of tax powers and spending responsibilities. australia’s states and germany’s Länder are the only ones that closely resemble north american provinces and states. many countries with developed economies – such as the united kingdom, Japan, and france – are unitary states with little economic control exerted by regions. in most countries, we took their formal structure (e.g., france and departments, italy and regions, etc.) as the peers for analysis. in Japan, we relied on oecd divisions, which combined prefectures, as several of these were city based, into regions. However, we have only included the two largest, kanto, which includes Tokyo, and kinki, which includes osaka. These two make up more than 50 percent of Japan’s population. including all regions would add five other regions, all with

28 task force on competitiveness, productivity and economic progress
gdp per capita less than ontario. in addition, some of the important data for Japan are only available at the national level.
We also removed jurisdictions that were essentially metropolitan areas. our rule was to exclude jurisdictions or regions whose density exceeded the Toronto census metropolitan area or where one city’s metropolitan population accounted for more than 65 percent of the state population – the highest ratio among the north american peer states (Boston and massachusetts). These filters excluded Île de france (paris) and greater London.
among the peer set of fifteen interna-tional regions, ontario stands fourth in gdp per capita (see Exhibit 1). it is fair
to say that we have built one of the most globally competitive jurisdictions here in ontario. However, just as we have found in comparisons with north american peers, ontario’s main chal-lenge is to improve its productivity. We are out performing international peers through more labour effort, but we trail the median of our international peers in productivity.
We compared ontario’s sources of prosperity with these international peers using the same waterfall approach we have developed for north american peer comparisons. data availability prevents us from providing the same level of detail, but we can compare ontario’s work effort – comprising demographic profile, utilization of adults in the work force, and intensity of hours worked
per worker – and productivity – the value created in the average hour of work effort (Exhibit 11). This interna-tional comparison indicates that lagging productivity is ontario’s challenge – we work more than those outside north america, but we are less successful at creating economic value in the hours we work.
ontario’s economy is one of the most successful in the world. our challenge is to build on this success to realize our full prosperity potential for the benefit of all ontarians.
-8,000
-6,000
-4,000
-2,000
0
2,000
4,000
$6,000
20052004200220001998
Prosperitylead*
Prosperitygap*
Utilization lead
Productivity gap
Profile gap/lead
Intensity leadProsperity lead
Decomposition of prosperity gap, C$ (2005)1998–2005
* Versus median of 15 world peer jurisdictions Note: Currency converted at PPP. Source: Institute for Competitiveness & Prosperity analysis based on data from Statistics Canada; Statistischen Ämter des Bundes und der Länder; Instituto Nacional de Estadística; Institut National de la Statistique et des Études; L’Istituto Nazionale di Statistica; Statistics Bureau of Japan; Statistics Belgium; UK Office for National Statistics; Australian Bureau of Statistics; Eurostat; OECD.
Exhibit 11 Over the past five years Ontario has maintained its prosperity lead over international peers
C$
path to the 2020 prosperity agenda 29
Why productivity is important for our prosperity
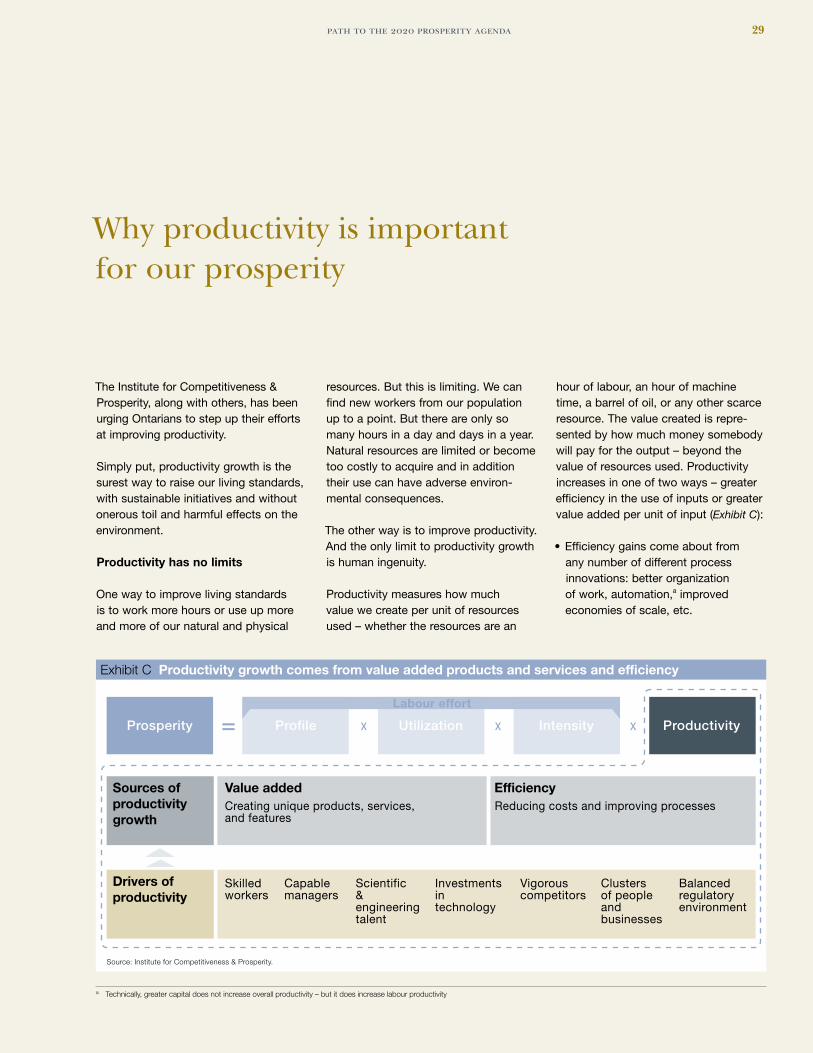
The Institute for Competitiveness & Prosperity, along with others, has been urging Ontarians to step up their efforts at improving productivity.
Simply put, productivity growth is the surest way to raise our living standards, with sustainable initiatives and without onerous toil and harmful effects on the environment.
productivity has no limits
One way to improve living standards is to work more hours or use up more and more of our natural and physical
resources. But this is limiting. We can find new workers from our population up to a point. But there are only so many hours in a day and days in a year. Natural resources are limited or become too costly to acquire and in addition their use can have adverse environ-mental consequences.
The other way is to improve productivity. And the only limit to productivity growth is human ingenuity.
Productivity measures how much value we create per unit of resources used – whether the resources are an
hour of labour, an hour of machine time, a barrel of oil, or any other scarce resource. The value created is repre-sented by how much money somebody will pay for the output – beyond the value of resources used. Productivity increases in one of two ways – greater efficiency in the use of inputs or greater value added per unit of input (Exhibit C):
•Efficiencygainscomeaboutfromany number of different process innovations: better organization of work, automation,a improved economies of scale, etc.
ProfileProsperity Utilization Intensity Productivity
Reducing costs and improving processesCreating unique products, services,and features
Sources of productivity growth
Drivers of productivity
Value added Efficiency
Skilledworkers
Capablemanagers
Scientific & engineeringtalent
Investments intechnology
Vigorouscompetitors
Clustersof people and businesses
Balancedregulatoryenvironment
Source: Institute for Competitiveness & Prosperity.
Labour effort
Exhibit C Productivity growth comes from value added products and services and efficiency
a Technically, greater capital does not increase overall productivity – but it does increase labour productivity

30 task force on competitiveness, productivity and economic progress
•Highervalueaddedcomesfromadding innovative unique product or service features for which consumers will pay more than the added cost to the producer.
Unfortunately, many people understand productivity improvements to come only from greater efficiency and this in turn is often associated with layoffs or outsourcing of work. But that is only one part of the productivity story. Equally,ifnotmoreimportant,istheproductivity growth from new value creation. Individuals and businesses, which add more value to resources through unique skills, products, and services, are more productive.
At the business level, which is the source of much a jurisdiction’s produc-tivity, strategies that successfully lead to products and services for which people will pay a premium will drive
regional productivity higher. An efficient auto assembly plant producing prod-ucts that require price incentives to stimulate consumer demand is not as productive as a facility producing cars that are in great demand at premium prices. The challenge for Ontario – and for all jurisdictions – is to create the environment in which management teams are developing breakthrough value added products and services.
Jurisdictions that attract and foster these individuals and businesses are more productive. For example, Ontario’s wine industry has become more produc-tive as it has moved to higher quality wines and introduced ice wine to the world, since producers can now charge more for products that consumers value more highly.
Princeton University economist Paul Krugman, summed up the importance
of productivity before the dramatic increase in US productivity in the late 1990s: “Productivity isn’t everything, but in the long run it is almost every-thing. A country’s ability to improve its standard of living over time depends almost entirely on its ability to raise its output per worker.”b
rising productivity has driven our past economic growth
At one time, as the Dallas Federal Reserve observes,c today’s developed economies were mostly agrarian and farmers manually worked the land and spread the seeds. Investment in machinery, such as tractors and threshers, and innovations, such as high yield seeds and new crop rota-tion methods, dramatically reduced the amount of work and workers needed to produce the same output of agricultural products. Farmers out of work headed
40
50
$60
Ontario
Québec
Indiana
Michigan
Ohio
Georgia
North Carolina
Virginia
CaliforniaNew Jersey
New York
Massachusetts
Texas
Illinois
Florida
900 100 110 120 130 140 150
Wages versus relative labour productivity,Ontario and North American peers, average 2001–06Average
wages
Note: Currency converted at PPP.Source: Institute for Competitiveness & Prosperity analysis based on data from Statistics Canada, Provincial Economic Accounts (CANSIM Table 384-0002), Labour Force Survey (CANSIM Tables 282-0072, 282-0018 & 282-0002); US Bureau of Economic Analysis, Regional Economic Accounts; US Bureau of Labor Statistics, Occupational Employment Statistics, Current Population Survey.
Pennsylvania
R2 = 0.84Relativelabourproductivity(Ontario = 100)
000 C$ (2006)
Exhibit D Higher productivity is associated with higher earnings
b paul krugman, The Age of Diminished Expectations, miT press, (1994).c federal reserve Bank of dallas, 2003 annual report, may 2004. available online at http://www.dallasfed.org/fed/annual/2003/ar03c.html
path to the 2020 prosperity agenda 31
d michael porter, “Building the microeconomic foundations of prosperity: findings from the Business competitiveness index,” The Global Competitiveness Report 2003-2004, World economic forum, p.31.
towards the urban centres, where many found jobs in newly emerging manu-facturing plants producing all sorts of consumer goods.
Eventually,technologicalandprocessinnovations occurred in all areas of manufacturing, and output increased faster than employment. Productivity gains were clear in the vast increases of output with the same amount of labour. Workers then moved on from their assembly line jobs to retail stores, food services, medicine, engineering, management, and other professional industries.
The greatest spikes in productivity have historically been associated with specific technological innovations. The steam engine, electricity, and assembly lines are among the most important technological innovations that have led to higher productivity growth. More recently computers and the internet have been associated with more productivity.
productivity growth benefits workers and consumers
Since most of the value created in an economy goes to workers in the form of wages, productivity growth means higher wages. The relation-ship between productivity and wages in Ontario, Québec, and the 14 peer states is very strong (Exhibit D).
Productivity also means more inno-vative and lower cost products and services available for every day use.
most economists agree on the drivers of productivity growth
While economists may differ on the relative importance of various contribu-tors to productivity growth, most agree on what the factors are:
•Skilled workers who can adapt quickly to changing circumstances – on the job and over time
•Capable managers adept at discern ing consumer desires, competitive weaknesses, and innovative ways of organizing opera-tions – and at implementing change
•Scientific and engineering talent that can achieve major breakthroughs and continuous improvements in products and processes
• Investments in technology that makes workers more effective and efficient
•Competitive pressure to spur innovation
•Clusters of people and businesses to stimulate co-operation, competition, and new ideas
•A balanced regulatory environment that meets the need for worker and consumer protection and for flexibility and responsiveness in resource allocation to the best opportunities for wealth creation.
productivity drives a jurisdiction’s competitiveness and standard of living
Competitiveness expert, Michael Porter, stresses the importance of productivity:
“To understand competitiveness, the starting point must be the underlying sources of prosperity. A nation’s standard of living is determined by the productivity of its economy, which is measured by the value of goods and services produced per unit of the nation’s human, capital, and natural resources. Productivity depends both on the value of a nation’s products and services, measured by the prices they can command in open markets, and the efficiency with which they can be produced.
True competitiveness, then, is measured by productivity. Productivity allows a nation to support high wages, a strong currency, and attractive returns to capital—and with them a high standard of living. Productivity is the goal…d
Productivity growth is clearly a fundamental measure of economic health. Ontario is currently on a troublesome trend of falling further and further behind its peers in productivity growth. Productivity accounts for the greatest share of our prosperity gap. This lost potential reduces opportunities for us all, as higher productivity is the key to raising living standards for all Ontarians.
Raising efficiency is one way to achieve higher productivity. But productivity breakthroughs are also achieved through innovation and upgrading to deliver higher value products and services. Ontarians need to drive greater innovation to create unique products and services that are world beating.


path to the 2020 prosperity agenda 33
AImS and prosperity
Tackling the 2020 Prosperity Agenda requires action on four fronts
our agenda for prosperity builds from the aims framework that guides our work. aims is built on an integrated set of four factors:
•Attitudes toward competitiveness, growth, and global excellence. our view is that an economy’s capacity for competitiveness is grounded in the attitudes of its stakeholders. To the extent that the public and business leaders believe in the importance of innovation and growth, they are more likely to take the actions to drive competitiveness and prosperity.
• Investments in education, machinery, research and development, and commercial ization. as businesses, individuals, and governments invest for future prosperity they will enhance productivity and prosperity.
•Motivations for hiring, working, and upgrading as a result of tax policies and government policies and programs. Taxes that discourage investment or labour will reduce the motivations for investing and upgrading.
•Structures of markets and institutions that encourage and assist upgrading and innovation. structures, in concert with motivations, form the environment in which attitudes are converted to actions and investments.
These four factors can create an ongoing reinforcing dynamic. When aims drives prosperity gains, each one of the four factors would be reinforced. in an economy of increasing prosperity, attitudes among business and govern ment leaders and the public would be more optimistic and welcoming of global competitiveness, innova-tion, and risk taking. given these positive attitudes and with the greater capacity for investment generated by prosperity, ontarians would invest more in machinery, equipment, and software and in education. motivations from taxation would be more positive, as governments would not see the need for raising tax rates. and greater economic prosperity would improve structures as more opportunities for
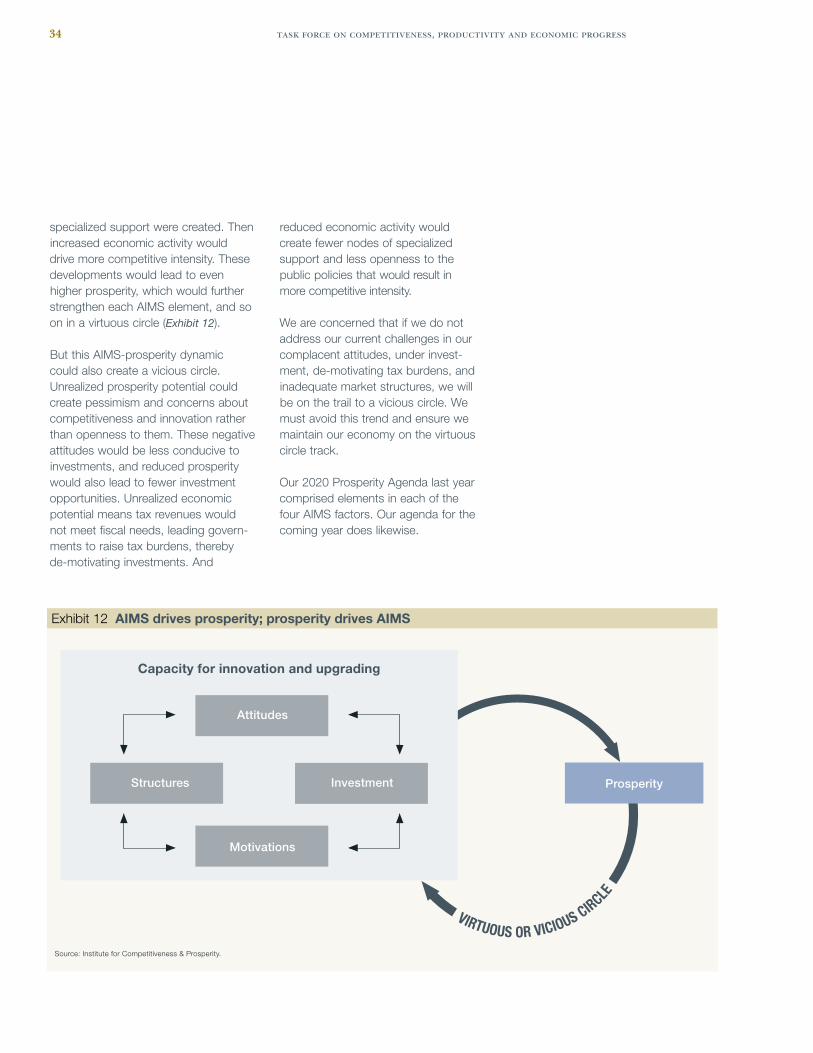
34 task force on competitiveness, productivity and economic progress
specialized support were created. Then increased economic activity would drive more competitive intensity. These developments would lead to even higher prosperity, which would further strengthen each aims element, and so on in a virtuous circle (Exhibit 12).
But this aims-prosperity dynamic could also create a vicious circle. unrealized prosperity potential could create pessimism and concerns about competitiveness and innova tion rather than openness to them. These negative attitudes would be less conducive to investments, and reduced prosperity would also lead to fewer investment opportunities. unrealized economic potential means tax revenues would not meet fiscal needs, leading govern-ments to raise tax burdens, thereby de-motivating investments. and
reduced economic activity would create fewer nodes of specialized support and less openness to the public policies that would result in more competitive intensity.
We are concerned that if we do not address our current challenges in our complacent attitudes, under invest-ment, de-motivating tax burdens, and inadequate market structures, we will be on the trail to a vicious circle. We must avoid this trend and ensure we maintain our economy on the virtuous circle track.
our 2020 prosperity agenda last year comprised elements in each of the four aims factors. our agenda for the coming year does likewise.
VIRTUOUS OR VICIOUS CIRCLE
Prosperity
Source: Institute for Competitiveness & Prosperity.
Attitudes
Structures Investment
Motivations
Capacity for innovation and upgrading
Exhibit 12 AIMS drives prosperity; prosperity drives AIMS

path to the 2020 prosperity agenda 35
in fact, more than three-quarters of respondents to the survey thought the average american has about the same (39 percent of respondents) or worse (39 percent) standard of living than the average canadian.
yet, while a majority of respondents agree that “i am able to afford a better standard of living than my parents” (57 percent agree versus 27 percent disagree), only a quarter agree that “the next generation will be able to afford a better standard of living than we do” (27 percent agree, 45 percent disagree).
ontarians tend not to feel strongly that our performance versus the us economy is of critical importance – 49 percent agree that “our lower standard of living, compared to the united states, is the price we pay for a better quality of life,” while 30 percent disagree. nearly half, 46 percent, agree that “canada’s economy is doing just fine; it doesn’t matter whether we are doing better or worse than the united states,” while 40 percent disagree.
even when informed about the pros-perity gap versus the united states, fully 55 percent of respondents saw it as either “just one of the many prob-lems government should address (39 percent) or “not really a problem”
(16 percent). To be sure 43 percent saw the prosperity gap as a significant (29 percent) or critical (14 percent) problem to be addressed.
However, these results change significantly when the impact of the prosperity gap on living standards and on government revenue is explained to respondents. The percentage seeing the prosperity gap as a more important problem rose from 43 to 61 percent, while the percentage seeing it as a less important problem fell from 55 to 37 percent (Exhibit 13).
additionally, more than three-quarters (78 percent) of ontario respondents agree that “it is a terrible waste for canadians to fail to make the most of the tremendous resources and oppor-tunities we enjoy in this country,” while only 8 percent disagree.
Views on taxation of business investment are ambiguous
ontarians are ambiguous on their views of business taxes. majorities of respondents agreed that:
• “Whengovernmentsincreasetaxesonbusiness, it’s consumers who end up paying more in the end” (78 percent agree, 11 percent disagree);
22 Working paper 3: Striking similarities: Attitudes and Ontario’s prosperity gap, september 2003.23 canadian survey results as presented at the institute’s march conference on canada’s prosperity. available online at http://www.competeprosper.ca/images/uploads/ICP_presentation_20070308_
Lyle.pdf
Attitudes: Accept the challenge; overcome complacencyMost Ontarians are not aware or worried about the prosperity gap with US peers, but they are concerned about the standard of living our children will enjoy; and they agree about the importance of living up to our potential.
in our preVious Work, we have determined that ontarians hold similar attitudes towards competitiveness, prosperity, risk taking, and innovation as their counterparts in peer states.
22
What we do not perceive is evidence of the importance of the prosperity gap and the benefits of realizing our pros-perity potential. recent research has confirmed this.
as part of the institute’s conference on canada’s prosperity last march, The innovative research group, a national public opinion research and strategy firm with offices in Toronto and vancouver, conducted an online survey among the members of its canada 20/20 panel between march 1 and 4. The study included 3,285 respondents across canada and 1,439 in ontario eligible for inclusion in the analysis.
23
several important observations emerged from the study.
We are more concerned about not achieving potential than the prosperity gap
The study confirmed that most ontarians tend not to be concerned about the widening prosperity gap with the united states. most respondents in ontario reported being satisfied with their current standard of living.

36 task force on competitiveness, productivity and economic progress
Many do not recognize problems of personal taxation for low income canadians
on the personal tax side, 64 percent of ontarians are unfamiliar with the term “welfare wall.” When respondents are informed that the term “refers to the challenge people on social assis-tance or welfare face when they take a low paying job and lose access to programs that help with housing, child care, prescription drugs, and education and training” and that “When someone leaves welfare to take a job, not only do they lose their welfare cheque, but all other programs as well,”
24 68 percent
see this as a problem requiring atten-tion (29 percent immediately and 39 percent soon), while only 27 percent see it as just one of many problems
governments should address and 5 percent do not really see it as a problem.
many are unwilling to shift government spending from consumption to investment
ontarians do not agree that governments need to adjust spending away from consumption and towards investment. solid majorities of respondents agree that “government investment in infrastructure, such as water systems and highways, is a critical requirement for a strong economy” (91 percent agreement) and
“government spending on education helps to generate additional economic growth in the long run” (88 percent agreement). However, 59 percent of respondents agreed with the statement
“when it comes to social issues like
24 This description is narrower than the problem we have pointed out with respect to high marginal tax rates for low income earners, but it is conceptually the same.
• “Ifweincreasetaxesonbusiness,canadian companies will be less able to compete with companies from other countries” (62 percent agree, 19 percent disagree).
ontarians view business taxation as a matter of fairness – fully 85 percent agree that “it is important for govern-ment to tax business so that they pay their fair share,” while only 7 percent disagree. and when presented with standard economic arguments about the impact of taxes on investment on job creation and investment, opinions are mixed with 49 percent agreeing that these arguments “raise some real concerns about the negative impact of business taxes,” and 41 percent seeing them as “just excuses for business to avoid paying their fair share of taxes.”
Do you think the fact that Canada has fallen behind the US in terms of economic growth is...
* excluding “Don't Know” Source: Innovative Research Group, Special Ontario Tabulations. Full report available online at www.competeprosper.ca/images/uploads/ICP_presentation_20070308_Lyle.pdf
A critical problem that requires immediate action
Before knowing benefit
A significant problem that needs to be dealt with soon
Just one of many problems government should address
Not really a problem
14%
29%
39%
16%
61% see it as a “critical” or “significant” problem
Percent of respondents*
After knowing benefit
29%
32%
28%
9%
Exhibit 13 Ontarians respond to the case for closing the prosperity gap
revenue annually
reduction
spending on social
Benefit if we closed the gap:

path to the 2020 prosperity agenda 37
health care, poverty, and homelessness, government needs to increase social spending now, even if other important investments have to wait,” while 41 percent agreed with the opposing view,
“when it comes to social issues like health care, poverty, and homelessness, government needs to focus on long term economic growth first, even if that means some social spending will have to wait.” across canadian respondents, men were evenly split on this question, while 71 percent of women saw social spending as the priority, and 29 percent saw economic growth as the priority.
respondents split evenly on the benefits and threats of free trade
slightly more ontarians agree that “free trade agreements are a good way to create economic growth in canada” (46 percent) than those who see them as “a dangerous threat to canadian jobs” (35 percent). fully 76 percent agree that “too many good canadian jobs are being lost to low wage coun-tries like india and china.”
We conclude that the major implication of this research is that Ontarians need a better understanding of the downside of the prosperity gap. That will help them realize the urgency of the need to move from the collective complacency across the province to a shared determination to realize our prosperity potential.
38 task force on competitiveness, productivity and economic progress
onTarians are noT investing adequately for their future prosperity. This is true for investments in physical and human capital by individuals, busi-nesses, and governments. our future prosperity and our ability to achieve our full potential depend on the invest-ments we make today in these areas. We continue to urge business leaders to invest more in productivity enhancing equipment and technology. and we reinforce our call for more investment in people’s education and skills.
increase investment in machinery and equipment, particularly information and communication Technology
ontario businesses continue to trail their us counterparts in investing in machinery, equipment, and software to make their workers more productive. investments in machinery, equipment and software are typically allocated to information and communications technology (icT) and to all other, such as transportation equipment and tradi-tional factory equipment. icT accounts for about a third of investment in machinery, equipment, and software. data on these divisions are available only at the national level in canada and the united states. These results indicate our major gap is in icT invest-ment.
25 as a percentage of gdp, we
have out invested us businesses each
year from 1997 to 2006 in non-icT machinery and equipment. per worker, us businesses out invest canadian businesses, but the overall difference is smaller than that in icT.
earlier this year, the institute assessed the lower adoption of icT by canadian businesses, particularly small and medium enterprises.
26 The research
we reviewed indicated that investment in icT enhances productivity at three levels. at the most basic level, research by oecd and others indicates that equipping staff with computers and software increases firm and national productivity. at the second level, connecting computers in networks and drawing on more than technologies can drive productivity even higher. But the most significant benefit of icT adoption can be its enabling of profound trans-formation through business process or organizational change or both.
We concluded that the lack of investment in icT could be attributed to factors we have identified in previous annual reports – lack of competitive pressure to spur canadian businesses to adopt technology, less adequate management capabilities to discern the benefits of technology and to capitalize on them, and higher taxation on business investment. We expand on these themes later in the report.
We are able to compare ontario busi-nesses’ investments in all machinery, equipment, and software. This indicates that the investment gap is widening. in 2006, our businesses invested 26 percent less per worker than their us counterparts; in 1985, this gap was only 10 percent (Exhibit 14).
clearly, this is a major difference that offers potential to close the gap. With higher machinery, equipment, and soft-ware investment our workforce could be more productive.
raise our investment in people
since our first annual report, we have been urging stakeholders in ontario’s prosperity to increase our investment in education. We also see the need to keep our young people in school to achieve higher levels of skills and accreditation and to bring more ontarians into higher earnings streams.
rebalance education/health care spendingWe are concerned that governments in ontario have been trading off neces-sary investments in education to fund health care. as we compare our current public spending patterns in ontario with the previous decade and with the united states,
27 we find that we are
falling behind in education. as recently as 1992, all levels of government in
25 fifth annual report, Agenda for our prosperity, november 2006, p.34.26 roger martin and James milway, Enhancing the Productivity of Small and Medium Enterprises through Greater Adoption of Information and Communication Technology, information and communication
Technology council, ottawa, march 2007. available at: http://www.ictc-ctic.ca/uploadedFiles/Labour_Market_Intelligence/Enhancing-the-Productivity-of-SMEs.pdf27 public spending on health and education are not available on a basis comparable to ontario before 1996. consequently the analysis in exhibit 15 is for ontario versus the us total. We have compared
health and education spending for the median of the peer state from 1996 to 2005 with ontario and the conclusions over that time period do not vary.
Investment: Focus on technology and peopleOntarians have to step up their investment in capital and in themselves
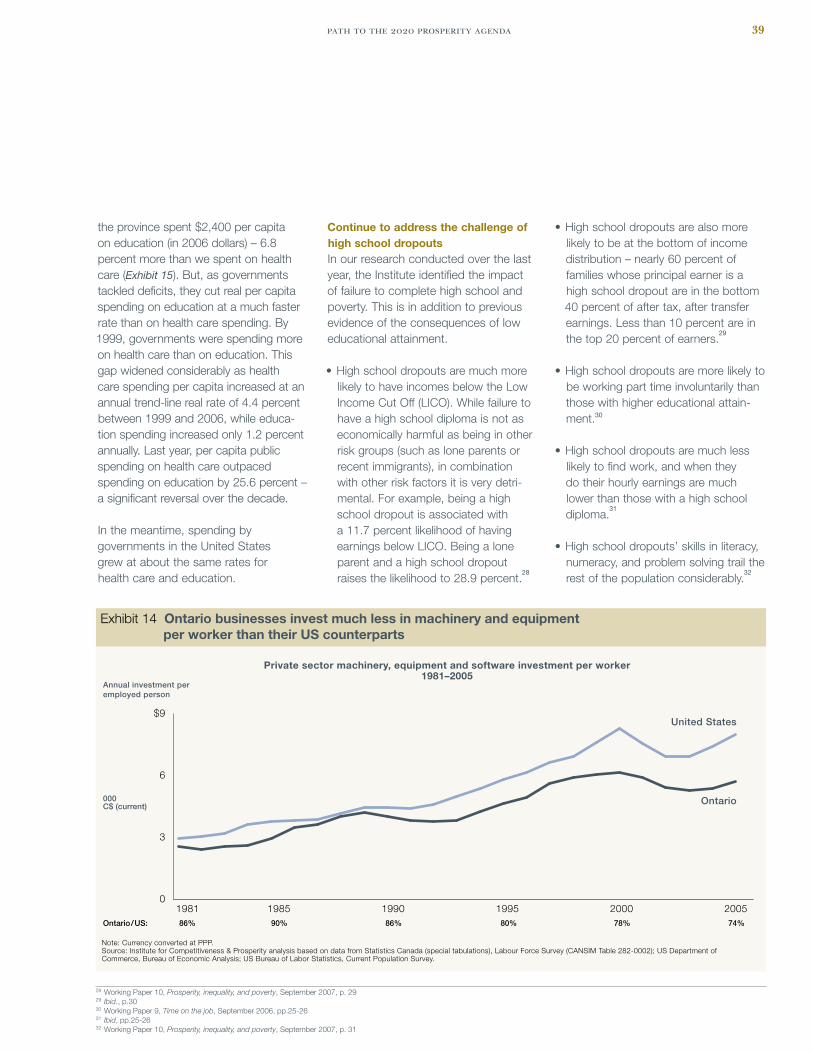
path to the 2020 prosperity agenda 39
the province spent $2,400 per capita on education (in 2006 dollars) – 6.8 percent more than we spent on health care (Exhibit 15). But, as governments tackled deficits, they cut real per capita spending on education at a much faster rate than on health care spending. By 1999, governments were spending more on health care than on education. This gap widened considerably as health care spending per capita increased at an annual trend-line real rate of 4.4 percent between 1999 and 2006, while educa-tion spending increased only 1.2 percent annually. Last year, per capita public spending on health care outpaced spending on education by 25.6 percent – a significant reversal over the decade.
in the meantime, spending by governments in the united states grew at about the same rates for health care and education.
continue to address the challenge of high school dropoutsin our research conducted over the last year, the institute identified the impact of failure to complete high school and poverty. This is in addition to previous evidence of the consequences of low educational attainment.
•Highschooldropoutsaremuchmorelikely to have incomes below the Low income cut off (Lico). While failure to have a high school diploma is not as economically harmful as being in other risk groups (such as lone parents or recent immigrants), in combination with other risk factors it is very detri-mental. for example, being a high school dropout is associated with a 11.7 percent likelihood of having earnings below Lico. Being a lone parent and a high school dropout raises the likelihood to 28.9 percent.
28
•Highschooldropoutsarealsomorelikely to be at the bottom of income distribution – nearly 60 percent of families whose principal earner is a high school dropout are in the bottom 40 percent of after tax, after transfer earnings. Less than 10 percent are in the top 20 percent of earners.
29
•Highschooldropoutsaremorelikelytobe working part time involuntarily than those with higher educational attain-ment.30
•Highschooldropoutsaremuchlesslikely to find work, and when they do their hourly earnings are much lower than those with a high school diploma.
31
•Highschooldropouts’skillsinliteracy,numeracy, and problem solving trail the rest of the population considerably.
32
28 Working paper 10, Prosperity, inequality, and poverty, september 2007, p. 2929 Ibid., p.3030 Working paper 9, Time on the job, september 2006, pp.25-2631 Ibid, pp.25-2632 Working paper 10, Prosperity, inequality, and poverty, september 2007, p. 31
United States
Ontario
200520001995199019851981
Annual investment per employed person
Private sector machinery, equipment and software investment per worker1981–2005
Note: Currency converted at PPP.Source: Institute for Competitiveness & Prosperity analysis based on data from Statistics Canada (special tabulations), Labour Force Survey (CANSIM Table 282-0002); US Department of Commerce, Bureau of Economic Analysis; US Bureau of Labor Statistics, Current Population Survey.
3
$9
0
6
000C$ (current)
Exhibit 14 Ontario businesses invest much less in machinery and equipment per worker than their US counterparts

40 task force on competitiveness, productivity and economic progress
33 Ibid., p. 31.34 institute for competitiveness & prosperity, report on canada 2007, Agenda for Canada’s prosperity, march 2007, p. 33. see Thomas Lemieux, craig riddell, and Brahim Boudarbat 2003, “recent
Trends in Wage inequality and the Wage structure in canada,” in d. green and J. kesselman (eds.), Dimensions of Inequality in Canada. vancouver: uBc press, 2006, pp. 1-46 – for evidence on the growth in returns to post secondary education in canada between 1980 and 2000.
35 Laval Lavallée, Bert pereboom, and christiane grignon, 2001, “access to postsecondary education and Labour market Transition of postsecondary students,” canada student Loan program, Hrdc, mimeo.
raise awareness of the benefits of post secondary educationour research into inequality and poverty indicates yet again the importance of education, not only for ontario’s compet-itiveness and prosperity overall, but also as a way to assist the disadvantaged move into the economic mainstream.
as we have pointed out in the past, more education means higher labour force involvement and higher earnings.
34
yet the evidence indicates that students from lower income families are less likely to receive post secondary education, particularly at a university. economists Laval Lavallée, Bert pereboom, and christiane grignon found, for example, that youth from the highest income quartile in canada are more than twice as likely to attend university than those in the lowest quartile.
35 statistics canada
researcher marc frenette found a similar
skills will be left behind. We are seeing that now. The public policy imperative is to find ways to encourage (even coerce
– as in ontario now) youth to complete their high school diploma. We need creative ways to help students complete their high school studies. We need to make a concerted effort to strengthen apprenticeship programs, including creatively addressing the economic challenge of ensuring the benefits and costs are borne by the same people. currently, apprenticeship suffers from a free rider problem. employers who invest in apprenticeships are creating skills that other employers can benefit from. in its 2004 budget, the ontario government aimed to reduce costs to employers through a refundable tax credit for businesses hiring appren-tices. it has committed to increase new apprenticeships by 25 percent during its new mandate.
continue to focus on apprenticeshipsone area of hope for potential high school dropouts – and many others – is in skilled trades. The evidence indicates that high school dropouts who successfully gain trade certification improve their economic outcomes. for somebody who has not completed high school, securing a trade certificate adds about 20 percent to his or her annual income. in fact, these individuals out earn high school graduates without a trade certificate.
33
The returns from a trade certificate (versus dropping out of high school) are higher for men than for women. for women, the returns from university education are higher than for men. This may explain why more women and fewer men are currently attending university.
in a knowledge economy, it is almost certain that those without a base level of
Ontario health
Ontario education
US education
US health
2005200419981992
Per capitaexpenditure
Public expenditure in health and education, C$ (2006) Ontario and US, 1992–2005
Notes: Currency converted at PPP; includes all levels of government, US health spending includes workers' compensation, medical benefit outlays and excludes administrative and other costs; Canada health spending includes all workers' compensation; numbers are adjusted by provincial/state deflators.Source: Institute for Competitiveness & Prosperity analysis based on data from Statistics Canada, Consolidated Government Revenue and Expenditures (CANSIM Table 385-0001); US Census Bureau, State and Local Government Finances; Office of Management and Budget, Historical Tables; National Academy of Social Insurance, Workers' Compensation: Benefits, Coverage, and Costs, multiple years.
1,500
0
2,500
$3,500
2,000
3,000
Exhibit 15 Ontario’s public investment in education trails US expenditure

path to the 2020 prosperity agenda 41
pattern, but not as pronounced – 31 percent of 19 year olds in the bottom quartile were attending university in 2003 versus 50.1 percent in the top quartile.
36
While family income is an important predictor of pursuit of post secondary education, researchers find other factors that are more important, though still related to income. atiq rahman, Jerry situ, and vicki Jimmo from statistics canada found that if one or both parents had post secondary education or if the youth came from a home with two parents, the probability of pursuing post secondary education increased.
37
more recently, frenette linked univer-sity attendance with performance on standardized tests, high school grades, parental influences, and high school quality; in fact, he attributed to these factors 84 percent of the university attendance gap between youth from the top and bottom quartiles. only 12 percent of the gap could be linked to financial constraints.
38
still, income does matter and drives some of these other characteristics. for example, families with higher income are able to enrich their children’s educa-tion and create an environment more positively disposed to post secondary education. frenette found that these factors are more prevalent as income increases. frenette’s study, along with research conducted in the united states,
39 indicates that credit constraints
are not the key challenge facing lower income families when they consider post secondary education.
Lack of information on the costs and benefits of post secondary education
are likely more important barriers. according to polling data gathered by the canada millennium scholarship foundation, canadians whose family income is below $30,000 estimate the cost of annual undergraduate university tuition at nearly $7,000; more affluent canadians estimate the cost to be $2,000 less than that. in 2003–04, when the survey was conducted, the actual average tuition was $4,025. on the benefit side, lower income canadians estimate that the average university graduate earns $39,000; other respondents estimated the income to be around $42,000. The actual result, according to the most recent census, was $62,000. This lack of information, along with other characteristics, may explain why students receiving aid to attend post secondary institutions are less likely to complete their degree than those who receive no aid.
40
increase investment in post secondary educationas we have pointed out in the past,
41
ontarians under invest in university education relative to their counterparts in peer states. in last year’s annual report, we reviewed results from a detailed study of revenues and expenses at ontario universities relative to a set of comparable public and private schools in the fourteen peer states. in collaboration with the council of ontario universities, we first identified a group of ten public and ten private peer institutions for each of ontario’s seventeen universities; newly opened uoiT was excluded. This involved iden-tifying the schools that best matched each ontario university in the number
of degrees granted by discipline and level. We then drew on school-specific financial data from the us department of education to determine revenue and expenses per full-time equivalent (fTe) student.
We found that on the revenue per student side, ontario universities have access to only 72 percent of the funds their public peers do. across ontario’s universities, annual revenue per fTe student is $20,800. across a peer group of 61 public universities in the fourteen peer states, revenue is $28,800 per fTe. We see the most dramatic differences in public funding and grants, where total federal and provincial/state funding, grants, and contracts is $5,000 per student less, or 32 percent behind, in ontario. in tuition, ontarians pay an average of $6,500 per student, or 25 percent less than their counterparts in the peer states who pay an average of $8,700.
42 in smaller
sources of revenue, ontario universities are closer to their us peers in private gifts, grants, and contracts ($2,600 versus $2,800) and on endowment income ($1,000 versus $1,600). The comparisons with similar private univer-sities in the peer states are much more negative. overall, the forty-seven most comparable private universities in the peer states have access to $58,800 per student versus the $20,800 in ontario’s public universities.
some might argue that comparing private universities to our public univer-sities is invalid. We think, however, it is appropriate to include private universi-ties, because these schools are part of the post secondary education system
36 marc frenette, “Why are youth from Lower-income families Less Likely to attend university? evidence from academic abilities, parental influences and financial constraints,” statistics canada Working paper 11f0019mie – no. 295, february 2007, p. 7.
37 atiq rahman, Jerry situ, and vicki Jimmo, “participation in postsecondary education: evidence from the survey of Labour and income dynamics,” statistics canada Working paper 81-595-mie2005036.38 marc frenette, “Why are youth from Lower-income families Less Likely to attend university? evidence from academic abilities, parental influences, and financial constraints,” february 2007.39 see pedro carneiro and James Heckman, “The evidence on credit constraints in post-secondary schooling,” The Economic Journal, vol.112, issue 482, 2002.40 canada millennium scholarship foundation, “Low-income canadians’ perceptions of costs and benefits – a serious barrier to higher education,” mimeo, 2004. available online:
www.millenniumscholarships.ca/en/41 see second annual report, Investing for prosperity, november 2003, p. 21; Third annual report, Realizing our prosperity potential, november 2004, p. 24.42 These values are for gross tuition, before the deduction of scholarships, bursaries, abd student loans or grants.

42 task force on competitiveness, productivity and economic progress
jurisdictions in the world – is in research and development spending. as we have discussed in previous work, research and development conducted by institutes of higher education (Herd) as a percentage of gdp is much higher in ontario than the median of the peer states. in fact among the 16 peer jurisdictions, ontario stood second in 2004 behind Québec. most us peer states were well behind ontario with the exception of massachusetts, whose ratio was 0.65 percent versus ontario‘s 0.74 percent and Québec’s 0.93 percent
43 (Exhibit 16). This is clearly a
canadian phenomenon. canada out performs most oecd economies in Herd as a percentage of gdp. ontario and Québec also out pace peer states significantly on the basis of Herd per student.
fiscal years, annual operating grants are growing by $6.2 billion – beginning with an increase of $683 million in the 2005–06 fiscal year and rising to $1.6 billion in 2009–10. This represents a 39 percent increase compared to the 2004-05 funding base.
one of the goals of the higher funding will be an increase in graduate educa-tion spaces by 12,000 in 2007–08 over 2002–03 and 14,000 by 2009–10. in addition, the 2005 budget committed the provincial government to increase funding for student financial assistance and for training, appren ticeship, and other initiatives.
evaluate the impact of our current research/student experience tradeoffone area where ontario leads us universities – and most other
and account for fully 32 percent of us undergraduates. To benchmark ontario’s investment in human capital for future competitiveness, we need to look at all post secondary students.
The difference has several sources. ontario universities have access to less public funding than do their us private peers, in tuition, and in private gifts, grants, and contracts, and endowment income. We found that, in combining the revenues for peer state private and public universities, ontario invested 44 percent less annually in its university system compared with the system in the peer states.
on a positive note, we were pleased that the ontario government in its 2005 budget stepped up its commitment to post secondary education. over five
43 see institute for competitiveness & prosperity, Working paper 6, Reinventing innovation and commercialization policy in Ontario, october 2004, pp.28-30 for trend information on r&d in ontario, Québec, and the peer states.
Higher education research and development per university student*Average of 2000, 2002 and 2004
C$ (2006)
$9,800
$9,500$5,200
$1,800
QuébecOntario
MassachusettsPennsylvania
North CarolinaGeorgia
New YorkTexas
CaliforniaMichigan
IndianaOhio
New JerseyIllinois
VirginiaFlorida
* Averages based on full-time and part-time university enrollmentNote: Currency converted at PPP. Source: Insitute for Competitiveness & Prosperity analysis based on data from Statistics Canada, Post secondary student information system (CANSIM Table 477–0013), multiple surveys (CANSIM Table 358–0001); US National Center for Education Statistics, Digest of Education Statistics, annual; National Science Foundation.
0 2,000 4,000 6,000 8,000 $10,000
Exhibit 16 Ontario out invests peer states in university R&D
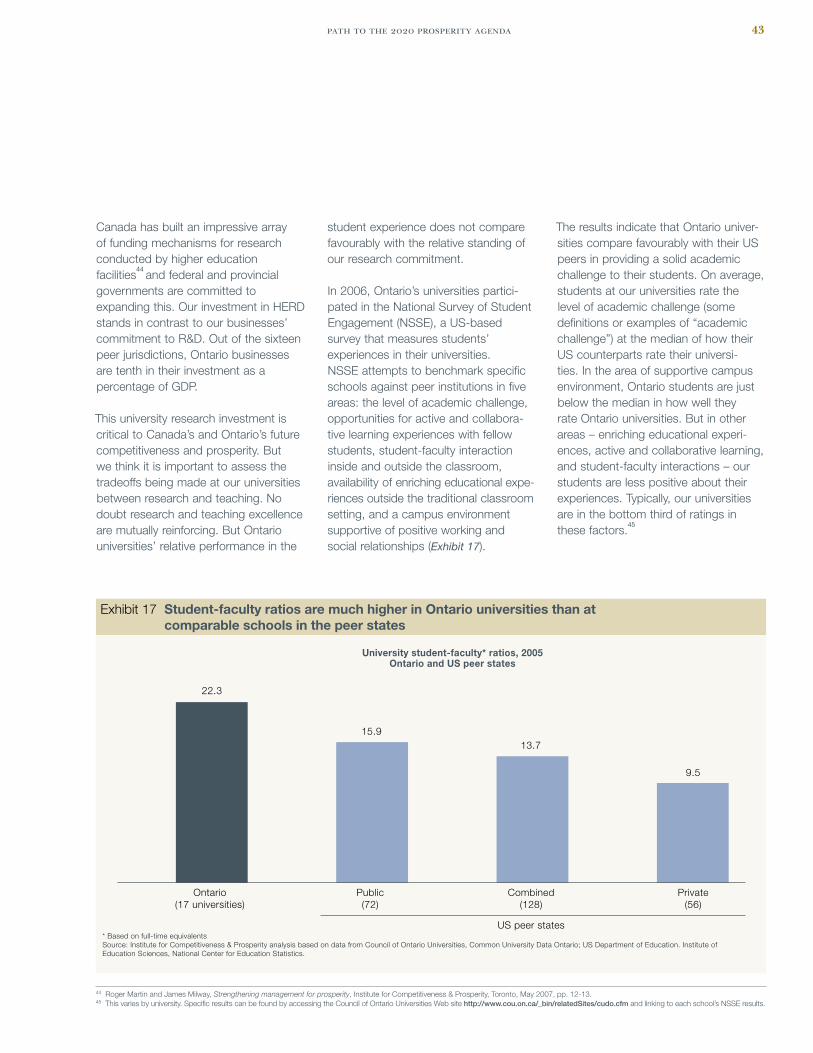
path to the 2020 prosperity agenda 43
student experience does not compare favourably with the relative standing of our research commitment.
in 2006, ontario’s universities partici-pated in the national survey of student engagement (nsse), a us-based survey that measures students’ experiences in their universities. nsse attempts to benchmark specific schools against peer institutions in five areas: the level of academic challenge, opportunities for active and collabora-tive learning experiences with fellow students, student-faculty interaction inside and outside the classroom, availability of enriching educational expe-riences outside the traditional classroom setting, and a campus environment supportive of positive working and social relationships (Exhibit 17).
The results indicate that ontario univer-sities compare favourably with their us peers in providing a solid academic challenge to their students. on average, students at our universities rate the level of academic challenge (some definitions or examples of “academic challenge”) at the median of how their us counterparts rate their universi-ties. in the area of supportive campus environment, ontario students are just below the median in how well they rate ontario universities. But in other areas – enriching educational experi-ences, active and collaborative learning, and student-faculty interactions – our students are less positive about their experiences. Typically, our universities are in the bottom third of ratings in these factors.
45
canada has built an impressive array of funding mechanisms for research conducted by higher education facilities
44 and federal and provincial
governments are committed to expanding this. our investment in Herd stands in contrast to our businesses’ commitment to r&d. out of the sixteen peer jurisdictions, ontario businesses are tenth in their investment as a percentage of gdp.
This university research investment is critical to canada’s and ontario’s future competitiveness and prosperity. But we think it is important to assess the tradeoffs being made at our universities between research and teaching. no doubt research and teaching excellence are mutually reinforcing. But ontario universities’ relative performance in the
44 roger martin and James milway, Strengthening management for prosperity, institute for competitiveness & prosperity, Toronto, may 2007, pp. 12-13.45 This varies by university. specific results can be found by accessing the council of ontario universities Web site http://www.cou.on.ca/_bin/relatedSites/cudo.cfm and linking to each school’s nsse results.
* Based on full-time equivalentsSource: Institute for Competitiveness & Prosperity analysis based on data from Council of Ontario Universities, Common University Data Ontario; US Department of Education. Institute of Education Sciences, National Center for Education Statistics.
University student-faculty* ratios, 2005Ontario and US peer states
Ontario(17 universities)
Public(72)
Combined(128)
US peer states
Private(56)
22.3
15.913.7
9.5
Exhibit 17 Student-faculty ratios are much higher in Ontario universities than at comparable schools in the peer states
44 task force on competitiveness, productivity and economic progress
46 kim richard nossal, “a question of balance: The cult of research intensivity and the professing of political science in canada,” June 2006. available at http://post.queensu.ca/~nossalk/papers/CPSA Presidential_Address_2006.pdf
47 rankings are available at http://ed.sjtu.edu.cn/rank/2007/ARWU2007TOP500list.htm
investment in assets like machinery and technology and in our own skills and knowledge is a critical driver of increased productivity, and productivity growth is necessary if we are to realize our full prosperity potential. ontarians need to step up their investments.
an ontario university a generation ago, probably would not recognize the crowded lecture halls experienced by their children.
in his presidential address to the canadian political science association in 2006, professor kim richard nossal of Queen’s university observed that canadian universities had perhaps embraced research too much. He pointed out,
“…universities in Canada have welcomed the influx of cash for research. In the process they have eagerly embraced the ‘academic capitalism’ … to strengthen the bureaucracies devoted to… research funding; to encourage faculty to become more research-intensive, and to reward those who bring in research dollars”
…we have reduced our teaching of undergraduates over the years, mostly justifying this reduction in terms of needing more time to devote to research.”
46
as an indication of the strength of ontario’s research universities, nine were ranked in the world’s top 500 research universities by shanghai Jiao Tong university in 2007.
47 in per capita perfor-
mance among the sixteen peer states and provinces, ontario stood second behind massachusetts. While these rankings are by no means definitive, they do indicate the relative strength of ontario’s universities in the field of natural and social science research. We should celebrate ontario’s prowess in higher education research; we need to ensure we are as focused on the quality of our students’ experiences.
one of the factors that likely drive these ratings is differences in student-faculty ratios. The institute calculated these ratios for each ontario university and the most similar institutions in the 14 peer states. We followed the same methodology as we used in calcu-lating the differences in revenues and expenses discussed above. on average, student faculty ratios are 29 percent worse in ontario than in their us public peers and 43 percent worse than in private peers. Taking an average of the us student-faculty ratios (based on public and private universities’ share of enrolment), we see that the ratio is 39 percent higher in ontario than in a comparable set of universities in the peer states. This stands in contrast to ontario’s standing in r&d conducted in our universities, which we have seen is well ahead of peer states on a per student basis.
These findings are indicative, not conclu-sive. We need to assess whether or not we have the right balance between research and teaching in our universi-ties. important questions need to be answered. can we extend our research investment advantage to enrich student experiences? are we emphasizing adequately the importance of the gradu-ates of universities as drivers of our competitiveness and prosperity? We think university administrators, leaders in public policy, and the research commu-nity should investigate this issue further to ensure that we are striking the right balance in research and teaching in ontario’s universities. it is possible that in gradually increasing the student-teacher ratio over time, we have failed to recognize the impact on student experience. parents of today’s university students, who themselves attended

path to the 2020 prosperity agenda 45
specifically, ontario incurs multiple economic costs associated with taxes on new business investment:
•FinanceCanada’sresearchhasshownthat relative to taxes on consumption, taxes on business investment work against the average canadian’s prosperity and economic well being. The department modeled the impact of several different tax policy changes. The research concludes that the greatest positive impact on the economic well being of average canadians comes from reductions in taxes paid by businesses on their investments – by reducing provincial sales taxes on capital goods or increasing the rate at which businesses can write off their capital investment through the capital cost allowance. reducing corporate capital taxes and income taxes would also be beneficial to the average person’s well being – more so than reductions in the gsT. This paradoxical result comes about because shifting taxation from business expenditure to consumption expenditure will increase the motiva-tion for business investment, which in turn drives up wages and job creation.
•AstudybyUKeconomistsWijiarulampalan, michael devereux, and giorgio maffini
49 concluded that
most corporate taxes are borne by
workers. Their research across 22,000 companies in ten european countries over the 1993–2003 period indicates that 54 percent of corporate income taxes are borne directly through lower wages. This is the result of wage bargaining between firms and employees – firms are able to pass on a significant portion of the additional costs of corporate taxation to their employees in the form of lower wages. in the long run, the researchers found that more than 100 percent of corporate taxes are borne by workers through the additional impact of lower investment in productivity- and wage-enhancing investments in machinery, equipment, and software.
•Manyeconomicstudiesshowthattax rates on business investment affect investment levels. research by us economists robert Hall and dale Jorgenson in the late 1960s was the first to identify the relationship between tax policy and investment expenditures. it concluded that tax policy was an important determinant of the level, timing, and composi-tion of business investment.
50 more
recently and closer to home, research by department of finance economists aled ab iowerth and Jeff danforth
51
suggests that a 10 percent reduction in the cost of capital (which is the effect of a reduction in marginal tax
48 see martin and milway, Enhancing the Productivity of Small and Medium Enterprises through Greater Adoption of Information and Communication Technology, march 2007, and andrew sharpe, “The relationship between icT investment and productivity in the canadian economy: a review of the evidence,” centre for the study of Living standards, december 2006, pp 46-68.
49 Wiji arulampalam, michael p. devereux, and giorgia maffini, “The incidence of corporate income Tax on Wages,” oxford university centre for Business Taxation, oxford, Wp 07/07, april 2007.50 robert e. Hall and dale W. Jorgenson, “Tax policy and investment Behavior,” American Economic Review, 57, no. 3 (June): 391–414.51 aled ab iowerth and Jeff danforth, “is investment not sensitive to its user cost? The macro evidence revisited.” department of finance, Working paper 2004-05. ottawa.
The incoming goVernmenT needs to pursue tax reform as a high priority to raise ontario’s competitiveness and prosperity.
lower taxes on new business investment
Business investments in machinery equipment, including advanced infor-mation and communication technology have been shown to be important contributors to productivity and pros-perity.
48 as we have seen, ontario under
invests in this productivity enhancing capital and this contributes to our pros-perity gap. addressing ontario’s and canada’s high taxation of new busi-ness investment is an important step to improving this weakness.
Taxes on new investment hurt prosperityTax revenues are necessary for making public investments, delivering govern-ment services, and achieving a more equitable distribution of income. all advanced economies tax business investment through some combination of corporate income taxes, sales taxes on capital goods, and taxes on capital assets. But these taxes, like all taxes, can motivate behaviours that work against competitiveness and prosperity. The challenge is to ensure that the negative economic impact of specific taxes does not outweigh their benefits.
Motivations: Pursue smarter taxation
Unwise taxation hinders prosperity growth

46 task force on competitiveness, productivity and economic progress
52 ruud a. de mooij and sjef ederveen, “What a difference does it make? understanding the empirical literature on taxation and international capital flows”, european commission economic papers, no 261, december 2006.
53 e. Beaulieu, k.J. mckenzie and J.-f. Wen. 2004. “do Taxes matter for firm Location? evidence from canadian provinces.” mimeograph, university of calgary. cited in duanjie chen, Jack mintz, and andrey Tarasov, C.D. Howe Backgrounder,” federal and provincial Tax reforms Let’s get Back on Track”, c.d. Howe institute, July 2007.
54 Working paper 5, Taxing smarter for prosperity, march 2005, pp. 43–49.55 michael smart, “Lessons in Harmony,” C.D. Howe Institute Commentary, no. 253, July 2007, p. 6.56 Ibid., p. 257 duanjie chen and Jack mintz, “assessing ontario’s fiscal competitiveness.” available online at http://www.competeprosper.ca/images/uploads/ChenMintzReport_251103.pdf
rates on business investment) can increase investment in machinery and equipment by 10 percent in canada.
•Taxationofbusinessinvestmentaffects foreign direct investment even more significantly. in a study for the european commission, dutch economists ruud de mooji and sjef enderveen reviewed the results of over 31 different economic research studies conducted over the past quarter century.
52 These studies generated 427
estimates (after eliminating extreme results) of the impact on the level of foreign direct investment in a country and its corporate tax rate. The authors concluded that results typically show that a 1 percentage point reduction in the corporate tax rate raises foreign investment by 2.1 percent. further investigation of the results indicates that the main effect is on the amount of investment rather than the decision to locate in a specific country. However, research on differences in corporate tax rates across canadian provinces indicates that the effective tax rate on the cost of doing business is 40 percent lower in alberta than in ontario, with the result that roughly 12 percent more firms operate in alberta.
53
•ResearchconductedbytheInstitutefound that eliminating ontario’s sales tax on capital goods, eliminating its corporate capital tax, and increasing the capital cost allowances on new investments in machinery and equipment had positive effects on the province’s gdp, net of lost tax revenue.
54
ontario is a high tax jurisdiction in new business investmentThe latest research by Jack mintz indi-cates that canada is still one of the higher tax jurisdictions among devel-oped economies. mintz calculates tax rates on new business investment by determining the tax paid by businesses on a new dollar of investment. He includes corporate income taxes on the profits generated by the new investment, applicable sales taxes on the capital goods as they are purchased, and taxes on the capital assets once in place – where such capital taxes exist.
on the positive side, canada’s taxation of new business investment fell consid-erably as a result of the march 2007 federal budget, which allows manufac-turers and processors to write off their capital investments in machinery and equipment acquired in 2007 and 2008 using a special two year 50 percent straight-line rate. it also increased the capital cost allowance rate on buildings used in manufacturing and processing and on computers. provincially, the ontario government did nothing in 2007 to reduce taxation on business invest-ment – although it did commit to moving up the elimination of the capital tax from 2012 to 2011. combining a relatively high provincial corporate income tax, a capital tax, and a sales tax on capital goods, ontario has the highest tax rate on new business investment among the provinces. other than the united states, no other country in the developed world has higher taxes on new business investment than ontario (Exhibit 18).
We would argue that the united states is able to “get away” with their high tax rate on new business investment
because its economy has so many other positive features – size, sophistica-tion, and innovation.
in its recent economic update, the federal government has announced dramatic improvements in the tax environment with its plan to reduce the federal corporate income tax rate to 15 percent by 2012. ontario needs to follow suit and reduce its statutory rate.
ontario needs to scrap its retail sales tax and replace it with a value added tax harmonized with the federal GSTWhile the common perception may be that ontario’s 8 percent provincial sales tax is levied mostly on retail purchases by the public, more than 40 percent of its revenues are estimated to come from purchases by businesses, including capital investments.
55 The tax paid on
these business costs are ultimately borne by consumers as part of the final price they pay.
56
a value added tax, like the federal gsT, is paid by the end consumer of a good or service. Businesses pay the gsT as they make purchases or investments, but these are reimbursed as they sell their output. in effect, a value added tax is similar to the retail sales tax in that the end consumer ultimately pays – but with retail sales tax this is buried in the price. The major difference is that retail sales taxes add to the marginal tax for new business investment. Tax experts Jack mintz and duanjie chen attribute one quarter of canada’s marginal effec-tive tax rate on new business investment to provincial retail sales taxes (in ontario, British columbia, manitoba, saskatchewan, and pei).
57
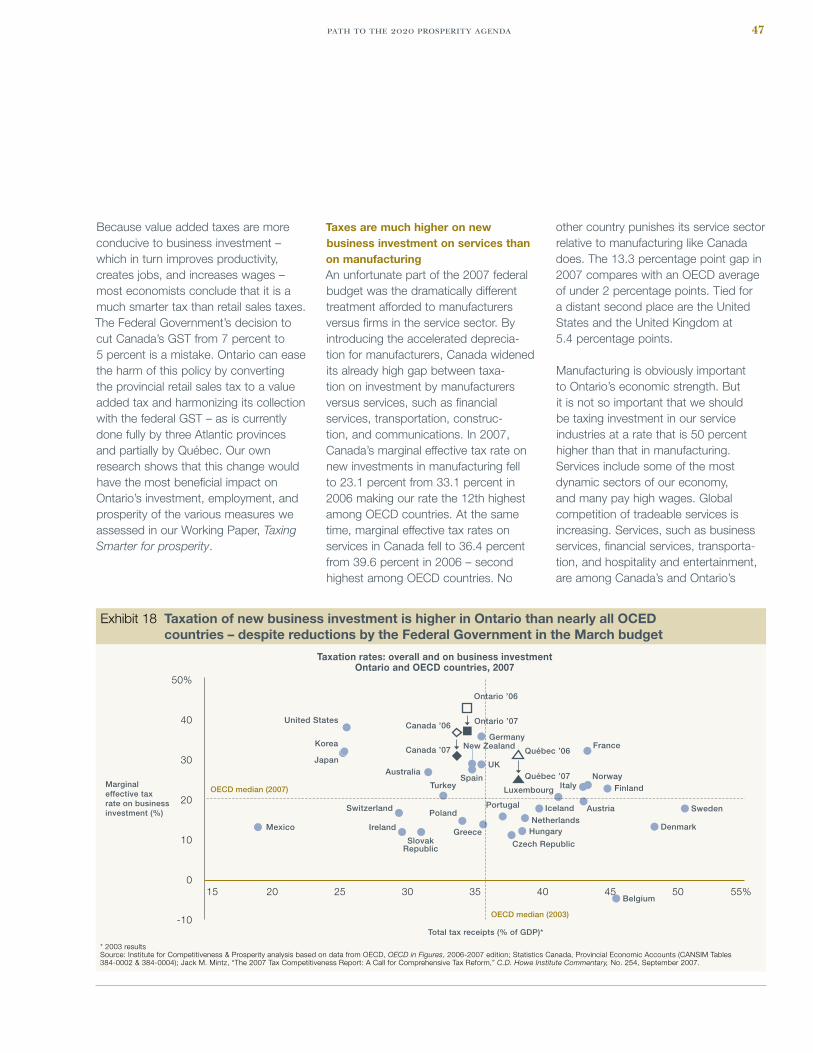
path to the 2020 prosperity agenda 47
Because value added taxes are more conducive to business investment – which in turn improves productivity, creates jobs, and increases wages – most economists conclude that it is a much smarter tax than retail sales taxes. The federal government’s decision to cut canada’s gsT from 7 percent to 5 percent is a mistake. ontario can ease the harm of this policy by converting the provincial retail sales tax to a value added tax and harmonizing its collection with the federal gsT – as is currently done fully by three atlantic provinces and partially by Québec. our own research shows that this change would have the most beneficial impact on ontario’s investment, employment, and prosperity of the various measures we assessed in our Working paper, Taxing Smarter for prosperity.
Taxes are much higher on new business investment on services than on manufacturingan unfortunate part of the 2007 federal budget was the dramatically different treatment afforded to manufacturers versus firms in the service sector. By introducing the accelerated deprecia-tion for manufacturers, canada widened its already high gap between taxa-tion on investment by manufacturers versus services, such as financial services, transportation, construc-tion, and communications. in 2007, canada’s marginal effective tax rate on new investments in manufacturing fell to 23.1 percent from 33.1 percent in 2006 making our rate the 12th highest among oecd countries. at the same time, marginal effective tax rates on services in canada fell to 36.4 percent from 39.6 percent in 2006 – second highest among oecd countries. no
other country punishes its service sector relative to manufacturing like canada does. The 13.3 percentage point gap in 2007 compares with an oecd average of under 2 percentage points. Tied for a distant second place are the united states and the united kingdom at 5.4 percentage points.
manufacturing is obviously important to ontario’s economic strength. But it is not so important that we should be taxing investment in our service industries at a rate that is 50 percent higher than that in manufacturing. services include some of the most dynamic sectors of our economy, and many pay high wages. global competition of tradeable services is increasing. services, such as business services, financial services, transporta-tion, and hospitality and entertainment, are among canada’s and ontario’s
Taxation rates: overall and on business investmentOntario and OECD countries, 2007
40
20
30
10
-10
0
Marginaleffective taxrate on business investment (%)
Total tax receipts (% of GDP)*
50%
15 2520 30 35 40 45 55%50
* 2003 results Source: Institute for Competitiveness & Prosperity analysis based on data from OECD, OECD in Figures, 2006-2007 edition; Statistics Canada, Provincial Economic Accounts (CANSIM Tables 384-0002 & 384-0004); Jack M. Mintz, “The 2007 Tax Competitiveness Report: A Call for Comprehensive Tax Reform,” C.D. Howe Institute Commentary, No. 254, September 2007.
OECD median (2003)
OECD median (2007)
Ontario ’06
Ontario ’07
GermanyNew Zealand
United States
Korea
Japan
Mexico
Switzerland
Ireland
Poland
Australia
Turkey
Québec ’06France
FinlandNorway
ItalyLuxembourg
Austria
Québec ’07UK
Spain
Greece
Portugal
Czech Republic
HungaryNetherlands
Iceland
Denmark
Belgium
Sweden
SlovakRepublic
Canada ’06
Canada ’07
Exhibit 18 Taxation of new business investment is higher in Ontario than nearly all OCED countries – despite reductions by the Federal Government in the March budget
48 task force on competitiveness, productivity and economic progress
personal nonrefundable amount for dependent children, and the refundable child tax credit.
as a result of clawbacks, a single-earner family of four faces a marginal effective tax rate of 60 percent as taxable income approaches $30,000. This is the result of losing access to transfers or tax benefits as income passes a certain threshold. Because of claw-backs, those families are keeping only 40 cents of each new dollar they earn. at around $40,000 the marginal rate climbs to an absurd and tragic 80 percent.
60
We and others have made recommen-dations to address these perversities in the tax and benefit system. These include federal and provincial collabora-tion to better integrate benefit and tax design, so that high marginal tax rates can be smoothed out. another option is to reduce the basic personal allowance and lower marginal tax rates so that income increases attract less income tax at the margin. pooling the amounts to be clawed back across several programs could be used to replace individual clawbacks that accumulate to increase the marginal tax rate for low income earners.
The new provincial government should address the issue of high marginal tax rates for low income ontarians as a high priority.
as it begins the new mandate, we encourage the government to be open to dramatic improvements in how we tax and to begin discus-sions with ontarians on why these changes would benefit all of us.
58 cluster employment data available online: http://204.15.35.174/index.php/clusters/data/59 Jack mintz, 2007 Tax competitiveness report: a call for comprehensive Tax reform, cd Howe institute commentary, september 2007, pp. 13-15. available online: http://www.cdhowe.org/pdf/
commentary_254.pdf60 Working paper 7, Taxing smarter for prosperity, pp. 36-37 and finn poschmann, “Background issues marginal and average effective tax rates in ontario”, July 2004. available online:
http://www.competeprosper.ca/images/uploads/FinnPoschmann_290305.pdf
Jack mintz concludes that canada is indeed on the wrong side. assessing corporate tax rates across twenty-seven countries for the 2001–2005 period, he finds that the statutory tax rate that maximizes corporate tax revenue in canada is about 28 percent. in 2005, the actual rate was 34.4 percent.
59 His
research indicates that tax revenues would, in fact, increase if canada and ontario lowered corporate income tax rates.
This latest research builds the case further for fundamental improvements in how ontario taxes new business investment. The new government should assess as a high priority:
•ConversionofOntario’sretailsalestax into a value added tax – through harmonization with the federal gsT
•Lowercorporateincometaxratestostimulate business investment and to increase provincial tax revenue
• Immediateeliminationofthecapitaltax.
reduce personal taxes that punish low income earners
We continue to urge the ontario and federal governments to reduce the perversely high marginal tax rates for low income individuals and families. Because our current tax and transfer system claws back benefits and increases marginal tax rates as income rises, the effective tax rate paid by ontarians at relatively low income levels is very high. The most significant claw backs are the low income credit to offset gsT payments and the child Tax Benefit. This was created in 1993 to replace the family allowance, the
largest clusters of traded industries.58
governments ought to be much more even handed in their taxation of all business investment – relying on entre-preneurs and competitive businesses to drive investment decisions, not preferen-tial tax rates.
ontario and canada are losing tax revenue because of high corporate tax ratesin our past reports, we have criticized the capital tax and sales taxes on capital goods. recent research on corporate income tax rates indicates that this area requires significant reform. in 1979, us economist arthur Laffer observed that when tax rates are zero or 100 percent, tax revenue would be zero. Tax revenues rise as tax rates exceed zero and reach a maximum. after that maximum, tax revenues decline even as tax rates increase. This is because taxpayers will rearrange their affairs to avoid the taxes they judge to be punitive. in addition, economic activity declines as rates get too high and available revenue shrinks. When rates are above this maximum, a rate reduction actually increases the dollar amount of revenue. This is the result of greater economic activity from tax reductions and from a shifting by multi-national corporations of their income and their investments to lower tax jurisdictions. some of this shifting is reflected in actual investment, as corporations actually invest physical capital in lower tax jurisdictions. some is the result of allowable changes in accounting, as corporations rearrange their accounting to shift tax liabilities from higher tax to lower tax jurisdictions. either way, a country on the wrong side of the Laffer curve can increase tax revenue by lowering rates.

path to the 2020 prosperity agenda 49
61 martin and milway, Strengthening management for prosperity, may 2007.
management includes goal setting, organization building, resource allo-cation, and results assessment. it encompasses actions in financing the enterprise, sales and promo-tion, production, delivery, and product development. a jurisdiction’s innovation success will be built on these capabili-ties as well as the quantity and quality of its science and engineering capabili-ties. management skills are not more important than research, science, and engineering. But the evidence strongly
build stronger management capabilities
We have made the case in previous reports that management capabilities are an important support for innova-tion and prosperity. earlier this year the institute published a research paper that articulated the importance of management capabilities to well func-tioning market structures and assessed canada’s success in developing this capability.
61
producTiViTy and prosperiTy are closely related to innovation by our businesses. The degree to which our firms pursue strategies that put a premium on innovation to create high value products and services is the result of structures of specialized support and competitive pressure (Exhibit 19). specialized support comes from sources such as close collaboration between researchers and businesses, highly capable managers, and high quality venture capital. competitive pressure is driven by capable and motivated rivals as well as sophisti-cated customers. at the base of this specialized support and competitive pressure is general support from basic infrastructure and a sound primary and secondary education system.
in the past we have urged stakeholders in ontario’s prosperity to address various gaps in specialized support and to find ways to strengthen competi-tive pressure. in the coming year we see the following priorities as the government begins its new mandate. We need to enhance the capabilities of our management through specialized support and attract more sophisti-cated venture capital. and we need to continue to identify ways to improve our regulatory environment – within indus-tries and beyond ontario’s borders – to supplement pressure and support.
Specializedsupport
Competitivepressure
General support
Firm actions
Exhibit 19 Specialized support and competitive pressure drive innovative strategies by firms
Source: Institute for Competitiveness & Prosperity.
Structures: Place a premium on creativity and innovationOur market structures need to drive greater innovation

50 task force on competitiveness, productivity and economic progress
closely connected to their ability to transform technological advances into attractive new products and services, using flexible work organizations and the delegation of authority, combined with sophisticated marketing and advanced production processes.”
66
as we have discussed in our previous work and summarized in our research on the importance of management capabilities,
67 the evidence indicates we
have not achieved the optimal combi-nation of management and scientific skills:
•Ourmanagershavelowereducationalattainment overall and in business education specifically than their us counterparts
•CEOsofourlargestcorporationstend less to have formal business education at the graduate level than ceos of large us companies
•Canada’ssuccessfulinnovativefirmsreport having access to management talent is a key constraint
•Ontarioproducesfewerbusinessgraduates than the united states, while we produce more science and engineering graduates
•Scientistsandengineersarewellrepresented in canada’s work force relative to the us work force
•AnalysisconductedbytheOntarioministry of economic development and Trade shows that it is more difficult to gain entry into an ontario university business program than to engineering or arts and sciences,
motorola, has any kind of scientific or technical degree. four of the seven ceos hold an mBa, and a fifth has an undergraduate business education. one has an undergraduate history degree, and michael dell did not graduate from university.
Below the ceo level, evidence is mounting that the economy is requiring greater numbers of conceptual thinkers. a mckinsey study of job creation in the us economy concluded that fully 70 percent of jobs created between 1998 and 2004 were “tacit skills jobs” – those requiring a significant level of conceptual skill and thinking to perform.
63 another study shows that
the most highly valued and paid jobs in the us economy are going to people with a combination of the cognitive skills of the tacit sort referred to above and people skills.
64 a more recent paper
by the same authors concludes that the increase in productivity associated with higher wages in urban centres is most pronounced among workers with strong cognitive and people skills.
65
innovation and productivity growth are not the result of technical or manage-ment skills alone. Both sets of skills are required. michael porter, a leading authority on corporate and country competitiveness, sums up the neces-sary interaction between technical and management skills. in his annual chapter in the World economic forum’s Global Competitiveness Report, 2005/2006, porter observes:
“Our regressions suggest that achieving high levels of innovation is not only a matter of companies spending more on R&D. It is also
suggests that public policy has not found the right balance between the two sets of skills.
62
management skills are important enablers of:
• allocatingsufficientresourcestoresearchand development and innovation
•determiningresearchprioritiesinanorganization
• linkingconsumerneedsand research capabilities
•assessingcompetitivestrengthsandweaknesses to identify research and innovation priorities
• leadinggo/nogodecisionmaking
•establishingoptimalfinancingsourcesfor research and commercialization.
good management strives for both effi-ciency gains from process improvements and for development of value added products and services which as we have seen are the drivers of productivity growth – the key challenge to ontario’s 2020 prosperity agenda.
our research indicates that across successful high technology companies in canada and the united states, science and engineering graduates were the dominant founders of successful high technology firms. However, as these firms matured, educational backgrounds of ceos are more varied. in fact, at the largest seven high technology firms on the Fortune 100 – iBm, Hp, dell, microsoft, intel, motorola, and cisco – only one ceo, edward Zander of
62 Ibid., pp. 12-17 and Working paper 6, Reinventing innovation and commercialization policy in Ontario, october 2004.63 B. Johnson, J.m. mankiya, and L.a. yee, “The next revolution in interactions,” McKinsey Quarterly, 2005, issue 4, pp. 20-33.64 marigee Bacolod and Bernardo Blum, Two sides of the same coin: us “residual inequality and the gender gap, January 2005. available online: http://www.rotman.utoronto.ca/bblum/personal/front.htm65 marigee Bacolod, Bernardo Blum, and William strange, “skills in the city,” march 2007, available online: http://www.rotman.utoronto.ca/bblum/personal/front.htm 66 michael e. porter, “Building the microeconomic foundations of prosperity: findings from the Business competitiveness index,” in a. Lopez-claros (ed.), The Global Competitiveness Report, 2005–2006.
new york, ny: palgrave macmillan, p.55.67 martin and milway, Strengthening management for prosperity, pp. 9-17.
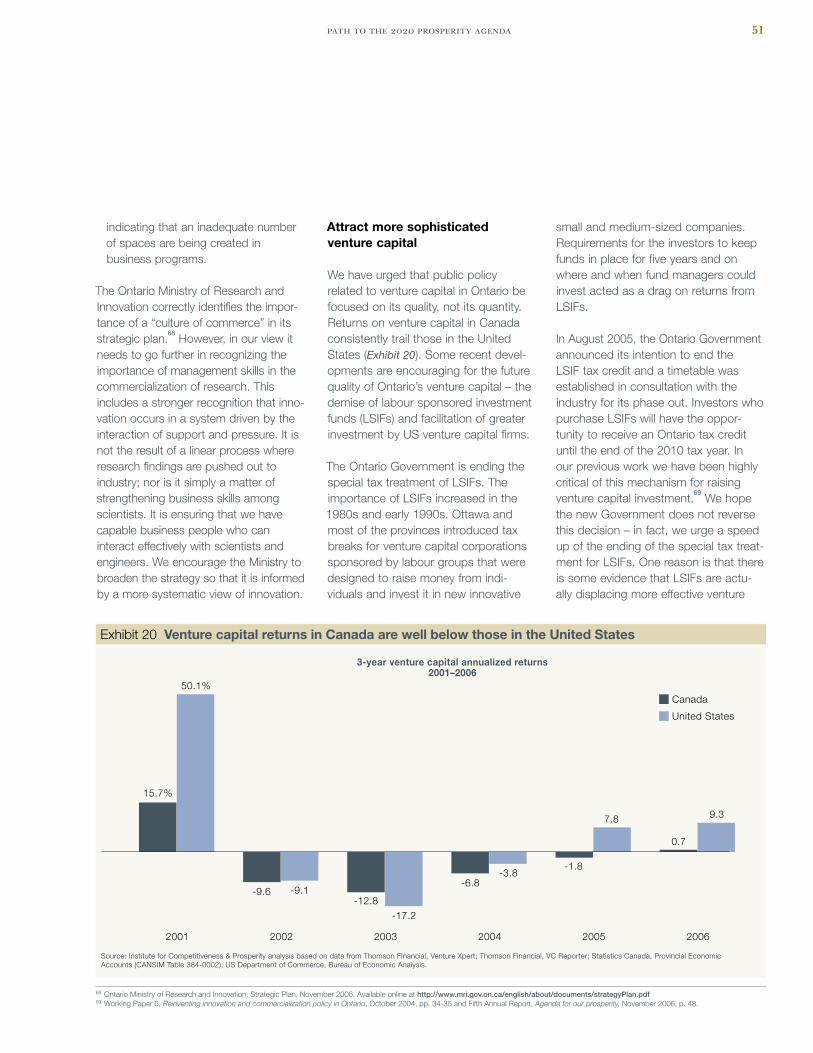
path to the 2020 prosperity agenda 51
indicating that an inadequate number of spaces are being created in business programs.
The ontario ministry of research and innovation correctly identifies the impor-tance of a “culture of commerce” in its strategic plan.
68 However, in our view it
needs to go further in recognizing the importance of management skills in the commercialization of research. This includes a stronger recognition that inno-vation occurs in a system driven by the interaction of support and pressure. it is not the result of a linear process where research findings are pushed out to industry; nor is it simply a matter of strengthening business skills among scientists. it is ensuring that we have capable business people who can interact effectively with scientists and engineers. We encourage the ministry to broaden the strategy so that it is informed by a more systematic view of innovation.
attract more sophisticated venture capital
We have urged that public policy related to venture capital in ontario be focused on its quality, not its quantity. returns on venture capital in canada consistently trail those in the united states (Exhibit 20). some recent devel-opments are encouraging for the future quality of ontario’s venture capital – the demise of labour sponsored investment funds (Lsifs) and facilitation of greater investment by us venture capital firms.
The ontario government is ending the special tax treatment of Lsifs. The importance of Lsifs increased in the 1980s and early 1990s. ottawa and most of the provinces introduced tax breaks for venture capital corporations sponsored by labour groups that were designed to raise money from indi-viduals and invest it in new innovative
68 ontario ministry of research and innovation, strategic plan, november 2006. available online at http://www.mri.gov.on.ca/english/about/documents/strategyPlan.pdf69 Working paper 6, Reinventing innovation and commercialization policy in Ontario, october 2004, pp. 34-35 and fifth annual report, Agenda for our prosperity, november 2006, p. 48.
small and medium-sized companies. requirements for the investors to keep funds in place for five years and on where and when fund managers could invest acted as a drag on returns from Lsifs.
in august 2005, the ontario government announced its intention to end the Lsif tax credit and a timetable was established in consultation with the industry for its phase out. investors who purchase Lsifs will have the oppor-tunity to receive an ontario tax credit until the end of the 2010 tax year. in our previous work we have been highly critical of this mechanism for raising venture capital investment.
69 We hope
the new government does not reverse this decision – in fact, we urge a speed up of the ending of the special tax treat-ment for Lsifs. one reason is that there is some evidence that Lsifs are actu-ally displacing more effective venture
15.7%
50.1%
-1.8
7.8
0.7
9.3
-9.6 -9.1-6.8
-3.8
-12.8
-17.2
Source: Institute for Competitiveness & Prosperity analysis based on data from Thomson FInancial, Venture Xpert; Thomson Financial, VC Reporter; Statistics Canada, Provincial Economic Accounts (CANSIM Table 384-0002); US Department of Commerce, Bureau of Economic Analysis.
200620052004200320022001
3-year venture capital annualized returns2001–2006
Canada
United States
Exhibit 20 Venture capital returns in Canada are well below those in the United States

52 task force on competitiveness, productivity and economic progress
capital funds and have even lowered the level of capital available to entrepre-neurs. another reason is that the special tax treatment reduces government revenue
70 that otherwise could be avail-
able to fund broader tax reductions.
still, some industry observers are concerned that the elimination of Lsifs will create a significant gap in venture capital funding in ontario. in a recent paper, douglas cumming identified various alternatives to Lsifs for facilitating investment in innovative enterprises.
71 among the alternatives we
find most promising are capital gains tax reductions, less stringent valuations of stock options for tax purposes, and streamlined regulatory reform.
cumming cites several research studies that suggest direct causality between lower capital gains taxation and more venture capital. This linkage is because venture capitalists typically invest with a view to earning their investment return through capital gains when they exit, not dividends earned over the life of their investment. regarding stock options, cumming cites research that indicates that the us internal revenue service
“passively acquiesces in valuations of employee stock options that motivate people to start companies…[while] this type of tax incentive is less prevalent in canada.”
72 among the regulations
cited, are possibly onerous prospectus requirements, foreign ownership restric-tions, and restrictions on institutional investors in private equity.
73
The march 2007 federal budget provided a positive development for venture capital in canada and ontario. in last year’s annual report, we reviewed the findings of the research
conducted by Thomson macdonald on our behalf.
74 a major finding of that
study was that an opportunity exists to attract more venture capital to ontario and canada by allowing us Limited Liability corporations (LLcs) to qualify for the preferential tax treatment set out in the canada-united states income Tax convention. us-based venture firms are typically structured as LLcs; these corporate structures were not explicitly included in the tax treaty. Without inclu-sion, these firms were exposed to the possibility of being taxed in both coun-tries. The march 2007 federal budget announced an agreement in principle to update the tax treaty to extend its benefits to LLcs. The formal agreement with the us government was signed in september 2007.
This is a positive development for innovation in canada and ontario. us venture funds have been important sources of capital for our young, innova-tive firms and their importance has been increasing.
There may be an opportunity to attract more venture funding from pension funds in ontario. in a recent submission to the ontario expert panel on pensions, the ontario municipal employees retirement system (omers) suggested that specific quantitative rules on public pension plans’ investment may be unnecessarily restricting their ability to participate in venture capital investing. among the rules cited were the restric-tion of pension plans to hold no more than 30 percent of the shares eligible to elect the board of a corporation. according to omers this “presumes that pension funds are passive investors, a strategy that is no longer effective in producing the returns needed to
safeguard the pension promise”75
While some would argue that there needs to be restrictions on how much control pension funds can exert over their investments, we think it is a worthwhile issue to investigate further.
identify opportunities for encouraging Toronto’s financial services cluster
our assessment of the financial services cluster during the past year identified the importance of openness to greater international competition, including ownership. We concluded that Toronto’s financial services industries are critical drivers of prosperity in the city, in ontario, and in canada. But their success cannot be taken for granted as the industry undergoes ever increasing globalization. government policy makers and industry participants need to step up their efforts to ensure we are building a world beating financial services cluster in Toronto.
The study assessed the strengths of Toronto’s financial services cluster – banking, insurance, investments, securities dealers, and risk capital – against leading clusters in north america using the framework developed by michael porter of the Harvard Business school (see Encouraging world-leading innovativeness and growth in Toronto’s financial services cluster). our study confirmed that Toronto has one of the most vibrant financial services clusters in north america. We have strong and successful canadian firms in each area of the cluster. of particular note, our banks are world leaders in share-holder returns and our life insurance firms are world leaders in market
70 douglas cumming, Jeffrey macintosh, keith godin, “crowding out private equity: canadian evidence,” Fraser Alert, september 2007.71 douglas cumming, “financing entrepreneurs,” CD Howe Institute Commentary no. 247, cd Howe institute, april 2007.72 Ibid., pp. 13-14.73 Ibid., pp 14-17.74 fifth annual report, Agenda for our prosperity, pp. 48-49. 75 omers submission to the ontario expert commission on pensions, october 2007, p. 20. available online: http://www.omers.com/Assets/Plan+Governance/ExpertCommissiononPensionsReport.pdf

path to the 2020 prosperity agenda 53
a The summary report, Assessing Toronto’s financial services cluster, is available online: http://www.competeprosper.ca/images/uploads/FSstudy_June07.pdf; more detailed findings are available at http://www.competeprosper.ca/images/uploads/FS_pres_220607.pdf
b for more detail on porter’s research on industry clusters, visit the Web site, http://www.isc.hbs.edu/econ-clusters.htm. for our work on clusters in ontario and canada, see Working paper 5, Strengthening structures: Upgrading specialized support and competitive pressure, July 2004, pp.17-29 and visit http://www.competeprosper.ca/index.php/clusters/overview/
•relatedandsupportingindustriesproviding expertise and services to the cluster
•demandingandsophisticatedcustomers whose needs and tastes anticipate global developments, thereby encouraging innovation in the cluster
•rivalryamongverycapablecompeti-tors that stimulates strategies of innovative differentiation in the cluster.
The first two elements represent the support for the cluster, which encom-passes both general and specialized support. Clusters benefit from high quality natural resources, physical infrastructure, and capable workers and managers as well as specialized expertise from related industries helping the cluster firms innovate and meet customer needs without making all the required investments themselves.
In the area of factor conditions, we find that Toronto’s financial services cluster benefits from good generalized factors including an advantageous geographic location, comparable input costs, and good macroeconomic conditions rela-tive to its US peers. Moreover, Toronto enjoys good performance in some areas
Canadian firms to meet their financing needs as they expand abroad. To help understand the performance of Toronto’s financial services cluster, we draw on Michael Porter’s research into successful industry clusters.b
Clusters refer to concentrations of similar industries in geographic areas. Many researchers have observed that most industries of tradable goods and services already cluster in specific regions around the world; for example, automobiles in Detroit, printing presses in Heidelberg, and consumer electronics in Tokyo. Clusters attract leading firms, suppliers, and related industries to build their advantages over other regions even further. These advantages lead to more innovation and higher wages. As the Institute’s previous work has shown, successful clusters are built on support from highly qualified workers and managers, excellent infrastructure, supportive economic conditions, and pressure from sophisticated customers and innovative rivals. Porter concludes that innovative, world beating clusters are the result of the interaction of four elements:
•theavailabilityofhighqualityfactors as inputs to the industry, including physical infrastructure and talented human capital
Toronto’s financial services industries are critical drivers of prosperity in the city region, in Ontario and across Canada.EarlierthisyeartheInstituteworked with The Toronto Financial Services Alliance (TFSA) to assess the key strengths and weaknesses of the financial services cluster versus its key North American competi-tors. The reporta will inform the work oftheOntarioMinistryofEconomicDevelopmentandTrade(MEDT)inthedevelopment of its provincial strategy to support continued growth in the sector.
Overall, we concluded with others that Toronto has one of the most vibrant financial services clusters in North America. We have strong and successful Canadian firms in each area of the cluster – banking, insurance, investments, securities dealers, and risk capital. Our banks are world leaders in shareholder returns. Canadian life insur-ance firms are among global leaders by market capitalization.
Yet the cluster has opportunities for improvement. Wages – an indicator of industry productivity and competi-tiveness – match US peers in parts of the cluster but trail significantly in higher wage sub-clusters. Our banks are not near the top of lists of global leaders, and our securities brokers have not succeeded in working with
encouraging world-leading innovativeness and growth in Toronto’s financial services cluster

54 task force on competitiveness, productivity and economic progress
tion of demand for financial services, but Canada does not experience wide-spread weaknesses in this regard.
The most significant improvement opportunity for Toronto’s financial services cluster is increasing the intensity of rivalry in the cluster, particularly in banking. Our banks compete intensely in the domestic market. However, Canada’s regulatory framework has reduced the benefits of external forces to stimulate greater differentiation among our banks. While foreign banks may enter the Canadian market de novo and undertake essen-tially all of the activities undertaken by domestic banks, the widely held rule for the large banks prevents foreign financial institutions from acquiring a controlling interest in a large Canadian bank.
Our research indicates that the cluster benefits from adequate demand and sophistication across segments. Although personal consumption of financial services per capita in Canada is lower than in the United States, it is still among world leaders. Household demand is fairly sophisticated, as indicated by shifts in the portfolio mix of household financial assets, which demonstrate convergence with the more sophisticated mix in the United States. Government demand for finan-cial services, as evidenced by levels and trends in borrowing, matches US experience. On the corporate side, the United States is characterized by more debt and equity per capita than Canada. Canadian firms match US experience in mergers and acquisitions but are less likely to require financing for initial public offerings. It is difficult to match US experience in the sophistica-
of specialized factors. For example, it has well educated employees and higher incidences of professional desig-nations.
However, the employees in Toronto’s financial services have a lower inci-dence of university educational attainment. Post secondary institutions that provide employees to the cluster in Toronto/Ontario offer fewer specialized graduate programs than universities in areas like New York, Chicago, and Boston. These specialized programs are important to providing focused knowl-edge and expertise to the cluster. This represents an opportunity for the TFSA to act as a catalyst for the province and its post secondary schools to create more specialized educational programs to benefit the cluster.
Toronto’s financial services cluster benefits from solid related and supporting industries, especially in busi-ness services, information providers, and computer and communications services. These industries are important suppliers to financial services and to the extent that they are strengths for the Toronto region they help the success of its financial services cluster.
Equallyimportantaresophisticateddemand and competitive rivalry, which create competitive pressure for upgrading and innovation. Sophisticated customers drive the cluster to develop products and services that antici-pate demand elsewhere in the world. Appropriate types of intense rivalry cause local competitors to seek unique and better ways to meet the needs of customers.
Operational effectiveness
Strategicpositioning
Basis
Features
Outcomes
Strategic positioning results in higher value added innovation

path to the 2020 prosperity agenda 55
Porter’s work on competitive rivalry identifies two bases of competi-tion – operational effectiveness and strategic positioningc (Exhibit E). Firms competing on the basis of operational effectiveness imitate best practices in areas such as service processing and technologies employed. This type of competition leads to similar products and pricing among local rivals. Cost improvements in this environment are incremental, and the market develops with little true customer choice. The outcome is slower dynamic improve-ment of the sector and few world beating strategies. Porter calls this “zero sum competition.”
Porter identifies he second type of competition, strategic positioning, as more fundamental to success in an advanced economy. Here competi-tion is focused on creating different
value propositions for customers. The intensity of competition is determined by the degree to which companies have distinctive strategies defined by different customer segments, services offerings, and price levels. “Positive sum competition” is the outcome, which increases variety and choices and creates new markets.
Our research indicate that limited competition in the domestic market has reduced our banks’ incentive to develop world beating strategies that can translate to greater innovation and global leadership. Bank rivalry in Canada is based on relatively undif-ferentiated competitive strategies. Canadian banks compete intensely in the domestic market – but this compe-tition is based more on operational effectiveness and replicating best prac-tices. World leaders in banking from
countries such as Switzerland, France, the UK, the Netherlands, and the United States, come from environments of differentiated strategies.
Canada’s securities sector, dominated by domestic firms owned by banks, has not developed world beating strategies that position them as global leaders. Leading firms in Canada’s life insurance have developed more differentiated strategies, and they have benefited significantly from changes in Canada’s regulations, which allowed them to convert into stock companies from policyholder ownership. This dramatic change in the regulatory framework allowed them to strengthen their global presence, particularly Manulife and Sun Life. Both are in the top ten by market capitalization, as is Great-West Life.
The major challenge for the cluster is getting the regulatory environment right. By precluding foreign banks’ entry into the Canadian market through the acquisition route, our regulatory framework reduces the benefits of external forces to stimulate greater differentiation among our banks. This is a tricky area for public policy. Greater openness to foreign acquisitions would feed the current concerns about hollowing out. But it is highly unrealistic to think Toronto can build a sustainable world leading financial services cluster without being open to competitive international forces (Exhibit F). We need to move from a focus on preserving the status quo to one that encourages innovativeness and growth.
Pressure
Support
Factor (Input) Conditions: Solid generalized conditions; specialized conditions are weaker
Related andSupporting Industries: Good level of general and specialized support
DemandConditions: Less sophisticated demand for financial services
Firm Strategy and Rivalry: Typically undifferentiated strategies by banks
Source: Michael Porter, Cluster Mapping Project, Institute for Strategy and Competitiveness, Harvard Business School; Institute for Competitiveness & Prosperity.
Exhibit F Toronto financial services cluster needs competitive pressure for innovative strategies
c michael porter, competition and antitrust: a productivity-Based approach, may 2002. available at http://www.isc.hbs.edu/053002antitrust.pdf

56 task force on competitiveness, productivity and economic progress
76 daniel Trefler, “The Long and short of the canada-u.s. free Trade agreement,” american economic review, vol. 94, no. 4, 2004.77 daniel Trefler, “freer Trade: a path to Broad-Based prosperity”, presentation to conference on canada’s prosperity challenge, march 2007.
available online: http://www.competeprosper.ca/images/uploads/Trefler_OTF_FTA.pdf
in his study of the long term effects of the agreement, dan Trefler, professor of economics at the rotman school of management at the university of Toronto, concluded that the free trade agreement improved produc-tivity, wages, and consumer welfare in canada and the united states.
76
To be sure, free trade had adverse employment effects in its first few years. However, subsequent growth in manu-facturing employment relative to that in other parts of the world suggested to Trefler that the lost employment was made up for by employment gains in other parts of manufacturing.
Trefler’s research showed some other effects of free trade. The pressure of greater competition resulted in the exit of firms that were not competitive in the new setting. These exits accounted for 6 percent of the 14 percent produc-tivity improvement that Trefler found in canada. But firms with competitive productivity rates before free trade expanded as a result of greater export opportunities. This accounted for 4 percent of the productivity growth. finally, some low productivity firms improved their performance as a result of the competitive pressure and with this improved performance increased their exports. This accounted for the final 4 percent of the 14 percent overall productivity growth.
77
ideally, multilateral free trade could be the most effective way to broaden our markets. But the complexity of negoti-ating such arrangements and the time required to complete the deals mean it is difficult to make them happen. The federal government has announced its desire to negotiate more bilateral free trade agreements and we encourage ontario to support these efforts.
this area. easing the rules on owner-ship of canada’s banks would likely lead to fewer domestic banks and greater foreign ownership. However, doing nothing is equally risky, as our industry will not be fully participating in the ongoing globalization of financial services and we could fall further behind.
The ontario ministry of economic development and Trade has recognized the importance of financial services to the province and is working with stake-holders to develop a strategy for the sector.
continue to pursue bilateral free trade agreements
free trade provides both specialized support and competitive pressure to enhance canada’s innovative capacity. free trade increases the size of markets available to support canada’s and ontario’s firms. our work shows that small market size in canada is an ongoing challenge to our productivity and innovation. This is a key reason why exporting to the united states has been so important to the success of ontario firms – the impact of increasing scale by adding us customers to our potential sales is huge.
free trade also strengthens the competitive pressure for our firms, workers, and managers to become more competitive. By opening our markets to more competitors, we increase rivalry from competing firms. That also exposes our firms to more sophisticated customers who provide pressure for greater upgrading and innovation.
capitalization. We concluded that Toronto’s financial services cluster benefits from an excellent foundation of geographic location, comparable costs, and sound macroeconomic conditions. moreover, the cluster can boast a well educated work force rela-tive to other ontario industries and a high incidence of professional designa-tions. it is well supported by related industries, especially in business services, information providers, and computer and communication services.
The cluster also benefits from demanding and sophisticated con-sumers of all kinds of financial services. us households and corporations demand greater quantity and quality of financial service providers than consumers in canada, but it is fair to say canadian consumers are among the world’s leaders in sophistication of demand.
The major challenge for the cluster is getting the regulatory environment right. The study concluded that, while our banks compete intensively in the domestic market, they have not devel-oped breakout strategies to place them among the world’s largest banks. By precluding foreign banks’ entry into the canadian market through the acquisi-tion route, our regulatory framework reduces the benefits of external forces to stimulate greater differentiation among our banks. in many cases in financial services and in other industries, global leaders have emerged from a domestic market that drives differenti-ated and innovative strategies.
it is discouraging that the federal government has not set bank mergers and ownership as a priority. There are no obvious risk free policies in

path to the 2020 prosperity agenda 57
interprovincial trade barriers are also impediments to our prosperity. The Bc-alberta Trade, investment, and Labour mobility agreement (TiLma) came into effect earlier this year and will be implemented over the next two years. among other things TiLma opens up municipal and provincial government procurement to suppliers in both provinces. it ensures that occupational standards in one province apply in the other and eliminate local presence requirements. as with international trade, a multilateral approach to reducing interprovincial barriers would be the best way to proceed. However, unless there is optimism that the canadian governments can improve results under the existing framework – the agreement on internal Trade – it is worth while for ontario to investigate the benefits of joining TiLma.
Our prosperity depends on market structures that balance support and competitive pressure for specialized innovation and upgrading. Too much support means a cushy environment focused on preserving the status quo. Too much pressure means a bleak environment for innovation. Ontario needs to work to find the right balance for both.


path to the 2020 prosperity agenda 59
Path to the 2020 Prosperity Agenda
We continue to conclude that the 2020 Prosperity Agenda we set out in last year’s Annual Report is the right one for Ontario and ought to be pursued vigorously.
The agenda is a long Term plan that will take years to implement and see results. But we can begin now. The ontario government with its renewed mandate is well placed to lead in taking up the challenge. But this challenge is for all ontarians; business leaders and ordinary citizens need to step up as well.
in the coming year, we challenge the government and all ontarians to take the first steps toward achieving our prosperity potential.
in the true spirit of innovation, we need to be pushing ourselves to find new ways to address prosperity issues. in many cases, we know that current approaches are not working. We are realistic enough to know that bold new ideas cannot be implemented in the public sphere overnight. But we now have the opportunity to propose new approaches, to discuss them with stakeholders in ontario’s prosperity, and to implement the most promising ideas.

60 task force on competitiveness, productivity and economic progress
raise awareness among all ontarians of the benefits of educationguidance counsellors, parents, and community leaders need to stress the benefits of more education. post secondary education is a means to escape poverty and improves intergen-erational mobility. yet research indicates that lower income canadians over esti-mate the costs and under estimate the benefits of post secondary education. in addition, our youth must understand the life-long risks they take by dropping out of high school without a diploma or a skilled trade.
continue investments in post secondary education This government has committed to greater post secondary education spending – but we need to sustain the momentum. We are not investing adequately to ensure that ontario is a world beater in innovation.
assess the tradeoff between research and the student experience in our universities as we step up our investments in post secondary education, we urge public policy leaders, academic leaders, and the research community to assess how well our current balance between research and the student experience are serving the needs of our schools, students, and society. We have a very strong research base in our universi-ties. The same is not true for the quality of our students’ experience. is there a tradeoff? or can we find innovative ways to achieve both?
step up investments in information and communication technology our businesses are not taking full advantage of the improvements that technology can make to their top and bottom lines. We challenge business leaders to invest in canadian technology and to take advantage of the strong canadian dollar to invest in technology from around the world.
We urge The premier and business,
labour, and communiTy leaders To
Turn up The Volume on The imporTance
of prosperiTy and producTiViTy.
achieving prosperity is not a problem most ontarians are thinking about. But we are missing opportunities to realize
our full potential and to ensure that we thrive, not just survive, in the global-ization of our economy. nor does the challenge of achieving higher produc-tivity capture the public’s imagination, largely because it is associated with ideas like efficiency, downsizing, and out sourcing. But we must have the
sustainable productivity growth that comes from innovation – creating unique products, services, and processes that truly add value to people’s lives. Higher productivity is our main opportunity for realizing our prosperity potential.
We encourage more inVesTmenT To
supporT high risk groups, enhance
educaTional opporTuniTies, and
upgrade Technology.
invest in focused and innovative ways to attack poverty The best weapon against poverty is a buoyant economy – an important reason for achieving our prosperity potential. But a significant share of the incidence of poverty is among high risk groups. each has its own challenges. for recent immigrants, the challenge is to match their skills with the economy’s requirements. for lone parents, it is how to create incentives to work, while providing high quality child care as well as early childhood education. for at risk youth, a key challenge is to encourage them to complete high school or to gain the skills that are in demand. There are examples of successful programs that have been developed here in ontario and elsewhere. We urge social service policy leaders to identify and implement them in other appropriate places – but also to challenge themselves to create innovative programs here in ontario
investment: focus on people and technology
attitudes: accept the challenge; overcome complacency
path to the 2020 prosperity agenda 61
onTario needs To readdress iTs Tax
regime, Which is among The WorsT in
The World.
remove the capital tax immediately This is a recurring recommendation of ours – and of most people who study tax policy. it denigrates ontario’s envi-ronment for new business investment, and this is why the government has already committed to end it in 2010. it should end the tax now.
pursue the adoption of a value added provincial tax, harmonized with the federal gsT The federal government has worsened the structure of canada’s tax system by reducing the gsT. ontario can
of those sweet spots where there is all benefit and no cost. The provincial government should review this research and determine if the conclusions are applicable to ontario.
continue attacking high marginal tax rates for lower income ontarians some progress is being made to reduce effective tax rates paid by low income earners. provincially, the expanded child Tax credit is helping; federally, the Working income Tax Benefit is a good beginning toward making tax incentives work for those who are climbing the income ladder. We need to continue our efforts to fix this problem.
mitigate this mistake by converting our retail sales tax to a value added tax. We recognize that this is a complex and challenging initiative. But ontario cannot compete globally and realize its prosperity potential if we are not open to radical changes in how we tax. We can do much good simply by following these best practices around the world. But we could do better if we challenged ourselves to implementing an innovative tax regime.
assess the revenue benefits of a reduction in corporate tax rates Jack mintz’s recent research suggests canada would actually generate more tax revenue if it reduced its corporate tax rates. in economic policy, this is one
foreign venture capitalists will help. The provincial government should assess whether or not changes to investment rules for pension funds will expand this source of venture capital without undue risk to pensioners’ investments.
continue to expand innovation policy to include building management capabilities The recently developed innovation strategy is a promising break from previous public innovation strategies as it acknowledges the importance of management capabilities and aims to enhance the “culture of commerce.” But it needs to go further in supporting the strengthening of management capa-bilities as a necessary complement to scientific and engineering talent.
pursue the reduction of barriers to investment and trade increasing opportunities for the freer flow of goods and services across national and provincial borders is an important source of support and pressure for innovation. The ontario government should continue to encourage federal efforts to expand international free trade agreements, lead national discussions on changing regulations in financial services, and investigate the benefits of joining the Bc-alberta TiLma.
implementing these initiatives will be challenging for all of us. but they will provide the first steps toward achieving our 2020 prosperity agenda – and increased well being for all.
We need sTrucTures ThaT proVide
specialized supporT and compeTiTiVe
pressure To enhance Value creaTion
Through unique producTs and
serVices ThaT lead To higher
producTiViTy and prosperiTy
focus venture capital efforts on quality, not quantity The government should continue on its plan to end special tax incentives for Labour sponsored investment funds. it should continue its efforts to raise the quality of our venture capital so that our entrepreneurs are supported well with the right amount of venture capital and the added value from good venture capitalists. recent changes by the federal government to ease entry of
motivations: pursue smarter taxation
structures: place a premium on creativity and innovation

62 task force on competitiveness, productivity and economic progress
arulampalam, Wiji, micheal p. devereux, and giorgia maffini (2007) “The incidence of corporate income Tax on Wages” oxford university centre for Business Taxation, oxford, Wp 07/07.
australian Bureau of statistics (2007), available online: http://www.abs.gov.au/
Bacolod, marigee and Barnardo Blum (2005) “Two sides of the same coin: us residual inequality and the gender gap” available online: http://www.rotman.utoronto.ca/bblum/personal/front.htm
Bacolod, marigee, Bernardo Blum, and William strange (2004) “skills in the city,” available online: http://www.rotman.utoronto.ca/bblum/personal/front.htm
Bank of canada (2007) rates and statistics. available online: http://www.bank-banque-canada.ca/en/rates/exchange.html
Beaulieu, e., k.J. mckenzie and J.f. Wen (2004) “do Taxes matter for firm Location? evidence from canadian provinces” mimeograph, university of chicago.
Bingley, paul, and gauthier Lanot (2002) “The incidence of income Tax on Wages and Labor supply,” Journal of Public Economics, elsevier, vol. 83(2), pp. 173-194.
Boudarbat, Brahim, Thomas Lemieux, and W. craig riddell (2006) “recent Trends in Wage inequality and the Wage structure in canada” in david green and Jonathan kesselman (eds.), Dimensions of Inequality in Canada. vancouver: university of British columbia press pp. 273-306.
canada millennium scholarship foundation (2004) “Low-income canadians’ perceptions of costs and benefits – a serious barrier to higher education,” mimeo. available online: http://www.millenniumscholarship.ca/en/
carneiro, pedro and James Heckman (2002) “The evidence on credit constraints in post-secondary schooling,” The Economic Journal, vol 112, no. 482, pp. 705-34.
chen, duanjie, Jack mintz, and andrey Tarasov (2007) “federal and provincial Tax reforms Let’s get Back on Track,” CD Howe Backgrounder No.102, c.d. Howe institute.
council of ontario universities (2007) common university data ontario (cudo). available online: http://www.cou.on.ca/_bin/relatedSites/cudo.cfm
cumming, douglas, Jeffrey macintosh, and keith godin (2007) “crowding out private equity: canadian evidence,” Fraser Alert, The fraser institute.
cumming, douglas (2007) “financing entrepreneurs,” C.D. Howe Institute Commentary No. 247, c.d. Howe institute.
eurostat (2007) available online: http://epp.eurostat.ec.europa.eu/
federal reserve Bank of dallas (2003) “2003 annual report – federal reserve Bank of dallas: riding a surge of Technology,” available online: http://www.dallasfed.org/fed/annual/2003/ar03c.html
ferrer, ana W., and W. craig riddell (2002) “The role of credentials in the canadian Labour market,” Canadian Journal of Economics, vol. 35, no.4.
frenette, marc (2007) “Why are youth from Lower-income families Less Likely to attend university? evidence from academic abilities, parental influences and financial constraints,” statistics canada, catalogue no. 11f0019 mie – no. 295, p.7.
Hall, robert e., and dale Jorgenson (1967) “Tax policy and investment Behavior,” American Economic Review, vol. 57.
institut national de la statistique et des Études (2007), available online: http://www.insee.fr/en/home/home_page.asp
instituto nacional de estadística (2007), available online: http://www.ine.es/
iorwerth, aled ab and Jeff danforth (2004) “is investment not sensitive to its user cost? The macro evidence revisited,” Working paper 2004-05, ottawa: department of finance.
Johnson, B., J.m. mankiya and L.a. yee (2005) “The next revolution in interactions,” McKinsey Quarterly, issue 4.
krugman, paul (1994) The Age of Diminished Expectations, cambridge, ma: The miT press.
Lavallée, Laval, Bert pereboom, and christiane grignon (2001) “access to postsecondary education and Labour market Transition of postsecondary students,” canada student Loan program, Hrdc, mimeo.
Lyle, greg (2007) “agenda for canada’s prosperity – canadian attitudes Towards prosperity,” innovative research group. presentation delivered at the conference on canada’s prosperity challenge. available online: http://www.competeprosper.ca/images/uploads/ICP_presentation_20070308_Lyle.pdf
martin, roger and James milway (2007) Enhancing the Productivity of Small and Medium Enterprises through Greater Adoption of Information and Communication Technology, information and communication Technology council, ottawa.
martin, roger, and James milway (2007) “strengthening management for prosperity,” institute for competitiveness & prosperity. available online: http://www.ictc-ctic.ca/uploadedFiles/Labour_Market_Intelligence/Enhancing-the-Productivity-of-SMEs.pdf
references

path to the 2020 prosperity agenda 63
milway, James, sana nisar, claurelle poole and ying Wang (2007) “assessing Toronto’s financial services cluster,” institute for competitiveness & prosperity. available online: http://www.competeprosper.ca/images/uploads/FSstudy_June07.pdf
mintz, Jack (2007) "2007 Tax competitiveness report: a call for comprehensive Tax reform," C.D. Howe Institute Commentary No. 254, c.d. Howe institute.
mintz, Jack, and andrey Tarasov (2007) “canada is missing out on global capital market integration,” c.d. Howe institute.
mooij, ruud a. de, and sjef ederveen (2006) “What a difference does it make? understanding the empirical literature on taxa-tion and international capital flows,” european commission economic papers, no. 261.
national science foundation, division of science resources statistics (2007) National Patterns of R&D Resources: 2006 Data Update. nsf 07-331. shackelford and John e. Jankowski, project officers. arlington, va.
nossal, kim richard (2006) “a question of balance: The cult of research intensively and the professing of political science in canada,” presidential address to the canadian political science association. available online: http://post.queensu.ca/~nossalk/papers/CPSA_Presidential_Address_2006.pdf
oecd (2006) OECD Territorial Reviews - Competitive Cities in the Global Economy, paris.
oecd (2006) OECD in Figures 2006-2007, paris.
omers submission to the ontario expert commission on pensions (2007) “closing the gap between pension regulation and best practices,” available online: http://www.omers.com/Assets/Plan+Governance/ExpertCommissiononPensionsReport.pdf
ontario ministry of research and innovation, strategic plan (2006). available online: http://www.mri.gov.on.ca/english/about/documents/strategyPlan.pdf
porter, michael e. (2006) “Building the microeconomic foundations of prosperity: findings from the Business competitiveness index,” in World economic forum, The Global Competitiveness Report 2006-2007. new york : palgrave macmillan. pp. 29-56.
porter, michael e. (2005) “Building the microeconomic foundations of prosperity: findings from the Business competitiveness index” in a. Lopez-claros (ed.), World economic forum, The Global Competitiveness Report 2005-2006. new york, ny: palgrave macmillan, pp. 43-78.
porter, michael e. (2002) “competition and antitrust: a productivity-Based approach,” institute for strategy and competitiveness. available online: http://www.isc.hbs.edu/053002antitrust.pdf
poschmann, finn (2004) “Background issues: marginal and average effective tax rates in ontario.” available online: http://www.competeprosper.ca/images/uploads/FinnPoschmann_290305.pdf
rahman, atiq, Jerry situ, and vicki Jimmo (2005) “participating in post secondary education: evidence from the survey of Labour and income dynamics,” statistics canada Working paper 21-595-mie2005036.
shanghai Jiao Tong university (2007) “academic ranking of World universities 2007,” available online: http://ed.sjtu.edu.cn/rank/2007/ARWU2007TOP500LIST.HTM
sharpe, andrew (2005) “What explains the canada-us icT investment intensity gap?” centre for the study of Living standards. available online: http://www.csls.ca
sharpe, andrew (2006) “The relationship between icT investment and productivity in the canadian economy: a review of the evidence,” centre for the study of Living standards.
source oecd (2007), available online: http://www.sourceoecd.org/
statistics Belgium (2007), available online: http://statbel.fgov.be/
statistics Bureau of Japan (2007), available online: http://www.stat.go.jp/english/data/index.htm
statistics canada (2007) cansim - various tables, available online: http://cansim2.statcan.ca/
statistics canada (2006) “education and earnings,” Perspectives on Labour and Income, vol. 38, no. 03.
statistischen Ämter des Bundes und der Länder (2007), available online: http://www.statistik-portal.de/Statistik-Portal/
Trefler, daniel (2004) “The Long and short of the canada-u.s. free Trade agreement,” American Economic Review, vol. 94, no.4.
Trefler, daniel (2007) “freer Trade: a path to Broad-Based prosperity,” presentation to conference on canada’s prosperity challenge. available online: http://www.competeprosper.ca/images/uploads/Trefler_OTF_FTA.pdf
Thomson financial databases (2007):– vc reporter (canadian venture capital
database). available online: http://www.canadavc.com
– ventureXpert (us venture capital database). available online: http://www.venturexpert.com
uk office for national statistics (2007), available online: http://www.statistics.gov.uk/
united states, department of commerce: – Bureau of economic analysis (2007)
regional economic accounts. available online: http://www.bea.gov
– census Bureau (2007) statistical abstract of the united states. available online: http://www.census.gov
united states, department of education (2007) national center for education statistics. integrated postsecondary education data system. available online: http://www.nces.ed.gov
united states, department of Labor, Bureau of Labor statistics: – current population survey (2007). available
online: http://www.bls.gov– occupational employment statistics (2007).
available online: http://www.bls.gov/oes
united states, executive office of the president of the united states, office of management and Budget (2007) 2007 Budget. available online: http://www.white-house.gov/omb
World economic forum (2006) The Global Competitiveness Report 2006-2007. new york : palgrave macmillan.

64 task force on competitiveness, productivity and economic progress
institute for competitiveness & prosperity
Working papersWorking paper 1 – A View of Ontario: Ontario’s Clusters of Innovation, april 2002
Working paper 2 – Measuring Ontario’s Prosperity: Developing an Economic Indicator System, august 2002
Working paper 3 – Missing opportunities: Ontario’s urban prosperity gap, June 2003
Working paper 4 – Striking similarities: Attitudes and Ontario’s prosperity gap, september 2003
Working paper 5 – Strengthening Structures: Upgrading specialized support and competitive pressure, July 2004
Working paper 6 – Reinventing innovation and commercialization policy in Ontario, october 2004
Working paper 7 – Taxing smarter for prosperity, march 2005
Working paper 8 – Fixing fiscal federalism, october 2005
Working paper 9 – Time on the job: Intensity and Ontario’s prosperity gap, september 2006
Working paper 10 – Prosperity, inequality and poverty, september 2007
reports on canadaPartnering for investment in Canada’s prosperity, January 2004
Realizing Canada’s prosperity potential, January 2005
Rebalancing priorities for Canada’s prosperity, march 2006
Agenda for Canada’s prosperity, march 2007
Task force on competitiveness, productivity and economic progress
first annual report – Closing the pros-perity gap, november 2002
second annual report – Investing for prosperity, november 2003
Third annual report – Realizing our prosperity potential, november 2004
fourth annual report – Rebalancing priorities for prosperity, november 2005
fifth annual report – Agenda for our prosperity, november 2006
should you wish to obtain a copy of one of the previous publications, please visit www.competeprosper.ca for an electronic version or contact the institute for competitiveness & prosperity directly for a hard copy.
Previous publications

The Task Force on Competitiveness, Productivity and Economic Progress was announced in the April 2001 Speech from the Throne. Its mandate is to measure and monitor Ontario’s competitiveness, productivity, and economic progress compared to other provinces and US states. In the 2004 Budget, the Government asked the Task Force to incorporate innovation and commercialization issues into its mandate. The Task Force reports directly to the public.
It is the aspiration of the Task Force to have a significant influence in increasing Ontario’s competitiveness, productivity, and capacity for innovation. This, we believe, will help ensure continued success in the creation of good jobs, increased prosperity, and a high quality of life for all Ontarians.
The Institute for Competitiveness & Prosperity is an independent organization established in 2001 to serve as the research arm of the Task Force. Working Papers and research published by the Institute are primarily intended to inform the work of the Task Force. In addition, they are designed to deepen public understanding of macro and microeconomic factors behind Ontario’s economic progress and stimulate debate on a range of issues related to competitiveness and prosperity.
Comments on this Sixth Annual Report are encouraged and should be directed to the Institute for Competitiveness & Prosperity. The Task Force and the Institute are funded by the Government of Ontario through the Ministry of Economic Development and Trade.
Copyright © November 2007
The Institute for Competitiveness & Prosperity
ISBN 978-0-9737377-9-0
How to contact us
To learn more about the Institute and the Task Force please visit us at: www.competeprosper.ca
Should you have any questions or comments, you may reach us through the web site or at the following address:
The Institute for Competitiveness & Prosperity180 Bloor Street West, Suite 1100Toronto, Ontario M5S 2V6Telephone 416.920.1921Fax 416.920.1922
Executive Director
James Milway416 920 1921 [email protected]
Researchers
Lance Bialas416 920 1921 [email protected]
Usman Naeem416 920 1921 [email protected] Sana Nisar416 920 1921 [email protected]
Daniela Scur 416 920 1921 [email protected]
Design Hambly & Woolley Inc. www.hamblywoolley.comIllustrations Dan Page
ChairmanRoger L. Martin
Joseph L. Rotman School of
Management
MembersJim Balsillie
Research in Motion Ltd.
Timothy Dattels
Newbridge Capital
Lisa de Wilde
TVOntario
David Folk
Jefferson Partners
Dr. Suzanne Fortier
Natural Sciences and Engineering
Research Council
Gordon Homer
Gordon J. Homer Advisory Services
David Johnston
University of Waterloo
David Keddie
National Compressed Air
Mark Mullins
Fraser Institute
Tim Penner
Procter & Gamble Inc.
Daniel Trefler
University of Toronto
Task Force on Competitiveness, Productivity and Economic Progress

AR
6AR
6 P
ath to the 2020 Prosp
erity Agend
a
Path to the 2020 Prosperity Agenda
ISBN 978-0-9737377-9-0
Task Force on Competitiveness, Productivity and Economic Progress
Task Force on Competitiveness, Productivity and Economic ProgressSIxTH ANNUAL REPORT, NOVEMBER 2007