ISAPS INTERNATIONAL SURVEY · The International Society of Aesthetic Plastic Surgery (ISAPS) issued...
ISAPS INTERNATIONAL SURVEY ON AESTHETIC/COSMETIC PROCEDURES PERFORMED IN 2017
Transcript of ISAPS INTERNATIONAL SURVEY · The International Society of Aesthetic Plastic Surgery (ISAPS) issued...

ISAPS INTERNATIONAL SURVEY O N A E S T H E T I C / C O S M E T I C PROCEDURES PERFORMED IN 2017

METHODOLOGY
Survey participants completed a questionnaire that primarily focused on the number of specific surgical and non-surgical procedures performed in 2017, along with some ancillary questions related to medical tourism.
The International Society of Aesthetic Plastic Surgery (ISAPS) issued an invitation to participate in the study to approximately 35,000 Plastic Surgeons whose contact information is housed in its proprietary database. In addition, a request was made that all National Societies encourage their members/constituents to take part in the survey.
Data from a total of 1,329 plastic surgeons were compiled for this survey.
Final figures have been projected to reflect international statistics and are exclusively based on the estimated number of Plastic Surgeons actively practicing in each country and the respondent sample. This International Survey is focused on physicians who are board certified (or national equivalent) Plastic Surgeons .
To aid in tallying the world-wide estimate of plastic surgeons, representatives from National Societies provided recent counts for 97% of the 43,500 total estimated plastic surgeons. For those cases in which the National Society did not provide its country's total, a regression model was used to estimate the number of plastic surgeons in the country based on its population size and Gross Domestic Product.Studies such as this must often address outlying responses. Though the outlying values may be legitimate, their presence can distort the averages, which provide the basis of the estimated projections. Significant outliers in this survey were adjusted in order to protect the
reasonableness of the extrapolated values. Additional standard data editing procedures were followed to ensure responses met survey guidelines. All reported data values have been analyzed for statistical reasonableness.
Country-specific data are only shown for those countries that provided a sufficient survey response for the figures to be considered valid. No adjustments other than standard data editing procedures were applied to country-specific results.
The International Survey on Aesthetic/Cosmetic Procedures Performed in 2017 was compiled, tabulated, and analyzed by Industry Insights, Inc. (www.industryinsights.com), an independent research firm based in Columbus, OH. The survey leader was Scott Hackworth, a CPA and data scientist who along with his firm has conducted various forms of research on trends in Aesthetic Plastic Surgery for more than 20 years.
1. It is important to note that Japan's figures were independently fielded and provided by Kotaro Yoshimura, M.D., Professor and Chair of the Department of Plastic Surgery, Jichi Medical University. Dr. Yoshimura expanded his sample beyond plastic surgeons, which could impact comparability among Japan and other listed countries.

PROCEDURES BY COUNTRY

Brow LiftEar SurgeryEyelid SurgeryFaceliftFacial Bone ContouringFat Grafting-faceNeck LiftRhinoplastyTotal Face & Head Procedures
249.343287.070
1.346.886465.29698.003
602.760263.219877.254
4.189.830
FACE & HEAD
Breast Augmentation— salineBreast Augmentation—siliconeBreast Augmentation—fat transferBreast Implant RemovalBreast LiftBreast ReductionGynecomastiaTotal Breast Procedures
70.6831.469.606
137.030169.553657.832489.146243.272
3.237.123
BREAST
Botulinum ToxinCalcium HydroxylapatiteHyaluronic AcidPoly-L-Lactic AcidTotal Injectables
5.033.693167.385
3.298.26672.852
8.572.196
INJECTABLESN O N - S U R G I C A L P R O C E D U R E S
S U R G I C A L P R O C E D U R E S
I N T E R N A T I O N A L S T U D Y O N A E S T H E T I C / C O S M E T I C
P R O C E D U R E S P E R F O R M E D I N 2 0 1 7
ESTIMATED NUMBER OF PLASTIC SURGEONS IN COUNTRY 43.500
Cellulite TreatmentHair RemovalNonsurgical Fat ReductionTattoo RemovalTreatment of Leg VeinsSclerotherapyTotal Other
Total Non-Surgical Procedures Total Procedures
267.556997.372478.739114.04775.45366.347
1.999.514
12.623.69423.390.542
OTHER
AbdominoplastyButtock Augmentation-implants onlyButtock Augmentation—fat transferButtock LiftLiposuctionLower Body LiftThigh LiftUpper Arm LiftUpper Body LiftLabiaplastyVaginal Rejuvenation Total Body & Extremities Procedures
Total Surgical Procedures
802.23436.859
335.63743.364
1.573.68088.02986.728
137.03029.488138.76568.081
4.189.830
10.766.848
BODY & EXTREMITIES
Chemical PeelFull Field AblativeMicro-Ablative ResurfacingDermabrasionMicrodermabrasionNonsurgical Skin TighteningPhoto RejuvenationTotal Facial Rejuvenation
357.753170.854214.65257.674
268.423436.675545.953
2.051.984
FACIAL REJUVENATION
WORLD-WIDE

Brow LiftEar SurgeryEyelid SurgeryFaceliftFacial Bone ContouringFat Grafting-faceNeck LiftRhinoplastyTotal Face & Head Procedures
26.24813.260
149.73683.572
7.27663.24032.43644.676
420.444
FACE & HEAD
Breast Augmentation— salineBreast Augmentation—siliconeBreast Augmentation—fat transferBreast Implant RemovalBreast LiftBreast ReductionGynecomastiaTotal Breast Procedures
41.616281.31622.30444.336139.67276.36423.868
629.476
BREAST
Botulinum ToxinCalcium HydroxylapatiteHyaluronic AcidPoly-L-Lactic AcidTotal Injectables
1.150.56046.036
676.39630.668
1.903.660
INJECTABLESN O N - S U R G I C A L P R O C E D U R E S
S U R G I C A L P R O C E D U R E S
I N T E R N A T I O N A L S T U D Y O N A E S T H E T I C / C O S M E T I C
P R O C E D U R E S P E R F O R M E D I N 2 0 1 7
ESTIMATED NUMBER OF PLASTIC SURGEONS IN COUNTRY 6.800
Cellulite TreatmentHair RemovalNonsurgical Fat ReductionTattoo RemovalTreatment of Leg VeinsSclerotherapyTotal Other
Total Non-Surgical Procedures Total Procedures
14.076177.140172.380
12.51211.0848.296
395.488
2.747.6764.310.180
OTHER
AbdominoplastyButtock Augmentation-implants onlyButtock Augmentation—fat transferButtock LiftLiposuctionLower Body LiftThigh LiftUpper Arm LiftUpper Body LiftLabiaplastyVaginal Rejuvenation Total Body & Extremities Procedures
Total Surgical Procedures
142.4601.700
27.6765.304
273.7009.1809.180
19.9923.33211.4928.568
512.584
1.562.504
BODY & EXTREMITIES
Chemical PeelFull Field AblativeMicro-Ablative ResurfacingDermabrasionMicrodermabrasionNonsurgical Skin TighteningPhoto RejuvenationTotal Facial Rejuvenation
85.47629.78461.4046.528
80.58067.320117.436
448.528
FACIAL REJUVENATION
USA

Brow LiftEar SurgeryEyelid SurgeryFaceliftFacial Bone ContouringFat Grafting-faceNeck LiftRhinoplastyTotal Face & Head Procedures
36.08041.910
159.72069.465
8.85576.890
44.00074.470
511.390
FACE & HEAD
Breast Augmentation— salineBreast Augmentation—siliconeBreast Augmentation—fat transferBreast Implant RemovalBreast LiftBreast ReductionGynecomastiaTotal Breast Procedures
6.050215.380
14.52013.915
104.99585.52532.505
472.890
BREAST
Botulinum ToxinCalcium HydroxylapatiteHyaluronic AcidPoly-L-Lactic AcidTotal Injectables
399.9054.290
254.37519.195
677.765
INJECTABLESN O N - S U R G I C A L P R O C E D U R E S
S U R G I C A L P R O C E D U R E S
I N T E R N A T I O N A L S T U D Y O N A E S T H E T I C / C O S M E T I C
P R O C E D U R E S P E R F O R M E D I N 2 0 1 7
ESTIMATED NUMBER OF PLASTIC SURGEONS IN COUNTRY 5.500
Cellulite TreatmentHair RemovalNonsurgical Fat ReductionTattoo RemovalTreatment of Leg VeinsSclerotherapyTotal Other
Total Non-Surgical Procedures Total Procedures
48.07057.25523.925
1.9254.2355.610
141.020
961.2902.427.535
OTHER
AbdominoplastyButtock Augmentation-implants onlyButtock Augmentation—fat transferButtock LiftLiposuctionLower Body LiftThigh LiftUpper Arm LiftUpper Body LiftLabiaplastyVaginal Rejuvenation Total Body & Extremities Procedures
Total Surgical Procedures
121.3858.525
64.7904.895
211.03512.98011.44015.3453.245
21.8356.490
481.965
1.466.245
BODY & EXTREMITIES
Chemical PeelFull Field AblativeMicro-Ablative ResurfacingDermabrasionMicrodermabrasionNonsurgical Skin TighteningPhoto RejuvenationTotal Facial Rejuvenation
35.97018.040
8.7457.2057.700
25.90538.940
142.505
FACIAL REJUVENATION
BRAZIL

Brow LiftEar SurgeryEyelid SurgeryFaceliftFacial Bone ContouringFat Grafting-faceNeck LiftRhinoplastyTotal Face & Head Procedures
556661
187.32634.5102.2097.521509
36.721270.014
FACE & HEAD
Breast Augmentation— salineBreast Augmentation—siliconeBreast Augmentation—fat transferBreast Implant RemovalBreast LiftBreast ReductionGynecomastiaTotal Breast Procedures
263.4604.265
889273266139
9.318
BREAST
Botulinum ToxinCalcium HydroxylapatiteHyaluronic AcidPoly-L-Lactic AcidTotal Injectables
253.8483.043
449.42447
706.362
INJECTABLESN O N - S U R G I C A L P R O C E D U R E S
S U R G I C A L P R O C E D U R E S
I N T E R N A T I O N A L S T U D Y O N A E S T H E T I C / C O S M E T I C
P R O C E D U R E S P E R F O R M E D I N 2 0 1 7
ESTIMATED NUMBER OF PLASTIC SURGEONS IN COUNTRY 2.650
Cellulite TreatmentHair RemovalNonsurgical Fat ReductionTattoo RemovalTreatment of Leg VeinsSclerotherapyTotal Other
Total Non-Surgical Procedures Total Procedures
2.236344.582
93.3629.672
571340
450.763
1.384.2141.678.610
OTHER
AbdominoplastyButtock Augmentation-implants onlyButtock Augmentation—fat transferButtock LiftLiposuctionLower Body LiftThigh LiftUpper Arm LiftUpper Body LiftLabiaplastyVaginal Rejuvenation Total Body & Extremities Procedures
Total Surgical Procedures
123235019
10.70311030416
3.624338
15.065
294.396
BODY & EXTREMITIES
Chemical PeelFull Field AblativeMicro-Ablative ResurfacingDermabrasionMicrodermabrasionNonsurgical Skin TighteningPhoto RejuvenationTotal Facial Rejuvenation
74.9274.282
23.2041.035
1.11935.213
87.309227.089
FACIAL REJUVENATION
JAPAN

Brow LiftEar SurgeryEyelid SurgeryFaceliftFacial Bone ContouringFat Grafting-faceNeck LiftRhinoplastyTotal Face & Head Procedures
16.40611.604
52.54620.29110.014
28.07617.84955.677
212.464
FACE & HEAD
Breast Augmentation— salineBreast Augmentation—siliconeBreast Augmentation—fat transferBreast Implant RemovalBreast LiftBreast ReductionGynecomastiaTotal Breast Procedures
95161.6104.9176.736
27.96117.0958.867
128.137
BREAST
Botulinum ToxinCalcium HydroxylapatiteHyaluronic AcidPoly-L-Lactic AcidTotal Injectables
228.3629.490
107.945410
346.206
INJECTABLESN O N - S U R G I C A L P R O C E D U R E S
S U R G I C A L P R O C E D U R E S
I N T E R N A T I O N A L S T U D Y O N A E S T H E T I C / C O S M E T I C
P R O C E D U R E S P E R F O R M E D I N 2 0 1 7
ESTIMATED NUMBER OF PLASTIC SURGEONS IN COUNTRY 1.650
Cellulite TreatmentHair RemovalNonsurgical Fat ReductionTattoo RemovalTreatment of Leg VeinsSclerotherapyTotal Other
Total Non-Surgical Procedures Total Procedures
20.61929.20715.0134.4093.3932.606
75.246
515.6621.036.618
OTHER
AbdominoplastyButtock Augmentation-implants onlyButtock Augmentation—fat transferButtock LiftLiposuctionLower Body LiftThigh LiftUpper Arm LiftUpper Body LiftLabiaplastyVaginal Rejuvenation Total Body & Extremities Procedures
Total Surgical Procedures
36.3863.868
35.2883.376
73.2314.9994.2298.0642.2954.5734.048
180.356
520.956
BODY & EXTREMITIES
Chemical PeelFull Field AblativeMicro-Ablative ResurfacingDermabrasionMicrodermabrasionNonsurgical Skin TighteningPhoto RejuvenationTotal Facial Rejuvenation
9.5236.0328.0971.901
21.12732.64914.882
94.210
FACIAL REJUVENATION
MEXICO

Brow LiftEar SurgeryEyelid SurgeryFaceliftFacial Bone ContouringFat Grafting-faceNeck LiftRhinoplastyTotal Face & Head Procedures
6.2709.975
45.2709.4051.470
21.0606.360
26.880126.690
FACE & HEAD
Breast Augmentation— salineBreast Augmentation—siliconeBreast Augmentation—fat transferBreast Implant RemovalBreast LiftBreast ReductionGynecomastiaTotal Breast Procedures
1.77048.240
4.0356.03018.2709.7956.705
94.845
BREAST
Botulinum ToxinCalcium HydroxylapatiteHyaluronic AcidPoly-L-Lactic AcidTotal Injectables
254.05519.800
242.3553.945
520.155
INJECTABLESN O N - S U R G I C A L P R O C E D U R E S
S U R G I C A L P R O C E D U R E S
I N T E R N A T I O N A L S T U D Y O N A E S T H E T I C / C O S M E T I C
P R O C E D U R E S P E R F O R M E D I N 2 0 1 7
ESTIMATED NUMBER OF PLASTIC SURGEONS IN COUNTRY 1.500
Cellulite TreatmentHair RemovalNonsurgical Fat ReductionTattoo RemovalTreatment of Leg VeinsSclerotherapyTotal Other
Total Non-Surgical Procedures Total Procedures
20.23528.905
11.1455.9403.0906.705
76.020
650.955952.830
OTHER
AbdominoplastyButtock Augmentation-implants onlyButtock Augmentation—fat transferButtock LiftLiposuctionLower Body LiftThigh LiftUpper Arm LiftUpper Body LiftLabiaplastyVaginal Rejuvenation Total Body & Extremities Procedures
Total Surgical Procedures
19.875375
3.7651.290
40.1251.6203.7954.290
7653.465
975
80.340
301.875
BODY & EXTREMITIES
Chemical PeelFull Field AblativeMicro-Ablative ResurfacingDermabrasionMicrodermabrasionNonsurgical Skin TighteningPhoto RejuvenationTotal Facial Rejuvenation
25.2007.5301.7101.170405
12.8855.880
54.780
FACIAL REJUVENATION
ITALY

Brow LiftEar SurgeryEyelid SurgeryFaceliftFacial Bone ContouringFat Grafting-faceNeck LiftRhinoplastyTotal Face & Head Procedures
7.0119.269
46.08611.8551.75016.5176.53711.166
110.190
FACE & HEAD
Breast Augmentation— salineBreast Augmentation—siliconeBreast Augmentation—fat transferBreast Implant RemovalBreast LiftBreast ReductionGynecomastiaTotal Breast Procedures
039.3346.8304.24516.73213.5489.235
89.925
BREAST
Botulinum ToxinCalcium HydroxylapatiteHyaluronic AcidPoly-L-Lactic AcidTotal Injectables
220.2114.460
137.9191.456
364.046
INJECTABLESN O N - S U R G I C A L P R O C E D U R E S
S U R G I C A L P R O C E D U R E S
I N T E R N A T I O N A L S T U D Y O N A E S T H E T I C / C O S M E T I C
P R O C E D U R E S P E R F O R M E D I N 2 0 1 7
ESTIMATED NUMBER OF PLASTIC SURGEONS IN COUNTRY 1.150
Cellulite TreatmentHair RemovalNonsurgical Fat ReductionTattoo RemovalTreatment of Leg VeinsSclerotherapyTotal Other
Total Non-Surgical Procedures Total Procedures
2.7893.590
10.6353.771858
2.22423.867
413.948704.880
OTHER
AbdominoplastyButtock Augmentation-implants onlyButtock Augmentation—fat transferButtock LiftLiposuctionLower Body LiftThigh LiftUpper Arm LiftUpper Body LiftLabiaplastyVaginal Rejuvenation Total Body & Extremities Procedures
Total Surgical Procedures
18.12090
1.7501.874
45.8712.5525.0245.7921.423
6.4801.840
90.817
290.932
BODY & EXTREMITIES
Chemical PeelFull Field AblativeMicro-Ablative ResurfacingDermabrasionMicrodermabrasionNonsurgical Skin TighteningPhoto RejuvenationTotal Facial Rejuvenation
2.8232.0551.4002.2028.7057.7221.129
26.035
FACIAL REJUVENATION
GERMANY

Brow LiftEar SurgeryEyelid SurgeryFaceliftFacial Bone ContouringFat Grafting-faceNeck LiftRhinoplastyTotal Face & Head Procedures
6.6008.540
26.82010.6703.450
16.3907.210
24.300103.980
FACE & HEAD
Breast Augmentation— salineBreast Augmentation—siliconeBreast Augmentation—fat transferBreast Implant RemovalBreast LiftBreast ReductionGynecomastiaTotal Breast Procedures
15043.3902.0305.100
22.31013.3705.600
91.950
BREAST
Botulinum ToxinCalcium HydroxylapatiteHyaluronic AcidPoly-L-Lactic AcidTotal Injectables
82.1202.540
40.60090
125.350
INJECTABLESN O N - S U R G I C A L P R O C E D U R E S
S U R G I C A L P R O C E D U R E S
I N T E R N A T I O N A L S T U D Y O N A E S T H E T I C / C O S M E T I C
P R O C E D U R E S P E R F O R M E D I N 2 0 1 7
ESTIMATED NUMBER OF PLASTIC SURGEONS IN COUNTRY 1.000
Cellulite TreatmentHair RemovalNonsurgical Fat ReductionTattoo RemovalTreatment of Leg VeinsSclerotherapyTotal Other
Total Non-Surgical Procedures Total Procedures
4.0406.0305.580
970580400
17.600
170.790516.930
OTHER
AbdominoplastyButtock Augmentation-implants onlyButtock Augmentation—fat transferButtock LiftLiposuctionLower Body LiftThigh LiftUpper Arm LiftUpper Body LiftLabiaplastyVaginal Rejuvenation Total Body & Extremities Procedures
Total Surgical Procedures
31.3603.640
28.9401.120
65.7002.5203.160
3.0601.0705.5504.090
150.210
346.140
BODY & EXTREMITIES
Chemical PeelFull Field AblativeMicro-Ablative ResurfacingDermabrasionMicrodermabrasionNonsurgical Skin TighteningPhoto RejuvenationTotal Facial Rejuvenation
2.4003.8204.2101.120
8.7205.0602.510
27.840
FACIAL REJUVENATION
COLOMBIA

Brow LiftEar SurgeryEyelid SurgeryFaceliftFacial Bone ContouringFat Grafting-faceNeck LiftRhinoplastyTotal Face & Head Procedures
3.8412.411
19.7434.3192.8425.0432.798
21.26062.257
FACE & HEAD
Breast Augmentation— salineBreast Augmentation—siliconeBreast Augmentation—fat transferBreast Implant RemovalBreast LiftBreast ReductionGynecomastiaTotal Breast Procedures
1814.234
3621.5964.2642.4801.245
24.200
BREAST
Botulinum ToxinCalcium HydroxylapatiteHyaluronic AcidPoly-L-Lactic AcidTotal Injectables
13.25372
3.41743
16.786
INJECTABLESN O N - S U R G I C A L P R O C E D U R E S
S U R G I C A L P R O C E D U R E S
I N T E R N A T I O N A L S T U D Y O N A E S T H E T I C / C O S M E T I C
P R O C E D U R E S P E R F O R M E D I N 2 0 1 7
ESTIMATED NUMBER OF PLASTIC SURGEONS IN COUNTRY 350
Cellulite TreatmentHair RemovalNonsurgical Fat ReductionTattoo RemovalTreatment of Leg VeinsSclerotherapyTotal Other
Total Non-Surgical Procedures Total Procedures
01.079
51015980
2822.110
23.056128.398
OTHER
AbdominoplastyButtock Augmentation-implants onlyButtock Augmentation—fat transferButtock LiftLiposuctionLower Body LiftThigh LiftUpper Arm LiftUpper Body LiftLabiaplastyVaginal Rejuvenation Total Body & Extremities Procedures
Total Surgical Procedures
4.380246449239
9.264988529
1.061308
1.104319
18.886
105.342
BODY & EXTREMITIES
Chemical PeelFull Field AblativeMicro-Ablative ResurfacingDermabrasionMicrodermabrasionNonsurgical Skin TighteningPhoto RejuvenationTotal Facial Rejuvenation
18282
0264
0264
3.3304.159
FACIAL REJUVENATION
THAILAND

TOTALS RANKED BY CATEGORY 17

TOTAL FACE & HEAD PROCEDURES
Rank* Country: % of World-Wide Total
1. Brazil 511.390 12,2%
2. USA 420.444 10,0%
3. Japan 270.014 6,4%
4. Mexico 212.464 5,1%
5. Italy 126.690 3,0%
6. Germany 110.190 2,6%
7. Colombia 103.980 2,5%
8. Thailand 62.257 1,5%
TOTAL BREAST PROCEDURES
Rank* Country: % of World-Wide Total
1. USA 629.476 19,4%
2. Brazil 472.890 14,6%
3. Mexico 128.137 4,0%
4. Italy 94.845 2,9%
5. Colombia 91.950 2,8%
6. Germany 89.925 2,8%
7. Thailand 24.200 0,7%
8. Japan 9.318 0,3%
* Rankings are based solely on those countries from which a sufficient survey response was received and data were considered to be representative.

TOTAL BODY & EXTREMITIES
Rank* Country: % of World-Wide Total
1. USA 512.584 15,3%
2. Brazil 481.965 14,4%
3. Mexico 180.356 5,4%
4. Colombia 150.210 4,5%
5. Germany 90.817 2,7%
6. Italy 80.340 2,4%
7. Thailand 18.886 0,6%
8. Japan 15.065 0,5%
TOTAL SURGICAL PROCEDURES
Rank* Country: % of World-Wide Total
1. USA 1.562.504 14,5%
2. Brazil 1.466.245 13,6%
3. Mexico 520.956 4,8%
4. Colombia 346.140 3,2%
5. Italy 301.875 2,8%
6. Japan 294.396 2,7%
7. Germany 290.932 2,7%
8. Thailand 105.342 1,0%
* Rankings are based solely on those countries from which a sufficient survey response was received and data were considered to be representative.

TOTAL INJECTIBLES
Rank* Country: % of World-Wide Total
1. USA 1.903.660 22,2%
2. Japan 706.362 8,2%
3. Brazil 677.765 7,9%
4. Italy 520.155 6,1%
5. Germany 364.046 4,2%
6. Mexico 346.206 4,0%
7. Colombia 125.350 1,5%
8. Thailand 16.786 0,2%
TOTAL FACIAL REJUVENATION
Rank* Country: % of World-Wide Total
1. USA 448.528 21,9%
2. Japan 227.089 11,1%
3. Brazil 142.505 6,9%
4. Mexico 94.210 4,6%
5. Italy 54.780 2,7%
6. Colombia 27.840 1,4%
7. Germany 26.035 1,3%
8. Thailand 4.159 0,2%
* Rankings are based solely on those countries from which a sufficient survey response was received and data were considered to be representative.

TOTAL OTHER NON-SURGICAL
Rank* Country: % of World-Wide Total
1. Japan 450.763 22,5%
2. USA 395.488 19,8%
3. Brazil 141.020 7,1%
4. Italy 76.020 3,8%
5. Mexico 75.246 3,8%
6. Germany 23.867 1,2%
7. Colombia 17.600 0,9%
8. Thailand 2.110 0,1%
TOTAL NON-SURGICAL PROCEDURES
Rank* Country: % of World-Wide Total
1. USA 2.747.676 21,8%
2. Japan 1.384.214 11,0%
3. Brazil 961.290 7,6%
4. Italy 650.955 5,2%
5. Mexico 515.662 4,1%
6. Germany 413.948 3,3%
7. Colombia 170.790 1,4%
8. Thailand 23.056 0,2%
* Rankings are based solely on those countries from which a sufficient survey response was received and data were considered to be representative.

TOTAL PROCEDURES
Rank* Country: % of World-Wide Total
1. USA 4.310.180 18,4%
2. Brazil 2.427.535 10,4%
3. Japan 1.678.610 7,2%
4. Mexico 1.036.618 4,4%
5. Italy 952.830 4,1%
6. Germany 704.880 3,0%
7. Colombia 516.930 2,2%
8. Thailand 128.398 0,5%
* Rankings are based solely on those countries from which a sufficient survey response was received and data were considered to be representative.

YEAR-TO-YEAR COMPARISONS:2017 VS. 2016

I S A P I N T E R N A T I O N A L S T U D Y O N A E S T H E T I C / C O S M E T I C
P R O C E D U R E S P E R F O R M E D I N 2 0 1 7
TOTAL PROCEDURES DECREASED BY -1% IN 2017
TOTAL SURGICAL PROCEDURES INCREASED BY 4% IN 2017
The International Society of Aesthetic Plastic Surgery (ISAPS). For a full list of Global Aesthetic Survey Results please visit www.isaps.org.
T O T A L F A C EA N D B O D Y
P R O C E D U R E SI N C R E A S E D B Y
1%Brow LiftEar SurgeryEyelid SurgeryFaceliftFacial Bone ContouringFat Grafting-faceNeck LiftRhinoplasty
-6%-5%-1%8%
-12%0%-1%11%1%
T O T A L B R E A S T P R O C E D U R E S
I N C R E A S E D B Y
4%Breast Augmentation— salineBreast Augmentation—siliconeBreast Augmentation—fat transferBreast Implant RemovalBreast LiftBreast ReductionGynecomastia
13%0%
-2%8%12%4%2%
T O T A L B O D Y &E X T R E M I T I E S P R O C E D U R E S
I N C R E A S E D B Y
7%AbdominoplastyButtock Augmentation-implants onlyButtock Augmentation—fat transferButtock LiftLiposuctionLower Body LiftThigh Lift Upper Arm LiftUpper Body LiftLabiaplastyVaginal Rejuvenation
3%
17%
11%16%7%
21%8%8%2%0%
22%

I S A P I N T E R N A T I O N A L S T U D Y O N A E S T H E T I C / C O S M E T I C
P R O C E D U R E S P E R F O R M E D I N 2 0 1 7
TOTAL PROCEDURES DECREASED BY -1% IN 2017
TOTAL NON-SURGICAL PROCEDURES DECREASED BY -5% IN 2017
The International Society of Aesthetic Plastic Surgery (ISAPS). For a full list of Global Aesthetic Survey Results please visit www.isaps.org.
T O T A L F A C I A LR E J U V E N A T I O N D E C R E A S E D B Y
-20% Chemical Peel Full Field Ablative Micro-Ablative Resurfacing Dermabrasion Microdermabrasion Nonsurgical Skin Tightening Photo Rejuvenation
-40%-20%
16%0%
-27%-16%-13%
T O T A L I N J E C T I B L E S
D E C R E A S E D B Y
-1% Botulinum Toxin Calcium Hydroxylapatite Hyaluronic Acid Poly-L-Lactic Acid
1%1%
-3%-9%
FACE & HEAD
Brow Lift 261.663 249.343 -5% -6%
Ear Surgery 298.975 287.070 -4% -5%
Eyelid Surgery 1.347.509 1.346.886 0% -1%
Facelift 427.065 465.296 9% 8%
Facial Bone Contouring 109.775 98.003 -11% -12%
Fat Grafting-face 596.836 602.760 1% 0%
Neck Lift 264.050 263.219 0% -1%
Rhinoplasty 786.852 877.254 11% 11%
Total Face & Head Procedures 4.092.725 4.189.830 2% 1%
BREAST
Breast Augmentation— saline 61.780 70.683 14% 13%
Breast Augmentation—silicone 1.449.337 1.469.606 1% 0%
Breast Augmentation—fat transfer 138.154 137.030 -1% -2%
Breast Implant Removal 155.453 169.553 9% 8%
Breast Lift 583.192 657.832 13% 12%
Breast Reduction 465.665 489.146 5% 4%
Gynecomastia 236.371 243.272 3% 2%
Total Breast Procedures 3.089.952 3.237.123 5% 4%
TOTAL PROCEDURES 2016 2017 % Change (overall volume)
% Change (for average surgeon)
Estimated Number of Plastic Surgeons 43.100 43.500 1% increase

BODY & EXTREMITIES
Abdominoplasty 769.067 802.234 4% 3%
Buttock Augmentation-implants only 31.330 36.859 18% 17%
Buttock Augmentation—fat transfer 300.791 335.637 12% 11%
Buttock Lift 37.157 43.364 17% 16%
Liposuction 1.453.340 1.573.680 8% 7%
Lower Body Lift 72.253 88.029 22% 21%
Thigh Lift 79.476 86.728 9% 8%
Upper Arm Lift 125.557 137.030 9% 8%
Upper Body Lift 28.595 29.488 3% 2%
Labiaplasty 138.033 138.765 1% 0%
Vaginal Rejuvenation 55.606 68.081 22% 22%
Total Body & Extremities Procedures 3.091.205 3.339.895 8% 7%
TOTAL PROCEDURES 2016 2017 % Change (overall volume)
% Change (for average surgeon)
Estimated Number of Plastic Surgeons 43.100 43.500 1% increase
TOTAL SURGICAL PROCEDURES 10.273.882 10.766.848 5% 4%

TOTAL PROCEDURES 2016 2017 % Change (overall volume)
% Change (for average surgeon)
Estimated Number of Plastic Surgeons 43.100 43.500 1% increase
INJECTABLES
Botulinum Toxin 4.931.577 5.033.693 2% 1%
Calcium Hydroxylapatite 164.911 167.385 2% 1%
Hyaluronic Acid 3.372.445 3.298.266 -2% -3%
Poly-L-Lactic Acid 79.664 72.852 -9% -9%
Total Injectables 8.548.597 8.572.196 0% -1%
FACIAL REJUVENATION
Chemical Peel 585.614 357.753 -39% -40%
Full Field Ablative 210.844 170.854 -19% -20%
Micro-Ablative Resurfacing 183.432 214.652 17% 16%
Dermabrasion 57.334 57.674 1% 0%
Microdermabrasion 361.070 268.423 -26% -27%
Nonsurgical Skin Tightening 511.481 436.675 -15% -16%
Photo Rejuvenation 623.243 545.953 -12% -13%
Total Facial Rejuvenation 2.533.017 2.051.984 -19% -20%

OTHER
Cellulite Treatment 247.696 267.556 8% 7%
Hair Removal 1.146.523 997.372 -13% -14%
Nonsurgical Fat Reduction 433.351 478.739 10% 10%
Tattoo Removal 149.533 114.047 -24% -25%
Treatment of Leg Veins 68.563 75.453 10% 9%
Sclerotherapy 69.355 66.347 -4% -5%
Total Other 2.115.021 1.999.514 -5% -6%
TOTAL PROCEDURES 2016 2017 % Change (overall volume)
% Change (for average surgeon)
Estimated Number of Plastic Surgeons 43.100 43.500 1% increase
TOTAL NONSURGICAL PROCEDURES 13.196.634 12.623.694 -4% -5%
TOTAL PROCEDURES 23.470.517 23.390.542 0% -1%

COUNTRIES RANKED BY ESTIMATED NUMBER OF PLASTIC SURGEONS
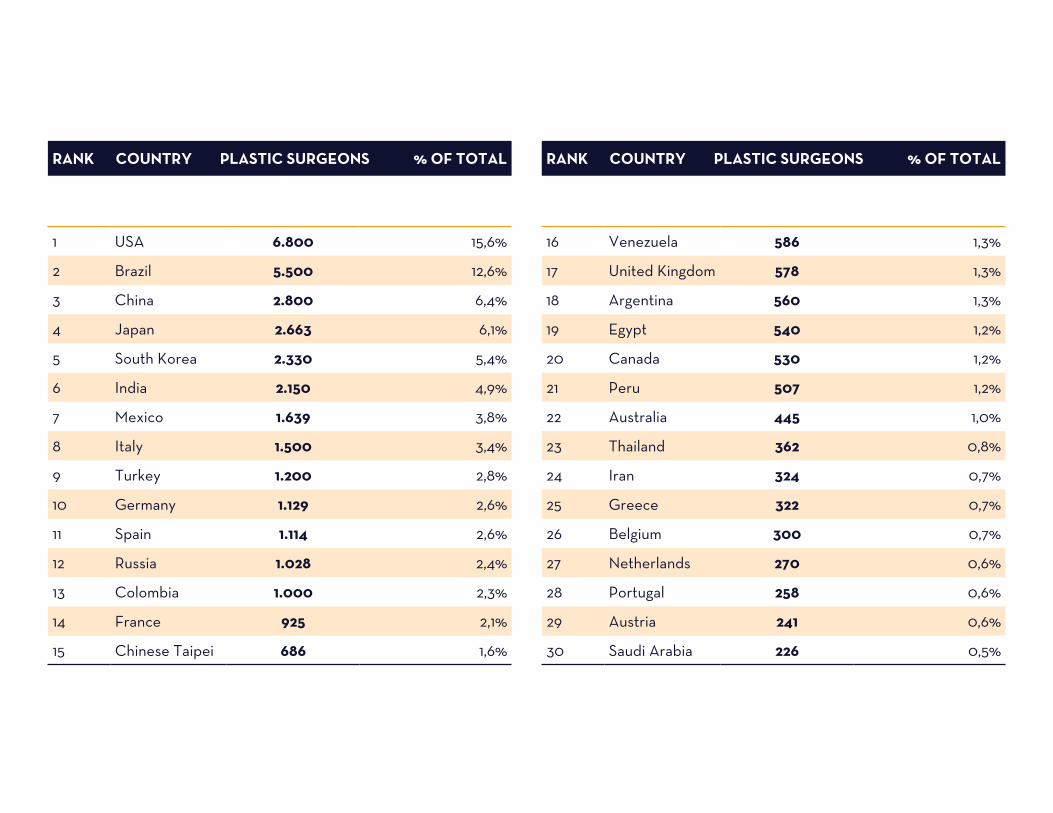
1 USA 6.800 15,6%
2 Brazil 5.500 12,6%
3 China 2.800 6,4%
4 Japan 2.663 6,1%
5 South Korea 2.330 5,4%
6 India 2.150 4,9%
7 Mexico 1.639 3,8%
8 Italy 1.500 3,4%
9 Turkey 1.200 2,8%
10 Germany 1.129 2,6%
11 Spain 1.114 2,6%
12 Russia 1.028 2,4%
13 Colombia 1.000 2,3%
14 France 925 2,1%
15 Chinese Taipei 686 1,6%
RANK COUNTRY PLASTIC SURGEONS % OF TOTAL
16 Venezuela 586 1,3%
17 United Kingdom 578 1,3%
18 Argentina 560 1,3%
19 Egypt 540 1,2%
20 Canada 530 1,2%
21 Peru 507 1,2%
22 Australia 445 1,0%
23 Thailand 362 0,8%
24 Iran 324 0,7%
25 Greece 322 0,7%
26 Belgium 300 0,7%
27 Netherlands 270 0,6%
28 Portugal 258 0,6%
29 Austria 241 0,6%
30 Saudi Arabia 226 0,5%
RANK COUNTRY PLASTIC SURGEONS % OF TOTAL

PERCENT OF PLASTIC SURGEONS PERFORMING EACH PROCEDURE

Brow LiftEar SurgeryEyelid SurgeryFaceliftFacial Bone ContouringFat Grafting-faceNeck LiftRhinoplasty
201763%77%92%80%40%74%63%78%
201665%81%94%80%40%77%65%81%
AbdominoplastyButtock Augmentation—implants onlyButtock Augmentation—fat transferButtock LiftLiposuctionLower Body LiftThigh LiftUpper Arm LiftUpper Body LiftLabiaplastyVaginal Rejuvenation
201789%
19%
54%26%90%34%49%63%20%54%19%
201688%
19%
54%24%92%33%47%62%19%54%21%
Breast Augmentation— salineBreast Augmentation—siliconeBreast Augmentation—fat transferBreast Implant RemovalBreast LiftBreast ReductionGynecomastia
201715%
90%
49%75%86%87%78%
201612%91%
47%74%85%85%81%
Chemical PeelFull Field AblativeMicro-Ablative ResurfacingDermabrasionMicrodermabrasionNonsurgical Skin TighteningPhoto Rejuvenation
201731%22%14%
20%14%21%18%
201631%21%14%20%15%21%17%
Cellulite TreatmentHair RemovalNonsurgical Fat ReductionTattoo RemovalTreatment of Leg VeinsSclerotherapy
201713%21%19%17%9%
12%
201614%22%18%23%10%12%Botulinum Toxin
Calcium HydroxylapatiteHyaluronic AcidPoly-L-Lactic Acid
201783%20%78%12%
201685%19%82%9%
FACE & HEAD
BREAST
INJECTABLESN O N - S U R G I C A L P R O C E D U R E S
S U R G I C A L P R O C E D U R E S
I N T E R N A T I O N A L S T U D Y O N A E S T H E T I C / C O S M E T I C
P R O C E D U R E S P E R F O R M E D I N 2 0 1 7
PERCENT OF PLASTIC SURGEONS PERFORMING EACH PROCEDURE
OTHER
BODY & EXTREMITIES FACIAL
REJUVENATION
WORLD-WIDE

Brow LiftEar SurgeryEyelid SurgeryFaceliftFacial Bone ContouringFat Grafting-faceNeck LiftRhinoplasty
59%54%84%82%39%61%
60%60%
AbdominoplastyButtock Augmentation—implants onlyButtock Augmentation—fat transferButtock LiftLiposuctionLower Body LiftThigh LiftUpper Arm LiftUpper Body LiftLabiaplastyVaginal Rejuvenation
88%6%
45%26%89%32%41%64%16%36%10%
Breast Augmentation— salineBreast Augmentation—siliconeBreast Augmentation—fat transferBreast Implant RemovalBreast LiftBreast ReductionGynecomastia
65%86%40%85%86%84%72%
Chemical PeelFull Field AblativeMicro-Ablative ResurfacingDermabrasionMicrodermabrasionNonsurgical Skin TighteningPhoto Rejuvenation
41%31%22%19%
20%20%30%
Cellulite TreatmentHair RemovalNonsurgical Fat ReductionTattoo RemovalTreatment of Leg VeinsSclerotherapy
11%23%27%10%9%
13%Botulinum ToxinCalcium HydroxylapatiteHyaluronic AcidPoly-L-Lactic Acid
77%31%72%28%
FACE & HEAD
BREAST
INJECTABLESN O N - S U R G I C A L P R O C E D U R E S
S U R G I C A L P R O C E D U R E S
I N T E R N A T I O N A L S T U D Y O N A E S T H E T I C / C O S M E T I C
P R O C E D U R E S P E R F O R M E D I N 2 0 1 7
PERCENT OF PLASTIC SURGEONS PERFORMING EACH PROCEDURE
OTHER
BODY & EXTREMITIES FACIAL
REJUVENATION
USA

Brow LiftEar SurgeryEyelid SurgeryFaceliftFacial Bone ContouringFat Grafting-faceNeck LiftRhinoplasty
64%83%91%87%34%71%72%87%
AbdominoplastyButtock Augmentation—implants onlyButtock Augmentation—fat transferButtock LiftLiposuctionLower Body LiftThigh LiftUpper Arm LiftUpper Body LiftLabiaplastyVaginal Rejuvenation
93%34%75%21%92%34%48%58%23%68%24%
Breast Augmentation— salineBreast Augmentation—siliconeBreast Augmentation—fat transferBreast Implant RemovalBreast LiftBreast ReductionGynecomastia
3%94%43%61%
89%92%81%
Chemical PeelFull Field AblativeMicro-Ablative ResurfacingDermabrasionMicrodermabrasionNonsurgical Skin TighteningPhoto Rejuvenation
29%13%9%
25%6%
10%11%
Cellulite TreatmentHair RemovalNonsurgical Fat ReductionTattoo RemovalTreatment of Leg VeinsSclerotherapy
19%14%14%6%5%5%Botulinum Toxin
Calcium HydroxylapatiteHyaluronic AcidPoly-L-Lactic Acid
81%10%79%25%
FACE & HEAD
BREAST
INJECTABLESN O N - S U R G I C A L P R O C E D U R E S
S U R G I C A L P R O C E D U R E S
I N T E R N A T I O N A L S T U D Y O N A E S T H E T I C / C O S M E T I C
P R O C E D U R E S P E R F O R M E D I N 2 0 1 7
PERCENT OF PLASTIC SURGEONS PERFORMING EACH PROCEDURE
OTHER
BODY & EXTREMITIES FACIAL
REJUVENATION
BRAZIL

Brow LiftEar SurgeryEyelid SurgeryFaceliftFacial Bone ContouringFat Grafting-faceNeck LiftRhinoplasty
79%87%96%91%65%88%82%96%
AbdominoplastyButtock Augmentation—implants onlyButtock Augmentation—fat transferButtock LiftLiposuctionLower Body LiftThigh LiftUpper Arm LiftUpper Body LiftLabiaplastyVaginal Rejuvenation
97%42%91%41%96%48%55%79%29%64%28%
Breast Augmentation— salineBreast Augmentation—siliconeBreast Augmentation—fat transferBreast Implant RemovalBreast LiftBreast ReductionGynecomastia
4%97%50%82%93%90%90%
Chemical PeelFull Field AblativeMicro-Ablative ResurfacingDermabrasionMicrodermabrasionNonsurgical Skin TighteningPhoto Rejuvenation
28%16%15%18%25%25%13%
Cellulite TreatmentHair RemovalNonsurgical Fat ReductionTattoo RemovalTreatment of Leg VeinsSclerotherapy
21%18%18%
20%11%11%Botulinum Toxin
Calcium HydroxylapatiteHyaluronic AcidPoly-L-Lactic Acid
96%29%86%
6%
FACE & HEAD
BREAST
INJECTABLESN O N - S U R G I C A L P R O C E D U R E S
S U R G I C A L P R O C E D U R E S
I N T E R N A T I O N A L S T U D Y O N A E S T H E T I C / C O S M E T I C
P R O C E D U R E S P E R F O R M E D I N 2 0 1 7
PERCENT OF PLASTIC SURGEONS PERFORMING EACH PROCEDURE
OTHER
BODY & EXTREMITIES FACIAL
REJUVENATION
MEXICO
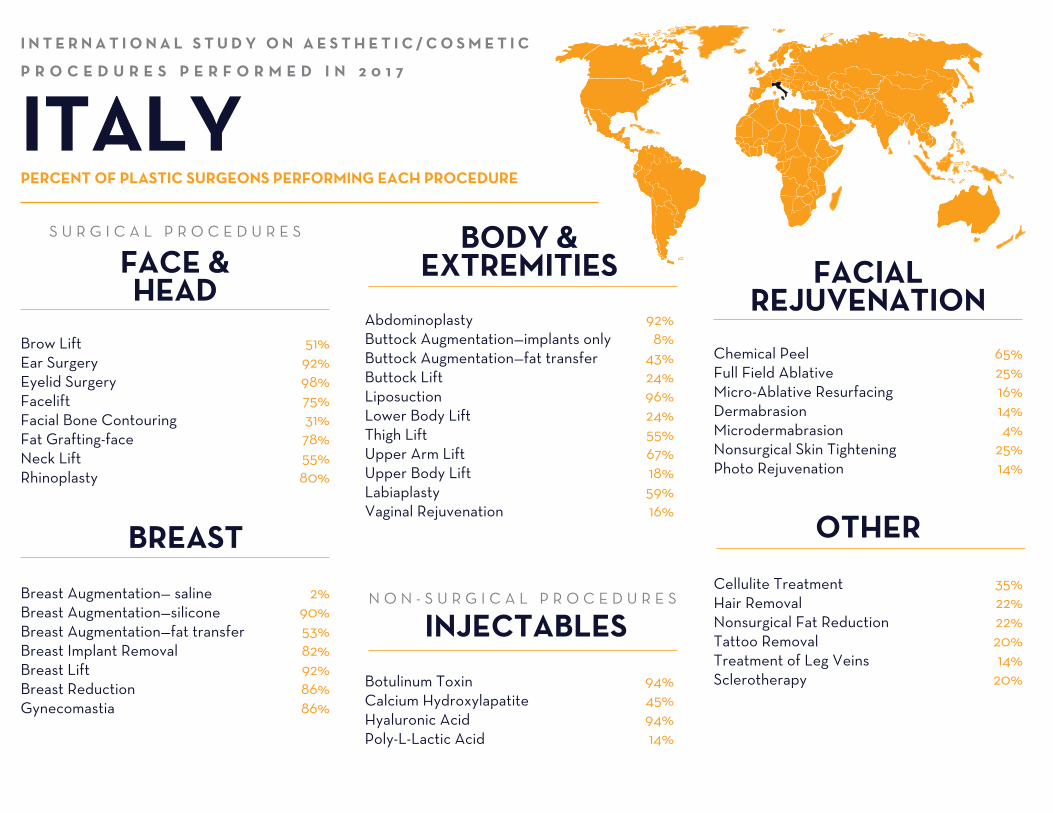
Brow LiftEar SurgeryEyelid SurgeryFaceliftFacial Bone ContouringFat Grafting-faceNeck LiftRhinoplasty
51%92%98%75%31%78%55%80%
AbdominoplastyButtock Augmentation—implants onlyButtock Augmentation—fat transferButtock LiftLiposuctionLower Body LiftThigh LiftUpper Arm LiftUpper Body LiftLabiaplastyVaginal Rejuvenation
92%8%
43%24%96%24%55%67%18%59%16%
Breast Augmentation— salineBreast Augmentation—siliconeBreast Augmentation—fat transferBreast Implant RemovalBreast LiftBreast ReductionGynecomastia
2%90%53%82%92%86%86%
Chemical PeelFull Field AblativeMicro-Ablative ResurfacingDermabrasionMicrodermabrasionNonsurgical Skin TighteningPhoto Rejuvenation
65%25%16%14%4%
25%14%
Cellulite TreatmentHair RemovalNonsurgical Fat ReductionTattoo RemovalTreatment of Leg VeinsSclerotherapy
35%22%22%20%14%
20%Botulinum ToxinCalcium HydroxylapatiteHyaluronic AcidPoly-L-Lactic Acid
94%45%94%14%
FACE & HEAD
BREAST
INJECTABLESN O N - S U R G I C A L P R O C E D U R E S
S U R G I C A L P R O C E D U R E S
I N T E R N A T I O N A L S T U D Y O N A E S T H E T I C / C O S M E T I C
P R O C E D U R E S P E R F O R M E D I N 2 0 1 7
PERCENT OF PLASTIC SURGEONS PERFORMING EACH PROCEDURE
OTHER
BODY & EXTREMITIES FACIAL
REJUVENATION
ITALY

Brow LiftEar SurgeryEyelid SurgeryFaceliftFacial Bone ContouringFat Grafting-faceNeck LiftRhinoplasty
68%71%
95%79%37%71%
68%47%
AbdominoplastyButtock Augmentation—implants onlyButtock Augmentation—fat transferButtock LiftLiposuctionLower Body LiftThigh LiftUpper Arm LiftUpper Body LiftLabiaplastyVaginal Rejuvenation
89%5%
47%34%89%39%63%74%26%58%16%
Breast Augmentation— salineBreast Augmentation—siliconeBreast Augmentation—fat transferBreast Implant RemovalBreast LiftBreast ReductionGynecomastia
0%84%63%76%79%84%79%
Chemical PeelFull Field AblativeMicro-Ablative ResurfacingDermabrasionMicrodermabrasionNonsurgical Skin TighteningPhoto Rejuvenation
21%11%8%
24%24%24%
5%
Cellulite TreatmentHair RemovalNonsurgical Fat ReductionTattoo RemovalTreatment of Leg VeinsSclerotherapy
16%8%
29%18%5%
16%Botulinum ToxinCalcium HydroxylapatiteHyaluronic AcidPoly-L-Lactic Acid
95%26%92%11%
FACE & HEAD
BREAST
INJECTABLESN O N - S U R G I C A L P R O C E D U R E S
S U R G I C A L P R O C E D U R E S
I N T E R N A T I O N A L S T U D Y O N A E S T H E T I C / C O S M E T I C
P R O C E D U R E S P E R F O R M E D I N 2 0 1 7
PERCENT OF PLASTIC SURGEONS PERFORMING EACH PROCEDURE
OTHER
BODY & EXTREMITIES FACIAL
REJUVENATION
GERMANY

Brow LiftEar SurgeryEyelid SurgeryFaceliftFacial Bone ContouringFat Grafting-faceNeck LiftRhinoplasty
70%94%99%87%57%90%79%96%
AbdominoplastyButtock Augmentation—implants onlyButtock Augmentation—fat transferButtock LiftLiposuctionLower Body LiftThigh LiftUpper Arm LiftUpper Body LiftLabiaplastyVaginal Rejuvenation
99%57%81%22%99%42%61%67%31%73%36%
Breast Augmentation— salineBreast Augmentation—siliconeBreast Augmentation—fat transferBreast Implant RemovalBreast LiftBreast ReductionGynecomastia
1%100%
31%87%96%97%85%
Chemical PeelFull Field AblativeMicro-Ablative ResurfacingDermabrasionMicrodermabrasionNonsurgical Skin TighteningPhoto Rejuvenation
22%24%18%24%19%24%
7%
Cellulite TreatmentHair RemovalNonsurgical Fat ReductionTattoo RemovalTreatment of Leg VeinsSclerotherapy
16%15%12%16%7%4%Botulinum Toxin
Calcium HydroxylapatiteHyaluronic AcidPoly-L-Lactic Acid
97%19%93%
3%
FACE & HEAD
BREAST
INJECTABLESN O N - S U R G I C A L P R O C E D U R E S
S U R G I C A L P R O C E D U R E S
I N T E R N A T I O N A L S T U D Y O N A E S T H E T I C / C O S M E T I C
P R O C E D U R E S P E R F O R M E D I N 2 0 1 7
PERCENT OF PLASTIC SURGEONS PERFORMING EACH PROCEDURE
OTHER
BODY & EXTREMITIES FACIAL
REJUVENATION
COLOMBIA

Brow LiftEar SurgeryEyelid SurgeryFaceliftFacial Bone ContouringFat Grafting-faceNeck LiftRhinoplasty
83%85%98%80%68%73%76%95%
AbdominoplastyButtock Augmentation—implants onlyButtock Augmentation—fat transferButtock LiftLiposuctionLower Body LiftThigh LiftUpper Arm LiftUpper Body LiftLabiaplastyVaginal Rejuvenation
76%10%20%15%78%32%27%44%22%51%5%
Breast Augmentation— salineBreast Augmentation—siliconeBreast Augmentation—fat transferBreast Implant RemovalBreast LiftBreast ReductionGynecomastia
2%85%24%68%76%76%61%
Chemical PeelFull Field AblativeMicro-Ablative ResurfacingDermabrasionMicrodermabrasionNonsurgical Skin TighteningPhoto Rejuvenation
2%5%0%7%0%2%
12%
Cellulite TreatmentHair RemovalNonsurgical Fat ReductionTattoo RemovalTreatment of Leg VeinsSclerotherapy
0%12%2%
15%10%17%Botulinum Toxin
Calcium HydroxylapatiteHyaluronic AcidPoly-L-Lactic Acid
63%2%
34%2%
FACE & HEAD
BREAST
INJECTABLESN O N - S U R G I C A L P R O C E D U R E S
S U R G I C A L P R O C E D U R E S
I N T E R N A T I O N A L S T U D Y O N A E S T H E T I C / C O S M E T I C
P R O C E D U R E S P E R F O R M E D I N 2 0 1 7
PERCENT OF PLASTIC SURGEONS PERFORMING EACH PROCEDURE
OTHER
BODY & EXTREMITIES FACIAL
REJUVENATION
THAILAND

COUNTRIES BY TOTAL NUMBER OF PROCEDURES - 2017

RANK* COUNTRY TOTAL
SURGICAL PROCEDURES
% OF TOTAL SURGICAL
PROCEDURES
TOTAL NONSURGICAL PROCEDURES
% OF TOTAL NON-
SURGICAL PROCEDURES
TOTAL PROCEDURES
% OF TOTAL PROCEDURES
1 USA 1.562.504 14,5% 2.747.676 21,8% 4.310.180 18,4%
2 Brazil 1.466.245 13,6% 961.290 7,6% 2.427.535 10,4%
3 Japan 294.396 2,7% 1.384.214 11,0% 1.678.610 7,2%
4 Mexico 520.956 4,8% 515.662 4,1% 1.036.618 4,4%
5 Italy 301.875 2,8% 650.955 5,2% 952.830 4,1%
6 Germany 290.932 2,7% 413.948 3,3% 704.880 3,0%
7 Colombia 346.140 3,2% 170.790 1,4% 516.930 2,2%
8 Thailand 105.342 1,0% 23.056 0,2% 128.398 0,5%
* Rankings are based solely on those countries from which a sufficient survey response was received and data were considered to be representative.

NUMBER OF WORLD-WIDE SURGICAL PROCEDURES PERFORMED BY
PLASTIC SURGEONS

RANK* SURGICAL PROCEDURES TOTAL
PERCENT OF TOTAL SURGICAL
PROCEDURES
1 Breast Augmentation 1.677.320 15,6%
2 Liposuction 1.573.680 14,6%
3 Eyelid Surgery 1.346.886 12,5%
4 Rhinoplasty 877.254 8,1%
5 Abdominoplasty 802.234 7,5%
6 Breast Lift 657.832 6,1%
7 Fat Grafting-face 602.760 5,6%
8 Breast Reduction 489.146 4,5%
9 Facelift 465.296 4,3%
10Buttock Augmentation—
fat transfer335.637 3,1%
11 Ear Surgery 287.070 2,7%
12 Neck Lift 263.219 2,4%
RANK* SURGICAL PROCEDURES TOTAL
PERCENT OF TOTAL SURGICAL
PROCEDURES
13 Brow Lift 249.343 2,3%
14 Gynecomastia 243.272 2,3%
15 Breast Implant Removal 169.553 1,6%
16 Labiaplasty 138.765 1,3%
17 Upper Arm Lift 137.030 1,3%
18 Facial Bone Contouring 98.003 0,9%
19 Lower Body Lift 88.029 0,8%
20 Thigh Lift 86.728 0,8%
21 Vaginal Rejuvenation 68.081 0,6%
22 Buttock Lift 43.364 0,4%
23Buttock Augmentation-
implants only36.859 0,3%
24 Upper Body Lift 29.488 0,3%
TOTAL SURGICAL PROCEDURES 10.766.848

NUMBER OF WORLD-WIDE NON-SURGICAL PROCEDURES
PERFORMED BY PLASTIC SURGEONS
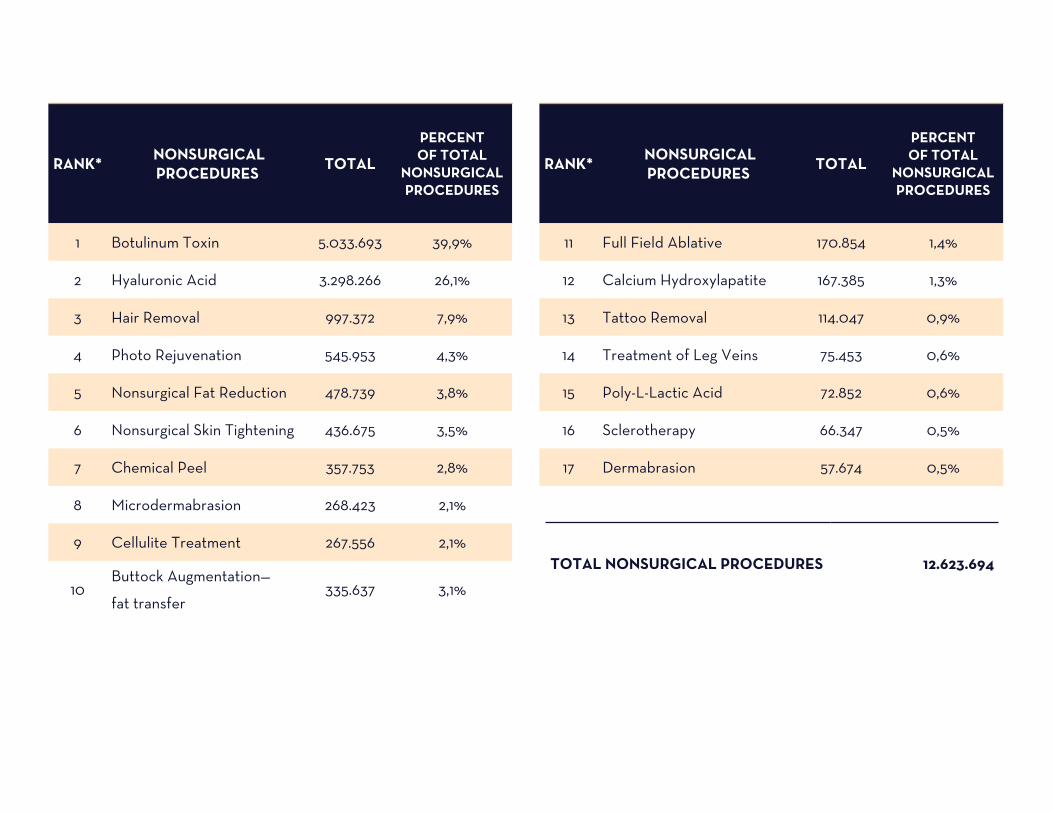
RANK* NONSURGICAL PROCEDURES TOTAL
PERCENT OF TOTAL
NONSURGICAL PROCEDURES
1 Botulinum Toxin 5.033.693 39,9%
2 Hyaluronic Acid 3.298.266 26,1%
3 Hair Removal 997.372 7,9%
4 Photo Rejuvenation 545.953 4,3%
5 Nonsurgical Fat Reduction 478.739 3,8%
6 Nonsurgical Skin Tightening 436.675 3,5%
7 Chemical Peel 357.753 2,8%
8 Microdermabrasion 268.423 2,1%
9 Cellulite Treatment 267.556 2,1%
10Buttock Augmentation—
fat transfer335.637 3,1%
RANK* NONSURGICAL PROCEDURES TOTAL
PERCENT OF TOTAL
NONSURGICAL PROCEDURES
11 Full Field Ablative 170.854 1,4%
12 Calcium Hydroxylapatite 167.385 1,3%
13 Tattoo Removal 114.047 0,9%
14 Treatment of Leg Veins 75.453 0,6%
15 Poly-L-Lactic Acid 72.852 0,6%
16 Sclerotherapy 66.347 0,5%
17 Dermabrasion 57.674 0,5%
TOTAL NONSURGICAL PROCEDURES 12.623.694

COUNTRIES PERFORMING MOST POPULAR SURGICAL PROCEDURES

1 USA 345.236 20,6%
2 Brazil 235.950 14,1%
3 Mexico 67.478 4,0%
4 Italy 54.045 3,2%
5 Germany 46.165 2,8%
6 Colombia 45.570 2,7%
7 Thailand 14.614 0,9%
8 Japan 7.751 0,5%
BREAST AUGMENTATION
RANK* COUNTRY NUMBER OF PROCEDURES
PERCENTAGE OF TOTAL
1 USA 273.700 17,4%
2 Brazil 211.035 13,4%
3 Mexico 73.231 4,7%
4 Colombia 65.700 4,2%
5 Germany 45.871 2,9%
6 Italy 40.125 2,5%
7 Japan 10.703 0,7%
8 Thailand 9.264 0,6%
LIPOSUCTION
RANK* COUNTRY NUMBER OF PROCEDURES
PERCENTAGE OF TOTAL
* Rankings are based solely on those countries from which a sufficient survey response was received and data were considered to be representative.

1 Brazil 74.470 8,5%
2 Mexico 55.677 6,3%
3 USA 44.676 5,1%
4 Japan 36.721 4,2%
5 Italy 26.880 3,1%
6 Colombia 24.300 2,8%
7 Thailand 21.260 2,4%
8 Germany 11.166 1,3%
RHINOPLASTY
RANK* COUNTRY NUMBER OF PROCEDURES
PERCENTAGE OF TOTAL
* Rankings are based solely on those countries from which a sufficient survey response was received and data were considered to be representative.
1 Japan 187.326 13,9%
2 Brazil 159.720 11,9%
3 USA 149.736 11,1%
4 Mexico 52.546 3,9%
5 Germany 46.086 3,4%
6 Italy 45.270 3,4%
7 Colombia 26.820 2,0%
8 Thailand 19.743 1,5%
EYELID SURGERY
RANK* COUNTRY NUMBER OF PROCEDURES
PERCENTAGE OF TOTAL

* Rankings are based solely on those countries from which a sufficient survey response was received and data were considered to be representative.
1 USA 142.460 17,8%
2 Brazil 121.385 15,1%
3 Mexico 36.386 4,5%
4 Colombia 31.360 3,9%
5 Italy 19.875 2,5%
6 Germany 18.120 2,3%
7 Thailand 4.380 0,5%
8 Japan 123 0,0%
ABDOMINOPLASTY
RANK* COUNTRY NUMBER OF PROCEDURES
PERCENTAGE OF TOTAL

2017 GENDER DISTRIBUTION FOR COSMETIC PROCEDURES

SURGICAL PROCEDURES:
Abdominoplasty 726.781 90,6% 4 75.453 9,4% 7
Breast Augmentation— saline 70.683 100,0% 21 0 0,0% 22
Breast Augmentation—fat transfer 133.127 97,2% 16 3.903 2,8% 19
Breast Augmentation—silicone 1.462.234 99,5% 1 7.372 0,5% 14
Breast Implant Removal 167.385 98,7% 14 2.168 1,3% 21
Breast Lift 657.832 100,0% 5 dna dna dna
Breast Reduction 489.146 100,0% 8 dna dna dna
Brow Lift 199.908 80,2% 12 49.435 19,8% 10
Buttock Augmentation—fat transfer 318.725 95,0% 10 16.912 5,0% 13
Buttock Augmentation-implants only 34.258 92,9% 24 2.602 7,1% 20
Buttock Lift 38.160 88,0% 23 5.204 12,0% 18
Ear Surgery 172.155 60,0% 13 114.915 40,0% 5
Eyelid Surgery 1.054.179 78,3% 3 292.707 21,7% 1
Facelift 398.515 85,6% 9 66.781 14,4% 8
Facial Bone Contouring 72.418 73,9% 19 25.585 26,1% 11
Fat Grafting-face 505.624 83,9% 7 97.135 16,1% 6
Gynecomastia dna dna dna 243.272 100,0% 2
Labiaplasty 138.765 100,0% 15 dna dna dna
The following list includes both surgical and nonsurgical cosmetic procedures. dna = Does not apply
PROCEDUREFEMALE
(NUMBER OF PROCEDURES)
PERCENT OF TOTAL
RANK WITHIN CATEGORY (SURGICAL/
NONSURGICAL)
MALE (NUMBER OF
PROCEDURES)
PERCENT OF TOTAL
RANK WITHIN CATEGORY (SURGICAL/
NONSURGICAL)

SURGICAL PROCEDURES:
Liposuction 1.336.478 84,9% 2 237.201 15,1% 3
Lower Body Lift 70.683 80,3% 20 17.346 19,7% 12
Neck Lift 212.484 80,7% 11 50.736 19,3% 9
Rhinoplasty 654.796 74,6% 6 222.457 25,4% 4
Thigh Lift 80.223 92,5% 18 6.505 7,5% 16
Upper Arm Lift 130.092 94,9% 17 6.938 5,1% 15
Upper Body Lift 23.850 80,9% 25 5.637 19,1% 17
Vaginal Rejuvenation 68.081 100,0% 22 dna dna dna
Totals - Surgical Procedures 9.216.585 85,6% 1.550.263 14,4%
The following list includes both surgical and nonsurgical cosmetic procedures. dna = Does not apply
PROCEDUREFEMALE
(NUMBER OF PROCEDURES)
PERCENT OF TOTAL
RANK WITHIN CATEGORY (SURGICAL/
NONSURGICAL)
MALE (NUMBER OF
PROCEDURES)
PERCENT OF TOTAL
RANK WITHIN CATEGORY (SURGICAL/
NONSURGICAL)

NON-SURGICAL PROCEDURES:
Botulinum Toxin 4.377.596 87,0% 1 656.097 13,0% 1
Calcium Hydroxylapatite 141.800 84,7% 12 25.585 15,3% 12
Cellulite Treatment 255.848 95,6% 8 11.708 4,4% 14
Chemical Peel 324.363 90,7% 7 33.390 9,3% 10
Dermabrasion 45.532 78,9% 17 12.142 21,1% 13
Full Field Ablative 142.668 83,5% 11 28.187 16,5% 11
Hair Removal 830.854 83,3% 3 166.518 16,7% 3
Hyaluronic Acid 2.954.389 89,6% 2 343.877 10,4% 2
Micro-Ablative Resurfacing 179.093 83,4% 10 35.558 16,6% 9
Microdermabrasion 232.431 86,6% 9 35.992 13,4% 8
Nonsurgical Fat Reduction 403.285 84,2% 5 75.453 15,8% 5
Nonsurgical Skin Tightening 386.807 88,6% 6 49.869 11,4% 6
Photo Rejuvenation 457.057 83,7% 4 88.896 16,3% 4
Poly-L-Lactic Acid 63.311 86,9% 15 9.540 13,1% 15
Sclerotherapy 61.577 92,8% 16 4.770 7,2% 17
Tattoo Removal 67.648 59,3% 13 46.399 40,7% 7
Treatment of Leg Veins 66.347 87,9% 14 9.106 12,1% 16
Totals - Non-Surgical Procedure 10.990.606 87,1% 1.633.088 12,9%
The following list includes both surgical and nonsurgical cosmetic procedures. dna = Does not apply
TOTALS ALL PROCEDURES 20.207.190 86,4% 3.183.351 13,6%
PROCEDUREFEMALE
(NUMBER OF PROCEDURES)
PERCENT OF TOTAL
RANK WITHIN CATEGORY (SURGICAL/
NONSURGICAL)
MALE (NUMBER OF
PROCEDURES)
PERCENT OF TOTAL
RANK WITHIN CATEGORY (SURGICAL/
NONSURGICAL)

MOST COMMON PROCEDURES BY COUNTRY

Surgical Procedures
Breast Augmentation 345.236
Liposuction 273.700
Eyelid Surgery 149.736
Abdominoplasty 142.460
Breast Lift 139.672
Non-Surgical Procedures
Botulinum Toxin 1.150.560
Hyaluronic Acid 676.396
Hair Removal 177.140
Nonsurgical Fat Reduction 172.380
Photo Rejuvenation 117.436
USA TOTAL
Surgical Procedures
Breast Augmentation 235.950
Liposuction 211.035
Eyelid Surgery 159.720
Abdominoplasty 121.385
Breast Lift 104.995
Non-Surgical Procedures
Botulinum Toxin 399.905
Hyaluronic Acid 254.375
Hair Removal 57.255
Cellulite Treatment 48.070
Photo Rejuvenation 38.940
BRAZIL TOTAL

Surgical Procedures
Eyelid Surgery 187.326
Rhinoplasty 36.721
Facelift 34.510
Liposuction 10.703
Breast Augmentation 7.751
Non-Surgical Procedures
Hyaluronic Acid 449.424
Hair Removal 344.582
Botulinum Toxin 253.848
Nonsurgical Fat Reduction 93.362
Photo Rejuvenation 87.309
JAPAN TOTAL
Surgical Procedures
Liposuction 73.231
Breast Augmentation 67.478
Rhinoplasty 55.677
Eyelid Surgery 52.546
Abdominoplasty 36.386
Non-Surgical Procedures
Botulinum Toxin 228.362
Hyaluronic Acid 107.945
Nonsurgical Skin Tightening 32.649
Hair Removal 29.207
Microdermabrasion 21.127
MEXICO TOTAL

Surgical Procedures
Breast Augmentation 54.045
Eyelid Surgery 45.270
Liposuction 40.125
Rhinoplasty 26.880
Fat Grafting-face 21.060
Non-Surgical Procedures
Botulinum Toxin 254.055
Hyaluronic Acid 242.355
Hair Removal 28.905
Chemical Peel 25.200
Cellulite Treatment 20.235
ITALY TOTAL
Surgical Procedures
Breast Augmentation 46.165
Eyelid Surgery 46.086
Liposuction 45.871
Abdominoplasty 18.120
Breast Lift 16.732
Non-Surgical Procedures
Botulinum Toxin 220.211
Hyaluronic Acid 137.919
Nonsurgical Fat Reduction 10.635
Microdermabrasion 8.705
Nonsurgical Skin Tightening 7.722
GERMANY TOTAL

Surgical Procedures
Liposuction 65.700
Breast Augmentation 45.570
Abdominoplasty 31.360
Buttock Augmentation—fat transfer 28.940
Eyelid Surgery 26.820
Non-Surgical Procedures
Botulinum Toxin 82.120
Hyaluronic Acid 40.600
Microdermabrasion 8.720
Hair Removal 6.030
Nonsurgical Fat Reduction 5.580
COLUMBIA TOTAL
Surgical Procedures
Rhinoplasty 21.260
Eyelid Surgery 19.743
Breast Augmentation 14.614
Liposuction 9.264
Fat Grafting-face 5.043
Non-Surgical Procedures
Botulinum Toxin 13.253
Hyaluronic Acid 3.417
Photo Rejuvenation 3.330
Hair Removal 1.079
Nonsurgical Fat Reduction 510
THAILAND TOTAL

COUNTRIES PERFORMING MOST POPULAR NON-SURGICAL
PROCEDURES

BOTULINUM TOXIN
RANK* COUNTRY NUMBER OF PROCEDURES
PERCENTAGE OF TOTAL
1 USA 1.150.560 22,9%
2 Brazil 399.905 7,9%
3 Italy 254.055 5,0%
4 Japan 253.848 5,0%
5 Mexico 228.362 4,5%
6 Germany 220.211 4,4%
7 Colombia 82.120 1,6%
8 Thailand 13.253 0,3%
HYALURONIC ACID
RANK* COUNTRY NUMBER OF PROCEDURES
PERCENTAGE OF TOTAL
1 USA 676.396 20,5%
2 Japan 449.424 13,6%
3 Brazil 254.375 7,7%
4 Italy 242.355 7,3%
5 Germany 137.919 4,2%
6 Mexico 107.945 3,3%
7 Colombia 40.600 1,2%
8 Thailand 3.417 0,1%
* Rankings are based solely on those countries from which a sufficient survey response was received and data were considered to be representative.

HAIR REMOVAL
RANK* COUNTRY NUMBER OF PROCEDURES
PERCENTAGE OF TOTAL
1 Japan 344.582 34,5%
2 USA 177.140 17,8%
3 Brazil 57.255 5,7%
4 Mexico 29.207 2,9%
5 Italy 28.905 2,9%
6 Colombia 6.030 0,6%
7 Germany 3.590 0,4%
8 Thailand 1.079 0,1%
PHOTO REJUVENATION
RANK* COUNTRY NUMBER OF PROCEDURES
PERCENTAGE OF TOTAL
1 USA 117.436 21,5%
2 Japan 87.309 16,0%
3 Brazil 38.940 7,1%
4 Mexico 14.882 2,7%
5 Italy 5.880 1,1%
6 Thailand 3.330 0,6%
7 Colombia 2.510 0,5%
8 Germany 1.129 0,2%
* Rankings are based solely on those countries from which a sufficient survey response was received and data were considered to be representative.

NONSURGICAL FAT REDUCTION
RANK* COUNTRY NUMBER OF PROCEDURES
PERCENTAGE OF TOTAL
1 USA 172.380 36,0%
2 Japan 93.362 19,5%
3 Brazil 23.925 5,0%
4 Mexico 15.013 3,1%
5 Italy 11.145 2,3%
6 Germany 10.635 2,2%
7 Colombia 5.580 1,2%
8 Thailand 510 0,1%
* Rankings are based solely on those countries from which a sufficient survey response was received and data were considered to be representative.

SURGICAL PROCEDURE GROUP RANKING BY COUNTRY

USA
RANK* COUNTRY TOTAL % OF TOTAL
1 Total Breast Procedures 629.476 40,3%
2Total Body & Extremities Procedures
512.584 32,8%
3Total Face & Head Procedures
420.444 26,9%
BRAZIL
RANK* COUNTRY TOTAL % OF TOTAL
1Total Face & Head Procedures
511.390 34,9%
2Total Body & Extremities Procedures
481.965 32,9%
3 Total Breast Procedures 472.890 32,3%
MEXICO
RANK* COUNTRY TOTAL % OF TOTAL
1Total Face & Head Procedures
212.464 40,8%
2Total Body & Extremities Procedures
180.356 34,6%
3 Total Breast Procedures 128.137 24,6%
COLUMBIA
RANK* COUNTRY TOTAL % OF TOTAL
1Total Body & Extremities Procedures
150.210 43,4%
2Total Face & Head Procedures
103.980 30,0%
3 Total Breast Procedures 91.950 26,6%
* Percentage reflects portion of country's total surgical procedures

ITALY
RANK* COUNTRY TOTAL % OF TOTAL
1Total Face & Head Procedures
126.690 42,0%
2 Total Breast Procedures 94.845 31,4%
3Total Body & Extremities Procedures
80.340 26,6%
GERMANY
RANK* COUNTRY TOTAL % OF TOTAL
1Total Face & Head Procedures
110.190 37,9%
2Total Body & Extremities Procedures
90.817 31,2%
3 Total Breast Procedures 89.925 30,9%
JAPAN
RANK* COUNTRY TOTAL % OF TOTAL
1Total Face & Head Procedures
270.014 91,7%
2Total Body & Extremities Procedures
9.318 5,1%
3 Total Breast Procedures 15.065 3,2%
THAILAND
RANK* COUNTRY TOTAL % OF TOTAL
1Total Face & Head Procedures
62.257 59,1%
2 Total Breast Procedures 24.200 23,0%
3Total Body & Extremities Procedures
18.886 17,9%
* Percentage reflects portion of country's total surgical procedures
NON-SURGICAL PROCEDURE GROUP RANKING BY COUNTRY

USA
RANK* COUNTRY TOTAL % OF TOTAL
1 Total Injectables 1.903.660 69,3%
2 Total Facial Rejuvenation 448.528 16,3%
3 Total Other Procedures 395.488 14,4%
JAPAN
RANK* COUNTRY TOTAL % OF TOTAL
1 Total Injectables 706.362 51,0%
2 Total Other Procedures 450.763 32,6%
3 Total Facial Rejuvenation 227.089 16,4%
BRAZIL
RANK* COUNTRY TOTAL % OF TOTAL
1 Total Injectables 677.765 70,5%
2 Total Facial Rejuvenation 142.505 14,8%
3 Total Other Procedures 141.020 14,7%
ITALY
RANK* COUNTRY TOTAL % OF TOTAL
1 Total Injectables 520.155 79,9%
2 Total Other Procedures 76.020 11,7%
3 Total Facial Rejuvenation 54.780 8,4%
* Percentage reflects portion of country's total surgical procedures

MEXICO
RANK* COUNTRY TOTAL % OF TOTAL
1 Total Injectables 346.206 67,1%
2 Total Facial Rejuvenation 94.210 18,3%
3 Total Other Procedures 75.246 14,6%
GERMANY
RANK* COUNTRY TOTAL % OF TOTAL
1 Total Injectables 364.046 87,9%
2 Total Facial Rejuvenation 26.035 6,3%
3 Total Other Procedures 23.867 5,8%
COLUMBIA
RANK* COUNTRY TOTAL % OF TOTAL
1 Total Injectables 125.350 73,4%
2 Total Facial Rejuvenation 27.840 16,3%
3 Total Other Procedures 17.600 10,3%
THAILAND
RANK* COUNTRY TOTAL % OF TOTAL
1 Total Injectables 16.786 72,8%
2 Total Facial Rejuvenation 4.159 18,0%
3 Total Other Procedures 2.110 9,2%
* Percentage reflects portion of country's total surgical procedures

2017 AGE DISTRIBUTION FOR CERTAIN COSMETIC PROCEDURES

18 YEARS OLD OR YOUNGER
19-34 YEARS OLD
35-50 YEARS OLD
51-64 YEARS OLD
65 YEARS OLD OR OLDER
Breast augmentations 44.617 2,7% 923.700 55,1% 557.373 33,2% 131.837 7,9% 19.792 1,2%
Rhinoplasty 70.882 8,1% 549.775 62,7% 205.891 23,5% 41.406 4,7% 9.299 1,1%
Botulinum Toxin 42.786 0,9% 1.058.082 21,0% 2.370.366 47,1% 1.259.430 25,0% 303.028 6,0%
Liposuction 33.677 2,1% 656.696 41,7% 649.615 41,3% 205.995 13,1% 27.697 1,8%
Nonsurgical Fat Reduction 15.894 3,3% 165.404 34,6% 194.272 40,6% 84.928 17,7% 18.240 3,8%

2017 PERCENT OF COSMETIC PROCEDURES BY LOCATION

AN OFFICE FACILITY A HOSPITAL A FREE-STANDING SURGICENTER OTHER
World-Wide Totals 31,3% 47,7% 19,5% 1,6%
Brazil 26,9% 63,3% 6,8% 3,1%
Colombia 23,1% 51,8% 25,0% 0,1%
Germany 36,1% 37,8% 17,7% 8,4%
Italy 48,8% 28,1% 21,1% 1,9%
Japan ***
Mexico 27,7% 52,1% 17,6% 2,6%
Thailand 44,7% 45,1% 10,3% 0,0%
USA 36,8% 36,3% 26,9% 0,0%
PLEASE ESTIMATE THE PERCENTAGE OF YOUR TOTAL COSMETIC PROCEDURES IN 2017 THAT WERE PERFORMED IN. . .

BREAST AUGMENTATIONS FOR WOMEN 17 YEARS OLD OR YOUNGER -
2017
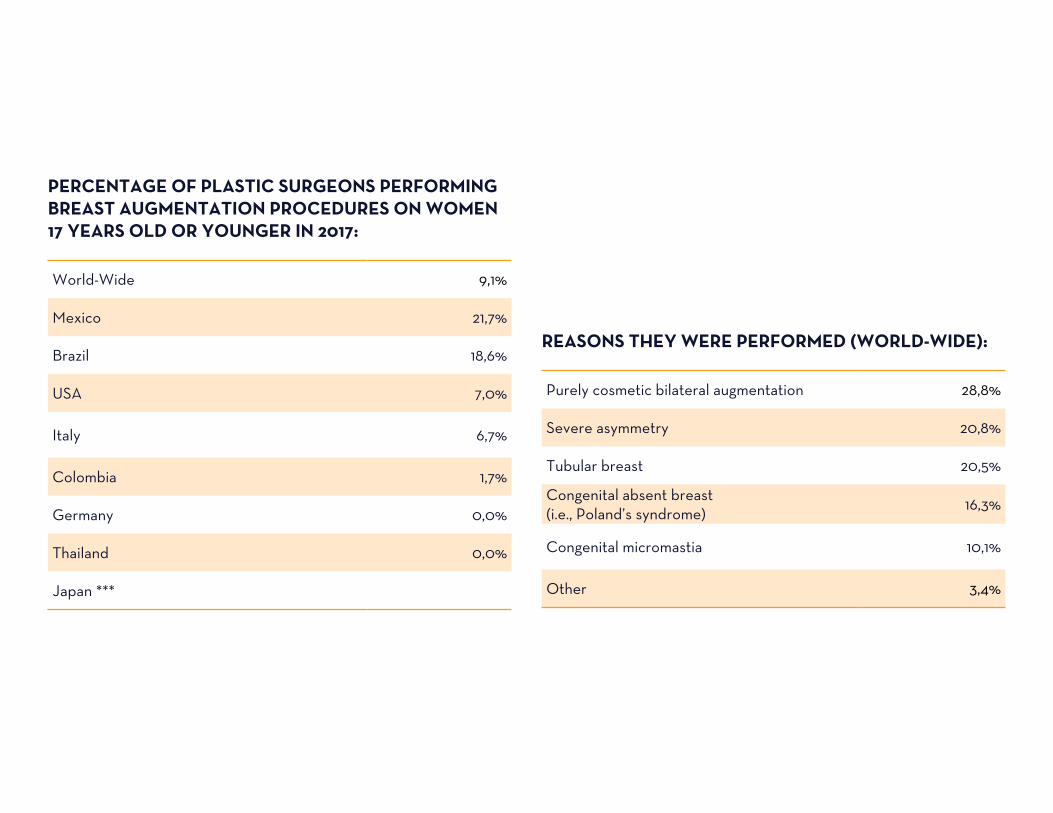
World-Wide 9,1%
Mexico 21,7%
Brazil 18,6%
USA 7,0%
Italy 6,7%
Colombia 1,7%
Germany 0,0%
Thailand 0,0%
Japan ***
PERCENTAGE OF PLASTIC SURGEONS PERFORMING BREAST AUGMENTATION PROCEDURES ON WOMEN 17 YEARS OLD OR YOUNGER IN 2017:
Purely cosmetic bilateral augmentation 28,8%
Severe asymmetry 20,8%
Tubular breast 20,5%
Congenital absent breast (i.e., Poland’s syndrome)
16,3%
Congenital micromastia 10,1%
Other 3,4%
REASONS THEY WERE PERFORMED (WORLD-WIDE):

MEDICAL TOURISM - 2017

PERCENTAGE OF PATIENTS IN 2017 THAT WERE FROM OTHER COUNTRIES:
MEDIAN AVERAGE
World-Wide 8,0% 15,6%
Colombia 20,0% 26,0%
Thailand 20,0% 30,8%
Mexico 15,0% 23,4%
USA 5,0% 9,2%
Germany 5,0% 10,5%
Brazil 3,0% 5,4%
Italy 2,0% 7,3%
MOST FREQUENTLY-CITED COUNTRIES OF FOREIGN PATIENTS
1 2 3
USA Spain Canada
Australia USA New Zealand
USA Canada Colombia
Mexico Canada Brazil
Russia Switzerland Austria
USA Italy Portugal
Switzerland France Russia