Is This Time Different? The Slowdown in Health Care … This Time Different? The Slowdown in Health...
63
261 AMITABH CHANDRA Harvard University JONATHAN HOLMES Harvard University JONATHAN SKINNER Dartmouth College Is This Time Different? The Slowdown in Health Care Spending ABSTRACT Why have health care costs moderated in the last decade? Some have suggested that the Great Recession alone was the cause, but health expen- diture growth in the depths of the recession was nearly identical to growth prior to the recession. Nor can the Affordable Care Act (ACA) take credit, since the slowdown began prior to its implementation. Instead, we identify three primary causes of the slowdown: the rise in high-deductible insurance plans, state-level efforts to control Medicaid costs, and a general slowdown in the diffusion of new technology, particularly for use by the Medicare population. A more difficult question is: Will this slowdown continue? On this question we are pessimistic, and not entirely because a similar (and temporary) slowdown occurred in the early 1990s. The primary determinant of long-term growth is the continued development of expensive technology, and there is little evi- dence of a permanent slowdown in that pipeline. Proton beam accelerators are on target to double between 2010 and 2014, while the market for heart- assist devices (costing more than $300,000 each) is projected to grow rapidly. Accountable care organizations (ACOs) and emboldened insurance companies may yet stifle health care cost growth, but our best estimate over the next two decades is that health care costs will grow at GDP plus 1.2 percent, a rate lower than previous estimates but still on track to cause serious fiscal pain for taxpayers and workers who bear the costs of higher premiums. T he United States has led the world in both the level and growth rate of spending on health care, with nearly 18 percent of U.S. GDP currently produced by the health sector. Between 1980 and 2008, U.S. health care
Transcript of Is This Time Different? The Slowdown in Health Care … This Time Different? The Slowdown in Health...

261
AmitAbh ChAndrAHarvard University
JonAthAn holmesHarvard University
JonAthAn skinnerDartmouth College
Is This Time Different? The Slowdown in Health Care Spending
ABSTRACT Why have health care costs moderated in the last decade? Some have suggested that the Great Recession alone was the cause, but health expen-diture growth in the depths of the recession was nearly identical to growth prior to the recession. Nor can the Affordable Care Act (ACA) take credit, since the slowdown began prior to its implementation. Instead, we identify three primary causes of the slowdown: the rise in high-deductible insurance plans, state-level efforts to control Medicaid costs, and a general slowdown in the diffusion of new technology, particularly for use by the Medicare population. A more difficult question is: Will this slowdown continue? On this question we are pessimistic, and not entirely because a similar (and temporary) slowdown occurred in the early 1990s. The primary determinant of long-term growth is the continued development of expensive technology, and there is little evi-dence of a permanent slowdown in that pipeline. Proton beam accelerators are on target to double between 2010 and 2014, while the market for heart-assist devices (costing more than $300,000 each) is projected to grow rapidly. Accountable care organizations (ACOs) and emboldened insurance companies may yet stifle health care cost growth, but our best estimate over the next two decades is that health care costs will grow at GDP plus 1.2 percent, a rate lower than previous estimates but still on track to cause serious fiscal pain for taxpayers and workers who bear the costs of higher premiums.
the United States has led the world in both the level and growth rate of spending on health care, with nearly 18 percent of U.S. GDP currently
produced by the health sector. Between 1980 and 2008, U.S. health care

262 Brookings Papers on Economic Activity, Fall 2013
spending grew by 7 percentage points of GDP, compared to an average of just 2.6 percentage points among all other OECD countries combined (Chandra and Skinner 2012). Yet recent time-series evidence suggests that health care cost growth in the United States is now moderating. David Cutler and Nikhil Sahni (2013) estimate an unexplained one-percent drop in health care spending growth, while Alexander Ryu and others (2013) find a large downturn in the growth in private insurance spending over the last several years.
Others are less sanguine. Joseph Antos (2013) recently testified before a Senate committee that “[t]he biggest single factor driving the recent slowdown is the economy,” implying that health care spending will pick up once the economy recovers (Kaiser Family Foundation 2013). Simi-larly, Charles Roehrig and Gene Steuerle have documented that health care expenditure growth has exhibited a remarkably stable pattern relative to GDP growth, implying convergence toward a steady state in which nearly one-third of GDP is devoted to health care (Steuerle 2013; Roehrig 2013). Still others suggest that analysts are wasting their time trying to distinguish between these two hypotheses, since one cannot predict long-term trends based on a few years of data (Fuchs 2013).
In this paper, we ask the question, Is the slowdown really different this time?1 We first study trends in a variety of measures of U.S. health care, including personal health expenditures, total health spending, health care prices and quantities, and employment in the health care sector. While the different measurement approaches tell somewhat different stories about inflection points, nearly all of them point to a recent decline in health care spending, with the exception of one: the Current Employment Statistics (CES) shows little slowdown in health care employment growth relative to the size of the sector.2
Previous studies used time-series regressions to test whether current or lagged GDP growth affects current health care spending. On theoreti-cal grounds, we question whether GDP growth alone should have a large impact on health care spending—short-run income effects for health care spending are modest at best (McClellan and Skinner 2006). Instead, we hypothesize that three factors have led to the decline in health care expenditure growth.
1. With apologies to Reinhart and Rogoff (2009).2. Just prior to the publication of this paper, a revision was made to the CES methodol-
ogy, which lowered estimates of employment growth in the health sector since 2009; the preliminary estimates show a drop in employment growth in late 2013 and early 2014.

AmitAbh ChAndrA, JonAthAn holmes, and JonAthAn skinner 263
The first factor in the decline in cost growth has been the rapid diffu-sion of high-deductible health care plans, which, together with a continued decline in the fraction of people insured, has led to higher out-of-pocket prices for health care. In this new regime, households did scale back physi-cian visits, particularly households in financial distress (Lusardi, Schneider, and Tufano 2010).
The second factor in the decline has been cuts in Medicaid benefits and reimbursement rates that were necessitated by shrinking state budgets, with the end result of nearly flat per capita real spending for the growing popula-tion of Medicaid enrollees. As in other OECD countries facing similar bud-getary pressure (OECD 2013), state Medicaid officials in the United States restricted services and cut reimbursement rates, which in turn attenuated the utilization of specialists, many of whom no longer accepted Medicaid patients (Sack 2010).
The third factor stems from the use of medical technology for people under Medicare. As an entitlement program, utilization in Medicare is not subject to either budgetary cutbacks (as in Medicaid or in other OECD countries), nor to rising out-of-pocket costs (as in private insurance). Why then has Medicare spending moderated? As Levine and Buntin (2013) show, the Medicare slowdown growth could not be attributed to elderly people being in better health, nor could it arise from financial stress among Medicare enrollees. Instead, we present evidence that a third factor under-lying the reduction in health care growth has been a slowdown in the diffu-sion of those new technologies that had accounted for much of the growth in expenditures during the previous decade. For example, angioplasty (the insertion of a balloon into a clogged cardiac artery) and, later, the use of stents (cylindrical wire devices designed to maintain blood flow in the heart’s arteries) grew at double-digit rates during the 1990s and early 2000s, but their use has since stagnated. Similarly, Cutler and Sahni (2013) document a decline in the introduction of new blockbuster drugs and the transformation of former brand drugs to generic status.
Will the slowdown in cost growth persist? Medicaid programs have been successful in cutting reimbursement rates and restricting benefits, but they cannot do so indefinitely without causing a complete collapse in access to care for their enrollees. Similarly, the transition to high-deductible plans will continue to attenuate health care cost growth until the transition is complete—a level versus a growth rate effect—at which point growth rates will revert to their long-run path.
What then is the long-run growth rate? Joseph Newhouse (1992) concluded that the long-term growth rate in health care spending is the

264 Brookings Papers on Economic Activity, Fall 2013
consequence of technology growth—the introduction of new treatments and procedures and the diffusion of existing ones. Looking forward, we describe a variety of new technologies, some with modest health benefits but nearly all with large price tags, that could lead to billions of dollars in potential future health spending. For example, proton beam accelerators, which cost hundreds of millions of dollars to install yet offer no established advantages to patients over traditional treatment options, are expected to more than double in number between 2010 and 2014. New bioabsorbable stents are regarded as potentially energizing the otherwise moribund stent industry in the near future (Zamanian 2013). The near doubling of medi-cal technology investment between 2009 and 2013 (Medmarket Diligence 2013) and stepped-up patent activity for medical devices, coupled with relatively strong performance in health care stocks, all suggest a reemer-gence of technology growth. Using these and other data, we predict that the real yearly growth rate of health spending will be 1.2 percent plus GDP growth over the next two decades. This estimate is bracketed by the Medi-care Actuary Report (1.15 percent plus GDP growth through 2037; Boards of Trustees 2013) and the Congressional Budget Office (CBO) (1.3 percent plus GDP growth; CBO 2013).
We acknowledge that our prediction comes with a wide confidence interval. The impact of the ACA is not yet known, particularly the potential cost-saving effects of accountable care organizations (ACOs). Many knowl-edgeable observers already see the signs of a transformation in the U.S. health care system. As Len Nichols (2013, p. 7) interprets the situation:
. . . a good metaphor for the U.S. health care system today is the opening sweeping panorama [in The Sound of Music] followed by the crescendo of Julie Andrews’ voice singing “The Hills are Alive” with the sound of care process redesigns and incentive changes designed to make better outcomes sustainable at lower total cost.
If ACOs eschew building proton beam accelerators, change how pa tients pay for cost-ineffective technologies, and begin to slow the inno-vation cycle (Finkelstein 2007), we could see the promised transformation. Alternatively, the technology pipeline could start up again, bringing contin-ued rapid growth in health care costs (perhaps coupled with sluggish GDP growth). Our prediction of 1.2 percent plus GDP growth, which implies that 23 percent of U.S. GDP will be spent on health care by 2032, is some-where in between—perhaps not as uplifting as “The Hills Are Alive,” but not quite as scary as the cult horror film The Hills Have Eyes.

AmitAbh ChAndrA, JonAthAn holmes, and JonAthAn skinner 265
I. Facts about the Slowdown
What is the evidence on the slowdown in health spending? We begin with the macroeconomic evidence, adapted from Victor Fuchs (2013) and shown in figure 1. The graph shows smoothed inflation-adjusted growth rates in health care spending and demonstrates their sharp decline since roughly 2005, with a particularly dramatic drop in the 2010s. The decline is not quite so dramatic, however, in comparison to GDP growth. Until the most recent few years, health care spending growth tracked the downward spiral in GDP growth, and indeed, the share of health care spending to GDP has not yet dropped below 17 percent, still the highest in the world by far. Despite the considerable commentary about the recent slowdown in health care spending growth, average health spending growth between September 2012 and September 2013 exceeded GDP growth by 0.8 percent.
To illustrate the pitfalls associated with making forecasts about a slow-down in spending based on just a few years of data (Fuchs 2013), note
Figure 1. total national health expendituresa and GdP Growth,b 1993–2013c
a. Monthly health expenditure data are calculated by the Altarum Institute, and monthly GDP is estimated by Macroeconomic Advisors.
b. We use the implicit GDP deflator from Macroeconomic Advisors to deflate nominal national health expenditures.
c. Graph is smoothed using a density estimator with an Epanechnikov kernel and a bandwidth of 2 months. This graph is inspired by Fuchs (2013).
–2
0
2
4
6
8
1994 1996 1998 2000 2002 2004 2006 2008 2010 2012
Real GDP
Real NHE
Smoothed yearly growth rate (percent)

266 Brookings Papers on Economic Activity, Fall 2013
that figure 1 shows a similar slowdown in the early 1990s, when the share of GDP spent on health care even declined slightly (from 13.7 percent in 1993 to 13.6 percent in 1994). The decline at the time was seen as a wel-come correction (or even “revolution”) arising from greater competition in response to the growth of health maintenance organizations (HMOs) and the anticipation of the Clinton health care reforms. Robert G. Dederick, an economist, noted at the time that “the medical sector is not immune to what goes on in the economy. . . . It’s not as out of touch as many people seem to think.”3 Similarly, a Merrill Lynch vice president noted that “[p]hysicians are anticipating change and really beginning to change their practices.”4 Despite this enthusiasm, it is sobering to note that the drop-off was short-lived. By the late 1990s, growth in health care expenditures had exceeded the long-term average of GDP plus 2.4 percent, and in 2000 annual real per capita growth was 7 percent.
Health care expenditures relative to potential GDP are shown in the two panels of figure 2, with levels in the upper panel and growth rates in the lower panel. In both panels we use two measures of health care spending—total spending (which was used earlier in figure 1) and personal health con-sumption expenditures, which are national health expenditures less medical sector purchases of structures and equipment and expenditures for noncom-mercial medical research.5 In many respects, this latter measure is a better representation of actual health care consumption flows. Table 1 provides a breakdown of average annual growth rates for the different series: total and personal health care expenditures exhibit very similar growth rates, with the exception that total health care spending rose by less during the most recent recession than did personal health care spending.
The slowdown in health care spending is not unique to the United States. Figure 3, which uses aggregate health care spending from OECD data, demonstrates a slowdown between 2009 and 2011 that is more abrupt in other developed economies than in the United States. The sudden stop to spending growth in OECD countries likely reflected the necessity (and ability) of centrally financed health care insurance programs, such as the National Health Service in England, to hold the line on budgets by “cutting
3. Quoted in “Slowing Health Costs Help to Hold Down Price Index,” New York Times, April 10, 1993.
4. Quoted in “Medical Costs Slower to Rise in New York,” New York Times, Decem-ber 25, 1993.
5. These definitions are from http://www.cms.gov/Research-Statistics-Data-and-Systems/Statistics-Trends-and-Reports/NationalHealthExpendData/Downloads/dsm-11.pdf (p. 6).

AmitAbh ChAndrA, JonAthAn holmes, and JonAthAn skinner 267
a. Total national and personal health expenditures are from the CMS National Health Expenditures Accounts from 1970–2011, with 2012 estimates provided by the Altarum Institute.
b. Nominal Potential GDP is estimated by the Congressional Budget Office. Yearly potential GDP is the average of quarterly estimates.
1972 1978 1982 1986 1990 1994 1998 2002 2006 2010
1972 1978 1982 1986 1990 1994 1998 2002 2006 2010
Health spending as a fraction of potential GDP (percent)
Yearly growth in health spending as a fraction of potential GDP (percent)
Yearly growth rates
Levels
5
10
15 Total spending
Personal spending
2
4Total spendingPersonal spending
Figure 2. total national health spending and Personal health expendituresa as a Fraction of Potential GdP,b 1970–2012

268 Brookings Papers on Economic Activity, Fall 2013
Table 1. Average Yearly U.s. health spending Growth during Four Periods (Percent)
1990–2001 2001–07 2007–09 2009–12
Real health spendingTotal national health expenditures 4.6 4.8 2.9 2.5Personal health care 4.6 4.5 3.6 2.5Total national health expenditures as a
share of potential GDP1.4 2.0 0.6 0.8
Personal health care as a share of potential GDP
1.4 1.7 1.3 0.8
Per capita total national health expenditures
3.5 3.8 2.1 1.7
Per capita personal health care 3.5 3.5 2.8 1.7
Real per enrollee spendingPer enrollee Medicare national health
expendituresa
4.0 5.3 3.4 1.2
Per enrollee Medicaid national health expendituresb
3.8 0.2 0.5 -1.4
Private premiumb 8.2 6.2 2.4 3.5
Source and methods: Health expenditures are from the CMS National Health Expenditures between 1990 and 2011, with 2012 estimates for national and personal expenditures provided by the Altarum Institute. Real values are deflated by the GDP deflator published by the Bureau of Economic Analysis, and potential GDP is published by the Congressional Budget Office. Private premiums are estimated by the Kaiser Family Foundation.
a. Series only goes to 2011.b. Series starts in 1999.
a. U.S. total and personal spending per capita is from the CMS National Health Expenditures Accounts, and is deflated using the GDP deflator from the Bureau of Economic Analysis.
b. Spending growth for other OECD countries is calculated as a weighted average of real per capita PPP health spending using data from the Organization for Economic Cooperation and Development.
2002 2003 2004 2005 2006 2007 2008 2009 2010 2011
Real health spending growth (percent)
0
2
4
6
Total (U.S.)a
Medicare (U.S.)a
Total (Other OECD)b
Public (Other OECD)b
Figure 3. real spending Growth in total health and Public health, United states and other oeCd Countries, 2001–11
AmitAbh ChAndrA, JonAthAn holmes, and JonAthAn skinner 269
wages, reducing hospital staff and beds, and increasing copayments for patients.”6
By contrast, Medicare is an entitlement program obligated to reimburse any bills submitted. There were a few modest attempts during the recent recession to scale back rates of Medicare reimbursement or restrict the services covered. State Medicaid administrators were better able to cut reimbursement rates and restrict eligibility over this time, but their budgets were strained by the sudden inflow of newly eligible (and often jobless) Medicaid enrollees. We return to these points below in section II.
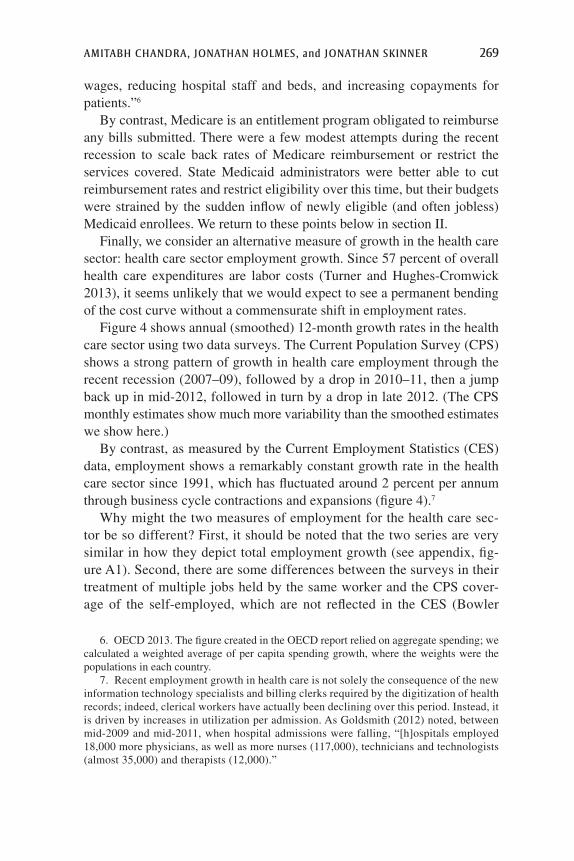
Finally, we consider an alternative measure of growth in the health care sector: health care sector employment growth. Since 57 percent of overall health care expenditures are labor costs (Turner and Hughes-Cromwick 2013), it seems unlikely that we would expect to see a permanent bending of the cost curve without a commensurate shift in employment rates.
Figure 4 shows annual (smoothed) 12-month growth rates in the health care sector using two data surveys. The Current Population Survey (CPS) shows a strong pattern of growth in health care employment through the recent recession (2007–09), followed by a drop in 2010–11, then a jump back up in mid-2012, followed in turn by a drop in late 2012. (The CPS monthly estimates show much more variability than the smoothed estimates we show here.)
By contrast, as measured by the Current Employment Statistics (CES) data, employment shows a remarkably constant growth rate in the health care sector since 1991, which has fluctuated around 2 percent per annum through business cycle contractions and expansions (figure 4).7
Why might the two measures of employment for the health care sec-tor be so different? First, it should be noted that the two series are very similar in how they depict total employment growth (see appendix, fig-ure A1). Second, there are some differences between the surveys in their treatment of multiple jobs held by the same worker and the CPS cover-age of the self-employed, which are not reflected in the CES (Bowler
6. OECD 2013. The figure created in the OECD report relied on aggregate spending; we calculated a weighted average of per capita spending growth, where the weights were the populations in each country.
7. Recent employment growth in health care is not solely the consequence of the new information technology specialists and billing clerks required by the digitization of health records; indeed, clerical workers have actually been declining over this period. Instead, it is driven by increases in utilization per admission. As Goldsmith (2012) noted, between mid-2009 and mid-2011, when hospital admissions were falling, “[h]ospitals employed 18,000 more physicians, as well as more nurses (117,000), technicians and technologists (almost 35,000) and therapists (12,000).”

270 Brookings Papers on Economic Activity, Fall 2013
and Morisi 2006). The third difference is in the surveys’ sample sizes; the CPS is derived from a sample of about 60,000 workers, compared to roughly 160,000 firms that cover 400,000 workplaces in the CES (Bowler and Morisi 2006). This size difference creates greater sampling variability in the CPS, particularly for sectoral-specific growth measures.8 And while even the CES has shown a recent slowdown in job growth, taken together these employment data suggest caution in predicting a permanent bending of the health care cost curve.
Source: Current Employment Statistics and author calculations based on the Current Population Survey Merged Outgoing Rotation Groups.
a. The health industry is defined according to NAICS codes 621, 622, and 623 from the 2002 version of the North American Industry Classification System.
b. Current employment statistics estimates are seasonally adjusted, and estimates of the number of employed in the CPS are smoothed using a 13-month-window moving average.
c. The fraction employed in the CES is the number of health employees over the total number of nonfarm workers.
2002 2003 2004 2005 2006 2007 2008 2009 2010 2011 2012 2013
Yearly employment growth (health sector) (percent)
0
2
4.1
.09
Fraction employed inhealth sector (CES)
Current Population Survey (CPS)
Current Employment Statistics (CES)b
Fraction employedc (CES)
Figure 4. Year-over-Year Growth in healtha employment for the Current Population survey (CPs) and the Current employment statistics (Ces), by month, 2001–13
8. Bowler and Morisi (2006) illustrate this point by noting that “from 1994 through 2004, there were 23 months when household survey employment changed by about 500,000 over the month. . . . The establishment survey, by contrast, showed a change of that magni-tude only once in those 10 years . . . , and that was due to an unusual weather event: a major blizzard that affected much of the Northeast” (p. 27).

AmitAbh ChAndrA, JonAthAn holmes, and JonAthAn skinner 271
II. Factors That Might Have Reduced Cost Growth
In this section, we line up the usual suspects implicated in (or credited with) the decline in health care cost growth.
II.A. The Affordable Care Act of 2010
One explanation for the decline in health care spending growth, popular among Democrats, is the implementation (or anticipation of the implementation) of the ACA of 2010 (Unger 2013), with David Cutler (2013) concluding that “the ACA is a significant part of the reason” for the downturn,9 and the Council of Economic Advisors stating that “[t]he evidence . . . suggests that the ACA is already contributing to lower spend-ing and price growth and that these effects will grow in the years ahead” (CEA 2013, p. 24).
The problem with this explanation is that thus far, the cost-saving effects of the ACA have been mixed. Some characteristics of the ACA increase costs, such as the extension of insurance coverage to dependents up to age 26. One ACO pilot reduced costs by less than 2 percent (Colla and others 2012), although a private Massachusetts initiative was able to save substantially more (McWilliams, Landon, and Chernew 2013; Song and others 2012). Most importantly, the cost-saving components of the ACA are not yet fully implemented, and they certainly could not explain why health care cost growth began to moderate in 2006, when Barack Obama was still a senator from Illinois.
However, two other features of the ACA may have made a difference a few years after the start of the slowdown. The first feature is rule changes in Medicare that were phased in starting in 2010, such as lower payments to Medicare Advantage plans and other providers (saving $17 billion over three years) as well as reduced payments to hospitals with poor quality measures (saving $230 to $280 million per year starting in 2012). These changes may have reduced national spending growth by 0.2 percentage points in the past three years (CEA 2013). Furthermore, these reductions in Medicare payment rates have spillover effects onto commercial plans—as Medicare rates change, commercial rates change in the same direction (Clemens and Gottlieb 2013; White 2013). While the magnitude of these effects is still debated, payment reductions in Medicare could have been
9. Quoted in “The Health-Care Law’s Success Story: Slowing Down Medical Costs,” Washington Post, November 8, 2013.

272 Brookings Papers on Economic Activity, Fall 2013
mirrored by payment reductions in private plans, with current estimates suggesting dollar-for-dollar reduction spillovers.
The second feature of the ACA that may have made a difference is the anticipatory effects the law may have triggered among providers and insurers preparing for competition through the new health exchanges and alternative payments models. While this is possible—as the private Massa-chusetts initiative indicates—we do not see direct and widespread evidence of cost-saving strategies being adopted by providers, nor do we see evi-dence from Massachusetts that private health care costs are growing more slowly there than in the rest of the country.
II.B. The Great Recession
Others (primarily Republicans) have instead attributed the downturn in health care expenditures to the recession.10 Cutler and Sahni (2013) consid-ered the role of the recession in explaining the downturn and estimated an elasticity of about one with respect to a 5-year average GDP. While their model predicts a rebound of health care spending as GDP picks up, there is still a roughly one-percentage-point drop in health care cost growth that cannot be explained by GDP growth per se.
We find that the time-series association between growth in GDP and growth in health care expenditures depends critically on the specified lag structure. In regression models using aggregate data on health care expen-ditures and GDP from 1970–2011, we find, like Cutler and Sahni (2013), a coefficient of about one using a 5-year geometric average. But the results were sensitive to the lag structure, with a 3-year geometric average yielding an estimate of 0.21 and a 7-year geometric average implying an estimate of 1.58. (appendix, table A3). Furthermore, a state-level time-series cross-section regression including year dummy variables yielded no significant relationship between state-level income changes and state-level health care spending.11
One explanation for the wide range of results is that different com-ponents of U.S. health care spending respond quite differently to policy levers and other changes in the economy, some of which are likely corre-lated with GDP growth. For example, GDP growth generates tax revenue growth, which allows greater expansion of existing government-financed
10. For the former, see Antos (2013). For the latter, see Rick Unger, “New Data Suggests Obamacare Is Actually Bending the Healthcare Cost Curve,” http://www.forbes.com/sites/rickungar/2013/02/12/new-data-suggests-obamacare-is-actually-bending-the-healthcare-cost-curve/.
11. Results from the state-level regression are available on request.

AmitAbh ChAndrA, JonAthAn holmes, and JonAthAn skinner 273
health care systems; the long-run elasticity of health care expenditures with regard to aggregate income is estimated to be roughly one (Getzen 1992; see Borger, Rutherford, and Won 2008).12 The short-run fall in tax revenue during the Great Recession played a key role in reducing European health care spending (OECD, 2013), but as noted earlier, similar effects were muted in the United States; Medicare was largely insulated from budgetary cuts during the recession, while Medicaid spending actually increased as enrollment surged. The fraction of workers with private health insurance continued its gradual decline, but that trend had begun a decade earlier.
Some support for these hypotheses comes from aggregate time-series regressions that we carried out, considering each component of health care spending separately (see appendix, table A2). Using a 5-year lag, we demonstrate that Medicare expenditure growth appears unassociated with GDP growth, with a coefficient not significantly different from zero.13 By contrast, private health insurance is very strongly associated with GDP growth, with a coefficient of 3.0, suggesting that firms are more willing to insure their workers, and pay higher premiums, during economic upturns. Medicaid is somewhere in between, consistent with the pro-cyclical impact of GDP on state fiscal budgets moderated by the anti-cyclical effects of rising enrollment during recessions.
Another explanation for the downturn in health spending is that it has been driven by demand: enrollees are less likely to seek care because their income has declined. Yet most estimates of the income elasticity of demand are clustered near zero (e.g., McClellan and Skinner 2006; Borger, Rutherford, and Won 2008). Nor do Michael Levine and Melinda Buntin (2013) find that Medicare enrollees with financial downturns reduce their health care utilization by more than those who have not suffered such downturns. Recall, however, that these Medicare enrollees are largely insulated from the sting of copayments and deductibles. As we argue next, the landscape has changed dramatically in the United States for non-Medicare patients, who are exposed to much greater out-of-pocket payments, making utilization far more sensitive to financial stress (Lusardi, Schneider, and Tufano 2010).
12. An income elasticity of health care utilization of 0.7 was estimated by Acemoglu, Finkelstein, and Notowidigdo (2013) who use oil-price shocks in areas that are oil-rich to instrument for a general-equilibrium change in health care utilization in response to a perma-nent increase in income. Because they include year-specific fixed effects, this estimate nets out any effects of GDP growth on innovation and technology growth.
13. Others find a negative association; see Levine and Buntin (2013), and McInerney and Mellor (2012).

274 Brookings Papers on Economic Activity, Fall 2013
II.C. Patient Cost Sharing
One fundamental change that could explain the slowdown in health care costs is the rise in cost sharing and consequent rise in the price of services facing patients. For example, in a Kaiser/HRET survey of employer- sponsored health benefits, the fraction of employers offering a high-deductible plan grew from 4 percent in 2005 to 31 percent in 2011. Figure 5 shows the deductible facing the average employee with employer-provided health insurance with a deductible since 2006, using data from the same Kaiser/HRET survey. The dollar amounts reported on the vertical axis are the amounts the workers are potentially liable for, and not what they actually paid (which will reflect individual decisions made with regard to health). This figure shows that for people with an insurance plan that has a generalized annual deductible, the average size of the deductible more than doubled between 2005 and 2011.
As a result of higher deductibles, out-of-pocket costs grew for patients enrolled in private insurance. Carolina-Nicole Herrera and others (2013) find that out-of-pocket payments grew at an average annual rate of 8 per-cent between 2007 and 2011; during this time, insurer spending on medical
Source: Kaiser HRET Survey of Employer-Sponsored Health Benefits, 2013, inflation-adjusted using the GDP deflator (through 2013Q2).
a. Family plans have higher deductibles but similar growth patterns.
500
600
700
800
900
1,000
1,100
2006 2007 2008 2009 2010 2011 2012 2013
Average deductible per worker (dollars)
Figure 5. Average health insurance deductible for individualsa across All Plan types among Covered Workers with a deductible, 2006–13

AmitAbh ChAndrA, JonAthAn holmes, and JonAthAn skinner 275
expenditures grew at an annual rate of 4.9 percent.14 Alexander Ryu and others (2013) find similar sharp increases in out-of-pocket spending for private insurance plans between 2007 and 2011; 61 percent for emergency room charges, 39 percent for brand-name drugs, 36 percent for hospital admissions, and 23 percent for outpatient visits. Based on the RAND health insurance study’s estimate of price elasticity of demand for health services of -0.2 (Manning and others 1987), an 8 percent per year nominal increase in out-of-pocket costs (which is approximately 6.4 percent real) would lead to an estimated decline in utilization of about 1.3 percent per year among patients of private plans.15
An additional factor leading to higher prices for working-age adults is the rising number of people who lacked insurance during this period. The percentage of the population ages 19–64 who were uninsured rose from 18 percent in 2005 to 20 percent in 2010 before dropping somewhat to 19 percent in 2012, owing to the legislated coverage of dependents up to age 26 under the ACA. For adults ages 26–49, uninsured rates continued their climb from 22 percent in 2010 to 24 percent in 2012 (Collins and others 2013).
Our discussion of the growing role of out-of pocket payments may appear to contrast with that of Katherine Baicker and Dana Goldman (2011), who note that as a share of total spending out-of-pocket pay-ments have been falling over time. One reason for this apparent incon-sistency is that there have been large increases in the use of post-acute services, such as skilled nursing facilities and home health care, that are covered by Medicare and Medicaid with very little cost sharing (Chandra, Dalton, and Holmes 2013). By contrast, as we noted earlier, rates of increase in out-of-pocket spending for private health insurance and the rise in the number of those uninsured have led to higher out-of-pocket prices facing households.
14. One important caveat to our characterization of increasing cost sharing is the role of cost sharing for prescription drugs. Here, there have been only small increases in copayments and coinsurance for generics, but much larger copayment increases for non-preferred drugs (Thomas 2013).
15. Aron-Dine and others (2012) find even larger price elasticities of 0.4 to 0.6, leading to much larger drops in quantities. Their estimates are higher because they allow consum-ers to respond to the “future price” of health care, meaning that they realize that today’s spending should be affected by end-of-year prices. On the other hand, the impact of shifting patients into high spending plans will be moderated by the fact that the healthiest patients are also the most likely to self-select into high-deductible plans (Einav and others 2013).

276 Brookings Papers on Economic Activity, Fall 2013
We hypothesize that this new landscape of high deductibles and copayments resulted in an interactive effect in which greater financial exposure amplified previously modest income effects. Further supporting this hypothesis are the findings of Annamaria Lusardi, Daniel Schneider, and Peter Tufano (2010), who conducted surveys in five countries dur-ing the depths of the Great Recession. On net, 19.5 percent of Americans responded in the survey that they reduced routine physician visits, com-pared to 6.6 percent of respondents in France and 3.6 percent in Germany, both countries with modest copayments. In Canada and Great Britain, countries with few if any copayments, there was no net decline in the rates of reported physician visits.16
II.D. Prices versus Quantities
Spending growth is the consequence of increasing prices or increasing quantities—or both. The distinction between prices and quantities is cen-tral to our explanation of the downturn, because Medicare, Medicaid, and commercial insurers manage prices and quantities so differently. Medicare performs little utilization review, and its only cost-control tool is to reduce reimbursement rates or, in a few cases, to restrict coverage. Medicaid man-ages reimbursements even more vigorously, for example by cutting reim-bursements rates so much that enrollees essentially lack access to specialty care and newer technologies (Sack 2010).
Commercial payers, on the other hand, are much smaller than govern-ment payers and are far more likely to be affected by the rising power of the provider market.17 Rather than paying less to hospitals and physicians, as Medicare and Medicaid do, they attempt instead to slow health care cost growth on the demand side by increasing deductibles and copayments and by putting enrollees in tiered networks (where patients pay higher copay-ments to access high-cost hospitals).
Is the slowing growth of health care spending a consequence of falling prices or shrinking utilization? This simple question is surprisingly com-plex to answer. First, as Gerald Anderson and others (2003) have argued, the high level of U.S. health care spending reflects higher prices, although it is not known whether their argument applies to the growth of spending.
16. Lusardi, Schneider, and Tufano (2010) also found a large wealth elasticity; those who experienced a greater than 50 percent drop in wealth were far more likely to respond that they had cut back on physician visits.
17. Commercial payers in turn price-discriminate by charging profitable firms more than less-profitable firms (Dafny 2010).
AmitAbh ChAndrA, JonAthAn holmes, and JonAthAn skinner 277
Second, in the short run, price increases are likely to reflect the growth of unmeasured quantities; for example, if hospitals begin charging more to insert a stent, does that mean the price of the same stent went up, or that the hospitals are now using drug-eluting stents when in the past they used bare-metal stents? Third, a price index is quite difficult to measure in health care, since it does not capture improved survival rates and quality of life resulting from technology gains in health (Cutler and Newhouse 1998). Fourth, the well-known problems of Laspeyres price-indexes—that they utilized base-period weights and ignore substitution effects—is particularly pronounced in health care, where new therapies and new conditions can dramatically alter the distribution of spending across categories.
Of course, recognizing that there are serious problems with measure-ment does not mean that nothing can be learned. The problem of quantity and quality changes masquerading as price changes can be ameliorated by comparing relative price differences across payers—Medicare, Med-icaid, and commercial. For example, prices paid by employer-sponsored health insurers for inpatient admissions grew at an annual rate of 5.2 per-cent between 2007 and 2011, while intensity only grew at an annual rate of 1.3 percent annually (Herrera and others 2013). However, during this period Medicare’s reimbursements to hospitals were just above inflation and its reimbursements for outpatient care were just below inflation.18 Thus we can conclude that, even in the presence of biases in measuring price increases for inpatient services, private (commercial) prices rose considerably more rapidly than Medicare prices.
The slowdown in overall Medicare spending could have also occurred because of the growth in managed care contracts—that is, a capitated rather than fee-for-service payment for what is now one-quarter of all Medi-care enrollees. While it is difficult to know utilization trends in managed care (since these are not generally reported), Katherine Baicker, Michael Chernew, and Jacob Robbins (2013) estimate a pronounced spillover effect; health systems treating more managed care patients also treat their fee-for-service patients more conservatively (also see Glied and Zivin 2002). Managed care could have also effected a reduction in the price per enrollee. Cutler and Sahni (2013) use internal data from Office of the Actuary of the Centers for Medicare and Medicaid Services (CMS) to estimate that dur-ing 2009–11, reimbursement rates declined by 1.8 percent annually, largely
18. This is based on our own unreported calculations using cohorts of heart attack patients. See also Levine and Buntin (2013).

278 Brookings Papers on Economic Activity, Fall 2013
because of managed care reimbursement cuts. This means the actual uti-lization would not have fallen by as much as suggested by the decline in aggregate expenditures.19
Finally, there is substantial evidence from across states that during this period, Medicaid continued to cut provider fees and either implicitly or explicitly limit access to high-cost services, such as specialists (Sack 2010). Medicaid has always paid marginal cost or below, but during the Great Recession provider reimbursements have fallen further; the Medicaid-to-Medicare fee ratios for physicians declined from 72 percent to 66 percent between 2008 and 2011 (Zuckerman and Goin 2012).
In sum, our data suggest that price growth rates behaved very differently between commercial plans (the most rapid rate of growth), Medicare (little change in real terms), and Medicaid (some evidence of real price reduc-tions). We turn next to the question of how innovation and the diffusion of new technologies have affected growth in the quantity of health care.
II.E. Technology Growth and Diffusion
The pace of technological growth is likely to have affected recent health care expenditure growth. A substantial percentage of the growth in health care costs since the 1980s has been the diffusion of new and expensive technologies; cardiac catheterization laboratories, hip and knee replace-ments, advanced intensive care unit (ICU) facilities, and new pharmaceuti-cal approaches to treating cancer and other diseases. The diffusion of some of these technologies has indeed slowed. Drug spending actually declined in 2012, not only because of the rising share of generics but also because of a scarcity of new blockbuster drugs (Thomas 2013). But based on the tech-nology pipeline, we believe that there will be a bounce-back in technology growth and innovation.
In earlier work, we found it useful to consider a typology of health care technologies to understand cost growth in health care, and we invoke the same classification here (Chandra and Skinner 2012). Category I treat ments have high average productivity and are responsible for most of the increase in longevity. Category I treatments are either very low-cost, or high-cost but highly cost-effective, such as anti-retrovirals for HIV and AIDS. But even when they include high-cost treatments like anti-retrovirals, Category I technologies have not been a first-order driver of
19. Furthermore, limiting attention to just aggregate Part A and B spending ignores the dramatic growth in Part C (managed care) spending.

AmitAbh ChAndrA, JonAthAn holmes, and JonAthAn skinner 279
cost growth, and we do not expect them to have a discernible impact on overall expenditure growth in the years to come. Category II treatments have heterogeneous benefits across patients—with some patients gaining valuable health benefits but others receiving little incremental value. And Category III treatments—such as proton-beam therapy, or the aggressive use of ICU beds—both are expensive and have unknown (or no) incre-mental benefits.
Figure 6 shows per-enrollee Medicare fee-for-service rates of growth between 1994 and 2010 for a variety of treatments, with rates normal-ized to 1.0 in 1994. In the cases of cardiac stenting and bypass sur-gery, there was a dramatic run-up in their use during the 1990s for heart attacks and other heart disease, with a particularly rapid rise in the use of stents. During the mid-2000s, however, several randomized trials sug-gested that the use of stents for the most common types of heart disease offered only very modest benefits (e.g., Boden and others 2007), leading to a downturn in the use of these procedures. The downturn in the com-bined use of stents and coronary artery bypass grafts (CABG, or bypass surgery) is even more marked, as shown in figure 6. This change was
Source: Dartmouth Atlas of Health Care, various years.
(1994 = 1)
0.70
0.90
1.10
1.30
1.50
1.70
1.90
1996 1998 2000 2002 2004 2006 2008
ICU days (last 6 months)Back surgeryHip/knee replacementCABG and angioplastyAll inpatient surgery
Figure 6. Utilization rates for selected Procedures in the medicare Fee-for-service Population over Age 65, 1994–2009

280 Brookings Papers on Economic Activity, Fall 2013
not unique to cardiovascular procedures; as can be seen, the slow decline was observed for all inpatient surgical procedures as well.
In part, some of the decline in cardiac inpatient procedures could have been the consequence of a gradual shift during this period from inpatient to outpatient procedures—that is, if the operations were increasingly per-formed in outpatient surgical centers. Levine and Buntin (2013) correctly note that these types of technological innovations might be expected to reduce costs on a per-procedure basis, at least while the shift was taking place. At the same time, the introduction of new bioabsorbable stents—which are absorbed into the arterial walls after several months—has led some observers to forecast a rebound in market growth for stents (Zamanian 2013), potentially signaling a renewed rise in inpatient cardiac procedures and their corollary costs.
Other treatments, considered in more detail in table 2 using data from the Dartmouth Atlas of Health Care,20 continued to grow in the later 2000s, but at a slower pace. For example, back surgery, a Category II treatment, grew at an annual rate of 6.5 percent during 1996–2001, before slowing to 2.5 percent growth in 2001–06 and 1.8 percent in 2006–10. And while a few Category III treatments, such as ICU days in the last six months of life (figure 6), continued to expand, table 2 shows clearly that many inpatient surgical procedures had turned the corner by 2006.
Table 2. Annual rates of Change of Per-enrollee Utilization of selected surgical Procedures (Percent)
Procedure 1996–2001 2001–06 2006–10
All surgery 1.3 0.0 -3.4Abdominal aortic aneurysm repair 1.9 -2.1 -3.4Back surgery 6.5 2.5 1.8Coronary angiography 3.8 -1.8 -7.2Coronary artery bypass grafting (CABG) -1.6 -6.6 -7.4Percutaneous coronary interventions 8.0 2.4 -10.9Carotid endarterectomy -1.1 -5.6 -6.1Cholecystectomy -0.6 -3.6 -4.2Hospitalization for hip fracture -0.9 -1.6 -2.4Hip replacement 3.7 2.4 4.0Knee replacement 2.6 7.3 1.6Mastectomy for breast cancer -2.7 -8.7 -6.2Resection for colon cancer -0.3 -3.9 -16.2Aortic/mitral valve replacement 2.7 0.1 0.2
Source: Dartmouth Atlas of Health Care.
20. See http://www.dartmouthatlas.org/tools/downloads.aspx.

AmitAbh ChAndrA, JonAthAn holmes, and JonAthAn skinner 281
Has the use of technology slowed down differentially between Medi-care and commercial insurance? Some evidence for this comes from David Lee and Frank Levy (2012), who document the slowdown in Category II magnetic resonance imaging (MRIs) and X-ray computed tomography (CT scans) during the mid-2000s; for their sample of privately insured patients, growth was essentially flat, while for Medicare CT scans, growth continued at about 5 percent annually (Lee and Levy 2012). The anec-dotal evidence from Lee and Levy (2012) lends support to the view that Medicare has less leverage than private insurance companies in slowing the diffusion of Category II technologies.
II.F. Other Potential Explanations
A variety of other factors might have influenced health care cost growth. Levine and Buntin (2013) find that younger and healthier Medicare enrollees, the leading edge of Baby Boomers, influenced expenditure growth, but the effects they find are small. Wages and compensation for health care employees could have fallen, but we do not find evidence for this using the wage data in the CPS (appendix, figure A2). Finally, as noted above, overall health care employment has continued to climb in the face of declining hospital admissions and physician visits, making it unlikely that health care providers could pass along savings through lower prices.
III. Accounting for Recent Growth in Costs
The major drivers of the health care slowdown are changes in relative prices to consumers and providers (having both income and substitution effects) and technological growth—each of which will affect private, Medicare, and Medicaid patients differently. Figure 7 shows rates of per enrollee uti-lization for each of these different components of health care expenditures. Despite the recent slowdown in Medicare spending growth, total Medicare spending has risen the most rapidly, even during the recent downturn, due to growth in both spending and enrollment (although growth in real terms per beneficiary slowed to 0.4 percent in 2012; Kronick and Po 2013). The overall contribution of private insurance expenditures to health care cost growth has been moderating since the early 2000s because of a decline in the share of the population covered. Even though average real premiums per enrollee have continued to rise by about 2.7 percent per year, most of the increase stemmed from increased prices, and utilization has not grown by much (HCCI 2012).

282 Brookings Papers on Economic Activity, Fall 2013
Table 3 provides our best-guess benchmark 2007–11 measures of the components of growth in Medicare, Medicaid, and private insurance. These include price growth per enrollee, quantity (or intensity) growth per enrollee, and growth in enrollment rates. While there are other components of health care spending, such as public health, we focus on Medicare, Med-icaid, and private commercial insurance payments, whose shares are 30, 22, and 48 percent of this subset of spending, respectively.21
In table 3, we calculate growth in total spending and enrollment using the CMS National Health Expenditures data, supplemented by data on pri-vate premiums from the Kaiser Family Foundation. Price growth in Medi-care, Medicaid, and private insurance is taken from a literature review,
Sources: Total health spending per capita and per enrollee expenditures are from the CMS National Health Expenditures Accounts from 2001–2011, with 2012 estimates for national expenditures provided by the Altarum Institute. Private premiums are for a representative individual with no dependents, and are estimated by the Kaiser Family Foundation. Real values are deflated by the GDP deflator published by the Bureau of Economic Analysis.
(2001 = 100)
120
100
140
160
2002 2003 2004 2005 2006 2007 2008 2009 2010 2011 2012
Medicare per enrollee
Medicaid per enrollee
Average private premium
Private per enrollee
Total health per capita
Figure 7. real health spending per enrollee and per Capita, by Payer, 2001–11
21. Percent of total health care spending is not accounted for by these three categories. This additional portion includes investment in facilities and innovation, and government spending for a variety of other programs, many of which supplement the primary Medicaid and Medicare programs (for example, programs to help pay for Medicare deductibles among Medicaid-eligible enrollees) or which support health care for the military, such as Veterans Affairs (VA). We assume that these follow the trends of the main three programs.

AmitAbh ChAndrA, JonAthAn holmes, and JonAthAn skinner 283
and then we calculate utilization growth to be the residual “real” growth rate.22 Considering first the Medicare market, we use the Levine and Buntin (2013) estimates of changes in Medicare price growth.23 Medicaid price growth varies widely by state, but we abstract from this regional variation by taking the aggregate estimates of price growth from Stephen Zuckerman
Table 3. Growth rates of Prices, Utilization, and enrollments by Payer, 2007–11 (Percent)
Payer
Price growth (real)
Utilization growth
Enrollment growth
Share of payments
Share of enrollees
Medicarea 0.9 1.4 2.5 30 16Medicaidb -0.4 -0.1 4.7 22 19Privatec 2.7 0.7 -1.3 48 65
Total (weighted) 1.5 0.7 0.4 100 100
Notes: The GDP deflator was 1.6 percent and was subtracted from column 1. To estimate aggregate price growth, we take a weighted average of component growth rates for the years 2007–2011, where the weights are total spending by component-year.
We take per enrollee spending growth, enrollment growth, share of payments, and share of enrollees from the data sets listed in figure 7. Utilization growth (gu) is calculated from nominal spending growth (gn) and price growth (gp) according to the equation:
gg
gu
n
p
+ =++
11
1.
Total price and utilization growth rates are weighted by the share of payments. Enrollment growth is weighted by the share of enrollees.
a. Price growth in Medicare is based on estimates of nominal price growth of 2.5 percent per year between 2007 and 2010 by Levine and Buntin (2013).
b. Medicaid price growth is taken from Zuckerman and Goin (2012), who estimate that physician fees have risen by 4.9 percent in Medicaid between 2008 and 2012, which is an annualized growth rate of 1.2 percent.
c. Price growth for private payers is calculated based on Health Care Cost Institute calculations of price and utilization growth for inpatient, outpatient, physician, and prescription drug benefits in their 2010, 2011, and 2012 cost growth reports.
22. Because utilization is taken as the residual after subtracting price growth from total costs per enrollee, our measure of utilization changes will confound changes in utilization per enrollee and changes in the health composition of current enrollees. For Medicaid, the impact of composition changes is large because of the influx of young, non-disabled adults during the recession; we discuss this issue later in the text. For Medicare, changes in com-position should be minor, since the average age of Medicare patients changed very little between 2007 and 2011 as the baby boomers started to retire. For private insurance, the com-position effect is harder to estimate. Insurance rates have gone up, both among healthy under-26-year-olds who are now allowed to stay on their parents’ plans and also among seniors and those over 55. Note that for all of these estimates, we also do not attempt to control for differ-ential selection of healthy or sick individuals at a given age out of private insurance and into Medicaid during the recession, a phenomenon that is understudied and poorly understood.
23. Note that this measure roughly tracks the CPI-U, which is another measure of infla-tion. As noted above, we also find in unreported analyses that growth in Medicare reimburse-ment rate lags even the GDP deflator for Part B physician services.

284 Brookings Papers on Economic Activity, Fall 2013
and Dana Goin (2012). Finally, our estimates of real price growth are based on the HCCI (2012) estimates for 2007–11.24
We can use this table to consider several straightforward hypotheses. First, how much did the ability of state governments to hold the line on additional Medicaid expenditures contribute to the slowdown? Under the counterfactual that Medicaid prices would have risen as rapidly as private health insurance prices, the answer is 0.5 percent slower growth during this period, which is half of the unexplained 1-percentage-point drop estimated by Cutler and Sahni (2013).
A second question is, How much have utilization controls at pri-vate providers (chiefly through increased cost sharing) and in Medicaid (chiefly through the restriction of certain types of care such as specialist visits) contributed to the slowdown? This is a more difficult question to answer, because Medicaid enrollees have been becoming healthier over time. Between 2007 and 2010, because of the weak economy, enrollment in Medicaid rose far faster among healthier adults than among those who were aged or disabled. Based on a simple back-of-the-envelope calcula-tion, average utilization between 2007 and 2010 would be expected to fall by about 0.8 percent per year simply because the average age of Medicaid patients is dropping. This means age-adjusted utilization growth in Medic-aid is closer to 0.7 percent per year, which is similar to utilization growth in private spending. After this correction, if we were to assume that utilization growth for both private plans and Medicaid were equal to the 1.4 percent utilization growth in Medicare, then overall spending growth would have been 0.4 percent higher.
IV. Will Cost Growth Revert to Long-Run Trends?
Two decades ago, Joseph Newhouse addressed the question of why health care continued to rise so much faster than GDP growth (Newhouse 1992). After ruling out a number of alternative explanations, he arrived at the root cause: technological innovations. Other factors, such as changes in insurance generosity and coverage, had increased utilization, but these were one-time shifts rather than a movement in the long-term growth rate. Thus our next task is to attempt to disentangle what might be the short-run effects that might be expected to moderate or disappear, in order to
24. This aggregate number hides a substantial amount of heterogeneity across spending categories.

AmitAbh ChAndrA, JonAthAn holmes, and JonAthAn skinner 285
discern the underlying long-run growth rate in health care expenditures, with a special focus on technology growth and diffusion. We recognize the risks of prognostication. As John Kenneth Galbraith noted, “There are two types of forecasters; those who don’t know and those who don’t know they don’t know.”25 Thus these predictions come with very wide confidence intervals.
We consider three complementary approaches to assessing the prospect for long-term growth. The first approach peers into the technology pipeline to see whether it really has slowed, and also whether industry observers are optimistic with regard to future growth in devices and surgical procedures. The second approach considers relative movements in health sector stock prices. The third and final approach is to use the estimates from table 3 above to develop our best estimate of the long-run trends separate from short-run or transitory effects.
IV.A. The Technology Pipeline
Let us consider, qualitatively, developments in health care technology. We first note, as have Cutler and Sahni (2013), a distinct lack of new block-buster drugs; combined with a rising share of generic drug sales, the phar-maceutical industry has exhibited slow growth in recent years. Yet drugs account for roughly one-tenth of total health care spending.
The story is different, however, for devices and new surgical procedures, particularly in cardiovascular care. For example, there has been rapid dif-fusion in left ventricular assistance devices (LVADs). These devices were originally used to keep potential heart transplant patients alive, but now they are increasingly used for long-term therapy among patients with heart failure. LVADs are very expensive, costing over $300,000 in the first year (Rogers and others 2012). While the market now is relatively modest (and includes former Vice President Richard Cheney), the sector’s growth rate is projected to be 10 to 15 percent annually.26 More worrisome with regard to costs is the interest among clinicians in expanding the use of LVADs to patients over age 70, as well as to less seriously ill (but far more plentiful) patients, such as those with Class III heart failure (Stewart and Stevenson 2011).
Another cardiovascular care procedure being developed is the new transaortic valve replacement (TAVR). While many elderly people have
25. http://www.economist.com/blogs/buttonwood/2012/01/economics-and-markets.26. The Wall Street Transcript, March 19, 2012. http://finance.yahoo.com/news/10-15-
growth-ventricular-assist-190300712.html.

286 Brookings Papers on Economic Activity, Fall 2013
valve disorders, for most the risk of open surgery is not worth the benefit of replacing the valve. These valve replacements, by contrast, do not require open heart surgery, but are instead inserted using a catheter threaded through the femoral artery, a much less invasive procedure. There is con-sequently a much larger potential market for the use of TAVRs among the thousands of frail elderly people suffering from poor circulation. Addi-tional new technologies with robust growth projections include left atrial appendage closure for atrial fibrillation patients, and bioabsorbable stents, designed to be reabsorbed into the body after several months and thus reducing the risk of adverse long-term complications.
There are also many new developments in the treatment of cancers. One that has been gaining considerable attention from both policymakers and investors is the increased use of proton beam therapy for prostate cancer patients. While there is no evidence that outcomes arising from this treat-ment are better than alternative treatments, such as radiation therapy or prostatectomy (the removal of the prostate), it costs roughly double what they cost—$50,000 per course of treatment as compared with $25,000 or even less. This is an example of a Category III treatment, expensive but with no proven value. The willingness of Medicare (and hence private insurance) to pay at least the average total cost of this treatment creates a strong incentive to invest in the large fixed costs of the proton beam facil-ity (hundreds of millions of dollars) and an equally strong incentive to run through as many prostate cancer patients as possible to pay off the bonds.
Figure 8 shows the number of actual and expected proton beam facili-ties in the United States.27 After a slow start in the 1990s, there has been a rapid acceleration in the planning of these facilities, often with two hospi-tals in the same region each planning their own facility (Gold 2013). The total number of proton beam accelerators (planned and built) is expected to double between 2010 and 2014 alone, suggesting that a major driver of costs—Category III technologies—is still being discovered.
Predicting aggregate trends in technology development, rather than just specific cases, is much harder. One proxy for future growth is new medi-cal technology funding, which has nearly doubled between 2009 and 2013 (MedMarket Diligence 2013). Another proxy for future technology growth is the number of patents approved. The number of U.S. patents approved
27. These are from the Particle Therapy Co-Operative Group, which provides informa-tion on both proton beam therapy facilities in operation (http://ptcog.web.psi.ch/ptcentres.html) and those being built or planned (http://ptcog.web.psi.ch/newptcentres.html).

AmitAbh ChAndrA, JonAthAn holmes, and JonAthAn skinner 287
for medical device manufacturing remained steady at about 9,000 per year between 2000 and 2004, fell to about 7,000 per year between 2005 and 2010, and then rose to record levels of about 13,000 per year between 2011 and 2012.28 As noted by Levine and Buntin (2013), the number of approved patents is partly determined by internal policies of the U.S. Patent Office, so it is not a good proxy for year-on-year investment research and develop-ment. However, what the recent surge in approved patents does suggest is that the pipeline is full of technologies that may appear on the market in the coming two decades.
Why is the United States particularly vulnerable to technology growth that is highly costly yet yields benefits that are often small or not reliably measured? One reason may be that Medicare is legislated to pay for any treatments that will not actually cause harm. Until recently, private insur-ance companies have found it difficult to refuse payment for treatments already approved by Medicare, so the United States is a particularly fertile environment for such growth (Chandra and Skinner 2012). To return to
Source: Particle Therapy Co-Operative Group.a. Includes all facilities operating, under construction, or planned as of 2013.
5
10
15
20
1995 2000 2005 2010 2015
Proton beam accelerator centers
Figure 8. number of Proton beam Accelerator Facilities in the U.s., 1990–2016a
28. Patent statistics are taken from the U.S. Patent and Trademark Office Patent Team’s Monitoring Report on Medical Devices (http://www.uspto.gov/web/offices/ac/ido/oeip/taf/meddev.htm#PartA2_1).

288 Brookings Papers on Economic Activity, Fall 2013
the example of the proton beam accelerator, consider that Germany, Italy, Spain, the United Kingdom, and France combined have about the same population as the United States, but as of 2013 they have among them just 10 proton beam accelerators (and an average of 1.2 per year coming online in the near future), as compared to 15 accelerators in the United States (and an average of 3 per year coming online).
IV.B. Financial Markets
Another approach to projecting long-term growth in the health care sec-tor is to examine the response of financial markets to both the overall slow-down in health care expenditures, and more specifically to the introduction of the ACA. Mohamad Al-Ississ and Nolan Miller (2013) use Massachu-setts Republican Scott Brown’s election to the U.S. Senate as an instru-ment to measure the impact of a decline in the probability of the ACA’s passage.29 Based on the 2.1 percent abnormal returns to the stock market in response to the fall in the probability of passage, they conclude that the ACA was viewed by Wall Street as supporting cost-containment—although the expansion of Medicaid was anticipated to have a beneficial impact on hospital stocks.
But what about the health care cost growth slowdown more generally— can we detect a general downturn in health sector stocks since the mid-2000s? The comparison is complicated by the stock market collapse during the recession, but it is still instructive to compare the long-term relative trends in equity returns for the health sector on the New York Stock Exchange (figure 9). The evidence from these returns is not consistent with the hypothesis that new efforts to contain costs (whether through the ACA, employers, or insurance companies) have at last put a brake on the develop-ment and diffusion of profitable Category II and Category III treatments.30
IV.C. Predicting Cost Growth
To make our prediction, we begin with the 2007–11 growth data in table 3, and we consider how these different factors each might be expected to be transformed, given the evidence discussed in the earlier sections. Consider first the private insurance market. Prices might continue to rise faster than
29. The Massachusetts senate seat, filled upon the death of Democrat Edward Kennedy, was a “swing vote” in the sense that it had allowed Democrats to override Republican objec-tions to the ACA legislation.
30. These series have not been adjusted for differences in risk that would lead to higher or lower expected returns in the health care sector.

AmitAbh ChAndrA, JonAthAn holmes, and JonAthAn skinner 289
inflation, as they have since the mid-2000s. However, we usually assume that when prices rise because of market power, such as hospital consolida-tion (as in Gaynor and Town 2012) or lack of price transparency, at some point the limits of consolidation and opaqueness will be reached, limiting the scope by which prices may be expected to grow forever. Similarly, the introduction of price-reducing reforms such as bundled payments, refer-ence pricing, or an improvement in price transparency would be expected to slow price growth down substantially in the shorter term, but would have little effect on long-term growth in prices.31 We conjecture that real price increases in the private insurance sector will drop from the 2.7 percent annual growth in 2007–11 to 1.5 percent over the next two decades.
Source: New York Stock Exchange Index Services. a. The NYSE currently includes 109 companies that are classified in the health care sector according to
the Industry Classification Benchmark, which is proprietary to FTSE International Limited and Dow Jones & Company, Inc. The most common company types in the index are pharmaceutical companies, health care providers, and medical equipment companies.
Cumulative return (January 2003 = 100)
1
1.5
2
2.5
2004 2005 2006 2007 2008 2009 2010 2011 2012 2013
Composite index
Health indexa
Figure 9. new York stock exchange Cumulative returns, health sector and nYse Composite index, 2003–13
31. One could also appeal to a “Baumol’s disease” explanation; that productivity gains in health care will be limited and so the relative price of health care will continue to rise. But others point to large potential productivity gains in the health care sector relative to other sectors of the economy (for example, Chandra and Skinner 2012).

290 Brookings Papers on Economic Activity, Fall 2013
In the longer term, it is unlikely that the growth rate in Medicaid pay-ments can continue to fall so far behind Medicare payments while still maintaining a network of providers willing to accept Medicaid patients. Thus we assume that both Medicaid and Medicare payments will continue to rise by a rate of 0.9 percent plus inflation (the current Medicare rate of growth in reimbursement, from table 3). This would be substantially slower cost growth than in private plans because of Medicare’s ability to impose administratively set prices.
What then will happen to real quantity increases in health care? As noted in table 3, real Medicare utilization per enrollee rose at 1.4 percent annually based on 2007–11 growth patterns, which we assume will con-tinue.32 This is a conservative estimate, since there are reasons (as noted
32. While more recent (2009–12) Medicare growth is lower, this in turn is partially the consequence of transitory factors such as increased fraud enforcement (per capita spending in Miami, Florida, actually fell in nominal terms) and a transition to generic drugs; these are unlikely to persist for the next few decades. This prediction takes into account the imminent provisions of the ACA but not the more speculative impacts of cost-saving experiments (such as bundled payments), which will require additional legislation to fully implement.
Sources: Monthly Health Expenditure Data are calculated by the Altarum Institute, and monthly GDP is estimated by Macroeconomic Advisors.
Note: Graph is smoothed using a kernel density estimator with an Epanechnikov kernel and a bandwidth of 2 months.
Smoothed yearly growth rate (percent)
0
5
2008 2009 2010 2011 2012 2013
Real GDP
Real NHE
Difference
Figure 10. difference between Yearly Growth in national health expenditure (nhe) and GdP, 2007–13

AmitAbh ChAndrA, JonAthAn holmes, and JonAthAn skinner 291
above) to believe that a new wave of innovations could increase Medi-care spending. Private plans continue to have avenues for restricting spending, such as defined-contribution plans, limited networks, value-based-insurance design, and transparency tools. But the rollout of new high-deductible plans is nearly finished, and so we expect utilization growth to bounce back to 1.4 percent per year. We further assume a long-term growth in per capita Medicaid utilization of 1 percent, which is marginally higher than the age-adjusted real growth in utilization for Medicaid during 2007–11.
Finally, what about enrollment growth? The ACA will increase the frac-tion of uninsured who qualify for Medicaid, but the best estimate of how that will affect spending is roughly $1,000 per individual (Finkelstein and others 2012), so even if 3 percent of the population becomes newly eligible for Medicaid, this will still only boost per capita health care expenditures by $30. Of course, aging baby boomers will tend to increase enrollment in the Medicare program (which grew at 2.4 percent between 2008 and 2012), but we account for such changes by applying a general aging index, which actuaries have estimated to be roughly 0.4 percent annually, using recent data (Yamamoto 2013).
Adding these three effects (1.2 percent for price growth plus 1.3 per-cent for utilization growth and 0.4 percent for aging) yields an annual real growth in health care spending of 2.9 percent. Longer-term real GDP growth projections based on the Congressional Budget Office and the U.S. Census Bureau suggest real GDP per capita growth of 1.7 percent from 2012 through 2032.33 In sum, we end up at GDP plus 1.2 percent; certainly below the historical record of GDP plus 2.4 percent (Fuchs 2013) and not very different from current (2013) data (figure 1), but still consistent with a long-term growth rate in the health sector from 17.9 percent currently to roughly 23 percent in 2032.
V. Conclusion
There has been considerable media and government attention to the question of whether health care costs have moderated. In this paper, we reconsider the existing evidence on this slowdown by taking a more disag-gregated view of the health care sector. We first note that while all measures
33. This calculation was based on 2012–23 data in the Budget and Economic Outlook (CBO, February 2013), projected forward using their 2.2 percent growth rate for the last three years of their projection, and deflated by U.S. Census population projections.

292 Brookings Papers on Economic Activity, Fall 2013
of health care spending and utilization point toward a recent slowdown, it was not the first time this has happened; health care costs as a fraction of GDP had actually declined in the early 1990s before resuming their strong upward trend in the later 1990s. And certainly the remarkable stability in one measure of health care employment growth reinforces Victor Fuchs’ (2013) caution against inferring too much about the next two decades from just a few years of data.
Second, we present evidence that aggregate health care spending growth might not exhibit a stable association with GDP growth over the medium term. Unlike other types of consumption, health care in the United States is an aggregate of very different systems—private, Medicare, and Medicaid— whose dynamic paths of quantity and costs do not move in lockstep with one another, particularly during a recession or business cycle expansion. For this reason, we argue that researchers should consider a more disag-gregated model of health care, complete with a specification of the factors such as reimbursement rates, prices, and technological developments for public and private services.
Third, in explaining the downturn in health care spending, we have placed a greater emphasis than previous researchers on the rise in cost sharing in the private insurance market. Although we consider these changes in a static framework—one can’t continue to raise co-payment rates forever—there may also be dynamic effects arising from these changes. According to Amy Finkelstein (2007) and Jeffrey Clemens (2011), the rise of high-deductible health insurance will both deliver a short-run reduction in the quantity of services demanded and also exert a longer-term impact on the incentive to adopt and pay for new innovations. That said, we do not see evidence of such a long-term impact on innovation, at least based on the relative growth of health sector stock prices.
Fourth, we predict continued long-term growth in real per capita health care spending that will exceed GDP. Our best guess is GDP plus 1.2 per-cent, which puts us in the middle of the pack between Medicare actuar-ies and the CBO, albeit with wide confidence intervals. Even this modest estimate is not a cause for celebration; Charles Roehrig (2012) has called attention to the “triangle of painful choices,” which outlines the set of very unpleasant options facing the United States even in the face of a “moder-ate” GDP plus 1 percent growth rate in health care costs. The pain includes some combination of increases in tax rates or drastic cuts in non-health spending, and does not capture the additional unpleasantness of private health insurance premium hikes soaking up any real wage growth for the median worker (Auerbach and Kellermann 2011).
AmitAbh ChAndrA, JonAthAn holmes, and JonAthAn skinner 293
Finally, and more optimistically, we also recognize that the structure and balance of power among providers and insurers may be undergo-ing fundamental changes. For example, private insurers, emboldened by an increase in market share as they receive more patients from health exchanges and the Medicare Advantage program, may begin to push back against the coverage of Category III treatments.34 Nascent signs of this are apparent in the isolated decisions by some private insurers to no longer cover proton-beam therapy.35
Similarly, the adoption of ACOs in Medicare and the move toward bundled payments could encourage providers to switch from expen-sive and unproven therapies to cheaper ones. Many of these initiatives involve private partnerships with leading integrated delivery systems, such as Intermountain Healthcare’s collaboration with General Electric. Moreover, on both sides of the political aisle there is a consensus that fee-for-service creates incentives for overuse. And while the exact sol utions to this problem may differ on the spectrum of market versus regulatory approaches to technology management, a Republican-led Congress would continue the move toward payment reform. Yet ultimately, all policy solu-tions must also address the concern that the long-term technology pipeline will continue to deliver new technology with large price tags but very modest health benefits.
34. Howard Dean disagreed. In December 2009, just a few months before the ACA passed, he said, “This is the insurance company’s dream, this bill.” See “Howard Dean: Health Care Bill ‘Bigger Bailout for the Insurance Industry Than AIG’ ” (news report dated December 16, 2009, posted on the website of ABC News. http://abcnews.go.com/GMA/HealthCare/howard-dean-health-care-bill-bigger-bailout-insurance/story?id=9349392#).
35. Another example is the recent decision by Memorial Sloan Kettering Cancer Center to eschew Zaltrap for colon-cancer (at $11,000 per month) in favor of Avastin, costing half the price, which captures the potential for real cost saving without sacrificing quality of care (Bach, Saltz, Wittes 2012).

Source: Authors’ calculations based on the Current Population Survey Merged Outgoing Rotation Groups, which are maintained by the NBER. Sample includes employees ages 18 to 64 and excludes self-employed workers, and nominal wages are deflated using the GDP deflator published by the Bureau of Economic Analysis.
Self-reported weekly income (2009 dollars)
600
650
700
750
1991 1993 1995 1997 1999 2001 2003 2005 2007 2009 2011
All employees
Health employees
Figure A2. real median income of Full-time employees (All vs. health sector), 1990–2012
A P P e n d i x
Source: Current Employment Statistics and author calculations based on the Current Population Survey Merged Outgoing Rotation Groups, which are maintained by the NBER. Current employment statistics measure the growth in all non-farm jobs, and the Current Population Survey sample is restricted to those aged 18–64.
Yearly employment growth (percent)
−4
−2
2
0
2002 2003 2004 2005 2006 2007 2008 2009 2010 2011 2012
Current Population Survey
Current Employment Statistics
Figure A1. Year-over-Year employment Growth for the Current Population survey (CPs) and the Current employment statistics (Ces), by month, 2001–13

Table A1. Growth in real national health expenditures (nhe)a and real GdP,b by Year, 2001–13 (Percent)
Year NHE GDP NHE minus GDP
2001–02 8.8 2.7 6.12002–03 6.1 2.5 3.62003–04 4.0 3.8 0.22004–05 3.5 3.3 0.22005–06 3.2 2.0 1.22006–07 3.6 1.9 1.72007–08 2.4 1.0 1.42008–09 3.7 -4.3 8.02009–10 2.6 3.3 -0.72010–11 1.2 1.5 -0.32011–12 3.5 3.6 -0.12012–13 2.5 1.2 1.3Average 3.8 1.9 1.9Average, 2006–13 2.8 1.2 1.6
a. Estimates of nominal national health expenditures each July by year are from the Altarum Institute. We use the implicit GDP deflator from Macroeconomic Advisors to deflate nominal national health expenditures.
b. Estimates of GDP each July are from Macroeconomic Advisors.
Table A2. real Per Capita spending Growth by Payer vs. GdP Growth rate, 1970–2012(Dependent variable: growth in real per capita costs paid by)
Total Personal Medicare MedicaidPrivate
Insurance
Out-of-pocket
spending
Panel A: no lagsReal, per capita
GDP growth (Current period)
0.165(0.105)
0.0625(0.0939)
-0.217(0.256)
-0.370(0.433)
0.512**(0.233)
0.508***(0.168)
R2 (Model 1) 0.044 0.007 0.017 0.022 0.089 0.164
Panel B: with 3 lagsSum of current and
lagged real per capita GDP growth
0.553*** 0.544*** -0.463 0.313 0.980* 0.962**
Wald F statistic 6.77 8.81 .998 .323 3.7 7.33P-value 0.013 0.005 0.324 0.573 0.062 0.010R2 0.189 0.170 0.025 0.105 0.190 0.229
Panel C: with 5 lagsSum of current and
lagged real per capita GDP growth
1.398*** 1.187*** -0.820 2.179** 3.076*** 1.589***
Wald F statistic 54.4 41.4 1.06 6.35 58.4 15P-value 0.000 0.000 0.311 0.016 0.000 0.000R2 0.561 0.437 0.040 0.244 0.570 0.338First year 1970 1970 1970 1970 1970 1970Last year 2012 2012 2011 2011 2011 2011N 43 43 42 42 42 42
Source: Total national health expenditures are from the CMS National Health Expenditures Accounts from 1970–2011, with 2012 estimates for total and personal spending provided by the Altarum Institute. The gross domestic product and GDP deflator are published by the Bureau of Economic Analysis.
*p < .10, **p < .05, ***p < .01Note: Standard errors in parentheses. Results are from OLS regressions with robust standard errors. F statistics
are against the null that the current and all lagged coefficients are all equal to zero.

Tabl
e A
3. h
ealth
spe
ndin
g G
row
th v
s. G
dP
Gro
wth
rat
e
Dep
ende
nt v
aria
ble:
gro
wth
in r
eal p
er c
apit
a to
tal n
atio
nal h
ealt
h ex
pend
itur
es
(1)
(2)
(3)
(4)
(5)
(6)
(7)
(8)
Rea
l per
cap
ita
G
DP
grow
th0.
165
(0.1
05)
Ave
rage
2-y
ear
G
DP
grow
th0.
164
(0.1
16)
Ave
rage
3-y
ear
G
DP
grow
th0.
183
(0.1
67)
Ave
rage
4-y
ear
G
DP
grow
th0.
428*
*(0
.196
)A
vera
ge 5
-yea
r
GD
P gr
owth
0.93
8***
(0.1
92)
Ave
rage
6-y
ear
G
DP
grow
th1.
328*
**(0
.176
)A
vera
ge 7
-yea
r
GD
P gr
owth
1.47
5***
(0.2
07)
Ave
rage
8-y
ear
G
DP
grow
th1.
488*
**(0
.249
)C
onst
ant
0.03
85**
*0.
0385
***
0.03
81**
*0.
0337
***
0.02
40**
*0.
0161
***
0.01
25**
*0.
0116
**(0
.003
20)
(0.0
0351
)(0
.004
42)
(0.0
0448
)(0
.003
91)
(0.0
0359
)(0
.004
39)
(0.0
0545
)
Fir
st y
ear
1970
1970
1970
1970
1970
1970
1970
1970
Las
t yea
r20
1220
1220
1220
1220
1220
1220
1220
12R
20.
0439
0.02
770.
0225
0.08
270.
270
0.40
20.
388
0.32
7N
4343
4343
4343
4343
Sou
rce:
Tot
al n
atio
nal h
ealt
h ex
pend
itur
es a
re f
rom
the
CM
S N
atio
nal H
ealt
h E
xpen
ditu
re A
ccou
nts
from
197
0–20
11, w
ith
2012
est
imat
es p
rovi
ded
by
the
Alt
arum
Ins
titu
te. T
he g
ross
dom
esti
c pr
oduc
t and
GD
P de
flat
or a
re p
ubli
shed
by
the
Bur
eau
of E
cono
mic
Ana
lysi
s.*p
< .1
0, *
*p <
.05,
***
p <
.01
Stan
dard
err
ors
in p
aren
thes
es. R
esul
ts a
re f
rom
OL
S re
gres
sion
s w
ith r
obus
t sta
ndar
d er
rors
.

AmitAbh ChAndrA, JonAthAn holmes, and JonAthAn skinner 297
ACKNOWLEDGMENTS We are grateful for the very helpful comments received from Kate Baicker, Douglas Elmendorf, Aaron Kaplan, Charles Roehrig, and the editors, as well as for financial support received from the National Institute on Aging (PO1-AG19873). Jonathan Skinner is an unpaid member of an advisory committee for the Altarum Institute and has a finan-cial interest in Dorsata Inc., a clinical pathways software company. Amitabh Chandra serves on the Congressional Budget Office’s Panel of Health Advisors.

298 Brookings Papers on Economic Activity, Fall 2013
References
Acemoglu, Daron, Amy Finkelstein, and Matthew J. Notowidigdo. 2013. “Income and Health Spending: Evidence from Oil Price Shocks.” Review of Economics and Statistics 95, no. 4: 1079–95.
Aizcorbe, Ana, Ralph Bradley, Ryan Greenaway-McGrevy, Brad Herauf, Rich-ard Kane, Eli Liebman, Sara Pack, and Lyubov Rozental. 2011. “Alternative Price Indexes for Medical Care: Evidence from the MEPS Survey.” Working Paper no. 0069. Washington: Bureau of Economic Analysis.
Al-Ississ, Mohamad M., and Nolan H. Miller. 2013. “What Does Health Reform Mean for the Health Care Industry? Evidence from the Massachusetts Special Senate Election.” American Economic Journal: Economic Policy 5, no. 3: 1–29.
Anderson, Gerald F., Uwe E. Reinhardt, Peter S. Hussey, and Varduhi Petrosyan. 2003. “It’s the Prices, Stupid: Why the United States Is so Different from Other Countries.” Health Affairs 22, no. 3: 89–105.
Antos, Joseph R. 2013. “Containing Health Care Costs: Recent Progress and Remaining Challenges.” Testimony before the U.S. Senate Committee on the Budget, Washington D.C., July 30.
Aron-Dine, Avivia, Liran Einav, Amy Finkelstein, and Mark R. Cullen. 2012. “Moral Hazard in Health Insurance: How Important Is Forward Looking Behavior?” NBER Working Paper no. 17802, February. Cambridge, Mass.: National Bureau of Economic Research.
Auerbach, David I., and Arthur L. Kellermann, 2011. “A Decade of Health Care Cost Growth Has Wiped Out Real Income Gains for an Average U.S. Family.” Health Affairs 30, no. 9: 1630–36.
Bach, Peter, Leonard B. Saltz, and Robert E. Wittes. 2012. “In Cancer Care, Cost Matters.” New York Times, October 15, p. A25.
Baicker, Katherine, Michael Chernew, and Jacob Robbins. 2013. “The Spillover Effects of Medicare Managed Care: Medicare Advantage and Hospital Uti-lization.” Working Paper no. 19070. Cambridge, Mass.: National Bureau of Economic Research.
Baicker, Katherine, and Dana Goldman. 2011. “Patient Cost-Sharing and Health-care Spending Growth.” Journal of Economic Perspectives 25, no. 2: 47–68.
Boards of Trustees, Federal Hospital Insurance and Federal Supplemental Medical Insurance (Boards of Trustees). 2013. The 2013 Annual Report of the Boards of Trustees of the Federal Hospital Insurance and Federal Supplemental Medical Insurance. Washington: Center for Medicare and Medicaid Services.
Boden, William E., Robert A. O’Rourke, Koon K. Teo, Pamela M. Hartigan, and others. 2007. “Optimal Medical Therapy with or without PCI for Stable Cor-onary Disease.” New England Journal of Medicine 356 (April 12): 1503–16.
Borger, Christine, Thomas F. Rutherford, and Gregory Y. Won. 2008. “Project-ing Long-Term Medical Spending Growth.” Journal of Health Economics 27, no. 1: 69–88.
Bowler, Mary, and Teresa Morisi. 2006. “Understanding the Employment Mea-sures from the CPS and CES Survey.” Monthly Labor Review 129: 23–38.

AmitAbh ChAndrA, JonAthAn holmes, and JonAthAn skinner 299
Chandra, Amitabh, Maurice Dalton, and Jonathan Holmes. 2013. “Large Increases in Spending on Postacute Care in Medicare Point to the Potential for Cost Sav-ings in These Settings.” Health Affairs 32, no. 5: 864–72.
Chandra, Amitabh, and Jonathan Skinner. 2012. “Technology Growth and Expendi-ture Growth in Health Care.” Journal of Economic Literature 50, no. 3: 645–80.
Clemens, Jeffrey. 2011. “The Effect of U.S. Health Insurance Expansions on Medi-cal Innovation.” SIEPR Discussion Paper No. 11-016, Stanford University.
———, and Joshua Gottlieb. 2013. “Do Physicians’ Financial Incentives Affect Treatment Patterns and Patient Health?” SIEPR Discussion Paper no. 11-017, Stanford Institute for Economic Policy Research.
Colla, Carrie, David Wennberg, Ellen Meara, Jonathan Skinner, Daniel Gottlieb, Valerie Lewis, Christopher Snyder, and Elliot Fisher. 2012. “Spending Differ-ences Associated with the Medicare Physician Group Practice Demonstration.” Journal of the American Medical Association 308, no. 10: 1015–23.
Collins, Sara R., Ruth Robertson, Tracy Garber, and Michelle Doty. 2013. “Insuring the Future: Current Trends in Health Coverage and the Effects of Implementing the Affordable Care Act.” Washington/New York: Commonwealth Fund.
Congressional Budget Office. 2013. “The 2013 Long-Term Budget Outlook.” Washington.
Council of Economic Advisors (CEA). 2013. “Trends in Healthcare, Cost Growth, and the Affordable Care Act.” Washington (November).
Cutler, David, Mark McClellan, and Joseph Newhouse. 1998. “What Has Increased Medical-Care Spending Bought?” American Economic Review 88, no. 2: 132–36.
Cutler, David, and Nikhil Sahni. 2013. “If Slow Rate of Health Care Spending Growth Persists, Projections May Be Off by $770 billion.” Health Affairs 32, no. 5: 841–50.
Dafny, Leemore. 2010. “Are Health Insurance Markets Competitive?” American Economic Review 100, no. 4: 1399–1431.
Einav, Liran, Amy Finkelstein, Stephen P. Ryan, Paul Schrimpf, and Mark R. Cullen. 2013. “Selection on Moral Hazard in Health Insurance.” American Economic Review 103, no. 1: 178–219.
Finkelstein, Amy. 2007. “The Aggregate Effects of Health Insurance: Evidence from the Introduction of Medicare.” Quarterly Journal of Economics 122 no. 3: 1–37.
———, Sarah Taubman, Bill Wright, Mira Berstein, and others (including the Oregon Health Study Group). 2012. “The Oregon Health Insurance Experi-ment: Evidence from the First Year.” Quarterly Journal of Economics 126, no. 3: 1057–1106.
Fuchs, Victor. 2013. “The Gross Domestic Product and Health Care Spending.” New England Journal of Medicine 369, no. 2: 107–09.
Gaynor, Martin, and Robert Town. 2012. “The Impact of Hospital Consolidation—Update.” Princeton: The Synthesis Project, Robert Wood Johnson Foundation.
Getzen, Thomas E. 1992. “Population Aging and the Growth of Health Expendi-tures.” Journal of Gerontology 47, no. 3: S98-S104.
———. 2011. “Long-Run Forecasts of National Health Expenditure Growth.” Working Paper. Available at SSRN: http://ssrn.com/abstract=1950810 or http://dx.doi.org/10.2139/ssrn.1950810.

300 Brookings Papers on Economic Activity, Fall 2013
Glied, Sherry, and Joshua Griff Zivin. 2002. “How Do Doctors Behave When Some (But Not All) of Their Patients Are in Managed Care?” Journal of Health Economics 21, no. 2: 337–53.
Gold, Jenny, 2013. “Proton Beam Therapy Heats Up Hospital Arms Race.” Kaiser Health News, May 31.
Goldsmith, Jeff. 2012. “Health Care: An Alternate Economic Universe.” Health Affairs blog post dated August 23. http://healthaffairs.org/blog/2012/08/23/health-care-an-alternate-economic-universe. Accessed January 15, 2014.
Health Care Cost Institute (HCCI). 2012. “Health Care Cost and Utilization Report: 2011.” Washington.
Herrera, Carolina-Nicole, Martin Gaynor, Navid Newman, Robert J. Town, and Stephen T. Parente. 2013. “Trends Underlying Employer-Sponsored Health Insurance Growth for Americans Younger than Age Sixty-Five.” Health Affairs 32, no. 10: 1715–22.
Kaiser Family Foundation. 2013. “Assessing the Effects of the Economy on the Recent Slowdown in Health Spending.” April 22. http://tinyurl.com/lo3sgh3.
Karaki, Fatima. 2012. “Left Ventricular Assist Devices (LVADs): Overview and Future Directions.” Presentation at the Biomedical Innovation Workshop, December 14, PARI (University of Tokyo).
Kronick, Richard, and Rosa Po. 2013. “Growth in Medicare Spending per Ben-eficiary Continues to Hit Historic Lows.” Washington: Office of the Assistant Secretary for Planning and Evaluation, U.S. Department of Health and Human Services.
Lee, David and Frank Levy. 2012. “The Sharp Slowdown in Growth of Medical Imaging: An Early Analysis Suggests Combination of Policies Was the Cause.” Health Affairs 31, no. 8: 1876–84.
Lemieux, Jeff, and Teresa Mulligan. 2013. “Trends in Inpatient Hospital Prices, 2008 to 2010.” American Journal of Managed Care 19, no. 3: 106–13.
Levine, Michael, and Melinda Buntin. 2013. “Why Has Growth in Spending for Fee-for-Service Medicare Slowed?” Working Paper no. 2013–16. Washington: Congressional Budget Office (August).
Lusardi, Annamaria, Daniel Schneider, and Peter Tufano. 2010. “The Economic Crisis and Medical Care Use: Comparative Evidence from Five High-Income Countries.” Working Paper no. 15843. Cambridge, Mass.: National Bureau of Economic Research.
Manning, Willard G., Joseph P. Newhouse, Naihua Duan, Emmett B. Keeler, and Arleen Leibowitz. 1987. “Health Insurance and the Demand for Medical Care.” American Economic Review 77, no. 3: 251–77.
Matlock, Daniel D., Peter W. Groeneveld, Steve Sidney, Susan Shetterly, and others. 2013. “Geographic Variation in Cardiovascular Procedure Use among Medicare Fee-for-Service vs. Medicare Advantage Beneficiaries.” JAMA 310, no. 2: 155–62.
McClellan, Mark, and Jonathan Skinner. 2006. “The Incidence of Medicare.” Jour-nal of Public Economics 90, no. 1: 257–76.

AmitAbh ChAndrA, JonAthAn holmes, and JonAthAn skinner 301
McInerney, Melissa Powell, and Jennifer M. Mellor. 2012. “State Unemployment in Recessions during 1991–2009 Was Linked to Faster Growth in Medicare Spending.” Health Affairs 31, no. 11: 2464–73.
McWilliams, J. Michael, Bruce E. Landon, and Michael E. Chernew. 2013. “Changes in Health Care Spending and Quality for Medicare Beneficiaries Associated with a Commercial ACO Contract.” JAMA 310, no. 8: 829–36.
MedMarket Diligence. 2012. “Advanced Medical Technologies: Insights, Per-spectives and Inside Data from Medtech Market Analysis.” Blog post dated December 19. http://blog.mediligence.com/2012/12/19/2013-medtech-outlook/. Accessed November 4, 2013.
———. 2013. “Medtech Financing: August 2013 and Trend 2009–2013.” Blog post dated September 4. http://blog.mediligence.com/2013/09/04/medtech-financing-august-2013-and-trend-2009-2013/. Accessed November 4, 2013.
Newhouse, Joseph. 1992. “Medical Care Costs: How Much Welfare Loss?” Jour-nal of Economic Perspectives 6, no. 3: 3–21.
———. 1993. Free for All? Lessons from the RAND Health Insurance Experiment. Cambridge, Mass.: Harvard University Press.
Nichols, Len M. 2013. “Containing Health Care Costs: Recent Progress and Remaining Challenges.” Testimony before the Committee on the Budget, U.S. Senate, Washington, July 30.
OECD. 2013. “Health Spending Continues to Stagnate, says OECD.” OECD Health Policies and Data. http://www.oecd.org/els/health-systems/health-spending- continues-to-stagnate-says-oecd.htm. Accessed January 15, 2014.
Orszag, Peter. 2013. “Economy Can’t Be All That’s Slowing Health Care Costs.” Politics in Minnesota (online), September 27. http://politicsinminnesota. com/2013/09/peter-orszag-economy-cant-be-all-thats-slowing-health-care-costs/.
Reinhart, Carmen, and Kenneth Rogoff. 2009. This Time Is Different: Eight Cen-turies of Financial Folly. Princeton: Princeton University Press.
Roehrig, Charles. 2012. “A New Look at the Simpson-Bowles Budget Plan: Impli-cations for Sustainable Health Spending.” Blog posting dated October 30, hosted by Altarum.org. http://altarum.org/health-policy-blog/a-new-look-at-the- simpson-bowles-budget-plan-implications-for-sustainable-health-spending.
———. 2013. “Further Thoughts on the Recession and Health Spending.” Health Affairs blog, May 7. http://healthaffairs.org/blog/2013/05/07/further-thoughts-on-the-recession-and-health-spending/.
———, Ani Turner, Paul Hughes-Cromwick, and George Miller. 2012. “When the Cost Curve Bent—Pre-Recession Moderation in Health Care Spending.” New England Journal of Medicine 367: 590–93.
Rogers, Joseph G., Robin R. Bostic, Kuo B. Tong, Rob Adamson, and others. 2012. “Cost-Effectiveness Analysis of Continuous-Flow Left Ventricular Assist Devices as Destination Therapy.” Circulation: Heart Failure 5:10–16.
Ryu, Alexander, Teresa Gibson, Richard McKellar, and Michael Chernew. 2013. “The Slowdown in Health Care Spending in 2009–11 Reflected Factors

302 Brookings Papers on Economic Activity, Fall 2013
Other than the Weak Economy and Thus May Persist.” Health Affairs 32, no. 5: 835–40.
Sack, Kevin. 2010. “As Medicaid Payments Shrink, Patients Are Abandoned.” New York Times, March 15.
Song, Zirui, Dana Gelb Safran, Bruce E. Landon, Mary Beth Landrum, Yulei He, Robert E. Mechanic, Matthew P. Day, and Michael E. Chernew. 2012. “The ‘Alternative Quality Contract,’ Based on a Global Budget, Lowered Medical Spending and Improved Quality.” Health Affairs 31, no. 8: 1885–94.
Steuerle, Gene. 2013. “A Slower Rate of Health Cost Growth? What Happens When an Irresistible Force Meets an Increasingly Immovable Object?” Altarum Institute Health Policy Forum blog, May 10. http://altarum.org/health-policy-blog/a-slower-rate-of-health-cost-growth-what-happens-when-an-irresistible-force-meets-an-increasingly#sthash.P3JEZRdy.dpuf.
Stewart, Garrick C., and Lynne W. Stevenson. 2011. “Keeping Left Ventricular Assist Device Acceleration on Track.” Circulation 123: 1559–68.
Thomas, Katie. 2013. “U.S. Drug Costs Dropped in 2012, but Rises Loom.” New York Times, March 18.
Turner, Ani, and Paul Hughes-Cromwick. 2013. “Connecting U.S. Health Expen-ditures with the Health Sector Workforce.” Business Economics 48: 42–57.
Unger, Rick. 2013. “New Data Suggests Obamacare Is Actually Bending the Healthcare Cost Curve.” Forbes Online, February 12.
U.S. Census Bureau. 2012. “Income, Poverty, and Health Insurance Cover-age in the United States.” Current Population Report, P-60-243, September. Washington.
White, Chapin. 2013. “Contrary to Cost-Shift Theory, Lower Medicare Hospital Payment Rates for In-Patient Care Lead to Lower Private Payment Rates.” Health Affairs 32, no. 5: 935–43.
Yamamoto, Dale H. 2013. Health Care Costs—From Birth to Death. Washington: Health Care Cost Institute.
Zamanian, Kamran. 2013. “Interventional Cardiology Devices Forecast: Bio-absorbable Stents Will Impact U.S. Market upon Entry.” Report dated Novem-ber 4, posted on the website of DAIC.com.
Zuckerman, Stephen, and Dana Goin. 2012. “How Much Will Medicaid Physi-cian Fees for Primary Care Rise in 2013? Evidence from a 2012 Survey of Medicaid Physician Fees.” Urban Institute and Kaiser Commission on Med-icaid and the Uninsured. http://kff.org/medicaid/issue-brief/how-much-will-medicaid-physician-fees-for/.

303
Comments and Discussion
COMMENT BYKATHERINE BAICKER The question of whether the recent slowdown in the growth of health care spending is likely to persist is clearly of keen policy interest. It not only informs analysis of the success of various pol-icy levers aimed at slowing spending growth, but also sets the stage for a broader set of budget discussions about the sustainability of government spending and the necessity of substantial changes to current tax rates.
While there is little question that health care spending has grown more slowly in the last three years than the average in the previous three decades, it remains quite unclear whether the nature of this shift is transitory or perma-nent (Ryu and others 2013; Martin and others 2014). In part, this is because it is difficult to estimate precisely a sectoral break in the trend based only on a few years of data, but it is also because there remains a great deal of uncertainty about the underlying drivers of health care spending growth and thus about the factors that may have caused it to abate.
In this paper, Amitabh Chandra, Jonathan Holmes, and Jonathan Skin-ner work to decompose the slowdown into the share attributable to current economic conditions, and thus likely to rebound once the economy picks up, and the share attributable to systemic changes in health care delivery—whether because of recent health reforms or other factors—and thus likely to persist even when economic growth increases.
They bring several different pieces of evidence to bear, painting as com-plete a picture as possible given the short time-series available to them. They decompose the effects of Medicare, Medicaid, and private insurance policies on spending patterns to date, and they combine that information with evidence on the technology pipeline and stock market expectations to forecast future spending. They conclude from this evidence that health care spending growth is likely to revert to something like 1.2 percent faster

304 Brookings Papers on Economic Activity, Fall 2013
than GDP growth. They note, however, that there remains a great deal of uncertainty about this projection—not just in understanding the factors that have contributed to recent spending patterns, but more importantly in using those patterns to forecast future spending.
The authors do a great service to the debate in synthesizing available evidence and framing their estimates in this way, and they present both persuasive back-of-the-envelope estimates and appropriate caveats. I wish to focus on several of the health system factors that they discuss and the implications of potential system-level changes for future spending growth.
Chandra, Holmes, and Skinner classify the potential causes of the recent slowdown in spending growth into six categories: (i) the Affordable Care Act (ACA); (ii) the Great Recession; (iii) patient cost sharing; (iv) prices versus quantities; (v) technology growth and diffusion; and (vi) other causes. An alternative way of classifying the underlying forces is into those operating primarily on the patient side and those operating primarily on the provider or payment side.
Patient Cost sharing Most health care in the United States is purchased through public and private insurance plans. Patient cost sharing is one of the primary tools used by insurers to steer patients toward higher-value treat-ments and lower-cost providers. This cost sharing can be a crude tool (such as a blanket deductible) or a more refined one (with higher cost sharing for lower-value services or more expensive providers) (Chernew, Rosen, and Fendrick 2007; Baicker and Goldman 2011).
Chandra, Holmes, and Skinner draw attention to the important role that changes in patient cost sharing may have played in recent years in slow-ing health care spending growth. They note that among those covered by employer-sponsored insurance plans (representing 91 percent of the pri-vately insured), the share who are covered by high-deductible health plans with deductibles above $1,000 increased from 4 percent in 2005 to 38 per-cent in 2013 (Kaiser Family Foundation and HRET 2013). My figure 1 shows the change in the mix of policies covering employer-sponsored insurance enrollees from 1988 to 2013. The authors also note that the aver-age deductible faced by enrollees in single-person plans has increased from $735 in 2008 to $1,135 in 2013 (Kaiser Family Foundation and HRET 2013). Other studies also find increases in cost sharing for the privately insured (Herrera and others 2013; Ryu and others 2013).
These patterns shed important light on the dynamics within particular health insurance segments, but it is helpful to interpret them in the context of evolving patterns of insurance coverage. While there has been some increase in the share of the population that is uninsured (from 13.1 percent

Comments and disCussion 305
in 2000 to 14.6 percent in 2005 to 15.4 percent in 2012) and who by defini-tion pay for care out-of-pocket, there has also been a decrease in the share of the U.S. population covered by employer-sponsored insurance (from 65.1 percent in 2000 to 60.7 percent in 2005 to 54.9 percent in 2012) and an increase in the share covered by Medicaid (from 10.0 percent in 2000 to 13.0 percent in 2005 to 16.4 percent in 2012), which usually has much lower cost sharing (U.S. Bureau of the Census 2012; DeNavas-Walt, Proctor, and Smith 2013). My figure 2 shows that over the 50 years since the introduction of Medicare and Medicaid, the share of health care paid out-of-pocket has declined substantially, from 53 percent in 1960 to 12 percent in 2012 (see also Baicker and Goldman 2011). The share appears to have drifted down only slightly in the last decade. This aggregate trend does not appear to be concentrated in any one segment. My figure 3 shows the share of health spending paid for out-of-pocket for different groups; the pattern is some-what noisier, but seems to have been steady or drifted down for most.
Source: Author’s tabulations of data from the Kaiser Family Foundation and Health Research and Education Trust’s Employer Health Benefits Surveys (2011, 2012, and 2013).
Note: Values imputed for years 1989–1992, 1994–1995, and 1997–1998.
Percent
10
20
30
40
50
60
70
80
90
1991 1994 1997 2000 2003 2006 2009 2012
High-deductible health plan with a savings option Point-of-service
Preferred provider organization Health maintenance organization Fee-for-service
Figure 1. distribution of Five types of insurance Plans issued by employers, 1988–2013
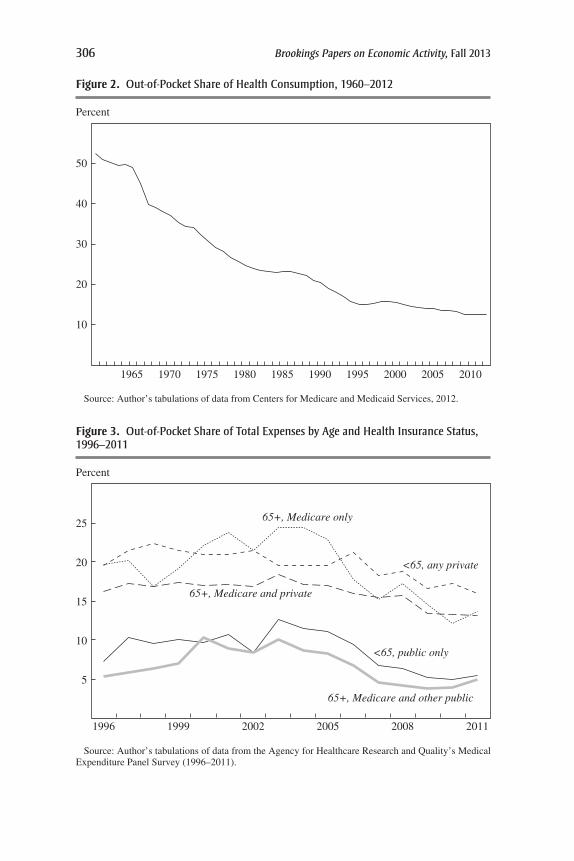
306 Brookings Papers on Economic Activity, Fall 2013
Source: Author’s tabulations of data from Centers for Medicare and Medicaid Services, 2012.
Percent
10
20
30
40
50
1965 1970 1975 1980 1985 1990 1995 2000 2005 2010
Figure 2. out-of-Pocket share of health Consumption, 1960–2012
Figure 3. out-of-Pocket share of total expenses by age and health insurance status, 1996–2011
Source: Author’s tabulations of data from the Agency for Healthcare Research and Quality’s Medical Expenditure Panel Survey (1996–2011).
Percent
5
10
15
20
25
1996 1999 2002 2005 2008 2011
<65, any private
<65, public only
65+, Medicare only
65+, Medicare and private
65+, Medicare and other public

Comments and disCussion 307
This suggests that the moderation in health care spending growth is not easily attributable to a sharp increase in patient cost sharing overall. However, that does not mean that patient cost sharing is not playing an important role in changing spending patterns. For example, if cost sharing were becoming more refined—focusing higher copayments on areas of care where patient choices were most responsive to prices (and where the care may be of the most limited health benefit)—then even with aggregate cost sharing unchanged, improved patient incentives might promote slower spending growth. On the other hand, if spending were increasingly con-centrated in areas with limited cost sharing (such as post-acute care or home health covered by Medicare with little cost sharing, as noted by the authors), then movements of patients across insurance segments into these areas would erode the effectiveness of cost sharing in slowing spending on low-value services.
The effect of cost sharing may also be different in different economic times. Cost sharing is primarily calculated as a fixed dollar amount per ser-vice (copays) or a fixed share of the cost of services (coinsurance), rather than varying based on enrollees’ income (although the ACA subsidizes cost sharing and caps out-of-pocket maximums based on income, making the share of health expenses paid out-of-pocket rise with income). When incomes are lower, patients may be substantially more responsive to specific copays. While there are some estimates to help trace out patient demand over different income ranges, the interaction of changes in cost sharing structures with the Great Recession and the dynamics of the timing of health care utilization may be difficult to infer from past series.
Taken together, this suggests that innovation in cost-sharing structures has the potential to hold spending growth down, but great uncertainty remains about the contribution of current structures to future growth.
Provider Payments The other side of the equation is the incentives faced by providers. The authors synthesize the role that Medicare and Medicaid payments have played in slowing spending growth. Medicaid payments grew more restrictive during the recession. Medicare prices grew sub-stantially more slowly than those paid by private insurers in recent years, and in 2013, 28 percent of the Medicare population was enrolled in Medi-care Advantage plans that perform utilization review that traditional fee-for-service Medicare does not (Kaiser Family Foundation 2013). Michael Levine and Melinda Buntin (2013) conclude that the significant decrease in the growth of fee-for-service Medicare spending from 2000 to 2010 was driven more by patient demand and changes in provider behavior than by the recession or changes in payment rates.

308 Brookings Papers on Economic Activity, Fall 2013
The authors draw attention to the fact that divergence across insurance market segments in either prices paid or quantity used is unlikely to con-tinue indefinitely. There are limits to how low Medicaid provider payments can fall relative to other providers and still ensure access to care for ben-eficiaries. There are also direct and indirect spillovers between private insurance and public insurance—particularly Medicare. The authors note that private insurers often take coverage cues from Medicare program coverage decisions. Furthermore, because the same set of providers treat Medicare and commercially insured patients, changes in practice patterns are likely to be applied to both patient pools (Clemens and Gottlieb 2013; White 2013). Indeed, my figure 4 illustrates that in the past there has been limited divergence in spending between Medicare enrollees and the pri-vately insured. (These spillovers also make it difficult to discern the effect of policy changes operating in one segment using another segment as a benchmark.)
This suggests potential additional leverage to make payment reforms on either the public or private side. The authors outline some of the changes private insurers have made, perhaps in anticipation of future changes in incentives generated by the ACA. Similarly, the effect of payment changes through both traditional Medicare and managed Medicare Advantage may be amplified by private insurers piggy-backing on improved provider incen-tives. The joint role of prices and utilization in driving spending also sug-gests some caution in focusing exclusively on reforms that aim to reduce the quantity of low-value care by improving coordination: to the extent that such policies drive provider consolidation, they may also undermine market competition and raise prices (Baicker and Levy 2013), mitigating the resulting reduction in spending.
In summary, Chandra, Holmes, and Skinner have cogently laid out the different factors driving recent changes in health care spending growth and the implication of those factors for the trajectory of spending. Following Joseph Newhouse (1992), they note the central role of technological innova-tion in driving health care spending. In estimates of factors driving spending, technology is frequently the “residual claimant,” the otherwise unexplained part of a model that includes more easily measurable factors. If unexplained spending can be attributed to technology, then the unexplained growth in spending can readily be as well. Furthermore, an accumulation of many one-time reductions in the level of spending may look a lot like a change in the growth rate—and ought not to be discounted.
The authors bring several pieces of intriguing information to bear on the likely future arrival rate of new technologies. As they note, stock markets

Comments and disCussion 309
certainly do not suggest that the bottom has fallen out of the medical inno-vation industries. The authors also highlight the rapid diffusion of medi-cal devices and technology-intensive services, noting the untapped pool of patients among whom these may be deployed if they are deemed appropri-ate in a wider set of circumstances and for a broader set of conditions than in the past. The diffusion of more capital-intensive technology may also change the relationship between health care spending and employment in the health care sector that the authors document.
The central role of the evolution and diffusion of technology in driving health care spending highlights the importance of the interactions between the patient- and provider-side factors laid out above. Both investment in innovation and technological diffusion are surely governed both by the incentives faced by providers in adopting new techniques and the incen-tives faced by patients in seeking out that cutting-edge care. Expanding insurance coverage is unlikely to slow health care spending (Finkelstein and others 2012; Baicker and others 2013; Taubman and others 2014). To the extent that policy changes for public insurance and innovation in cov-erage for private insurance slow spending growth, they are likely to do so
Source: Author’s tabulations of data from Centers for Medicare and Medicaid Services, 2012.
Percent change in spending per capita
Private health insurance
Medicare
5
0
10
15
20
25
1975 1980 1985 200019951990 2005 2010
Figure 4. Changes in Per Capita spending, medicare and Private health insurance, 1970–2012

310 Brookings Papers on Economic Activity, Fall 2013
(for better or for worse) by moderating the arrival and diffusion of new medical technologies—potentially life-saving for many but expensive for all.
reFerenCes For the BaiCker Comment
Baicker, Katherine, and Dana P. Goldman. 2011. “Patient Cost-Sharing and Health-care Spending Growth.” Journal of Economic Perspectives 25 (2): 47–68.
Baicker, Katherine, and H. Levy. 2013. “Coordination vs. Competition in Health Care Reform.” New England Journal of Medicine 369 (9): 789–91.
Baicker, Katherine, Sarah Taubman, Heidi Allen, Mira Bernstein, and others. 2013. “The Oregon Experiment—Effects of Medicaid on Clinical Outcomes.” New England Journal of Medicine 368 (18): 1713–22.
Centers for Medicare and Medicaid Services (CMS). 2012. National Health Expen-ditures by Type of Service and Source of Funds: Calendar Years 1960 to 2012. Washington, D.C.
Chernew, Michael E., Allison B. Rosen, and A. Mark Fendrick. 2007. “Value-Based Insurance Design.” Health Affairs 26 (2): w195–203.
Clemens, Jeffrey, and Joshua D. Gottlieb. 2013. “Bargaining in the Shadow of a Giant: Medicare’s Influence on Private Payment Systems.” NBER Working Paper no. 19503. Cambridge, Mass.: National Bureau of Economic Research.
DeNavas-Walt, Carmen, Bernadette D. Proctor, and Jessica C. Smith. 2013. “Income, Poverty, and Health Insurance Coverage in the United States: 2012.” Washington, D.C.: U.S. Bureau of the Census.
Finkelstein, Amy, Sarah Taubman, Bill Wright, Mira Bernstein, and others. 2012. “The Oregon Health Insurance Experiment: Evidence from the First Year.” Quarterly Journal of Economics 127 (3): 1057–1106.
Herrera, Carolina-Nicole, Martin Gaynor, David Newman, Robert J. Town, and Stephen T. Parente. 2013. “Trends Underlying Employer-Sponsored Health Insurance Growth for Americans Younger than Age Sixty-Five.” Health Affairs 32 (10): 1715–22.
Kaiser Family Foundation. 2013. “Share of Medicare Beneficiaries Enrolled in Medicare Advantage Plans, by State, 2013.” Menlo Park, Calif.
———, and Health Research and Education Trust. 2013. “Employer Health Ben-efits 2013 Survey.” Menlo Park, Calif.
Levine, Michael, and Melinda Buntin. 2013. “Why Has Growth in Spending for Fee-for-Service Medicare Slowed?” Working Paper no. 2013-06. Washington, D.C.: Congressional Budget Office.
Martin, Anne B., Micah Hartman, Lekha Whittle, Aaron Catlin, and the National Health Expenditure Accounts Team. 2014. “National Health Spending in 2012: Rate of Health Spending Growth Remained Low for the Fourth Consecutive Year.” Health Affairs 33 (1): 67–77.
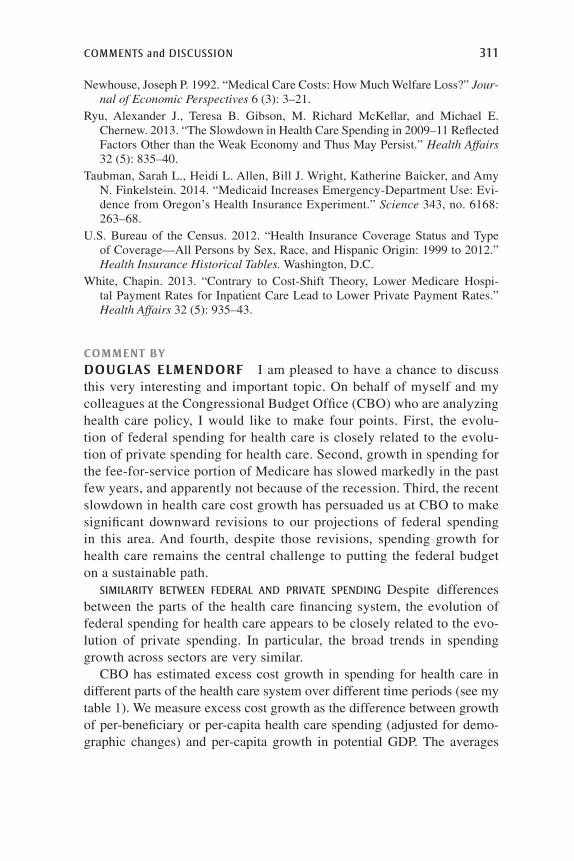
Comments and disCussion 311
Newhouse, Joseph P. 1992. “Medical Care Costs: How Much Welfare Loss?” Jour-nal of Economic Perspectives 6 (3): 3–21.
Ryu, Alexander J., Teresa B. Gibson, M. Richard McKellar, and Michael E. Chernew. 2013. “The Slowdown in Health Care Spending in 2009–11 Reflected Factors Other than the Weak Economy and Thus May Persist.” Health Affairs 32 (5): 835–40.
Taubman, Sarah L., Heidi L. Allen, Bill J. Wright, Katherine Baicker, and Amy N. Finkelstein. 2014. “Medicaid Increases Emergency-Department Use: Evi-dence from Oregon’s Health Insurance Experiment.” Science 343, no. 6168: 263–68.
U.S. Bureau of the Census. 2012. “Health Insurance Coverage Status and Type of Coverage—All Persons by Sex, Race, and Hispanic Origin: 1999 to 2012.” Health Insurance Historical Tables. Washington, D.C.
White, Chapin. 2013. “Contrary to Cost-Shift Theory, Lower Medicare Hospi-tal Payment Rates for Inpatient Care Lead to Lower Private Payment Rates.” Health Affairs 32 (5): 935–43.
COMMENT BYDOUGlAs ElMENDORF I am pleased to have a chance to discuss this very interesting and important topic. On behalf of myself and my colleagues at the Congressional Budget Office (CBO) who are analyzing health care policy, I would like to make four points. First, the evolu-tion of federal spending for health care is closely related to the evolu-tion of private spending for health care. Second, growth in spending for the fee-for-service portion of Medicare has slowed markedly in the past few years, and apparently not because of the recession. Third, the recent slowdown in health care cost growth has persuaded us at CBO to make significant downward revisions to our projections of federal spending in this area. And fourth, despite those revisions, spending growth for health care remains the central challenge to putting the federal budget on a sustainable path.
similarity Between Federal and Private sPending Despite differences between the parts of the health care financing system, the evolution of federal spending for health care appears to be closely related to the evo-lution of private spending. In particular, the broad trends in spending growth across sectors are very similar.
CBO has estimated excess cost growth in spending for health care in different parts of the health care system over different time periods (see my table 1). We measure excess cost growth as the difference between growth of per-beneficiary or per-capita health care spending (adjusted for demo-graphic changes) and per-capita growth in potential GDP. The averages
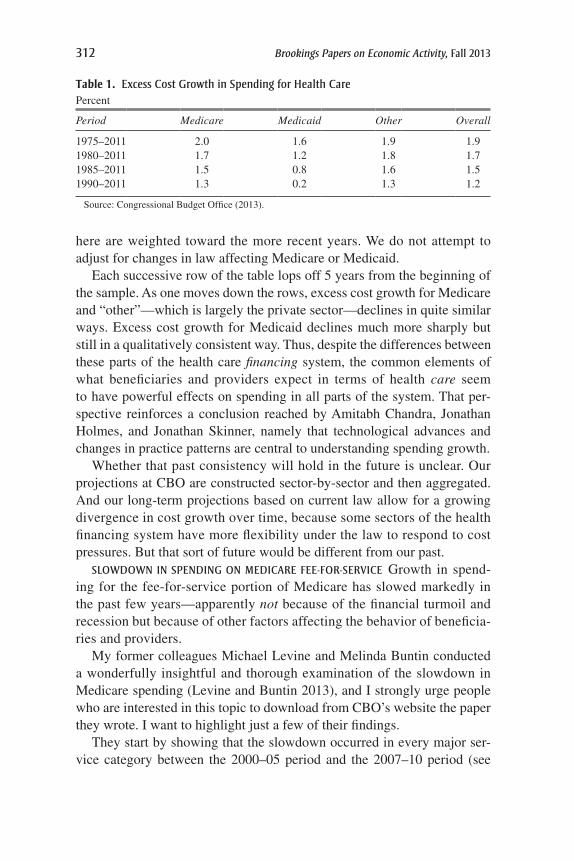
312 Brookings Papers on Economic Activity, Fall 2013
here are weighted toward the more recent years. We do not attempt to adjust for changes in law affecting Medicare or Medicaid.
Each successive row of the table lops off 5 years from the beginning of the sample. As one moves down the rows, excess cost growth for Medicare and “other”—which is largely the private sector—declines in quite similar ways. Excess cost growth for Medicaid declines much more sharply but still in a qualitatively consistent way. Thus, despite the differences between these parts of the health care financing system, the common elements of what beneficiaries and providers expect in terms of health care seem to have powerful effects on spending in all parts of the system. That per-spective reinforces a conclusion reached by Amitabh Chandra, Jonathan Holmes, and Jonathan Skinner, namely that technological advances and changes in practice patterns are central to understanding spending growth.
Whether that past consistency will hold in the future is unclear. Our projections at CBO are constructed sector-by-sector and then aggregated. And our long-term projections based on current law allow for a growing divergence in cost growth over time, because some sectors of the health financing system have more flexibility under the law to respond to cost pressures. But that sort of future would be different from our past.
slowdown in sPending on mediCare Fee-For-serviCe Growth in spend-ing for the fee-for-service portion of Medicare has slowed markedly in the past few years—apparently not because of the financial turmoil and recession but because of other factors affecting the behavior of beneficia-ries and providers.
My former colleagues Michael Levine and Melinda Buntin conducted a wonderfully insightful and thorough examination of the slowdown in Medicare spending (Levine and Buntin 2013), and I strongly urge people who are interested in this topic to download from CBO’s website the paper they wrote. I want to highlight just a few of their findings.
They start by showing that the slowdown occurred in every major ser-vice category between the 2000–05 period and the 2007–10 period (see
Table 1. excess Cost growth in spending for health CarePercent
Period Medicare Medicaid Other Overall
1975–2011 2.0 1.6 1.9 1.91980–2011 1.7 1.2 1.8 1.71985–2011 1.5 0.8 1.6 1.51990–2011 1.3 0.2 1.3 1.2
Source: Congressional Budget Office (2013).

Comments and disCussion 313
my figure 1); that the slowdown occurred both for beneficiaries with high costs and for those with low costs (see my figure 2); and that the slowdown occurred both in states with high average costs and in those with low aver-age costs (see my figure 3).
Levine and Buntin (2013) then quantified all the factors that might have contributed to the slowdown that they could find a way to quantify (see my table 2). Those factors include the growth in the average payment rate, changes in the age and health status of beneficiaries, growth in the propor-tion of beneficiaries enrolled only in Medicare Part A, growth in the use of prescription drugs, and the financial crisis and economic downturn.
I will now focus on the row in table 2 that represents the estimated effect of the financial crisis and economic downturn, which shows zeros. Levine and Buntin looked at time-series evidence and found that the use of Medi-care services has not, on average over the past few decades, moved with
Figure 1. annual growth in Per-Beneficiary spending for the elderly in Parts a and B of medicare, by selected service Category
Source: Levine and Buntin (2013).
Percent
5
10
15
20
2000 to 20052007 to 2010
OtherDurablemedical
equipment
Part Bdrugs
HospiceHomehealth
Skillednursingfacility
Outpatienthospital
PhysicianInpatienthospital
5.72.23.63.76.49.413.318.437.3Share ofspending,2010 (%)
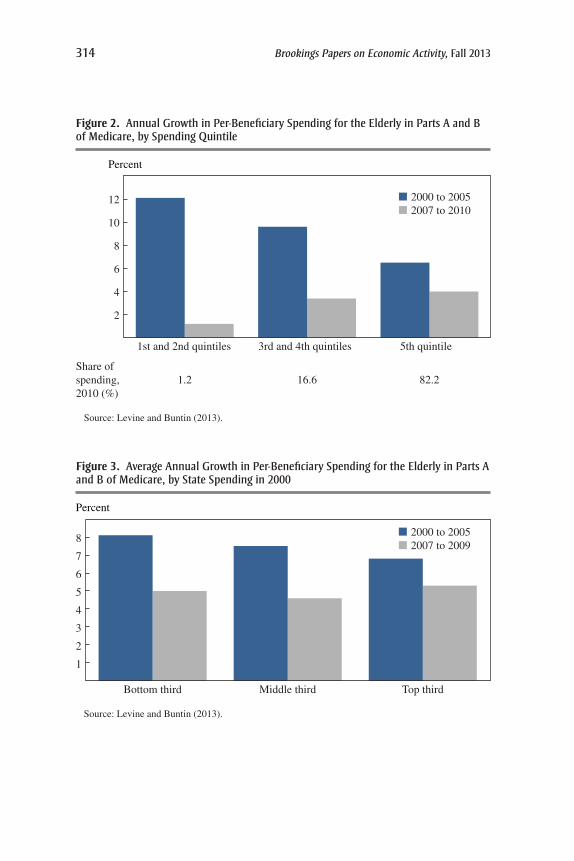
314 Brookings Papers on Economic Activity, Fall 2013
2
4
6
8
10
12
5th quintile3rd and 4th quintiles1st and 2nd quintiles
Source: Levine and Buntin (2013).
Percent
2000 to 20052007 to 2010
82.216.61.2Share ofspending,2010 (%)
Figure 2. annual growth in Per-Beneficiary spending for the elderly in Parts a and B of medicare, by spending Quintile
Source: Levine and Buntin (2013).
Percent
2000 to 20052007 to 2009
1
2
3
4
5
6
7
8
Top thirdMiddle thirdBottom third
Figure 3. average annual growth in Per-Beneficiary spending for the elderly in Parts a and B of medicare, by state spending in 2000

Comments and disCussion 315
the business cycle. More importantly, though, they examined micro-level data using a raft of specifications and found no evidence of a relation-ship between sudden declines in the value of elderly beneficiaries’ assets or income and their use of health care.
Despite their efforts to quantify various factors, the unexplained part of the spending slowdown amounts to three-quarters of the total. The rest of Levine and Buntin’s paper explores in great detail the possible role of factors whose overall impact they did not find ways to quantify. Those factors include shifts in the location of care, the types of practitioners pro-viding care, care management for the highest-cost beneficiaries, the rate of adoption of cost-increasing technology and cost-decreasing process inno-vations, beneficiaries’ access to care, spillover effects from higher enroll-ment in managed care, a public focus on cost containment, and so on. Their bottom line is that there are a lot of plausible suspects but no smoking guns whose importance can be readily documented.
the downward revision oF CBo’s ProjeCtions For Federal health Care
sPending The slowdown in health care cost growth has been sufficiently broad and persistent to persuade us to make significant downward revisions to our projections of federal health care spending.
Specifically, during the past few years, CBO has made a series of down-ward technical adjustments to our projections of spending for Medicare and Medicaid and our projection of private health insurance premiums. Those technical adjustments are apart from any revisions caused by enacted leg-islation or updates to our economic forecast; they represent only changes
Table 2. Contributions of various Factors to annual growth in Per-Beneficiary spending for the elderly in Parts a and B of medicarePercentage points
2000–05 2007–10 Difference
Overall spending growth 7.1 3.8 -3.2
Potential contributors to the slowdown Growth in average payment rate 2.7 2.5 -0.2 Growth in demand by beneficiaries
Changes in the age and health status of beneficiaries
0.0 -0.3 -0.3
Growth in the proportion of beneficiaries enrolled only in Part A
-0.1 -0.3 -0.2
Growth in the use of prescription drugs -0.5 -0.6 -0.1 The financial crisis and economic downturn 0.0 0.0 0.0 Changes in supplemental coverage * * *Unexplained contribution to growth -2.4
Source: Levine and Buntin (2011).

316 Brookings Papers on Economic Activity, Fall 2013
made for other reasons. I should emphasize that our projections are based on current law; we are not trying to guess what Congress might do in the future.
Between our March 2010 baseline and our May 2013 baseline, which is our most recent, technical adjustments lowered spending for Medicare by 6 percent in 2012 and 8 percent in 2013 (see my table 3). Similarly, techni-cal adjustments lowered spending for Medicaid by 4 percent in 2012 and 6 percent in 2013. We have made even larger downward revisions for the years ahead: Relative to our March 2010 baseline, projected spend-ing in 2020 for Medicare is now $137 billion, or 15 percent, lower for technical reasons, and projected spending for Medicaid is now $85 bil-lion, or 16 percent, lower for technical reasons.
Private health insurance premiums have also increased more slowly in recent years than we had expected earlier. Accordingly, during the past few years, we have revised downward our projection of premiums per enrollee in 2020 by about 9 percent. That revision has reduced the projected cost of the insurance coverage expansion under the Affordable Care Act (ACA) and has also reduced our projection of the revenue lost through the tax exclusion for employer-sponsored health insurance.
How did we decide on the magnitude of those revisions? Some con-siderations suggest that the weight given to the recent experience should be substantial: First, the slowdown encompasses many parts of multiple programs, which suggests that the causes are not just a few isolated devel-opments. Second, the slowdown has lasted for half-a-dozen years or more, which suggests that the causes are not just a flash in the pan. Third, for Medicare, the slowdown does not appear to be caused by the weak econ-omy, which suggests that it will not necessarily fade when the economy strengthens.
At the same time, other considerations suggest that the weight given to the recent experience should be limited: First, growth in health care spend-ing varies a lot over time, and earlier periods of slow cost growth have been followed by faster growth. Second, the development and adoption of new technologies and approaches for health care has not ceased. Chandra, Holmes, and Skinner discuss cardiovascular care and cancer treatment; other authors talk about biologic drugs and individualized drug therapies. Third, for Medicare, the program remains primarily fee-for-service, so that doing more pays better than doing less.
Let me add a few words about the ACA. The act reduces payment rates for Medicare providers relative to previous law. It also includes incen-tives for providers to reduce the quantity of Medicare services delivered,

Comments and disCussion 317
and it allows certain types of flexibility for the Centers for Medicare and Medicaid Services in managing the program. In addition, the act includes a tax on certain insurance plans with high premiums that we expect will help to restrain the growth of private health care spending. Whether the initial implementation of the law and anticipation of the law’s provisions yet to take effect have already held down spending growth significantly is unclear.
Unfortunately, CBO does not have a scientific way to weight the con-siderations I have just run through. Our goal at CBO is to construct projec-tions that are in the middle of the distribution of possible outcomes. At this point, our projections keep spending growth per beneficiary for several more years and then show growth picking up again. However, the projected future levels of spending for Medicare and Medicaid and of private insur-ance premiums remain well below the levels we were projecting a few years ago.
Our long-term projections for growth in federal spending for health care—meaning our projections beyond the usual 10-year budget window—are built up from an estimate of the current underlying pace of excess cost growth. Between our 2010 and 2013 long-term outlooks, we marked
Table 3. revisions to CBo’s Projections of medicare and medicaid spending Between march 2010 and may 2013a
Year
Medicareb Medicaidc
Technical revisions (billions of dollars)
Percent change
Technical revisions (billions of dollars)
Percent change
2010 -14 -3 0 02011 -26 -5 -1 -12012 -30 -6 -11 -42013 -45 -8 -17 -62014 -63 -10 -32 -102015 -69 -11 -48 -132016 -78 -11 -53 -132017 -91 -13 -59 -132018 -106 -14 -63 -132019 -125 -15 -74 -152020 -137 -15 -85 -16
Total, 2010–20 -785 -11 -445 -11
Source: Congressional Budget Office.a. Apart from changes due to overall economic conditions and legislation.b. Medicare spending is net of offsetting receipts.c. The comparison for the Medicaid baseline is to August 2010, as the March 2010 baseline did not
include the effects of the Affordable Care Act (ACA). Only minor changes were made in that August baseline beyond those related to the ACA.
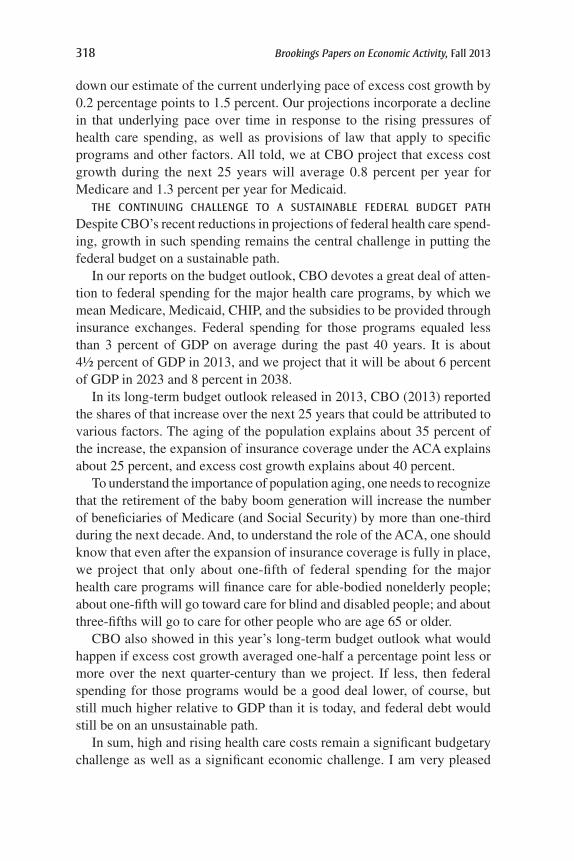
318 Brookings Papers on Economic Activity, Fall 2013
down our estimate of the current underlying pace of excess cost growth by 0.2 percentage points to 1.5 percent. Our projections incorporate a decline in that underlying pace over time in response to the rising pressures of health care spending, as well as provisions of law that apply to specific programs and other factors. All told, we at CBO project that excess cost growth during the next 25 years will average 0.8 percent per year for Medicare and 1.3 percent per year for Medicaid.
the Continuing Challenge to a sustainaBle Federal Budget Path Despite CBO’s recent reductions in projections of federal health care spend-ing, growth in such spending remains the central challenge in putting the federal budget on a sustainable path.
In our reports on the budget outlook, CBO devotes a great deal of atten-tion to federal spending for the major health care programs, by which we mean Medicare, Medicaid, CHIP, and the subsidies to be provided through insurance exchanges. Federal spending for those programs equaled less than 3 percent of GDP on average during the past 40 years. It is about 4½ percent of GDP in 2013, and we project that it will be about 6 percent of GDP in 2023 and 8 percent in 2038.
In its long-term budget outlook released in 2013, CBO (2013) reported the shares of that increase over the next 25 years that could be attributed to various factors. The aging of the population explains about 35 percent of the increase, the expansion of insurance coverage under the ACA explains about 25 percent, and excess cost growth explains about 40 percent.
To understand the importance of population aging, one needs to recognize that the retirement of the baby boom generation will increase the number of beneficiaries of Medicare (and Social Security) by more than one-third during the next decade. And, to understand the role of the ACA, one should know that even after the expansion of insurance coverage is fully in place, we project that only about one-fifth of federal spending for the major health care programs will finance care for able-bodied nonelderly people; about one-fifth will go toward care for blind and disabled people; and about three-fifths will go to care for other people who are age 65 or older.
CBO also showed in this year’s long-term budget outlook what would happen if excess cost growth averaged one-half a percentage point less or more over the next quarter-century than we project. If less, then federal spending for those programs would be a good deal lower, of course, but still much higher relative to GDP than it is today, and federal debt would still be on an unsustainable path.
In sum, high and rising health care costs remain a significant budgetary challenge as well as a significant economic challenge. I am very pleased

Comments and disCussion 319
that these authors and others at this Brookings Panel are trying to address those challenges.
reFerenCes For the elmendorF Comment
Congressional Budget Office (CBO). 2013. The 2013 Long-Term Budget Outlook. Washington, D.C.
Levine, Michael, and Melinda Buntin. 2013. “Why Has Growth in Spending for Fee for Service Medicare Slowed?” Working Paper no. 2013-06. Washington, D.C.: Congressional Budget Office.
GENERAl DIsCUssION Kristin Forbes was struck by the paper’s finding that employment in health care has continued to grow strongly even while cost growth has begun to slow, and wondered whether the authors in their analysis had broken down that employment growth by occupation. It seemed possible to Forbes that the employment growth we have been witnessing stems largely from increased hiring in low-wage administra-tive positions to process increasing amounts of paperwork, rather than hir-ing higher-paid practitioners. This seemed worth investigating, especially to know whether changes in job distribution are on a sustainable path.
Martin Feldstein voiced concern that the authors may have underesti-mated the price elasticities in health care, since the widely cited RAND experiment that they used failed to identify whether people were treated differently based on the differing co-payment rules. Other studies have found much higher elasticities. He also wondered whether Katherine Baicker’s observation that co-pays have been rising while out-of-pocket expenses have been declining might be explained by the controls under Medicaid and Medicare that the paper’s authors discussed.
Katherine Baicker responded to Feldstein’s last question by noting that a slight decline in total out-of-pocket payments as a share of health care expenditures was found in each segment since 2000 and not just in the aggregate. A compositional effect can occur as people move across insur-ance types such as Medicare, Medicaid, and employer-sponsored insurance. Although this obviously varies as insurance coverage of the population changes, the decline in out-of-pocket share was not confined to a particular insurance type.
Caroline Hoxby wanted to know whether the role of health insurers in controlling costs, which was so much discussed in the early 1990s, has since been diminished, since the paper did not discuss that role a great

320 Brookings Papers on Economic Activity, Fall 2013
deal in explaining recent years. Relative to the roles played by the federal government, by patient choice, and by out-of-pocket costs, she would like to know whether what the health insurers are doing is still as significant in this larger problem.
David Romer read the paper as implying that the sources of the slow-down in costs are unlikely to be long-lasting. Two findings in the paper suggest this. First, the authors find that Medicaid spending per enrollee has been flat for a decade. He conjectured that that fact, together with some shifting of people out of other types of coverage into Medicaid, accounted for much of the overall slowdown in cost growth. Second, the incentives in Medicare’s fee-for-service structure that reward quantity over quality, as well as the incentives that reward technological innovation regardless of medical value, remain. Thus, although it is possible that other forces will cause cost growth to continue to be slow, it appears that the forces that have been driving the recent slowdown are likely to be temporary.
Katherine Baicker suggested looking within the Medicare program, where one can see that hospital spending has grown more slowly than other components. In theory, Medicare tries to pay hospitals a prospective bun-dle based on diagnosis, and this has been associated with slowing growth at least somewhat. She shared Amitabh Chandra’s hopefulness about the positive role bundled payments might play, adding that the effectiveness of future policy levers would be strengthened by the availability of good, large data sets, which are necessary for doing good risk adjustment and discriminating accurately among different patients to pay for value.
Richard Cooper asked how confident economists actually ought to be in their pricing of medical services, something that is relevant to discussions of prices versus quantities. At the time of the 1996 Boskin Commission, he opined, economists were frankly terrible at pricing medical care, and his suspicion was that this may still be the case, so price increases are still probably being exaggerated. Leaving aside quality and dividing expendi-tures by exaggerated prices, one would then inevitably be underestimating quantity. Has this problem been solved?
Gregory Mankiw wondered whether it was fundamentally a mistake to spend so much time asking how to bend the cost curve. A better approach might be to assume the curve cannot be bent—that it’s an immovable fact—and then ask a more realistic set of questions, such as whether to have substantially higher tax rates or expect the private sector to handle more of this than it historically has, even though the latter would mean a tremendous inequality of health outcomes that we wouldn’t feel comfort-able with as a society.

Comments and disCussion 321
Henry Aaron noted that changes in health care technology no longer hold the spotlight alone, as various policy interventions, including the reach of health insurance, have been elevated in relative significance. More impor-tantly, neither technological change nor policy change can accurately be predicted. The emphasis both in the paper and in the discussion so far, he noted, is not on the mechanical aspects of the growth of health care spend-ing but on the sensitivity of the spending growth to changes in public and private policy. In that regard, Aaron found himself agreeing with Baicker and Douglas Elmendorf that it remains unknown how successful the exper-iments and pilots in the Affordable Care Act are going to be. Some may even be transformative, both for health care delivery and for costs. But given all the uncertainties, a point estimate could not much inform our understanding of the future. Consequently, the quality of public debate on health care policy would be significantly improved if the Congressional Budget Office and every other concerned body would stop making projec-tions beyond the next decade or two. Beyond that time horizon, in his view, their informational value is close to zero.
David Romer objected vigorously to Aaron’s idea that one shouldn’t project beyond 20 years because the confidence intervals are wide, an idea that others in the discussion, including Jonathan Skinner, had voiced agree-ment with. Drawing an analogy to personal financial planning, one would never think of telling a 40-year-old that he or she should not make pro-jections about future savings, income, and consumption beyond the age of 60 simply because of the unknowns. Naturally, there are wide confi-dence intervals, but the CBO makes that abundantly clear in its projections. Romer added that it would be good to seek more precision but, neverthe-less, to stop making projections whenever there are wide confidence inter-vals would violate every rule of rational decision-making. Mankiw agreed with Romer on this last point, opining that many government policies have properties that bear resemblance to Ponzi schemes, and if one fails to look out for their likely long-term impact one can deceive oneself into thinking things look better than they do. Justin Wolfers interpreted Aaron’s com-ment to mean that the most interesting insight in the paper was not achiev-ing a point estimate but achieving a projection at the 90 percent confidence interval, that being about as confident as a group of macroeconomists could ever be.
Douglas Elmendorf also spoke up in defense of CBO’s projections, stat-ing that the agency takes very seriously its responsibility to offer not only point estimates but some sense of the uncertainty around them, in particular regarding health care costs, which are especially difficult to predict. During

322 Brookings Papers on Economic Activity, Fall 2013
the past few years the CBO has in fact pulled back the horizon of its long-term budget outlook from 75 years to 25 years. In estimates for legislation like the Affordable Care Act, the office makes precise estimates for the first decade, vaguer estimates for the second decade, and nothing beyond that. At the same time, he agreed strongly with Romer that long-term projec-tions are useful in setting policy; for example, in the case of health care reforms, many of the policies would only take effect over a long period.
Henry Aaron responded to the foregoing by posing the question, If it is worth taking projections out to 75 years, why isn’t it worth going out 175 years? Acknowledging that there must be some limit, what is the optimum duration? Forecasting isn’t simply a value-free exercise but rather one that is used for political purposes, and because projections shape policy debates an emphasis on very uncertain long-term estimates will create a distorting feed back. Politically motivated policy decisions become based on fuzzy numbers and, in turn, those policies’ projected effects change the subsequent long-term forecast.
Jonathan Skinner responded with hedged optimism about the future of health care. At present, the evidence for a revolution in health care costs is lacking. A limited sample from the Massachusetts Health Insurance Exchange shows that premium growth between 2012 and 2013 in iden-tical policies from the same zip code was at least 7 percent, and while accountable care organizations (ACOs) look promising to him, they are not yet widely established. Responding to Forbes’s speculation earlier in the discussion, he said the new costs are not primarily due to the addition of tech staffing but, in fact, seem to be linked to a remarkable growth in the number of physicians and nurses, even though the numbers of doctor visits and hospital admissions have both been stagnant or even fallen a little.
On the optimistic side, Skinner pointed out there has been a slowdown for the last five years in the Medicare system’s use of technology, as dis-cussed in the paper. For example, cardiologists have begun to realize that stents are not for everybody and stopped using them so widely. The same has been happening with pharmaceutical use, where there has been an important shift toward generics. At the same time, cardiologists are excited about the new and extremely expensive left-ventricular devices of the sort former Vice President Dick Cheney received, and the potential patient pop-ulation for them is huge.
Amitabh Chandra replied first to Hoxby’s question about the role of insurers in controlling costs. He felt they were as important today as they were back in the 1990s, when costs were slowed down during the so-called HMO revolution. At the end of the day, he and Skinner do not think there

Comments and disCussion 323
is a single policy lever that will bend the cost curve, but rather a series of one-time level shifts, including the rise of ACOs. Insurers as a group have not been very bold in the last two decades, but for reasons that are not well understood this has just started to change, which is encouraging. The rising number of patients that insurers have been acquiring thanks to both Medicare Advantage and the new health exchanges might be contributing to this confidence. This might be why more of them are finally pushing back against fee-for-service Medicare, doing utilization reviews to nudge patients away from dubious medical technologies, actions that they were not taking before 2006.
Replying to Romer, Chandra said the central reasons that led him and his coauthors to conclude that cost growth will continue were the continued presence of certain long-term cost drivers, including the development of new technologies and Medicare fees-for-services. Until the reimbursement system changes broadly, nothing is going to slow down the innovation engine. This still leaves the possibility open, though, for costs to be reined in through the impact of bundled payments systems.