Is this quarter fair?
59
description
Is this quarter fair?. Is this quarter fair?. How could you determine this? You assume that flipping the coin a large number of times would result in heads half the time (i.e., it has a .50 probability). Is this quarter fair?. Say you flip it 100 times 52 times it is a head - PowerPoint PPT Presentation
Transcript of Is this quarter fair?


Is this quarter fair?

Is this quarter fair?
• How could you determine this?
• You assume that flipping the coin a large number of times would result in heads half the time (i.e., it has a .50 probability)

Is this quarter fair?
• Say you flip it 100 times
• 52 times it is a head
• Not exactly 50, but its close– probably due to random error

Is this quarter fair?
• What if you got 65 heads?
• 70?
• 95?
• At what point is the discrepancy from the expected becoming too great to attribute to chance?

Example• You give 100 random students a questionnaire designed
to measure attitudes toward living in dormitories
• Scores range from 1 to 7 – (1 = unfavorable; 4 = neutral; 7 = favorable)
• You wonder if the mean score of the population is different then the population mean at Haverford (which is 4)
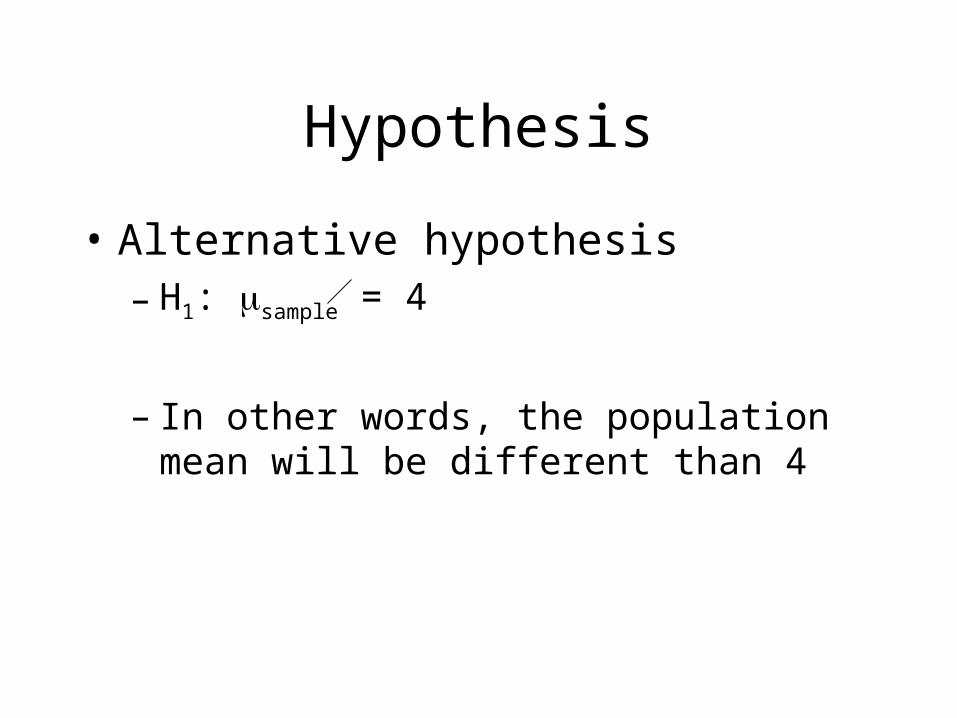
Hypothesis
• Alternative hypothesis– H1: sample = 4
– In other words, the population mean will be different than 4

Hypothesis
• Alternative hypothesis– H1: sample = 4
• Null hypothesis– H0: sample = 4
– In other words, the population mean will not be different than 4

Results
• N = 100
• X = 4.51
• s = 1.94
• Notice, your sample mean is consistent with H1, but you must determine if this difference is simply due to chance

Results
• N = 100
• X = 4.51
• s = 1.94
• To determine if this difference is due to chance you must calculate an observed t value
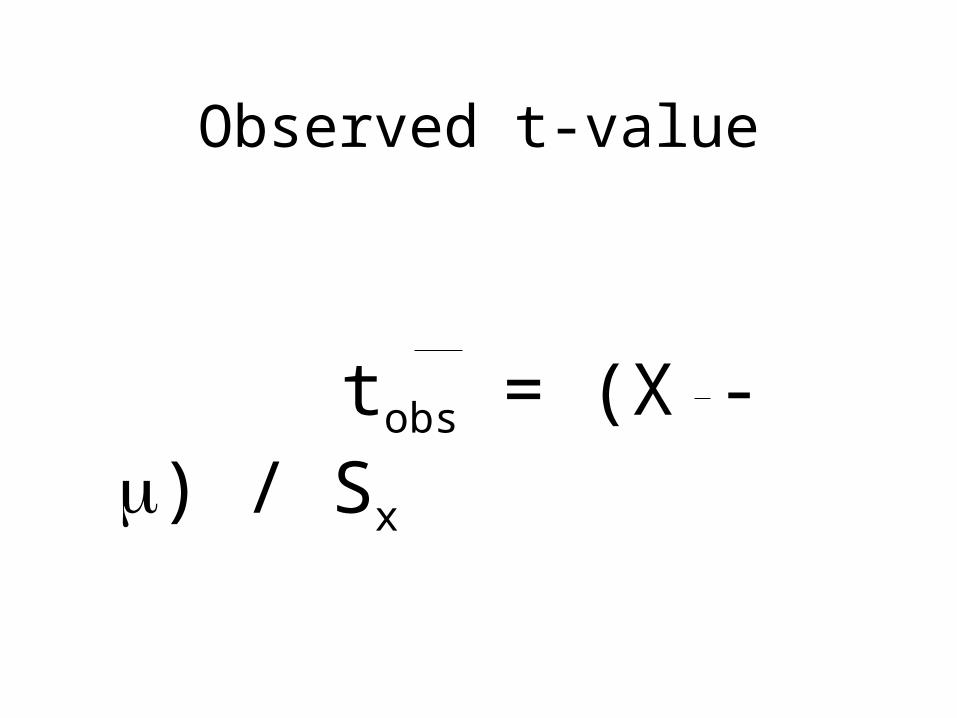
Observed t-value
tobs = (X - ) / Sx
Observed t-value
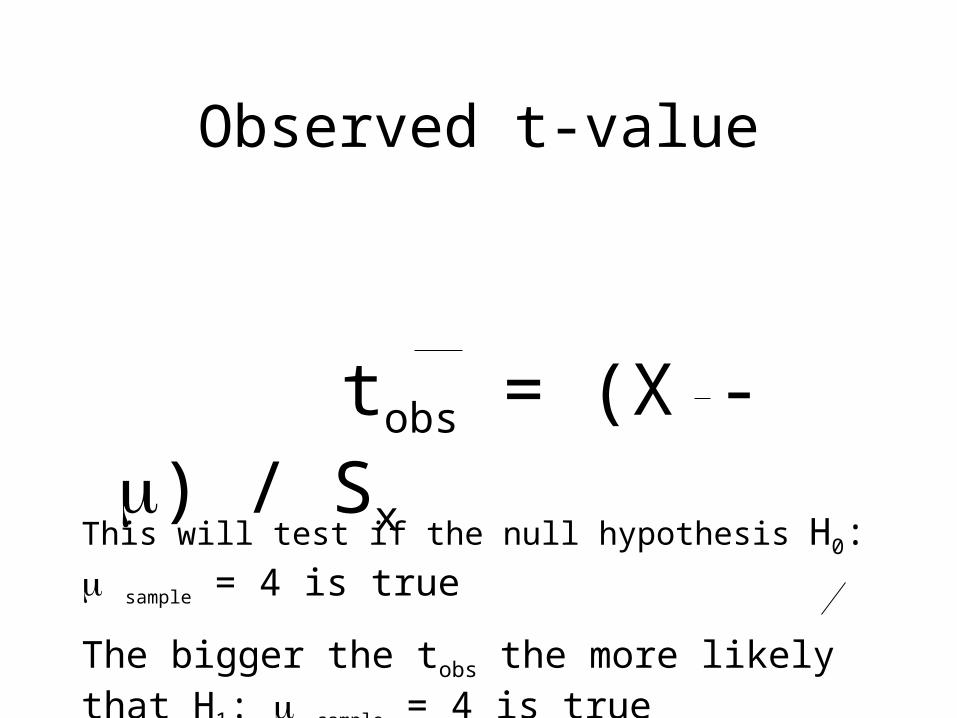
tobs = (X - ) / Sx
This will test if the null hypothesis H0: sample = 4 is true
The bigger the tobs the more likely that H1: sample = 4 is true
Observed t-value
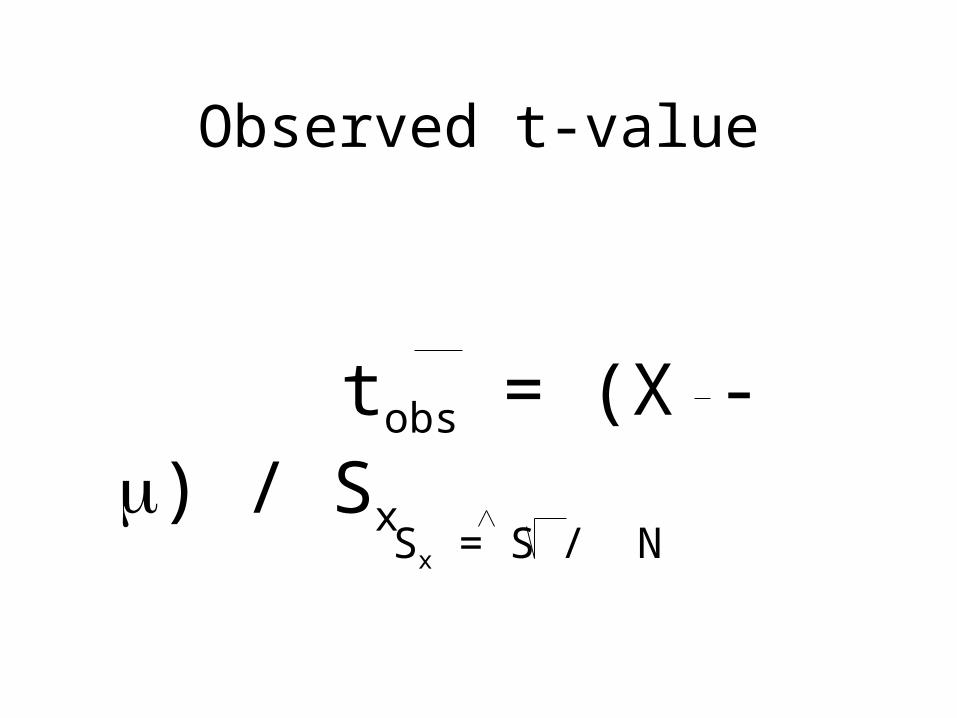
tobs = (X - ) / Sx
Sx = S / N

Observed t-value
tobs = (X - ) / .194
.194 = 1.94/ 100

Observed t-value
tobs = (4.51 – 4.0) / .194

Observed t-value
2.63 = (4.51 – 4.0) / .194

t distribution

t distribution
tobs = 2.63

t distribution
tobs = 2.63
Next, must determine if this t value happened due to chance or if represent a real difference in means. Usually, we want to be 95% certain.

t critical
• To find out how big the tobs must be to be significantly different than 0 you find a tcrit value.
• Calculate df = N - 1
• Table D – First Column are df
– Look at an alpha of .05 with two-tails

t distribution
tobs = 2.63

t distribution
tobs = 2.63
tcrit = 1.98tcrit = -1.98

t distribution
tobs = 2.63
tcrit = 1.98tcrit = -1.98

t distribution
tobs = 2.63
tcrit = 1.98tcrit = -1.98
If tobs fall in critical area reject the null hypothesis
Reject H0: sample = 4
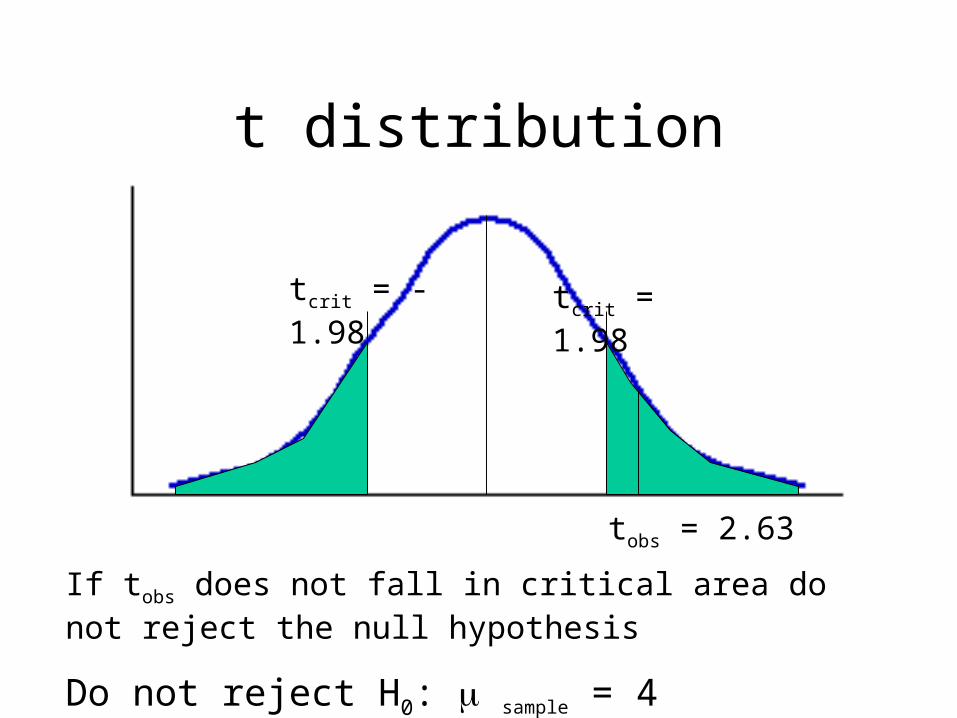
t distribution
tobs = 2.63
tcrit = 1.98tcrit = -1.98
If tobs does not fall in critical area do not reject the null hypothesis
Do not reject H0: sample = 4

Decision
• Since tobs falls in the critical region we reject Ho and accept H1
• It is statistically significant, the average favorability of Villanova dorms is significantly different than the favorability of Haverford dorms.
• p < .05
p < .05
• We usually test for significance at the “.05 level”
• This means that the results we got in the previous example would only happen 5 times out of 100 if the true population mean was really 4


Hypothesis Testing

Hypothesis Testing
• Basic Logic• 1) Want to test a hypothesis (called the research or
alternative hypothesis).– “Second born children are smarter than everyone else
(Mean IQ of everyone else = 100”)
• 2) Set up the null hypothesis that your sample was drawn from the general population– “Your sample of second born children come from a
population with a mean of 100”

Hypothesis Testing
• Basic Logic• 3) Collect a random sample
– You collect a sample of second born children and find their mean IQ is 145
• 4) Calculate the probability of your sample mean occurring given the null hypothesis– What is the probability of getting a sample mean of 145
if they were from a population mean of 100

Hypothesis Testing
• Basic Logic• 5) On the basis of that probably you make a
decision to either reject of fail to reject the null hypothesis.
– If it is very unlikely (p < .05) to get a mean of 145 if the population mean was 100 you would reject the null
– Second born children are SIGNIFICANTLY smarter than the general population

Example• You wonder if the average IQ score of
Villanova students is significantly different (at alpha = .05)than the average IQ of the population (which is 100). To determine this you collect a sample of 54 students.
• N = 54
• X = 130
• s = 18.4

The Steps
• Try to always follow these steps!

Step 1: Write out Hypotheses
• Alternative hypothesis– H1: sample = 100
• Null hypothesis– H0: sample = 100

Step 2: Calculate the Critical t
• N = 54
• df = 53 = .05
• tcrit = 2.0

Step 3: Draw Critical Region
tcrit = 2.00tcrit = -2.00

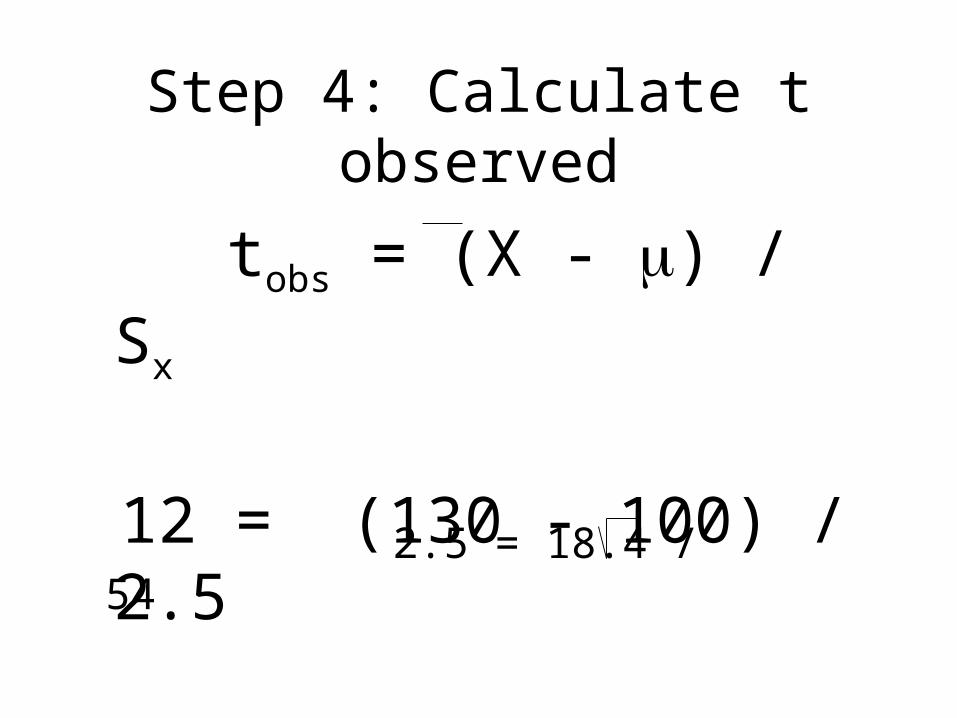
Step 4: Calculate t observed
tobs = (X - ) / Sx

Step 4: Calculate t observed
tobs = (X - ) / Sx
Sx = S / N

Step 4: Calculate t observed
tobs = (X - ) / Sx
2.5 = 18.4 / 54
Step 4: Calculate t observed
tobs = (X - ) / Sx
12 = (130 - 100) / 2.52.5 = 18.4 / 54
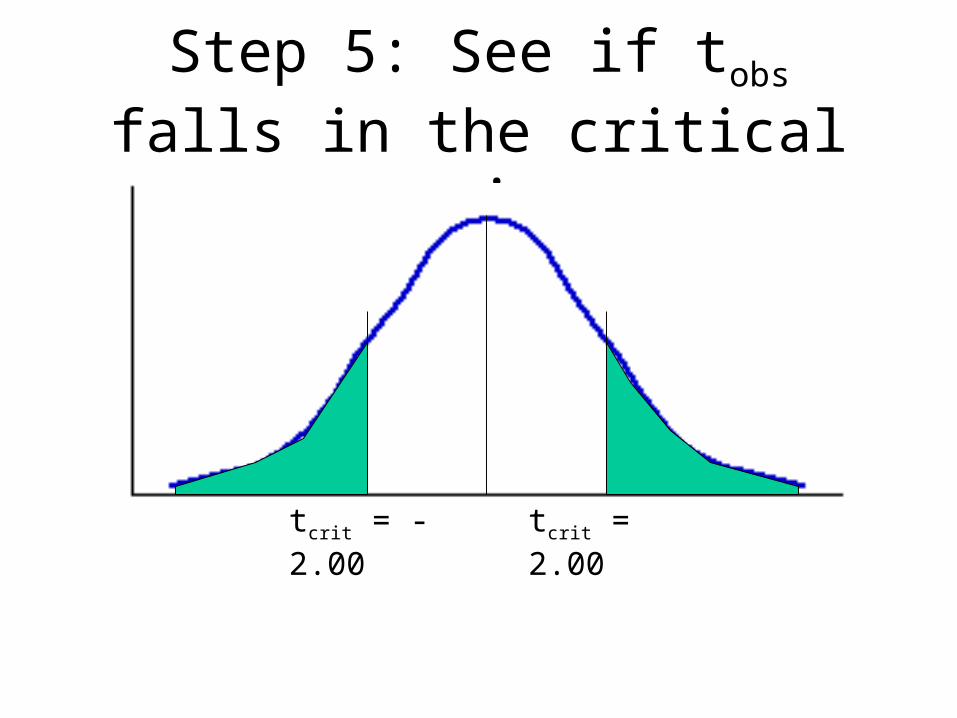
Step 5: See if tobs falls in the critical region
tcrit = 2.00tcrit = -2.00
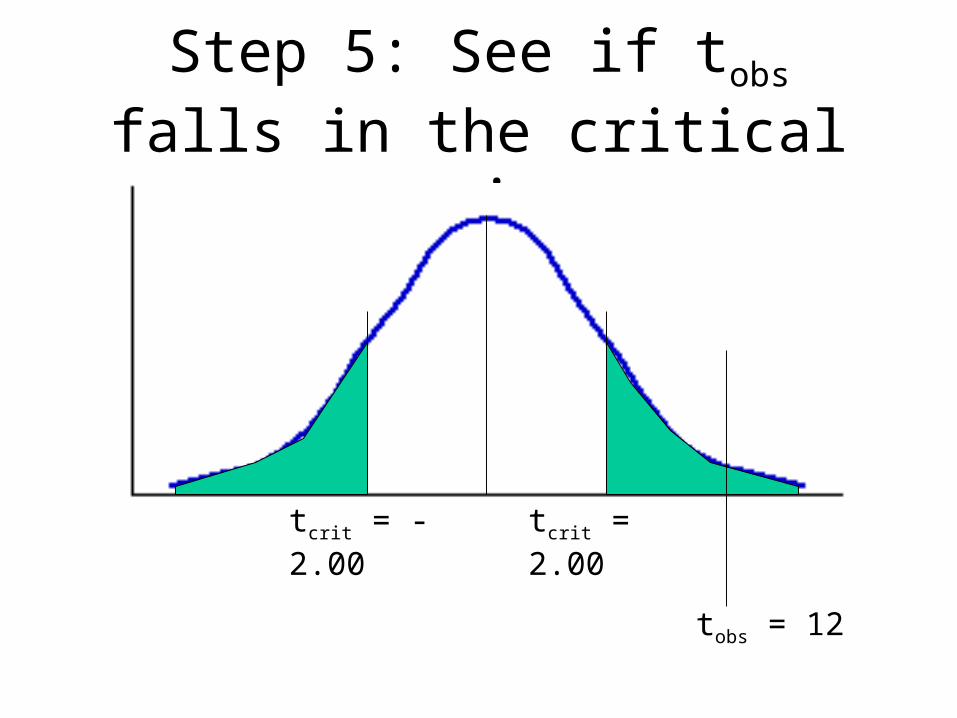
Step 5: See if tobs falls in the critical region
tcrit = 2.00tcrit = -2.00
tobs = 12
Step 6: Decision
• If tobs falls in the critical region:
– Reject H0, and accept H1
• If tobs does not fall in the critical region:
– Fail to reject H0
Step 7: Put answer into words
• We reject H0 and accept H1.
• The average IQ of Villanova students statistically different ( = .05) than the average IQ of the population.

Practice• You wonder if the average agreeableness score of
Villanova students is significantly different (at alpha = .05) than the average agreeableness of the population (which is 3.8). You collect data from 31 people.
• N = 31
• X = 3.92
• s = 1.52

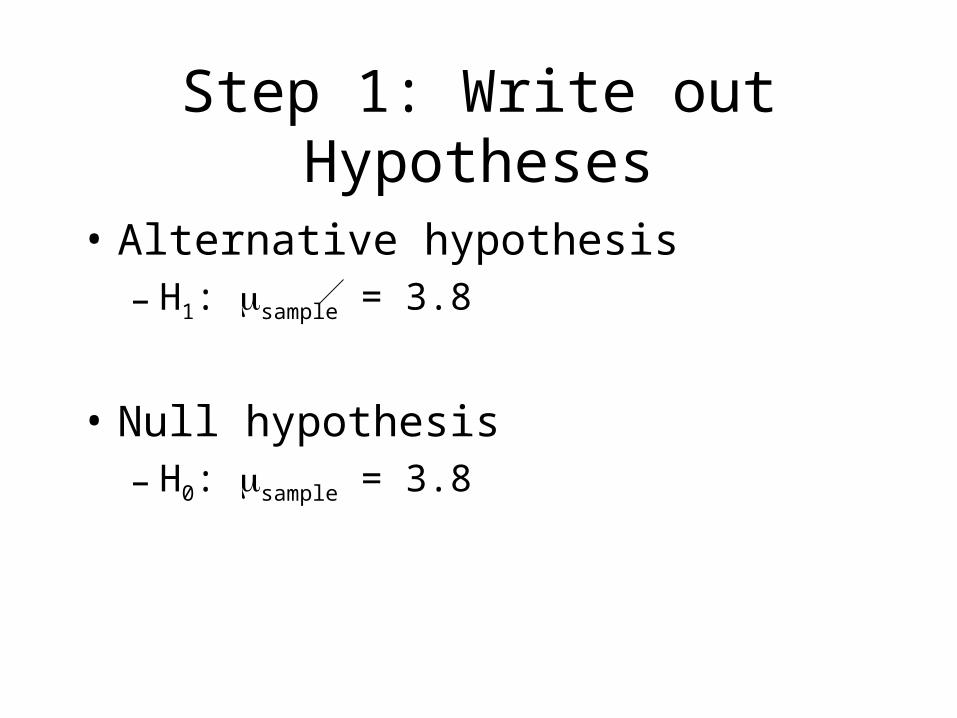
Step 1: Write out Hypotheses
• Alternative hypothesis– H1: sample = 3.8
• Null hypothesis– H0: sample = 3.8
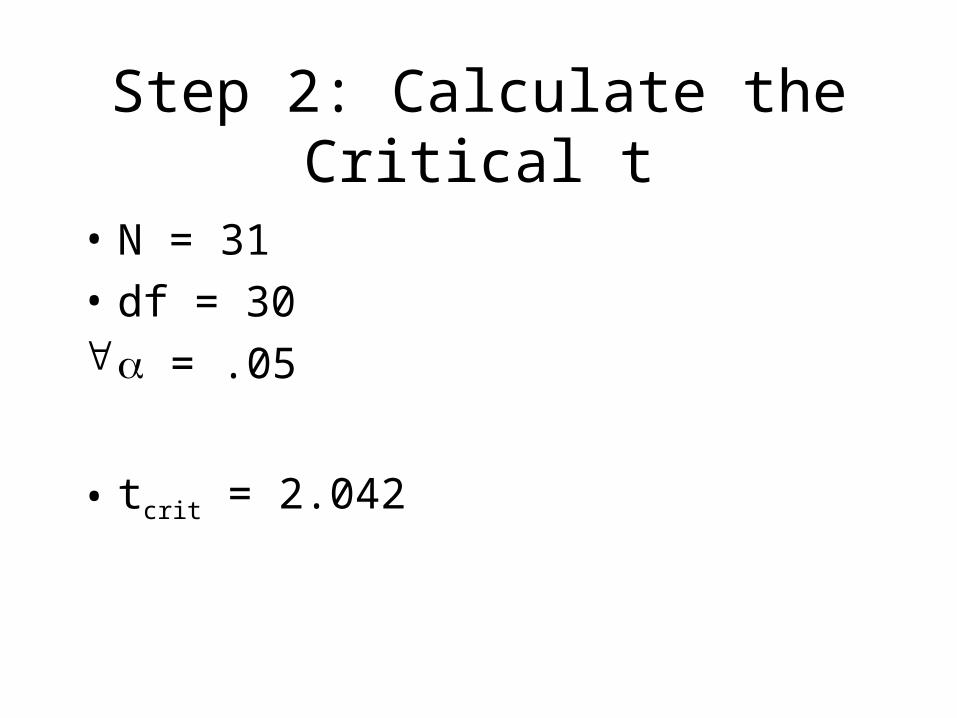
Step 2: Calculate the Critical t
• N = 31
• df = 30 = .05
• tcrit = 2.042
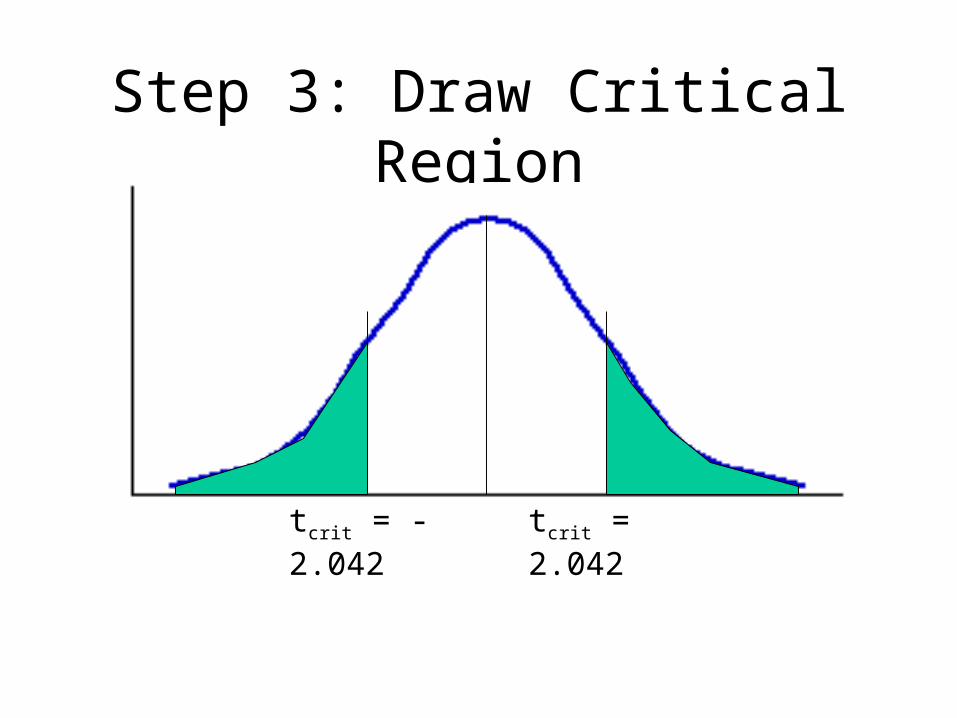
Step 3: Draw Critical Region
tcrit = 2.042tcrit = -2.042

Step 4: Calculate t observed
tobs = (X - ) / Sx
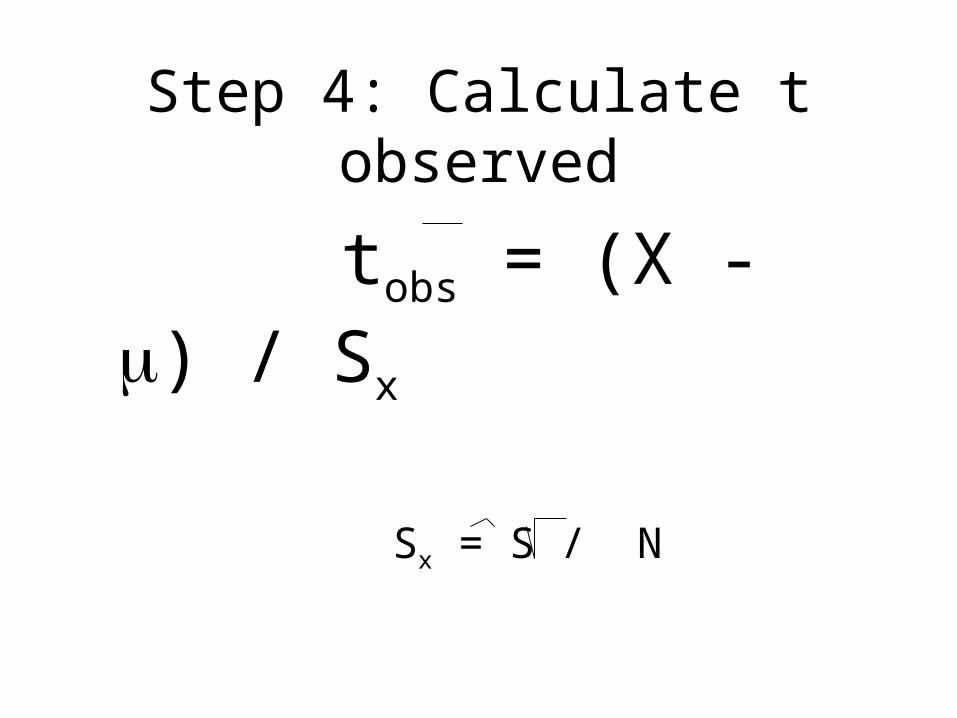
Step 4: Calculate t observed
tobs = (X - ) / Sx
Sx = S / N

Step 4: Calculate t observed
tobs = (X - ) / Sx
.27 = 1.52 / 31
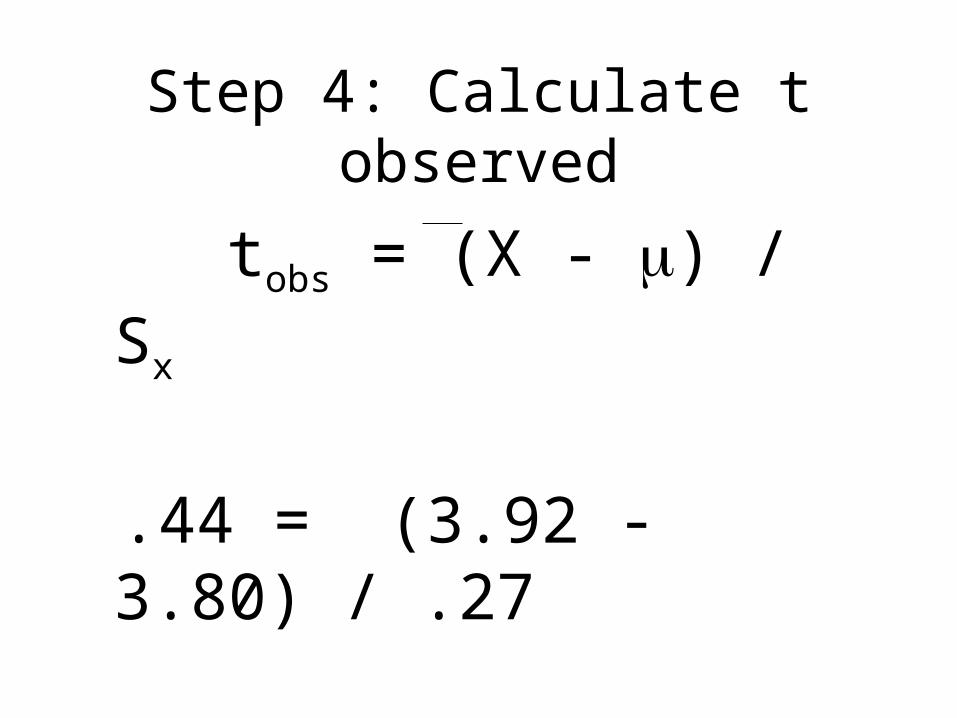
Step 4: Calculate t observed
tobs = (X - ) / Sx
.44 = (3.92 - 3.80) / .27
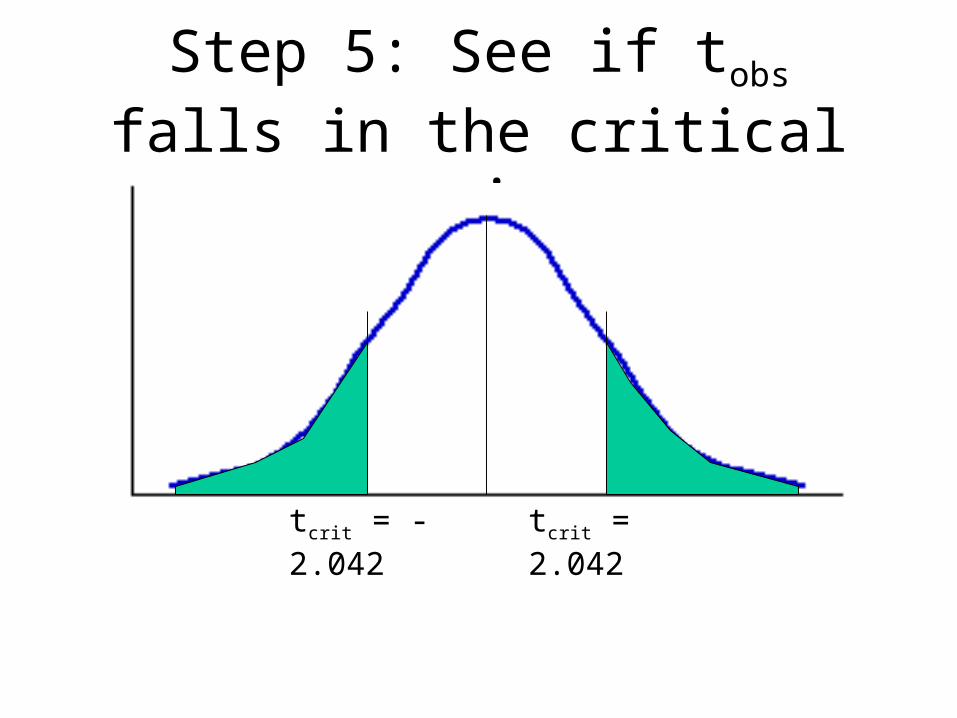
Step 5: See if tobs falls in the critical region
tcrit = 2.042tcrit = -2.042
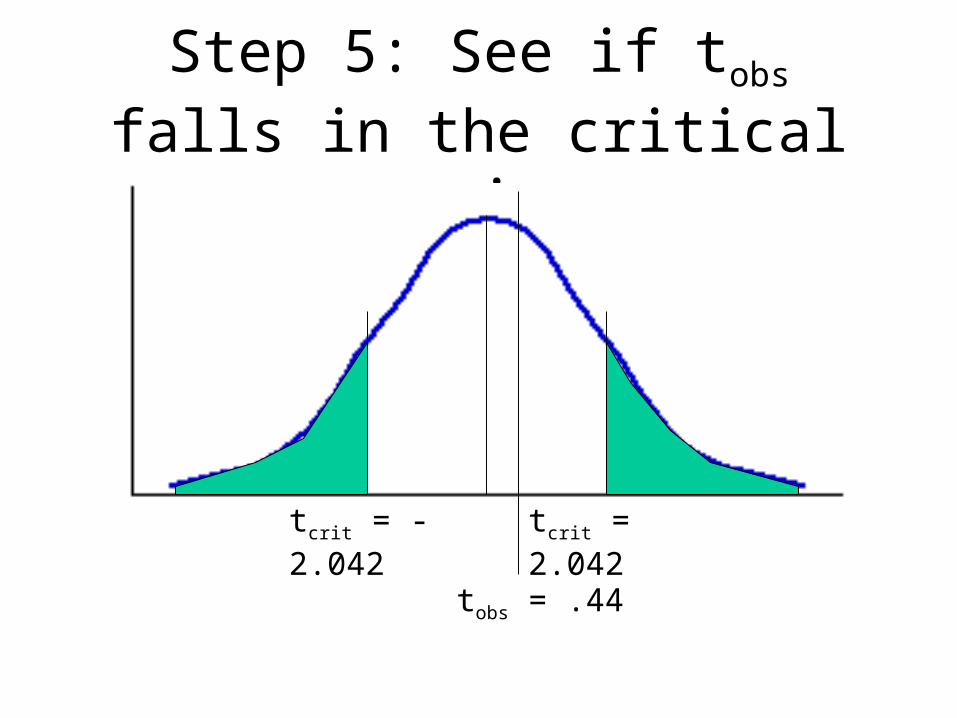
Step 5: See if tobs falls in the critical region
tcrit = 2.042tcrit = -2.042
tobs = .44

Step 6: Decision
• If tobs falls in the critical region:
– Reject H0, and accept H1
• If tobs does not fall in the critical region:
– Fail to reject H0
Step 7: Put answer into words
• We fail to reject H0
• The average agreeableness score of Villanova students is not statistically different ( = .05) than the average agreeableness score of the population.