Is there improvement in total factor productivity growth ...
26
econstor Make Your Publications Visible. A Service of zbw Leibniz-Informationszentrum Wirtschaft Leibniz Information Centre for Economics Pal, Dipyaman; Chakraborty, Chandrima; Ghose, Arpita Article Is There any Improvement in Total Factor Productivity Growth of Indian Pharmaceutical Industry after TRIPS Agreement? : Evidence from Biennial Malmquist Index The Central European Review of Economics and Management (CEREM) Provided in Cooperation with: WSB University in Wrocław Suggested Citation: Pal, Dipyaman; Chakraborty, Chandrima; Ghose, Arpita (2018) : Is There any Improvement in Total Factor Productivity Growth of Indian Pharmaceutical Industry after TRIPS Agreement? : Evidence from Biennial Malmquist Index, The Central European Review of Economics and Management (CEREM), ISSN 2544-0365, WSB University in Wrocław, Wrocław, Vol. 2, Iss. 3, pp. 55-80, http://dx.doi.org/10.29015/cerem.546 This Version is available at: http://hdl.handle.net/10419/229773 Standard-Nutzungsbedingungen: Die Dokumente auf EconStor dürfen zu eigenen wissenschaftlichen Zwecken und zum Privatgebrauch gespeichert und kopiert werden. Sie dürfen die Dokumente nicht für öffentliche oder kommerzielle Zwecke vervielfältigen, öffentlich ausstellen, öffentlich zugänglich machen, vertreiben oder anderweitig nutzen. Sofern die Verfasser die Dokumente unter Open-Content-Lizenzen (insbesondere CC-Lizenzen) zur Verfügung gestellt haben sollten, gelten abweichend von diesen Nutzungsbedingungen die in der dort genannten Lizenz gewährten Nutzungsrechte. Terms of use: Documents in EconStor may be saved and copied for your personal and scholarly purposes. You are not to copy documents for public or commercial purposes, to exhibit the documents publicly, to make them publicly available on the internet, or to distribute or otherwise use the documents in public. If the documents have been made available under an Open Content Licence (especially Creative Commons Licences), you may exercise further usage rights as specified in the indicated licence. www.econstor.eu
Transcript of Is there improvement in total factor productivity growth ...

econstorMake Your Publications Visible.
A Service of
zbwLeibniz-InformationszentrumWirtschaftLeibniz Information Centrefor Economics
Pal, Dipyaman; Chakraborty, Chandrima; Ghose, Arpita
ArticleIs There any Improvement in Total Factor Productivity Growth ofIndian Pharmaceutical Industry after TRIPS Agreement? : Evidencefrom Biennial Malmquist Index
The Central European Review of Economics and Management (CEREM)
Provided in Cooperation with:WSB University in Wrocław
Suggested Citation: Pal, Dipyaman; Chakraborty, Chandrima; Ghose, Arpita (2018) : Is Thereany Improvement in Total Factor Productivity Growth of Indian Pharmaceutical Industry afterTRIPS Agreement? : Evidence from Biennial Malmquist Index, The Central European Reviewof Economics and Management (CEREM), ISSN 2544-0365, WSB University in Wrocław,Wrocław, Vol. 2, Iss. 3, pp. 55-80,http://dx.doi.org/10.29015/cerem.546
This Version is available at:http://hdl.handle.net/10419/229773
Standard-Nutzungsbedingungen:
Die Dokumente auf EconStor dürfen zu eigenen wissenschaftlichenZwecken und zum Privatgebrauch gespeichert und kopiert werden.
Sie dürfen die Dokumente nicht für öffentliche oder kommerzielleZwecke vervielfältigen, öffentlich ausstellen, öffentlich zugänglichmachen, vertreiben oder anderweitig nutzen.
Sofern die Verfasser die Dokumente unter Open-Content-Lizenzen(insbesondere CC-Lizenzen) zur Verfügung gestellt haben sollten,gelten abweichend von diesen Nutzungsbedingungen die in der dortgenannten Lizenz gewährten Nutzungsrechte.
Terms of use:
Documents in EconStor may be saved and copied for yourpersonal and scholarly purposes.
You are not to copy documents for public or commercialpurposes, to exhibit the documents publicly, to make thempublicly available on the internet, or to distribute or otherwiseuse the documents in public.
If the documents have been made available under an OpenContent Licence (especially Creative Commons Licences), youmay exercise further usage rights as specified in the indicatedlicence.
www.econstor.eu

CENTRAL EUROPEAN REVIEW OF ECONOMICS AND MANAGEMENT ISSN 2543-9472; eISSN 2544-0365
www.cerem-review.eu
www.ojs.wsb.wroclaw.pl Vol. 2, No. 3, 55-79, September 2018
Correspondence address: Dr. Dipyaman PAL, Department of Economics, Bethune College, Kolkata, West Bengal, India, E-mail: [email protected], [email protected], [email protected] Received: 14.09.2017, Revised: 21.03.2018, Revised: 28.06.2018, Accepted: 28.06.2018 doi: http://dx.doi.org/10.29015/cerem.546
© 2018 WSB UNIVERSITY IN WROCŁAW
Is there improvement in total factor productivity
growth of the Indian pharmaceutical industry after
TRIPS agreement? Evidence from Biennial
Malmquist Index
Dipyaman PAL
Bethune College, Kolkata, West Bengal, India
Chandrima CHAKRABORTY
Vidyasagar University, Midnapore, WestBengal, India
Arpita GHOSE
Jadavpur University, Kolkata, India
Abstract:
Aim: Indian Pharmaceutical Industry (IPI) has undergone a massive makeover–from a modest beginning of “process patents regime” in the seventies to a modern and WTO compatible regime under the Trade Related Intellectual Property Rights System (TRIPS) in 2005. This paper estimates Total Factor Productivity Growth (TFPG) of Indian Pharmaceutical Industry (IPI) using firm level data from 2000 to 2013. Design / Research methods: We have used nonparametric approach of Data Envelopment Analysis (DEA) using Biennial Malmquist Index. Conclusions / findings: The results of estimation suggest an increase in overall TFPG of IPI after TRIPS agreement and also those vertically integrated firms involved in both bulk drugs production and formulation activities are less productive compared to firms that are involved in production of only bulk drug or formulation activity. Originality / value of the article: This paper examines whether productivity of IPI has increased after 2005 i.e. after the period of TRIPS, by estimating TFPG for two sub-periods, i.e., from 2000 to 2005 and 2006 to 2013. Implications of the research: The decomposition of TFPG suggests that for overall period 2000-2013, scale changes are the most important factor causing the productivity changes and among the other two alternative sources of TFPG, efficiency change dominates over technical changes. For the sub-period 2006-2013, the improvement in the scale efficiency may push the firms to a higher TFPG, whereas for

Dipyaman PAL, Chandrima CHAKRABORTY, Arpita GHOSE
56
2000-2005 the better utilization of factors of production is the main driver of TFPG. A second stage panel regression suggests that R&D expenditure, Marketing expenditure, Market size, Capital-Labour ratio, import intensity and export intensity have positive and significant influence on TFPG. Key words: Total Factor Productivity Growth (TFPG), TRIPS, Indian Pharmaceutical Industry, Data Envelopment Analysis (DEA), Biennial Malmquist Index.
JEL: L65, C14, C33
1. Introduction
The growth of Indian Pharmaceutical industry (IPI) can broadly be classified
into three phases. The first phase corresponds to the period 1900-1970 which
signifies the dominance of multinationals (MNCs) (the market share being 68% in
1970), which prevented the indigenous companies from producing new drugs, using
the then existing patent law. Indigenous companies themselves were keener to
process imported bulk drugs rather than developing the industry from basic stages.
The size of the pharmaceutical industry was then very small as compared to its
present status. The second phase corresponds to the period 1970-1990 witnessing the
amendment of the Patent Act of 1911 which came into force in 1972. This change
brought a renaissance to the IPI. After the changes in the patent law, large scale
production of bulk drugs was started by the indigenous sector in the late 1970’s,
particularly in the 1980’s, as a result of which first, imports were replaced and
secondly, consumption increased significantly leading to the unprecedented growth
in formulation activity. Exports started increasing steadily. Till 1987-1988, imports
were larger than exports except for a few years but with steady increase in exports
the country has become a net exporter since 1988-1989. The net results of this are
that MNCs lost their market domination. The market share of the MNC’s declined
from around 60% in the late 1970’s to around 40% in the early 1990’s. The
favourable environment attracted the entry of a number of new firms. The third
phase corresponds to the period after 1990s when significant changes occurred in
Pharmaceutical sector with introduction of trade liberalization measures. During the
period 1990s some significant changes occurred in the Pharmaceutical sector with
the introduction of trade liberalization measures like amendment of FERA and
MRTP Acts and delicensing of the drugs, reserved for production by the public
sector. During this period Government of India signed the Trade Related Intellectual

IS THERE IMPROVEMENT IN TOTAL FACTOR PRODUCTIVITY GROWTH …
57
Property Rights System (TRIPS) agreement which came into existence with World
Trade Organisation (WTO) established on 1 Jan1995 replacing The General
Agreement on Tariff and Trade (GATT). The private sector growed rapidly along
with increase in the competition among the domestic firms and foreign companies.
As a result production of IPI increased manifoldalong with a sharp and steady
increase in export. Net export as a percentage of total exports have also increased
(Chaudhuri 2005). All those drugs which were reserved for the production by the
public sector were delicenced in two stages. One immediate impact of this
delicensing of the drugs was that production increased manifold besides increase in
the competition among the domestic firms and foreign companies in 1990s. Both
production and export have grown remarkably fast. There was sharp and steady
increase of production and also of bulk drug production. As a result net exports as a
percentage of exports have increased (Chaudhuri 2005).
Indian Pharmaceutical Industry (IPI) has undergone a massive makeover–from a
modest beginning of “process patents regime” in the seventies to a modern and
WTO compatible regime under the TRIPs Agreement in 2005.It ranked 3rd in
volume and 14th in value in the global pharmaceutical market (Kalani, 2011). Since
2005, India has started full-fledged product patent regime in pharmaceuticals and are
to develop new drugs themselves or to collaborate with the MNCs as manufacturing
or marketing partners for the new drugs developed by the MNCs. (Chaudhuri 2005).
At this onset naturally the question arises that what happens to the total factor
productivity growth (TFPG) in IPI especially after the TRIPs Agreement in 2005?
The estimation of TFPG is thus essential, given the changed scenario of IPI in 2005.
Following trade liberalization measures, improved performance of the industrial
firms is now being called for an increase in productivity of a unit is now supposed to
be a prerequisite for growth or even mere survival. In fact, government policies
particularly after 2005, have gradually turned out to be less friendly to less
productive firms. Such an analysis will definitely be helpful for framing appropriate
policies for the development of IPI. The perusal of the literature on IPI signifies
dearth in the studies dealing with these issues although some econometric studies are
available on IPI (Lalitha 2002; Kumar 2001; Madanmohan 1997; Nagarajan,

Dipyaman PAL, Chandrima CHAKRABORTY, Arpita GHOSE
58
Barthwal 1990; Singh 1989; Chandrasekhar, Purkayastha 1982). The present paper
adds the literature in this direction.
This paper uses non-parametric approach of DEA to estimation of TFPG.
Analysis of TFPG as well as finding out their determinants is of greater research
interest as such studies may help policy makers and managers to devise and
implement policies that may enhance TFPG in this dynamic and globally
competitive industry. Studies on TFPG related to IPI are few in number like Saranga
and Banker (2010), Pannu, Kumar and Farooquie (2010), Kamiike, Sato and
Aggarwal (2012), Ghose and Chakraborty (2012) among others.
Sarangaand Banker (2010) studied the productivity change and factors behind
from 1994 to 2003 using DEA. They found that few innovative firms have pushed
the production frontier thereby increasing technical and productivity gains. They
argued that higher technical and R&D capabilities and wider new product portfolios
of multinational-companies have contributed to positive technical and productivity
changes. Whereas Pannu, Kumar and Farooquie (2010) using DEA analysed the
impact of R&D and innovation on relative efficiency, productivity change and firm
performance between 1998 and 2007. They found a positive impact of innovation
and patents on productivity, market share, exports and ability to attract contract
manufacturing. Study by Kamiike, Sato and Aggarwal (2012) using unit-level panel
database analysed the impact of industry dynamics on TFPG across regions from
2000-01 to 2005-2006. They found that productivity growth is relatively higher in
agglomerated region and effects of plant dynamics on productivity growth differ.
Study by Ghose and Chakraborty (2012) estimated TFPG by estimating production
function from 1973-1974 to 2003-2004, adjusted for stationarity after ADF-unit-root
test. Translog form gave the better fit. Variation in TFPG is also explained.
Given this background, the objectives of the present paper are first of all to find
out the TFPG of IPI by using Biennial Malmquist Index (BMI) of non-parametric
method of Data Envelopment Analysis (DEA) for the period 2000 to 2013. This
study also tried to find out the changed behavior of TFPG for IPI after 2005. After
finding out the extent of TFPG, the second objective is to decompose TFPG into its
different components: technical changes, efficiency changes and scale efficiency
changes to check which component dominates over the other while finding out the
IS THERE IMPROVEMENT IN TOTAL FACTOR PRODUCTIVITY GROWTH …
59
major sources of TFPG. Thirdly, this paper tries to explain the factors behind the
variation in TFPG of IPI.
The paper unfolds as follows: Section 2 describes the methodology and data
sources. The results of estimation are present in section 3. Section 4 concludes.
2. Methodology and Data Source
2.1 Methodology of measuring Biennial Malmquist Index (BMI)
In this paper we adopt the non-parametric (primal) approach to measure total
factor productivity change. In the non-parametric approach, productivity index is
used to measure productivity change.
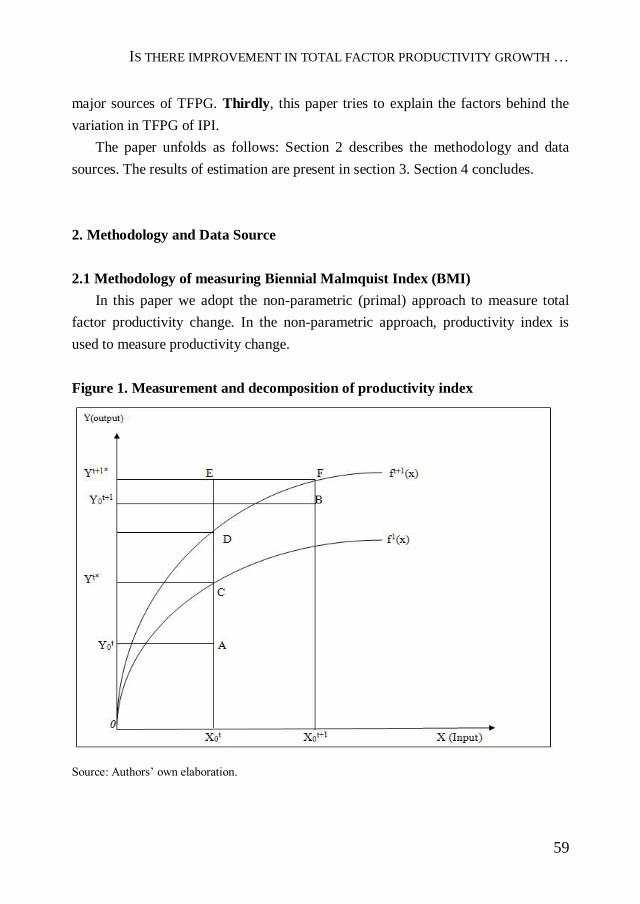
Figure 1. Measurement and decomposition of productivity index
Source: Authors’ own elaboration.

Dipyaman PAL, Chandrima CHAKRABORTY, Arpita GHOSE
60
Figure 1 illustrates the measurement of productivity index and decomposition of it
into above mentioned three components for a single input-single output case.
If in period t a firm produces output Y0t (Point A) from input X0
t its productivity
is
…1
Similarly, in period t+1, when output (Point B) is produced from input
, the productivity is
The productivity change in the period t+1, with period t as the base is measured
by
…3
Now suppose that the production function is in period t
and in period t+1. Because each observed input-output bundle
is by definition feasible in the relevant period, and .
Thus the productivity index, as defined in (3), can be rewritten and decomposed as
=
=TEC X TC X SEC …4
IS THERE IMPROVEMENT IN TOTAL FACTOR PRODUCTIVITY GROWTH …
61
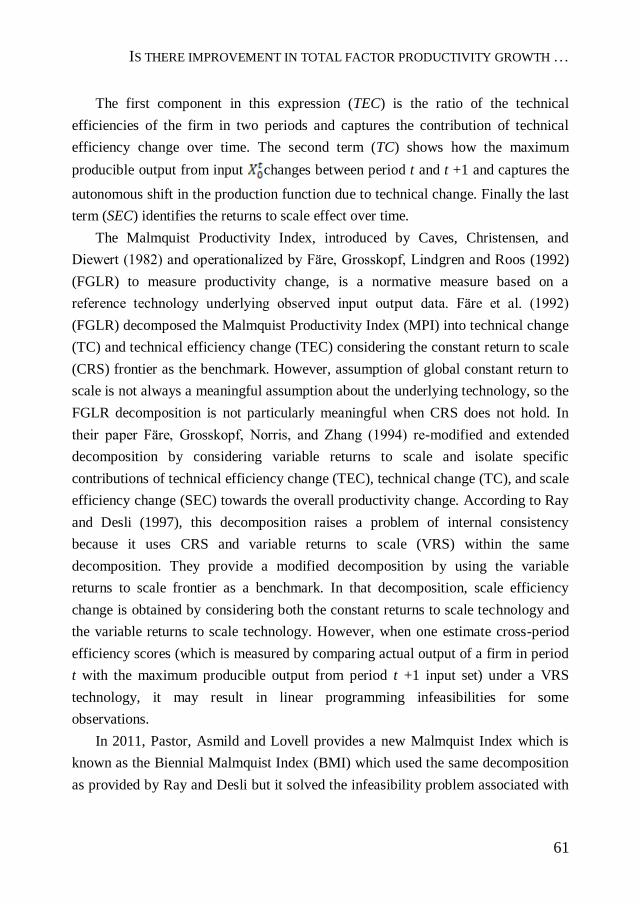
The first component in this expression (TEC) is the ratio of the technical
efficiencies of the firm in two periods and captures the contribution of technical
efficiency change over time. The second term (TC) shows how the maximum
producible output from input changes between period t and t +1 and captures the
autonomous shift in the production function due to technical change. Finally the last
term (SEC) identifies the returns to scale effect over time.
The Malmquist Productivity Index, introduced by Caves, Christensen, and
Diewert (1982) and operationalized by Färe, Grosskopf, Lindgren and Roos (1992)
(FGLR) to measure productivity change, is a normative measure based on a
reference technology underlying observed input output data. Färe et al. (1992)
(FGLR) decomposed the Malmquist Productivity Index (MPI) into technical change
(TC) and technical efficiency change (TEC) considering the constant return to scale
(CRS) frontier as the benchmark. However, assumption of global constant return to
scale is not always a meaningful assumption about the underlying technology, so the
FGLR decomposition is not particularly meaningful when CRS does not hold. In
their paper Färe, Grosskopf, Norris, and Zhang (1994) re-modified and extended
decomposition by considering variable returns to scale and isolate specific
contributions of technical efficiency change (TEC), technical change (TC), and scale
efficiency change (SEC) towards the overall productivity change. According to Ray
and Desli (1997), this decomposition raises a problem of internal consistency
because it uses CRS and variable returns to scale (VRS) within the same
decomposition. They provide a modified decomposition by using the variable
returns to scale frontier as a benchmark. In that decomposition, scale efficiency
change is obtained by considering both the constant returns to scale technology and
the variable returns to scale technology. However, when one estimate cross-period
efficiency scores (which is measured by comparing actual output of a firm in period
t with the maximum producible output from period t +1 input set) under a VRS
technology, it may result in linear programming infeasibilities for some
observations.
In 2011, Pastor, Asmild and Lovell provides a new Malmquist Index which is
known as the Biennial Malmquist Index (BMI) which used the same decomposition
as provided by Ray and Desli but it solved the infeasibility problem associated with

Dipyaman PAL, Chandrima CHAKRABORTY, Arpita GHOSE
62
the Ray-Desli decomposition of the Malmquist Index. Instead of using a
contemporaneous production possibility frontier, they estimated the technical
efficiency of a production unit with reference to a biennial production possibility
frontier.
2.2 Non Parametric Estimation of Productivity Index
This study considers the non-parametric method of Data Envelopment Analysis
(DEA) introduced by Charnes, Cooper and Rhodes (1978) and further generalized
for variable returns to scale technology by Banker, Charnes and Cooper (1984) in
order to measure and decompose the Malmquist index of total factor productivity.
The major advantage of using DEA is that, unlike in the parametric approach,
there is no need to specify any explicit functional form for the production function
(e.g., Cobb-Douglas or Translog) and mathematical programming techniques can be
used to get point-wise estimates of the production function. In fact, DEA allows one
to construct the production possibility set from observed input-output bundles on the
basis of the following four assumptions:
a) All observed input-output combinations are feasible;
b) The production possibility set is convex;
c) Inputs are freely disposable; and
d) Outputs are freely disposable.
Now, consider an industry producing one output from one input in period t.
The input output bundle ( ) is considered as feasible if the output can be
produced from the input Let ( ) represent the input-output bundle of firm j;
and suppose that input-output data are observed for n firms. Then, based on the
above assumptions, in period t, the production possibility set showing a variable
returns to scale (VRS) technology is
Under the constant returns to scale (CRS) assumption, if any (x, y) is feasible, so
is the bundle (kx,ky) for any k > 0. The production possibility set then becomes

IS THERE IMPROVEMENT IN TOTAL FACTOR PRODUCTIVITY GROWTH …
63
One can measure the output-oriented technical efficiency of a firm s
in period t by comparing its actual output with the maximum producible quantity
from its observed input Therefore, the output-oriented technical efficiency of
firm s in period t is
; where =max θ:( and is the period t
production possibility set.
An alternative characterization of technical efficiency in terms of the Shephard
Distance Function is It can be seen that =
Caves et al. (1982) defined the Malmquist Productivity Index as the ratio of the
period t and period t +1 output-oriented Shephard distance functions pertaining to a
certain benchmark technology. Equivalently, the Malmquist Index of total factor
productivity of the firm s is
…5
The standard non-parametric DEA model used to estimate the period t output-
oriented technical efficiency of a firm s, relative to contemporaneous CRS frontier is
=max θ
Subject to
And
By imposing the additional restriction in this DEA model, period t
out-put oriented technical efficiency under VRS technology of a firm s can be
estimated as .
It has been already mentioned that the Biennial Malmquist Index introduced by
Pastor, Asmild, and Lovell (2011) provides the same decomposition and avoids the

Dipyaman PAL, Chandrima CHAKRABORTY, Arpita GHOSE
64
infeasibility problem associated with the Ray-Desli decomposition of the Malmquist
Index.
Instead of using a contemporaneous production possibility frontier, they
estimated the technical efficiency of a production unit with reference to a biennial
production possibility frontier. So in order to understand the Biennial Malmquist
Index one has to first construct the Biennial Production Possibility Frontier.
Figure2. Simple graphical illustration of biennial production possibility frontier
Source: Authors’ own elaboration.
Figure 2 provides an illustration of the biennial production possibility frontier
and measure of output-oriented technical efficiency with reference to it for a firm,
producing a single output from a single input, observed in two time periods t and
t+1 (point A and B respectively). The VRS frontiers for period t and t +1 are
indicated by K0L0M0- extension and K1 L1M1- extension respectively. The rays
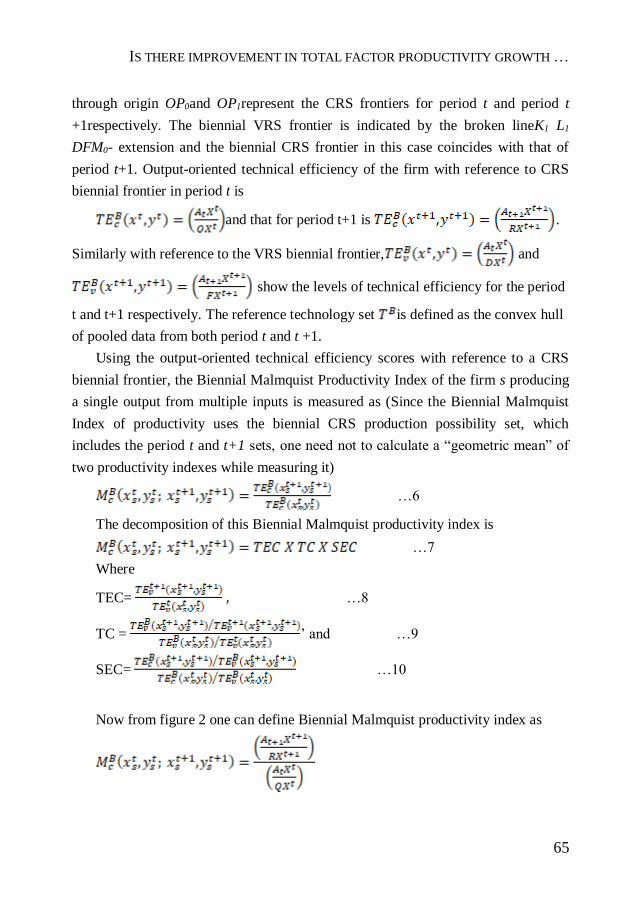
IS THERE IMPROVEMENT IN TOTAL FACTOR PRODUCTIVITY GROWTH …
65
through origin OP0and OP1represent the CRS frontiers for period t and period t
+1respectively. The biennial VRS frontier is indicated by the broken lineK1 L1
DFM0- extension and the biennial CRS frontier in this case coincides with that of
period t+1. Output-oriented technical efficiency of the firm with reference to CRS
biennial frontier in period t is
and that for period t+1 is .
Similarly with reference to the VRS biennial frontier, and
show the levels of technical efficiency for the period
t and t+1 respectively. The reference technology set is defined as the convex hull
of pooled data from both period t and t +1.
Using the output-oriented technical efficiency scores with reference to a CRS
biennial frontier, the Biennial Malmquist Productivity Index of the firm s producing
a single output from multiple inputs is measured as (Since the Biennial Malmquist
Index of productivity uses the biennial CRS production possibility set, which
includes the period t and t+1 sets, one need not to calculate a “geometric mean” of
two productivity indexes while measuring it)
…6
The decomposition of this Biennial Malmquist productivity index is
…7
Where
TEC= …8
TC = ’ and …9
SEC= …10
Now from figure 2 one can define Biennial Malmquist productivity index as
Dipyaman PAL, Chandrima CHAKRABORTY, Arpita GHOSE
66
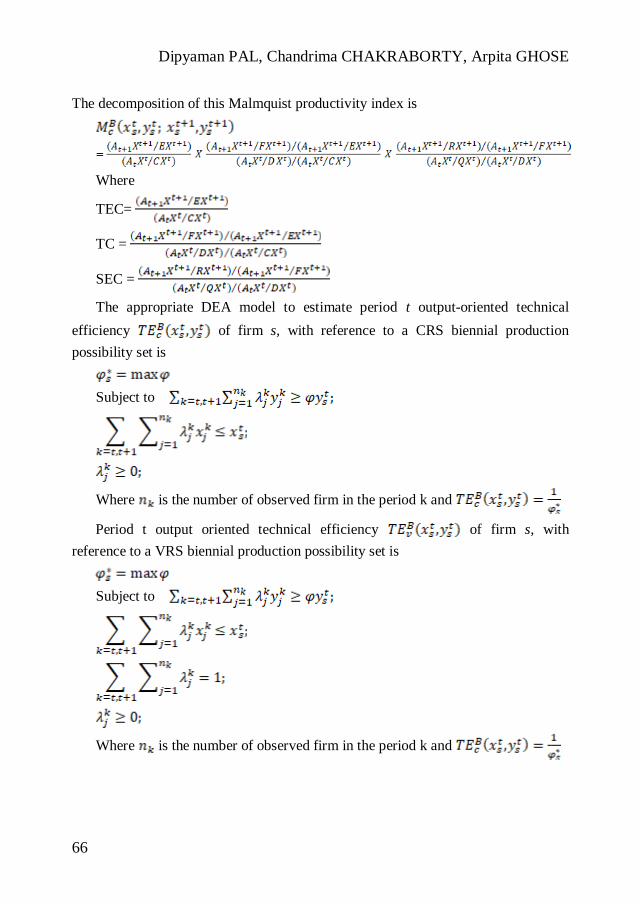
The decomposition of this Malmquist productivity index is
Where
TEC=
TC =
SEC =
The appropriate DEA model to estimate period t output-oriented technical
efficiency of firm s, with reference to a CRS biennial production
possibility set is
Subject to
Where is the number of observed firm in the period k and
Period t output oriented technical efficiency of firm s, with
reference to a VRS biennial production possibility set is
Subject to
Where is the number of observed firm in the period k and
IS THERE IMPROVEMENT IN TOTAL FACTOR PRODUCTIVITY GROWTH …
67
2.3 Determinants of TFPG
The variables used as possible determinants of TFPG are export intensity (E),
import intensity (I), Market size (MS), R&D expenditure (RD), marketing
expenditure (M) and Capital-Labour ratio (K/L).
Export intensity (E): One of the important characteristics of IPI is that they re-
engineer the imported technology and then re-export the product. Export plays a
very important role for the growth in the pharmaceutical sector. [Theoretical and
empirical literature supporting positive role of exports Goldar et. al. (2004), Ray
(2006)]. The findings of Indian studies are mixed and industry specific, even during
post-reform period. IPI exports a lot (Chaudhuri 2005). There is a common opinion
that international export enhances economic growth of involved firms (see Balassa
1988). Economic policies under export-led growth strategy have been widely
supported on the argument that exposure to international market through export
helps to increase growth of exporters. Similarly, advocates of endogenous growth
theory believe that export plays a crucial role by improving productivity and hence
growth through innovation (Grossman, Helpman 1991) and technology transfer
(Barro, Sala-i-Martin 1995). Through participation in export, growth can occur as a
result of many factors such as capital accumulation, adoption of new technologies,
research and development, changes in the organization of firms, etc. Export intensity
is defined by Export as a ratio to total sales
Import intensity (I): IPI also imports a lot of goods especially intermediate
goods. The imported intermediary good is an important channel through which
technological diffusion takes place (see Tybout 2000); this may affect productivity
and growth favorably. Imports allow countries to take advantage of other countries
technology embodied in imported inputs. Suffice here to mention theories of import-
led growth due to Grossman and Helpman (1991). The removal of quantitative
restrictions on imports and lowering of customs duties in the post liberalization era
of the Indian economy should have improved access of imported raw materials and
capital goods. Imports of materials embodying latest technologies should foster
productivity, efficiency and the growth of the firms. Goldar et al. (2004) and
Mazumder et al. (2012) reported positive relation between efficiency and imports.
Import intensity is defined by import as a ratio to total sales

Dipyaman PAL, Chandrima CHAKRABORTY, Arpita GHOSE
68
Market size (MS): It can be argued that higher the Market Size (MS) less is the
competition. MS captures the effect of market structure on TFPG. Some studies
argued that a negative relation between MS and TFP growth may occur because as
MS falls, competition increases which may lead to cost-consciousness and drive for
technological advancement. Others may point out that the advantages of big size,
secured market and expect a positive association between MS and TFPG because as
MS rises, competition falls, larger units are becoming more productive may be due
to the advantages of big size and secured market. The conclusion from the empirical
literature also varies and does not provide us a single answer (Katz 1969; Kendrick
1973). MS is obtained for each firm considering the ratio of total sales of each firm
to total sales of Pharmaceutical industry.
R&D Expenditure (RD): In recent years theoretical models related to
endogenous growth give emphasis to that R&D expenditures of individual firms
contribute to unremitting long run growth of an economy through their industry-
wide spillover effect (Grossman, Helpman 1990a, 1990b) because as individual
firms invest in R&D for private knowledge that enhances their productivity and
profit. Private knowledge of individual firms then spills over to the rest of the
industry and becomes social knowledge which acts as external effects in enhancing
the productivity of the firms. With this positive spill-over effect of R&D, a constant
or decreasing returns to scale aggregate production function may exhibit increasing
returns to scale and thus may lead to sustained long run growth (Raut, Srinivasan
1993). Again, Cohen and Levinthal (1989) among others pointed out that even as
knowledge from private R&D capital spills over to create social or public domain
knowledge, a firm must invest in R&D to obtain the technical capability needed to
make use of the public domain knowledge to improve its productivity and
efficiency. One explanation of this later view is that industry-wide knowledge will
not contribute to productivity gains unless the firm invests in R&D. The
technological capabilities approach also pointed out that the firm level technological
capabilities in developing countries are formed through slight innovations which
include incremental modifications in the plants and machineries, efficiently using
technologies, imitation, absorption and adaptation of imported technologies etc.
These small modifications are largely generated by firms’ in-house R&D efforts and

IS THERE IMPROVEMENT IN TOTAL FACTOR PRODUCTIVITY GROWTH …
69
the development of human resources and skills, notably on job training (Lall 2000).
Thus question can be raised to what extent increase in R&D helps to promote
productivity in this IPI sector? The present article tests this hypothesis empirically,
where R&D activity is measured by R&D expenditure which is defined by R&D
expenditure as a ratio to total sales.
Marketing Expenditure (M): This variable is measured by Marketing
Expenditure as a ratio to total sales and it also serves as a proxy for product
differentiation. Sheth and Sisodia (2002) argued that low productivity is due to the
descending of marketing efficiency. Their study point out that some changes are
needed at the corporate level and the most fundamental one is that corporations
should treat marketing as an investment rather than an expense. Kao et al. (2006)
evaluates Technical and Allocative Efficiency in Marketing and explains the
positive relation between return and marketing expenditure, which is defined as a
kind of investment. The return can be in the form of increased sales, or customers, or
some form of infrastructure that makes acquiring these items easier.
Degree of mechanization (K/L): Degree of mechanization is captured by
Capital-labor ratio (K/L) which serves as a technological variable1. Generally,
positive relationship between K/L and TFP growth is expected with the argument
that capital-intensive technology or sophisticated, advanced technology will
facilitate productivity growth by encouraging learning by doing. Thus it is
interesting to test the hypothesis that whether more the firm is capital intensive
higher may be TFPG. Ray (1997) found a positive relationship between these two.
Whereas Ahluwalia (1991) find negative association between these two variables
and argued that the industries with higher capital-labour ratio were the heavy
industries under the public sector which places constraints on the operation of these
industries with it’s adverse impact on productivity.
Dummy Variables for formulation (DF) and both formulation & bulk drugs
(DFB): Some of the studies like Chaudhuri (2012) argued that Imports of high priced
finished formulations are expanding rapidly with manufacturing investments lagging
behind. The aggregate market share of the MNCs in the formulations market has
gone up dramatically with the taking over of some Indian companies by the MNCs.
1 K/L is considered as determinant of TFP growth by Ray (1997) and Bandyopadhyay (2000).

Dipyaman PAL, Chandrima CHAKRABORTY, Arpita GHOSE
70
Thus it is necessary to check whether vertically integrated firm involved in both
bulk drugs production and formulation activities are less productive or not as
compared to firms that produce only bulk drugs or the firms doing formulation. For
finding out whether vertically merged firms are doing well in terms of TFPG
compared to the firms not merged vertically, two dummy variables have been
defined, one for firms engaged in formulation (DF) and another for firms producing
both formulation & bulk drugs (DFB) taking firms engaged in bulk drugs production
as the reference category. So DF=1, for firms engaged in formulation and 0
otherwise; similarly DFB=1 for firms producing both formulation & bulk drugs and 0
otherwise.
Time Dummy (DT): Also time dummy variables DT is defined as DT =1 for 2006
to 2013 and 0 otherwise to capture the effect of TRIPS on TFPG.
It is expected that firms which are incurring more RD can increase their TFPG
by expanding their information set. Again by spending on M a firm can increase its
market share. Hence sales increases and the firm may try to increase its production
with more efficient technologies. Also K/L and TFPG may found to be positively
linked which may imply that the industry perhaps is conducive for capital-intensive
production process. MS has positive role on the TFPG which implies that an
increase in market size will improve TFPG of IPI may be due to easier access of
quality inputs and getting advantage of scale economies. It may be quite evident that
units which are enjoying more export per unit of output are more productive than
others as they are learning suitable measures to improve their productivity level.
Also one may expect positively affect TFPG as one of the purposes of doing import
in IPI is to carry out the re-export process.
For finding out the determinants of TFPG, a panel regression analysis has been
done using a seemingly unrelated regression (SUR) framework where each
regression was adjusted for contemporaneous correlation (across units) and cross
section heteroscedasticity and test for better model-fixed/random with Hausman test
is done. In this paper SUR framework has been considered because since we are
considering export intensity (E), import intensity (I), R&D expenditure (RD),
marketing expenditure (M) and Capital-Labour ratio (K/L) among the determinants
of TFPG, it is quite possible that the for IPI, decision to undertake export intensity
IS THERE IMPROVEMENT IN TOTAL FACTOR PRODUCTIVITY GROWTH …
71
(E), import intensity (I), R&D expenditure (RD), marketing expenditure (M) and
Capital-Labour ratio (K/L) by one firm may influence the decision of the same by
other firms and hence the error term explaining the TFPG of one firm may be
correlated with the error explaining the TFPG for the others.
2.4 The Data sources
The present study uses CMIE Prowess data base and those firms are selected for
which all the data of inputs and outputs and the determinants are positive. On the
basis of this fact, 90 firms have been selected. The time period is 2000 to 2013.
3. Results of estimation
3.1 Results of TFPG
The TFPG for each of the years and also each firms are estimated. The results
are then summarized to generate the information regarding the changes of TFPG for
each year. Such estimation results are presented in Table 1. To capture the effect of
TRIPS this paper divides total sample period in to two sub-periods, i.e., from 2000
to 2005 and 2006 to 2013 and compare the estimated values of TFPG for these
periods. These results are also presented in Table 1.
From Table 1 it can be concluded that there has been an increased in the TFPG
over the total sample period. Not only that values of TFPG increased in the second
half, i.e. after TRIPS as compare to 2000 to 2005. So, it can be concluded that an
increase in overall TFPG of IPI after TRIPS agreement is evident.
3.2 Results of Decomposition of TFPG
The estimated results of TFPG are then decomposed into Efficiency Changes,
Scale Efficiency Changes and Technical Changes following the formula 7 to 10. For
each of the year, the overall changes in the decomposition of TFPG as well as
changes over the period from 2000-2005 and 2006-2013 are estimated.

Dipyaman PAL, Chandrima CHAKRABORTY, Arpita GHOSE
72
Table 1. Results of TFPG of IPI
YEAR TEC TC SEC MI
2000 0.995147 1 1.002609 0.997743
2001 1 1 1.014529 1.014529
2002 1 1 0.998382 0.998382
2003 1 1 1 1
2004 1.097111 1.002249 0.989028 1.087514
2005 1 1 1.000529 1.000529
AVERAGE (2000
TO 2005) 1.015376 1.000375 1.000846 1.01645
2006 1.032924 1 1.040142 1.074387
2007 1 1 1.002688 1.002688
2008 1 1 1.071032 1.071032
2009 1 1 1.000456 1.000456
2010 1.0178 1.000506 1.020663 1.039357
2011 1 1 1.000697 1.000697
2012 1.005563 1.00018 1.008582 1.014375
2013 1.006945 1.000172 1.007028 1.014196
AVERAGE (2006
TO 2013) 1.007904 1.000107 1.018911 1.027149
OVER ALL
AVERAGE 1.011106 1.000222 1.011169 1.022563
Source: Authors’ own elaboration.
All the results are presented in Table-1. Entries in column TEC show average
annual changes in the level of technical efficiency over time, a value greater than
unity for this component implies that, for that particular year IPI has experienced
improvement in technical efficiency over the previous period. Similarly, an entry
with value greater (less) than unity in column TC reflects technological progress
(regress) over time. The change in scale efficiency over time is reported in column
SEC, with a value exceeding one again signaling an improvement in scale
efficiency. From the results of Table 1, it can be concluded that productivity growth
is mostly driven by the change in the scale efficiency for the entire sample period.
The second important factor behind the changes in TFPG is the change in the
technical efficiency. The change in the technology has the lowest impact on the
IS THERE IMPROVEMENT IN TOTAL FACTOR PRODUCTIVITY GROWTH …
73
increase in the productivity. So it can be concluded that changes in the scale and
better utilization of factors of production may pushed IPI to be on higher TFPG for
the period 2000 to 2013.
Now if one consider for the period 2000 to 2005 it can be concluded that the
change in the technical efficiency is major factor behind the increase in TFPG.
Productivity growth is also driven by the change in the scale efficiency for this
period. Again, change in the technology has the lowest impact on the increase in the
productivity. For the period 2006 to 2013 productivity growth has increased mostly
for the change in the scale efficiency followed by the change in the technical
efficiency. The change in the technology has again the lowest impact on the increase
in the productivity.
Thus in conclusion it can be said that scale changes are the most important
factor causing the productivity changes for IPI. Among the two other alternative
sources of TFPG, an efficiency change dominates over technical changes. Thus, in
case of IPI, the improvement in the technical efficiency may push the firms to a
higher TFPG for the period 2006-2013. In case of 2000-2005 the better utilization of
factors of production is the main factor behind the improvement in TFPG.
3.3 Results of Determinants of TFPG
All the results of a second stage panel regression are presented in Table 2. The
estimated model also reports Adjusted R2 which represents the overall fit of the
model, which is based on the difference between residual sum of squares from the
estimated model and the sum of square from a single constant only specification, not
from a fixed effect only specification. High value of Adjusted R2 shows that the
fitted models are reasonably good.
From the results of estimation of growth equation it can be concluded that there
exists an inverted U shape relationship between TFPG and export intensity, capital-
labour ratio and market size implying that there exists a threshold limit beyond these
variables may affect the TFPG in reverse way. The overall marginal effects of all the
determinants are positive implying that on a whole these determinants may increase
the TFPG. So, it can be concluded that Capital-Labour ratio, market size and export
intensity have positive and significant influence on the TFPG. The positive linkage

Dipyaman PAL, Chandrima CHAKRABORTY, Arpita GHOSE
74
between Capital-Labour ratio and TFPG may imply that this industry perhaps is
conducive for capital-intensive production process. The relation between export
intensity and TFPG is obtained to be positive suggesting that those units which are
enjoying more export per unit of output are more efficient than others. In IPI one of
the purposes of doing import is to carry out the re-export process. The effect of
import intensity on TFPG of IPI is positive and significant. Market size has positive
role on the TFPG which may imply that big firms are grown faster than the large
firm. The effect of R&D expenditure and Marketing expenditure on TFPG is
positive and statistically significant although these relationships are not linear in
nature.
Table 2. Estimated results of Second Stage Panel Regression
Dependent Variable: BMI
Variable Coefficient Std. Error t-Statistic Prob.
C 4.4912* 0.6555 6.8518 0.0000
E 0.1673* 0.0391 4.2783 0.0000
I 0.0170* 0.0027 6.3775 0.0000
RD 0.2654* 0.0603 4.4022 0.0000
M 2.3586* 0.9084 2.5964 0.0096
KBYL 0.1052* 0.0257 4.0977 0.0000
MS 7.5635* 3.1272 2.4186 0.0053
E2 -0.0024** 0.0012 -1.9787 0.0481
KBYL*KBYL -0.0009* 0.0004 -2.4087 0.0061
MS2 -4.3360 2.8923 -1.4992 0.1810
DF 1.7439* 0.1711 10.1929 0.0000
DBOTH -1.0458* 0.4618 -2.2645 0.0238
DT 0.8552* 0.4149 2.0612 0.0396
Adjusted R-squared 0.7515
F-statistic 56.088692*
Prob(F-statistic) 0
*Significant at 1%; ** significant at 5%; *** Significant at 10%

IS THERE IMPROVEMENT IN TOTAL FACTOR PRODUCTIVITY GROWTH …
75
Table 3. Marginal effects
E 0.1362
I 0.0170
RD 0.2654
M 2.3586
KBYL 0.3157
MS 7.2025
Source: Authors’ own elaboration.
The dummy for vertically integrated firms involved in both bulk drugs
production and formulation activities is negative and significant whereas the dummy
for firms involved in formulation activity is positive and significant implying that
those vertically integrated firms involved in both bulk drugs production and
formulation activities are less productive compared to firms that produces only bulk
drug or are involved in formulation activity. The coefficient of time dummy is
positive and statistically significant implying that for the period 2006-2013 TFPG
has increased as compared to the period 2000-2005.
4. Conclusion
Indian Pharmaceutical Industry (IPI) is one of the few industries which has been
affected in a major way due to Trade Related Intellectual Property Rights System
(TRIPS) agreement as from the year 2005 the existing Process Patent regime gave
way to the Product Patent regime although the process of establishing a new patent
regime in India started since 1995. In such an environment it will be interesting to
examine whether there has been any improvement in the productivity of IPI after
2005 i.e. after the period of TRIPS. So, the paper estimates Total Factor Productivity
Growth (TFPG) of Indian Pharmaceutical Industry (IPI) using firm level data from
2000 to 2013. TFPG is estimated by nonparametric approach of Data Envelopment
Analysis (DEA) using Biennial Malmquist Index. To capture the effect of TRIPS
this paper divides total sample period in to two sub-periods, i.e., from 2000 to 2005

Dipyaman PAL, Chandrima CHAKRABORTY, Arpita GHOSE
76
and 2006 to 2013. An increase in overall TFPG of IPI after TRIPS agreement is
evident. The decomposition analysis of TFPG suggests that scale changes are the
most important factor causing the productivity changes for IPI. Among the two other
alternative sources of TFPG, an efficiency change dominates over technical changes.
In case of IPI, the improvement in the scale efficiency may push the firms to a
higher TFPG for the period 2006-2013. In case of 2000-2005 the better utilization of
factors of production is the main factor behind the improvement in TFPG.
This study pointed out those vertically integrated firms involved in both bulk
drugs production and formulation activities are less productive compared to firms
that produces only bulk drug or are involved in formulation activity. Also, for the
period 2006-2013 TFPG has increased as compare to the period 2000-2005.
A second stage panel regression suggests that the determinants R&D
expenditure, Marketing expenditure, Market size, Capital-Labour ratio, import
intensity and export intensity have positive and significant influence on the TFPG
implying that an increase in either of these variables can boost up TFPG of Indian
Pharmaceutical Industry.
Thus this result reveals that although the TRIPS agreement may push the TFPG
of IPI in a higher level but also in order to encourage total factor productivity
growth, any policy changes that will lead to increase in the export intensity, import
intensity, Market size, R&D expenditure, marketing expenditure and Degree of
mechanization should be emphasized.
References
Ahluwalia I.J. (1991), Productivity growth in Indian manufacturing, Oxford University Press, New
Delhi. Balassa B. (1988), Outward orientation, in: Handbook of development economics, Chenery H., Srinivasan T.N. (ed.), vol. 2, Elsevier, New York, pp. 1645-1689. Bandyopadhyay S. (2000), Impact of efficiency indicators on the growth of productivity. A survey and empirical evidence from India, „Margin”, vol. 33 no. 1, pp. 84-98.
Banker R.D., Charnes A., Cooper W.W. (1984), Some models for estimating technical and scale efficiencies in Data Envelopment Analysis, „Management Science”, vol. 30 no. 9, pp. 1078-1092.
IS THERE IMPROVEMENT IN TOTAL FACTOR PRODUCTIVITY GROWTH …
77
Barro R.J., Sala-i-Martin X. (1995), Economic growth, McGraw-Hill, New York. Caves D., Laurits W., Christensen R., Diewert W.E. (1982), The economic theory of index numbers and the measurement of input, output and productivity, „Econometrica”, vol. 50 no. 6, pp. 1393-1414.
Chandrasekhar C.P., Purkayastha P. (1982), Transfer pricing in the Indian drug industry. An estimate and it’s implications, „Social Scientist”, vol. 10 no. 1, pp. 3-10. Charnes A., Cooper W.W., Rhodes E.L. (1978), Measuring the efficiency of decision-making units, „European Journal of Operational Research”, vol. 2 no. 6, pp. 429-444. Charnes A., Cooper W.W., Rhodes E.L. (1981), Evaluating program and managerial efficiency – an application of Data Envelopment Analysis to Program Follow Through, „Management Science”, vol.
27 no.6, pp. 668-697. Chaudhuri S. (2005), The WTO and India’s pharmaceuticals industry. Patent protections, TRIPS and developing countries, Oxford University Press, New Delhi. Chaudhuri S. (2012), Multinationals and monopolies. Pharmaceutical industry in India after TRIPS, „Economic & Political Weekly”, vol. 47 no. 12, pp. 46-54.
Cohen W.M., Levinthal D.A. (1989), Innovation and learning. Two faces of R&D, „Economic Journal”, no. 99, pp. 569-596. Färe R., Grosskopf S., Lindgren B., Roos P. (1992), Productivity changes in Swedish pharmacies 1980-89. A non-parametric Malmquist approach, „Journal of Productivity Analysis”, vol. 3 no. 1/2, pp. 85-101. Färe R., Grosskopf S., Norris M., Zhang P. (1994), Productivity growth, technical progress and
efficiency changes in industrial countries, „American Economic Review”, vol. 84 no. 1, pp. 66-83. Ghose A., Chakraborty C. (2012), Total factor productivity growth in pharmaceutical industry. A look using modern time series approach with Indian data, „The Journal Of Industrial Statistics”, vol. 1 no. 2, pp. 250-268. Goldar B., Ranganathan V.S., Banga R. (2004), Ownership and efficiency in engineering firms, 1990-91 to 1999-2000, „Economic and Political Weekly”, vol. 39 no. 5, pp. 441-447.
Grossman G., Helpman E. (1990a), Comparative advantage and long run growth, „American Economic Review”, vol. 80 no. 4, pp. 796-815. Grossman G., Helpman E. (1990b), Trade, innovation and growth, „American Economic Review”, vol. 80 no. 2, pp. 86-91. Grossman G., Helpman E. (1991), Innovation and growth in the global economy, The MIT Press, Cambridge.
Kalani S. (2011), Emerging role of IT in Indian pharmaceutical industry and its implications for the education system, „Pharma Times”, vol. 43 no. 5, pp. 25-27.

Dipyaman PAL, Chandrima CHAKRABORTY, Arpita GHOSE
78
Kamiike A., Sato T., Aggarwal A. (2012), Productivity dynamics in the Indian pharmaceutical industry. Evidences from plant-level panel data, „Science, Technology and Society”, vol. 17 no. 3. Kao L.-J., Chiu Ch.-Ch., Gilbride T.J., Greg T.O., Allenby M. (2006), A direct approach to evaluating technical and allocative efficiency in marketing, Fisher College of Business, Ohio State University,
www.stat.osu.edu/~amd/papers/Efficiency.pdf [08.09.2018]. Katz J.M. (1969), Production function, foreign investment and growth, North-Holland Publishing Company, Amsterdam. Kendrick J.W. (1973), Post war productivity trends in the United States, 1947-1969, National Bureau of Economic Research, New York.
Kumar N. (2001), WTO regime, host country policies and global patterns of MNE activity. Recent quantitative studies and India’s strategic response, „Economic and Political Weekly”, vol.36 no.1, pp 39-50. Lalitha N. (2002), Indian pharmaceutical industry in WTO regime. A SWOT analysis, „Economic and Political Weekly”, vol. 37 no. 34, pp. 3542-3555. Lall S. (2000), Technological change and industrialization in the Asian newly industrializing
economies, in: Technology, learning, and innovation. Experiences of newly industrializing economies, Kim L., Nelson R.R. (ed.), Cambridge University Press, Cambridge, pp. 13-68. Madanmohan T.R. (1997), Exit strategies. Experience of Indian pharmaceutical firms, „Economic and Political Weekly”, vol. 32 no.48, pp. 107-110. Mazumder M., Rajeev M., Ray S.C. (2012), Sources of heterogeneity in the efficiency of Indian pharmaceutical firms, „Indian Economic Review”, vol. 47 no. 2, pp. 191-221.
Nagarajan M., Barthwal R.R. (1990), Profitability and structure. A firm level study of the Indian pharmaceutical industry, „Indian Economic Journal”, vol. 38 no. 2, pp. 70-81. Pannu H.S., Kumar U.D., Farooquie J.A. (2010), Impact of innovation on the performance of Indian pharmaceutical industry using Data Envelopment Analysis, IIM Bangalore Research Paper no. 302. Pastor J.T., Asmild M., Lovell C. (2011), The biennial Malmquist productivity change index, „Socio-Economic Planning Sciences”, vol. 45 no. 1, pp. 10-15.
Raut L.K., Srinivasan T.N. (1993), Theories of economic growth, old and new, in: Capital investment and development, Basu K., Majumdar M., Mitra T. (ed.), Basil Blackwell, New York. Ray S.C. (1997), Regional variation in productivity growth in Indian manufacturing. A nonparametric analysis, „Journal of Quantitative Economics”, vol. B no.1, pp. 73-94. Ray S.C. (2006), The changing role of technological factors in explaining efficiency in Indian firms,
„Journal of Developing Areas”, vol. 40 no. 1, pp. 127-140. Ray S.C., Desli E. (1997), Productivity growth, technical progress, and efficiency change in industrialized countries. Comment, „The American Economic Review”, vol. 87 no. 5, pp. 1033-1039.

IS THERE IMPROVEMENT IN TOTAL FACTOR PRODUCTIVITY GROWTH …
79
Saranga H., Banker R.D. (2010), Productivity and technical changes in the Indian pharmaceutical industry, „Journal of the Operational Research Society”, vol. 61 no. 12, pp. 1777-1788. Sheth J.N., Sisodia R.S. (2002), Marketing productivity. Issues and analysis, „Journal of Business Research”, vol. 55 no. 5, pp. 349-362.
Singh N. (1989), Trade behaviour of firms. An empirical study of the size and foreign collaboration effects, „Indian Economic Review”, vol. 24 no. 1, pp. 45-65. Tybout J.R. (2000), Manufacturing firms in developing countries. How well do they do and why? „Journal of Economic Literature”, vol. 38 no. 1, pp. 11-44.