Is There a Pollution Haven E⁄ect? Evidence from a Natural ...
41
Is There a Pollution Haven E/ect? Evidence from a Natural Experiment in China Yi Lu a , Mingqin Wu b , and Linhui Yu c a National University of Singapore, b South China Normal University, c University of Hong Kong June 2012 Lu, Wu, and Yu (NUS, SCNU, HKU) Pollution Haven E/ect? June 2012 1 / 41
Transcript of Is There a Pollution Haven E⁄ect? Evidence from a Natural ...
Is There a Pollution Haven E¤ect? Evidence from aNatural Experiment in China
Yi Lua, Mingqin Wub, and Linhui Yuc
aNational University of Singapore, bSouth China Normal University, cUniversity of HongKong
June 2012
Lu, Wu, and Yu (NUS, SCNU, HKU) Pollution Haven E¤ect? June 2012 1 / 41

IntroductionMotivation
Extreme weather in the world
concerns about environmental protectiontougher regulations on pollutionpush for development of greener technologies
An unintended consequence
plant reallocation to regions with less stringent regulationspotential increase in the overall pollutant emissionsPollution Haven E¤ect
Lu, Wu, and Yu (NUS, SCNU, HKU) Pollution Haven E¤ect? June 2012 2 / 41

IntroductionMotivation
Academic evidence is far from conclusive
no e¤ect
e.g., Friedman, Gerlowski, and Silberman (1992); Levinson (1996a);Eskeland and Harrison (2003); Javorcik and Wei (2004)surveys: Dean (1992); Ja¤e, Peterson, Portney, and Stavins (1995);Levinson (1996b)
negative e¤ect (PHE)
e.g., Henderson (1996); Becker and Henderson (2000); List and Co(2000); Keller and Levinson (2002); List, Millimet, Gredriksson, andMcHone (2003); Dean, Lovely and Wang (2009)
One of the most contentious issues in the international economicsliterature (Kellenberg, 2009)
Insu¢ cient academic evidence, especially in developing countries(Taylor, 2004)
Lu, Wu, and Yu (NUS, SCNU, HKU) Pollution Haven E¤ect? June 2012 3 / 41

IntroductionMotivation
An inherent challenge � - endogeneity of environmental regulation
exogenousendogenous
instrumental variable approach: Millimet and Roy (2011) for a surveypropensity score matching: List, Millimet, Gredriksson, and McHone(2003)
Lu, Wu, and Yu (NUS, SCNU, HKU) Pollution Haven E¤ect? June 2012 4 / 41
IntroductionContribution
Use a change in the environmental regulation in 1998 in China, TwoControl Zone (TCZ), as a natural experiment
Di¤erence-in-di¤erences estimation
time variation: before and after 1998cross-sectional variation: cities in the TCZ list and those not in theTCZ list
Lu, Wu, and Yu (NUS, SCNU, HKU) Pollution Haven E¤ect? June 2012 5 / 41

IntroductionContribution
Hanna (2011)
DID estimationout�ow FDI in the U.S.�rm-level analysis
Departure of our study
Developed country (the U.S.) versus developing country (China)FDI sourcing country versus FDI recipient country
Lu, Wu, and Yu (NUS, SCNU, HKU) Pollution Haven E¤ect? June 2012 6 / 41

Background on the National Environmental Policies
Fast increase in sulfur dioxide (SO2) emissions
1.05 billion tons in 1990 to 1.28 billion tons in 199562.3% cities exceeded the national Class II standard
Regulation before 1995
the Air Pollution Prevention and Control Law (APPCL) enacted in1987 and executed in 1988general principles of supervision on air pollution for the governmentinstitutions and related enterprisesno comprehensive system including all contributors of SO2 emissionsno e¤ective regulations to limit the SO2 emissions
Lu, Wu, and Yu (NUS, SCNU, HKU) Pollution Haven E¤ect? June 2012 7 / 41

Background on the National Environmental Policies
Regulation 1995-1998
the 1987 APPCL was amendedone chapter for air pollution caused by coal combustion and SO2emissionsregional strategy to control for pollution, TCZ
SO2 pollution control zone and acid rain control zone
Lu, Wu, and Yu (NUS, SCNU, HKU) Pollution Haven E¤ect? June 2012 8 / 41
Background on the National Environmental Policies
Criteria for TCZs
SO2 pollution control zone
average annual ambient SO2 concentration above the national Class IIstandard (0.06 mg/m3) in recent yearsdaily average ambient SO2 concentration above the national Class IIIstandard (0.25 mg/m3)SO2 emission is large
acid rain control zone
average PH value of precipitation below 4.5sulfate deposition above the critical loadSO2 emission is large
Lu, Wu, and Yu (NUS, SCNU, HKU) Pollution Haven E¤ect? June 2012 9 / 41

Background on the National Environmental Policies
New regulations in TCZs
desulfurization, dust-collecting facilities and other required equipmentinstalled for new thermal power plants, medium or large �rms withserious SO2 emissionsdesulfurization and dust-collecting measures taken for existingSO2-emitting plants
Timeline
National Environmental Protection Bureau (NEPB) started todesignate TCZ cities in late 1995NEPB sent the list to the State Council for approval in 1997The proposal was approved and put into e¤ective in 1998A total of 175 cities was listed as TCZ cities, 11.4% of the nationalterritory
Lu, Wu, and Yu (NUS, SCNU, HKU) Pollution Haven E¤ect? June 2012 10 / 41

Background on the National Environmental Policies
Lu, Wu, and Yu (NUS, SCNU, HKU) Pollution Haven E¤ect? June 2012 11 / 41

Background on the National Environmental Policies
E¤ects of the new regulation
in 2000, 102 cities in the TCZ achieved the national class II standard84.3% �rms designated as severely polluted �rms achieved theregulated level of SO2 emissionsaverage growth rate of SO2 emissions in TCZ between 2001-2006 was-6.5%till 2010, 94.9% cities achieved the national class II standard; no cityworse than the national class III standard
Lu, Wu, and Yu (NUS, SCNU, HKU) Pollution Haven E¤ect? June 2012 12 / 41

Background on the National Environmental Policies
Lu, Wu, and Yu (NUS, SCNU, HKU) Pollution Haven E¤ect? June 2012 13 / 41

Empirical Strategy
Assume for a city c at year t, we can observe two outcome values,Yct (1) and Yct (0)
Yct (.) the logarithm of FDIYct (1) the value when there is stringent environment regulation,determined by economic factors Xct
Yct (1) = αc + λt +X0ctβ (1)
Yct (0) the value when there is no environmental regulation
Yct (0) = Yct (1) + γ (2)
where γ > 0 for any PHE
The PHE is identi�ed as
�γct = E [Yct (1)� Yct (0)] (3)
average e¤ect γct = γ
Lu, Wu, and Yu (NUS, SCNU, HKU) Pollution Haven E¤ect? June 2012 14 / 41

Empirical Strategy
In the observational data, only one of fYct (0),Yct (1)g is observedUse TCZ policy as a natural experiment to conduct a DID analysis
De�ne the treatment status indicator TCZ as
TCZc =�1 if city c is a TCZ city0 otherwise
(4)
Lu, Wu, and Yu (NUS, SCNU, HKU) Pollution Haven E¤ect? June 2012 15 / 41
Empirical Strategy
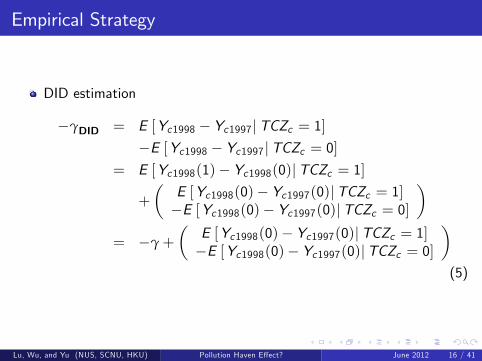
DID estimation
�γDID = E [Yc1998 � Yc1997jTCZc = 1]�E [Yc1998 � Yc1997jTCZc = 0]
= E [Yc1998(1)� Yc1998(0)jTCZc = 1]
+
�E [Yc1998(0)� Yc1997(0)jTCZc = 1]�E [Yc1998(0)� Yc1997(0)jTCZc = 0]
�= �γ+
�E [Yc1998(0)� Yc1997(0)jTCZc = 1]�E [Yc1998(0)� Yc1997(0)jTCZc = 0]
�(5)
Lu, Wu, and Yu (NUS, SCNU, HKU) Pollution Haven E¤ect? June 2012 16 / 41
Empirical Strategy
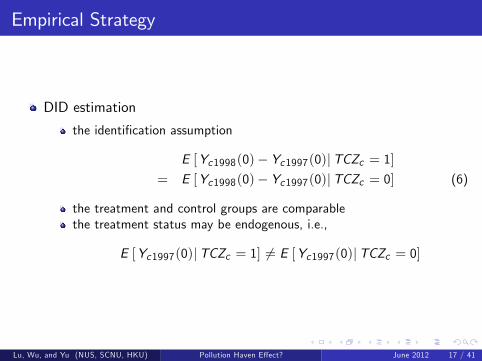
DID estimation
the identi�cation assumption
E [Yc1998(0)� Yc1997(0)jTCZc = 1]= E [Yc1998(0)� Yc1997(0)jTCZc = 0] (6)
the treatment and control groups are comparablethe treatment status may be endogenous, i.e.,
E [Yc1997(0)jTCZc = 1] 6= E [Yc1997(0)jTCZc = 0]
Lu, Wu, and Yu (NUS, SCNU, HKU) Pollution Haven E¤ect? June 2012 17 / 41

Empirical Strategy
DID estimation in regression form
Yct = αc + λt + γ � TCZc � Postt +X0ctβ+εct (7)
where
Postt =�1 if t � 19980 otherwise
(8)
Identi�cation assumption
E [∆εc1998jTCZc = 1,∆Xc1998,∆λ1998]
= E [∆εc1998jTCZc = 0,∆Xc1998,∆λ1998] (9)
Lu, Wu, and Yu (NUS, SCNU, HKU) Pollution Haven E¤ect? June 2012 18 / 41
Data
China City Statistical Yearbook, 1992-2009
Yct (logarithm): amount of realized FDIXct (logarithm): college students, high school students, telephone,GDP growth rate, taxi, road per capita, industrial production, retailingconsumption
O¢ cial document, "The o¢ cial reply of the State Council concerningacid rain control areas and SO2 pollution control areas"
list of TCZ cities
China Environmental Yearbook
SO2
Lu, Wu, and Yu (NUS, SCNU, HKU) Pollution Haven E¤ect? June 2012 19 / 41

Empirical FindingsTime Trends
Lu, Wu, and Yu (NUS, SCNU, HKU) Pollution Haven E¤ect? June 2012 20 / 41

Empirical FindingsBaseline
Lu, Wu, and Yu (NUS, SCNU, HKU) Pollution Haven E¤ect? June 2012 21 / 41

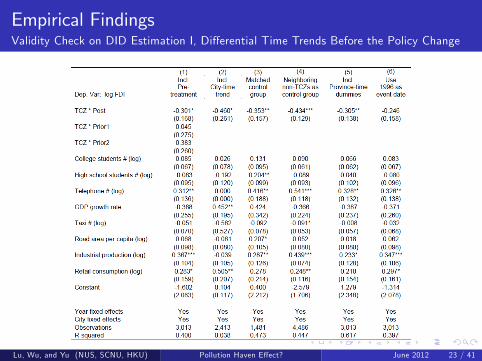
Empirical FindingsValidity Check on DID Estimation I, Di¤erential Time Trends Before the Policy Change
Check on whether the treatment and control groups are comparablebefore the policy change
E [∆εc1998�s jTCZc = 1,∆Xc1998�s ,∆λ1998�s ]
= E [∆εc1998�s jTCZc = 0,∆Xc1998�s ,∆λ1998�s ] (10)
for s � 1The corresponding regression speci�cation is
Yct = αc + λt + γ � TCZc � Postt+∑s�1 δs � TCZc � λ1998�s +X0ctβ+εct (11)
where
δs � δs+1 = E [∆Yc1998�s (0)jTCZc = 1]�E [∆Yc1998�s (0)jTCZc = 0] (12)
Lu, Wu, and Yu (NUS, SCNU, HKU) Pollution Haven E¤ect? June 2012 22 / 41
Empirical FindingsValidity Check on DID Estimation I, Di¤erential Time Trends Before the Policy Change
Lu, Wu, and Yu (NUS, SCNU, HKU) Pollution Haven E¤ect? June 2012 23 / 41

Empirical FindingsValidity Check on DID Estimation II, City-speci�c Time Trend
Cities in the treatment and control groups may follow di¤erent timetrends
decompose the �rst-di¤erenced error term into two parts,
∆εct = αc + ∆ε̃ct
the new identi�cation assumption is
E [∆ε̃c1998 jTCZc = 1,∆Xc1998,∆λ1998, αc ]
= E [∆ε̃c1998 jTCZc = 0,∆Xc1998,∆λ1998, αc ] (13)
The corresponding regression speci�cation is
Yct = αc + λt + γ � TCZc � Postt+αc � t +X0ctβ+εct (14)
Lu, Wu, and Yu (NUS, SCNU, HKU) Pollution Haven E¤ect? June 2012 24 / 41

Empirical FindingsValidity Check on DID Estimation II, City-speci�c Time Trend
Lu, Wu, and Yu (NUS, SCNU, HKU) Pollution Haven E¤ect? June 2012 25 / 41

Empirical FindingsValidity Check on DID Estimation III, Matched Control Group
Match each city in the treatment group with one in the control groupbased on
Wc92�97 (logarithm, 92-97 average): wage, population, GDP growthrate, college students, high school students, telephone, road per capita,valued added tax, industrial productionthe regression for the matching
ρc = Pr (TCZc = 1jWc92�97) = F (Wc92�97)
the new identi�cation assumption is
E [∆εc1998 jTCZc = 1,∆Xc1998,∆λ1998, ρ̂c ]
= E [∆εc1998 jTCZc = 0,∆Xc1998,∆λ1998, ρ̂c ] (15)
Lu, Wu, and Yu (NUS, SCNU, HKU) Pollution Haven E¤ect? June 2012 26 / 41

Empirical FindingsValidity Check on DID Estimation III, Matched Control Group
Lu, Wu, and Yu (NUS, SCNU, HKU) Pollution Haven E¤ect? June 2012 27 / 41

Empirical FindingsValidity Check on DID Estimation IV, Surrounding Cities
Use a TCZ citie�s all surrounding non-TCZ cities as the control group
similar conditions, like economic, climate, etcimprove the comparability between the treatment and control groups
Lu, Wu, and Yu (NUS, SCNU, HKU) Pollution Haven E¤ect? June 2012 28 / 41

Empirical FindingsValidity Check on DID Estimation IV, Surrounding Cities
Lu, Wu, and Yu (NUS, SCNU, HKU) Pollution Haven E¤ect? June 2012 29 / 41

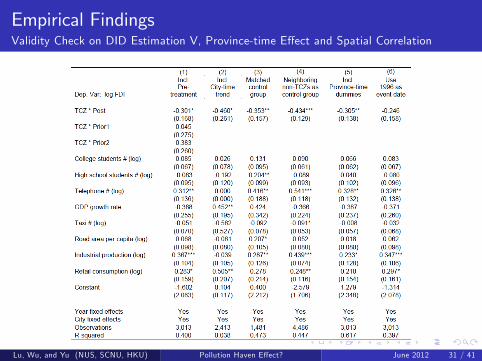
Empirical FindingsValidity Check on DID Estimation V, Province-time E¤ect and Spatial Correlation
Allow for any arbitrary time-varying provincial compounding factorsand also spatial correlation
the new identi�cation assumption is
E�
∆εc1998 jTCZc = 1,∆Xc1998,∆λ1998,∆λp1998�
= E�
∆εc1998 jTCZc = 0,∆Xc1998,∆λ1998,∆λp1998�(16)
the corresponding regression speci�cation is
Yct = λc + λt + γ � TCZc � Postt+λpt +X0ctβ+εct (17)
Lu, Wu, and Yu (NUS, SCNU, HKU) Pollution Haven E¤ect? June 2012 30 / 41
Empirical FindingsValidity Check on DID Estimation V, Province-time E¤ect and Spatial Correlation
Lu, Wu, and Yu (NUS, SCNU, HKU) Pollution Haven E¤ect? June 2012 31 / 41
Empirical FindingsValidity Check on DID Estimation VI, A Placebo Test: 1996 as the Year of Policy Change
The preparation of TCZ lists took more than 2 years since late 1995
potential expectation e¤ect
Check on the expectation e¤ect
re-de�ne 1996 (instead of 1998) as the year of policy changethe DID estimator is
�γ̄DID = E [Yc1996(0)� Yc1995(0)jTCZc = 1]�E [Yc1996(0)� Yc1995(0)jTCZc = 0] (18)
γ̄DID is expected to be zero
Lu, Wu, and Yu (NUS, SCNU, HKU) Pollution Haven E¤ect? June 2012 32 / 41

Empirical FindingsValidity Check on DID Estimation VI, A Placebo Test: 1996 as the Year of Policy Change
Lu, Wu, and Yu (NUS, SCNU, HKU) Pollution Haven E¤ect? June 2012 33 / 41
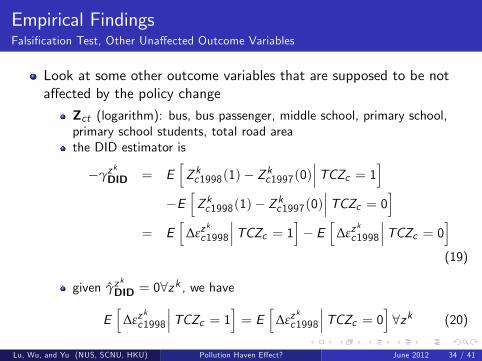
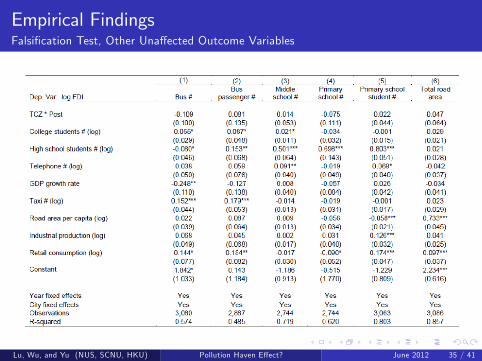
Empirical FindingsFalsi�cation Test, Other Una¤ected Outcome Variables
Look at some other outcome variables that are supposed to be nota¤ected by the policy change
Zct (logarithm): bus, bus passenger, middle school, primary school,primary school students, total road areathe DID estimator is
�γzk
DID = EhZ kc1998(1)� Z kc1997(0)
���TCZc = 1i�E
hZ kc1998(1)� Z kc1997(0)
���TCZc = 0i= E
h∆εz
k
c1998
���TCZc = 1i� E h∆εzk
c1998
���TCZc = 0i(19)
given γ̂zk
DID = 08zk , we have
Eh
∆εzk
c1998
���TCZc = 1i = E h∆εzk
c1998
���TCZc = 0i 8zk (20)
Lu, Wu, and Yu (NUS, SCNU, HKU) Pollution Haven E¤ect? June 2012 34 / 41
Empirical FindingsFalsi�cation Test, Other Una¤ected Outcome Variables
Lu, Wu, and Yu (NUS, SCNU, HKU) Pollution Haven E¤ect? June 2012 35 / 41

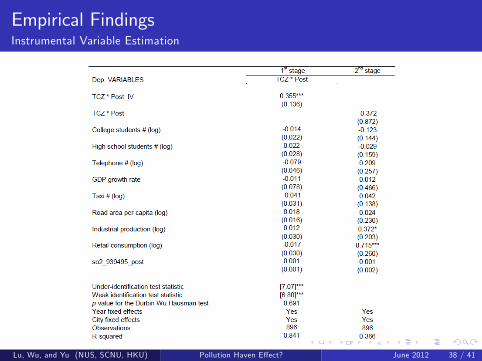
Empirical FindingsInstrumental Variable Estimation
The selection of TCZ is based on some criteria
SO2 � 60 for northern cities; PH � 4.5 for southern citiesinstrumental variable
TCZIV = I [Mc95 � m0 ] (21)
New identi�cation assumption is
E [∆εc1998j I [Mc95 � m0] = 1,∆Xc1998,∆λ1998,Mc95]
= E [∆εc1998j I [Mc95 � m0] = 0,∆Xc1998,∆λ1998,Mc95] (22)
based on past valuesspeci�c threshold
Lu, Wu, and Yu (NUS, SCNU, HKU) Pollution Haven E¤ect? June 2012 36 / 41

Empirical FindingsInstrumental Variable Estimation
Implementation issues
no PH informationonly 80 cities (about 30% of the total observations): capital cities,large and industrial cities
Remedies
use SO2 to replace PH (so2 dissolved in the water and precipitationbecomes acid rain)
Costs
low predicatory power of the instrument (irrelevance) and weakinstrumentseveral econometric tests on the relevance and weak instrumentDurbin-Wu-Hausman test on the comparison of OLS and IV estimators
Lu, Wu, and Yu (NUS, SCNU, HKU) Pollution Haven E¤ect? June 2012 37 / 41
Empirical FindingsInstrumental Variable Estimation
Lu, Wu, and Yu (NUS, SCNU, HKU) Pollution Haven E¤ect? June 2012 38 / 41

Empirical FindingsOther Robustness Checks
Use 1992-1995 as the Pre-treatment Period
Excluding four municipalities (Beijing, Chongqin, Tianjin, Shanghai)
municipalities have higher administrative levels than other cities
Excluding cities without information of FDI in year 1998
no post-treatment outcome value
Excluding cities without information FDI in the period of 1995-1997
no enough pre-treatment outcome value
Lu, Wu, and Yu (NUS, SCNU, HKU) Pollution Haven E¤ect? June 2012 39 / 41

Empirical FindingsOther Robustness Checks
Lu, Wu, and Yu (NUS, SCNU, HKU) Pollution Haven E¤ect? June 2012 40 / 41

Conclusion
Investigate whether there is a Pollution Haven E¤ect
Use a change in the environment regulation in China in 1998 as anatural experiment
DID estimation �nds signi�cant, negative PHE
the stringent regulation on SO2 emissions causes the amount of FDI todrop by 41%
Robust to a series of checks on the validity on DID estimation andother econometric concerns
Lu, Wu, and Yu (NUS, SCNU, HKU) Pollution Haven E¤ect? June 2012 41 / 41