Is there a home field advantage in global markets?
62
Is there a home field advantage in global markets? * Murali Jagannathan Binghamton University – SUNY [email protected] (607) 777-4639 Wei Jiao University of Wisconsin-Green Bay [email protected] (607) 232-6612 G. Andrew Karolyi Cornell University [email protected] (607) 255-2153 Abstract International equity mutual funds that hire managers from a country linked to the fund’s geographic mandate exhibit a strong bias to invest in stocks of that country. These funds with “home-biased managers” attract disproportionally more flows and reveal greater flow-performance sensitivity. Stocks domiciled in countries in which the fund has a home-field advantage outperform those held by other funds with investments in those same countries, but without home-biased managers. We interpret this new finding as evidence of an information-based channel through which the home-bias phenomenon may be revealed and we link it to theories that emphasize the role of an informational endowment advantage. Keywords: international mutual funds, home-bias, information endowment, mutual fund performance. JEL Codes: F32, F36, G11, G15, G23 This version: September 2018 _______________________ * We thank Warren Bailey, Matt Baron, Carina Cuculiza, Vihang Errunza, Miguel Ferreira, David Hirshleifer, Philippe Jorion, Alok Kumar, Sarah Khalaf, Hugues Langlois, Karen Lewis, Pamela Moulton, Veronika Pool, Sergei Sarkissian, David Schumacher, Devin Shantikumar, Sophie Shive, Oliver Spalt, Stijn Van Nieuwerburgh, Laura Veldkamp, Scott Yonker, Lu Zheng, and seminar participants at Binghamton University, Cornell University, UC-Irvine, 2016 FMA Annual Meeting, the 2018 Smokey Mountain Finance Conference, and the 2018 Magnolia Finance Conference for their comments. All errors are our own.
Transcript of Is there a home field advantage in global markets?

Is there a home field advantage in global markets?*
Murali Jagannathan
Binghamton University – SUNY
(607) 777-4639
Wei Jiao
University of Wisconsin-Green Bay
(607) 232-6612
G. Andrew Karolyi
Cornell University
(607) 255-2153
Abstract
International equity mutual funds that hire managers from a country linked to the fund’s geographic mandate
exhibit a strong bias to invest in stocks of that country. These funds with “home-biased managers” attract
disproportionally more flows and reveal greater flow-performance sensitivity. Stocks domiciled in countries
in which the fund has a home-field advantage outperform those held by other funds with investments in those
same countries, but without home-biased managers. We interpret this new finding as evidence of an
information-based channel through which the home-bias phenomenon may be revealed and we link it to
theories that emphasize the role of an informational endowment advantage.
Keywords: international mutual funds, home-bias, information endowment, mutual fund performance.
JEL Codes: F32, F36, G11, G15, G23
This version: September 2018
_______________________ * We thank Warren Bailey, Matt Baron, Carina Cuculiza, Vihang Errunza, Miguel Ferreira, David Hirshleifer, Philippe
Jorion, Alok Kumar, Sarah Khalaf, Hugues Langlois, Karen Lewis, Pamela Moulton, Veronika Pool, Sergei Sarkissian,
David Schumacher, Devin Shantikumar, Sophie Shive, Oliver Spalt, Stijn Van Nieuwerburgh, Laura Veldkamp, Scott
Yonker, Lu Zheng, and seminar participants at Binghamton University, Cornell University, UC-Irvine, 2016 FMA
Annual Meeting, the 2018 Smokey Mountain Finance Conference, and the 2018 Magnolia Finance Conference for their
comments. All errors are our own.

1
1. Introduction
Barriers to cross-border portfolio flows have been falling steadily over the past four decades and for
just about every country. Finance theory on international portfolio choice and asset pricing from as far back
as the 1970s pictured a globally integrated market in which assets have the same price regardless of where
they are traded and in which no finance is local (Black, 1974; Solnik, 1974, 1983; Stulz, 1981; Adler and
Dumas, 1983). These models predict that, in the absence of barriers, investors can benefit from diversifying
their portfolios by investing globally. In spite of the huge growth in global flows, the models are unable to
explain portfolio holdings, how they change over time, and specifically that investors overweight home
country securities relative to their weights in the global diversified portfolio, a phenomenon referred to as the
“home-bias puzzle” (Karolyi and Stulz, 2003; Lewis, 2011; and Cooper, Sercu, and Vanpée, 2013).
Explanations for the puzzle abound.1 Most argue that the gains from international diversification are
too small to make holding foreign assets worthwhile. The bias also extends to within a country, whereby
investors choose to invest in firms that are geographically close (French and Poterba, 1991; Coval and
Moskowitz, 1999; Seasholes and Zhu, 2010; Pool, Stoffman, and Yonker, 2012). One oft-cited reason for a
home bias is that the investors are informationally disadvantaged in stocks away from home. But evidence in
support of it is typically indirect and too few papers seek to identify a mechanism through which the
informational advantages of home-bias may be revealed.
Pinning down one such information-based mechanism is the goal of our paper. Our experiment
concerns the holdings of active U.S. mutual funds with global mandates. We uncover a new finding: a
surprisingly large fraction of these funds is managed by individuals who grew up outside the United States.2
On average, the fraction is 28% and it is steadily rising. Nearly 80% of the foreign-born managers lead funds
with a geographic mandate that includes their respective home countries. We find that such managers exhibit
a strong bias to invest in their home countries and we explore motives for, and consequences of, this
overweighting of home country stocks relative to other managers with similar mandates. We refer to the
1 Adler and Dumas (1983) and Cooper and Kaplanis (1994) consider the role of real exchange rate risk. Baxter and Jermann (1997), Baxter, Jermann,
and King (1998), Jermann (2002), Glassman and Riddick (2001) emphasize the importance of country-specific idiosyncratic risks related to non-
tradeable goods, like human capital. Gehrig (1993) and Van Nieuwerburgh and Veldkamp (2009, 2010) focus on asymmetric information between domestic and foreign investors. Errunza, Hogan, and Hung (1999) offer that home-made alternatives to foreign assets are readily available. Dahlquist,
Pinkowitz, Stulz, and Willamson (2003) and Stulz (2005) argue the presence of large, controlling shareholders deter foreign minority investors. 2 In comparison, the fraction of other U.S. equity funds with foreign managers is small. See, for example, Kumar, Niessen-Ruenzi, and Spalt (2015).
They document that less than 5% of all U.S. mutual funds (including international equity funds) have managers with foreign sounding names.

2
managers from a country linked to the fund’s geographic mandate as “home-biased managers” and the funds
they manage as “home-biased funds.”
An important motivation for our effort is the theoretical model of Van Nieuwerburgh and Veldkamp
(2009) which models how investors face a choice in deciding about which assets to acquire information when
there are multiple risky assets in their investment opportunity set. Investors who have a comparative advantage
in learning about their domestic assets choose to invest in them disproportionately, by which the authors
rationalize the home bias puzzle. But, even as information about foreign markets improves with globalization,
their model rationalizes how small initial information endowments with regards to a given foreign market can
lead investors to exert more effort in acquiring additional information about it, thus magnifying their
comparative advantage. This key prediction can explain why the home bias persists over time. In our setting,
home-biased managers are naturally endowed with the advantage of obtaining company-related news and
financial statements in their native country. It may lead them to invest more time and effort in developing their
informational advantage about local investments over time. They may also have a better understanding of the
macroeconomic and capital market environments and about specific companies in their home country. Further,
investors could perceive that such managers are privy to information obtained from their cultural links. And
the perception of an informational advantage may result in higher flows to home-biased manager funds.
Of course, investors may still prefer to invest with home-biased managers even in the absence of any
perceived informational advantage. Gennaioli, Shleifer, and Vishny (2015) model “trust (in the manager) as
reducing the (investor’s) utility cost of taking risk, much as if it reduces the investor’s subjective perception
of the risk of investments… Managers may have knowledge of how to diversify or even ability to earn α, but
in addition, they provide investors peace of mind.” Gurun, Stoffman, and Yonker (2017) document how
investment advisers providing services that build trust with clients were able to avoid the large withdrawals
faced by other investment advisors after the revelation of Bernie Madoff’s Ponzi scheme in 2009. While it is
difficult to identify origins of trust, Kumar, Niessen-Ruenzi, and Spalt (2015) show that fund flows are related
to the manager’s foreign sounding name, suggesting that investors consider the geographic origin of the
managers when choosing a fund. If an investor is more likely to trust the portfolio manager who grew up in
the region of the fund’s geographic objective, we would expect significantly more fund flows to the mutual

3
funds managed by them. Since performance is not a primary driver behind the trusting investors’ choice of
funds, fund flows may very well not respond to the home-biased manager’s performance.
Others suggest that home-bias arises due to familiarity with the market and not necessarily because
the investors have superior information or because managers warrant client trust. Grinblatt and Keloharju
(2001) show how a firm’s culture and language are important attributes of familiarity and the reason why
investors choose local stocks. Cao, Han, Hirshleifer, and Zhang (2011) model familiarity bias as an investor
choice for the status quo option when making decisions under uncertainty. Similarly, Karolyi (2016)
conjectures that greater cultural distance may be associated with unfamiliarity, which, in turn, may lead to
economic decisions in which risk is reduced by investing less. The evidence in Chan, Covrig, and Ng (2005)
and Pool, Stoffman, and Yonker (2012) are supportive of the familiarity explanation. Applied to international
fund managers, the explanation suggests that home-biased fund managers will invest in stocks from the
country in which they grew up for familiarity reasons. But it may not result in superior performance or higher
client fund flows. Of course, there are other reasons why home-biased funds may not have superior
performance. Mutual funds may hire home-biased managers to “window dress” poor past performance, even
when they are aware that the managers do not have an informational advantage. It is also possible that home-
biased managers falsely believe geographic proximity brings an informational advantage about their home-
country companies; but they then end up choosing less diversified portfolios that underperform.
To evaluate the validity of the trust, familiarity, and information hypotheses, we examine the holdings,
fund flows, flow-performance sensitivity, and performance of actively-managed U.S. international equity
funds with home-biased managers. The trust hypothesis suggests higher mutual fund flows, and lower
sensitivity of the fund flows to performance for home-biased funds, but it makes no prediction regarding their
performance or even of any actual home-bias in the portfolio holdings. The familiarity argument predicts that
managers will invest locally, but suggests no abnormal performance let alone unusual fund-flows. The
information hypothesis suggests home-biased mangers will have a home-country bias in their investment
holdings, will attract more fund flows, and will exhibit superior performance, overall and especially from the
home-biased stocks of countries of domicile they hold.
An important element of our identification strategy is the definition of a home-biased manager. We
associate the country in which the manager received his or her undergraduate degree as the manager’s home

4
country. We define a manager of a fund as home-biased if their investment mandate of that international fund
includes her home country. These data on education are obtainable in the management profiles in
Morningstar’s mutual fund reports. Of course, no identification approach is perfect. We acknowledge
limitations of using the country of undergraduate degree as the manager’s home country. It is possible that the
manager’s country of birth, residence, or citizenship differs from the country in which she got her
undergraduate degree. And an information advantage may arise from many other means than from having
studied at that university. But, using the country of birth, of residence, or of citizenship also have limitations
in measuring what might lead to “home-bias” in international investments.
To evaluate the extent of home bias, it is also important to identify the geographic objective of the
fund. We make active use of Morningstar categorizations for this purpose. The geographic objective of a fund
may be specific to a country (e.g., Japan), be broader to include a set of countries in a region (e.g., Asia-
Pacific), or represent most generally all global markets. The differences in the scope of the objectives further
allow us additional experimental variation to assess the “salience” or “intensity” of the potential informational
advantage for the home-biased manager fund. It will be especially useful for the arguments relating to the
overweighting of home-country stocks by home-biased managers and to fund flows. First, the home bias in
the manager’s portfolio can be more easily observed if the fund objective is more global rather than country-
specific, since the manager will then have more leeway on which country to invest. Second, if investors prefer
home-biased managers because of their local knowledge, we expect the fund flow or performance advantage
to home-biased funds to be more noteworthy for country funds relative to regional funds and global funds.
The home bias of home-biased managers is economically large. Home-biased managers of global
funds invest about 14% more equity assets in their home-country stocks than their peer managers with similar
mandates. Surprisingly, the overweighting is even more pronounced for regional (22%) and country (30%)
funds. The home bias is more significant among home-biased managers from emerging-market countries, and
from countries with greater corporate opacity, with weaker disclosure standards, and for those culturally more
distant from the United States. We view this first key finding as consistent with the notion in Van
Nieuwerburgh and Veldkamp (2009) - that language and culture are important components of an information
endowment, especially in poor information quality environments.

5
Investors appear to respond to the home bias. Home-biased funds attract significantly more flows than
other funds with similar fund objectives. Country funds with home-biased managers attract, on average, 7.92%
higher fund flows per year. To refine the identification strategy further, we examine the relation between
home-biased fund managers and fund flows around home-biased-fund manager turnover events. After a new
home-biased manager is hired, we find fund flows significantly increase in the next two quarters relative to
the other manager hires. A weaker receding of fund flows arise following home-biased manager departures.
Another interesting facet of fund flows is how it responds to recent fund performance. In Gennaioli,
Shleifer, and Vishny (2015), the trusted manager’s incentives to generate alpha is moderated by the incentives
to pander to investor biases. If home-biased managers are trusted by their clients, this argument suggests the
clients’ decisions to invest with the fund may be less dependent on the managers’ performance. On the other
hand, if investors have priors that home-biased managers have an informational advantage, even a modest
amount of abnormal performance can confirm their priors and lead them to invest more in the fund. So, we
examine the incremental sensitivity of fund flows to fund performance for home-biased funds. We find the
flow-performance sensitivity is significantly higher, not lower, for home-biased funds. Overall, the evidence
is inconsistent with what we expect if home-biased managers are simply trusted more by their investors.
We next investigate the relative performance of home-biased funds. If home-biased managers have
an informational advantage, it should be reflected in superior fund performance. While performance can be
measured at the fund level, it is probably more informative to measure the performance of the components of
the home-biased manager’s portfolio related to her country of domicile. We measure both. At the fund level,
we construct a long-short fund-of-funds portfolio that buys all funds with home-biased managers and sells all
funds without home-biased managers, and we compute alphas and factor loadings relative to Fama and
French’s (2012, 2017) international three- and five-factor models plus a momentum factor. The results reveal
superior performance by home-biased managers of regional and country funds, but the evidence is weaker for
global funds. To assess the performance of the home-biased manager’s specific home-country portfolio, we
create as-if calendar-time portfolios that mimic the allocation of the mutual fund in a home-biased manager’s
home country stocks relative to stocks from the same country held by non-home-biased funds in the same
category. We find positive and significant alphas for global, regional, and country funds. These are admittedly

6
imperfect measures of performance given the coarseness of holdings data. But the evidence points reliably to
positive abnormal returns for home-biased funds.
There are two potential interpretations of the performance results. On one hand, they suggest home-
biased managers do have an informational advantage regarding their home-country stocks, which is our
maintained hypothesis. Alternatively, superior performance reflects a home-biased fund’s ability to attract
superior managerial talent from around the world. To disentangle these two sources of abnormal returns, we
drill down to examine the performance of the component of a home-biased manager’s portfolios related to
stocks outside their home country. If the returns are reflective of a manager’s overall skill rather than their
home-country informational advantage, we should observe that home-biased managers’ non-home-country
portfolio also produces similar abnormal returns to their home country portfolio. In fact, we find weak
evidence of abnormal performance of the non-home-country portfolios. But the magnitude of abnormal returns
is about half of that of their home-country portfolios. We interpret the performance results as further
affirmation of the informational advantage interpretation: not only are home-biased funds able to attract
superior talent, but they also hire home-biased managers with an informational advantage.
Our findings imply that the home country of the portfolio manager is an important mechanism through
which the home bias can be revealed in the international asset management industry. The evidence supports
the model of Van Nieuwerburgh and Veldkamp (2009). Locals endowed with a natural advantage of local
customs appear to have significant informational advantages when investing in local stocks. Even though
foreigners are free to learn about the stocks, they do not wrestle the advantage completely from local investors.
We let the results dictate whether home-biased fund managers reveal an informational advantage about local
markets. Many papers in the literature are not agnostic. Some assume that local investors have superior
information (Brennan and Cao, 1997) while other studies assume they are able to better interpret public
information signals (Dumas, Lewis, and, Osambela, 2017) regarding companies close to home. If true, then
our paper’s findings offer up a means by which distant investors can at least partially neutralize the benefit of
being close to the companies – that is, by hiring managers with that local expertise.
In the last part of the paper, we explore why not all funds choose a home-biased manager if there are
significant benefits to hiring them. We first document that there are significant selection effects in matching
funds with home-biased managers and part of the higher alphas that we find can be attributed to these selection

7
effects. We conjecture that the limited pool of qualified managers from which the funds could hire from may
be the reason why we do not observe more funds with these managers.
Our paper contributes new evidence to the literature on how mutual funds invest internationally.
Recent papers suggest that funds may utilize industry related knowledge to make investments. Schumacher
(2017) documents that funds invest internationally in industries that are large in the domestic market. Cici et
al. (2014) examine whether the prior industry experience of a manager helps them pick securities in that
industry. They find that the stocks that they pick from the industry perform better than the other stocks in their
portfolio, consistent with the persistence of their initial informational advantage. A few papers document
evidence consistent with the informational advantage of home-biased investors. Choe, Kho, and Stulz (2005)
find that domestic investors have an edge over foreign investors on what they pay for large trades in Korea.
They conclude foreign investors do not have an information advantage over domestic investors. Grinblatt and
Keloharju (2000) find the opposite: foreigners are able to invest profitably when compared to local investors.
Unlike these papers, our paper is able to focus on the mechanism by which foreign investors may be able to
capture the advantage of domestic investors – by hiring home-biased managers.3
Other important studies evaluate the performance of U.S. and global institutions with international
mandates. Busse, Goyal, and Wahal (2014) find that the international mutual funds do not generate positive
alphas. Our emphasis in this paper is not on overall international mutual fund performance, but to compare
holdings and performance of home-biased versus other funds. There exists a larger international institutional
investor literature that examines issues related to foreign international ownership in a country. For example,
Ferreira and Matos (2008) examine the determinants of foreign institutional holdings. Cremers et al. (2016)
find that local institutions outperform foreign institutions in countries with low investor protection. Karolyi,
Ng, and Prasad (2016) focus on country biases in foreign holdings among the growing number of institutional
investors from emerging markets relative to those based in developed markets. Luo (2017) documents that
global funds cater to the retail investors’ home bias by overweighting the countries in which the fund is
available for sale. Choi et al. (2017) find that returns to domestic institutions are higher when their portfolios
are more concentrated, consistent with local informational advantage in international investments. We focus
3 It is possible that the foreign investors in Grinblatt and Keloharju (2000) are international mutual funds that hire local managers to make investments.
Coval and Moskowitz (2001) find evidence of abnormal returns in stocks that are located close to the fund’s U.S. headquarters. Similar evidence is
provided by Teo (2009) for hedge funds and by Sialm, Sun, and Zheng (2014) for funds of hedge funds. Our identification, instead, is based on the background of the manager.

8
on investors from a single-country investing worldwide and the effect of manager characteristic of “home-
bias” on fund flows and performance. On this dimension, our paper is probably closest in spirit to Pool,
Stoffman, and Yonker (2012) who examine whether managers of U.S. equity funds overweight their home
state’s stocks according to the state in which the manager first obtained her Social Security Number for
employment. Unlike our paper, they do not find that the home stocks in which they invest disproportionately
outperform, possibly because the salience of an informational advantage arising from understanding the
language, customs, and the economic environment may be more significant in the international setting.
2. Data and sample construction.
We obtain data from multiple sources. Information on U.S. international fund managers is obtained
from Morningstar mutual fund reports, which furnish the name of each manager for a fund (including
individuals on team-managed funds), their start and end dates of employment with the fund, their educational
background, and work experience. Morningstar is also our source for fund returns, equity holdings, and other
fund level characteristics. Stock returns data is obtained from Thomson Reuters Datastream International and
the Center for Research on Security Prices (CRSP). Financial information is obtained from Thomson Reuters
Worldscope and Compustat.
Our sample is limited to actively-managed U.S. based international mutual funds, obtained by filtering
observations using Morningstar style categories as well as by manually screening fund names. The sample
contains the following Morningstar categories: World Stock, Foreign Large Blend, Foreign Large Growth,
Foreign Large Value, Foreign Small/Mid Blend, Foreign Small/Mid Growth, Foreign Small/Mid Value,
Diversified Emerging Markets, Diversified Pacific/Asia/ Pacific/Asia excluding Japan stocks, China Region,
India Equity, Japan Stock, Europe Stock, and Latin America Stock. The sample is further limited to funds for
which we can obtain information from Morningstar regarding the country where the fund managers earned
their bachelor’s degrees. The final sample has 24,422 quarterly fund observations with 1,090 unique funds
managed by 1,855 unique managers from 1991 to 2014.
We organize the Morningstar categories into three groups based on the breadth of the geographic
objective: Country funds, Regional funds, and Global funds. Panel A of Table 1 shows how we group the
Morningstar fund categories into these three groups. Funds in the China Region, India Equity, Japan Stock,

9
Europe Stock, or Latin America Stock are grouped as “Country funds.” All of the Country funds along with
the following Morningstar categories form the “Regional funds” group: Diversified Emerging Markets,
Diversified Pacific/Asia/ Pacific/Asia excluding Japan stocks. Finally, the Global fund category includes all
international mutual funds, including the country and regional funds described above. The table reports that
there are, on average, 254 international funds that have viable data in a given quarter during our sample period.
The $918 million in total net assets (TNA) for the Foreign Large Value category (26 funds) well exceeds the
overall average of $623 million in TNA across all funds.
A fund manager is considered a home-biased manager if the fund’s geographic objective encompasses
the country where the fund manager earned the bachelor’s degree (e.g. a China region fund managed by a fund
manager who graduated from a Chinese University). Consider the examples in two screenshots from
Morningstar presented in Appendix A. The Lazard International Equity fund (LZIEX) lists eight managers
including the deputy chairman of Lazard Asset Management, including two with degrees from Australia and
Ireland, which are part of the fund’s international mandate. Of the five managers listed on Franklin’s India
Growth A fund (FINGX), four have university degrees from India. In Panel A of Table 1 measures of home-
biased managers by Morningstar category are exhibited. Nearly 28% of the U.S.-based international mutual
funds have at least one home-biased manager. The Global funds have a smaller fraction with home-biased
managers than Regional funds. There is, however, large variation in this fraction of home-biased managers
among Country funds. For example, the India Equity Funds have the highest fraction of home-biased managers
at 62%, whereas the Latin America Stock funds have nearly the lowest fraction at 16%. The category with the
lowest proportion managed by home-biased managers is that of Diversified Emerging Markets with an average
percentage of 15%. Team managed funds, which dominate among Global and Regional funds, have a
relatively higher percentage of funds with home-biased managers (39%) compared to the percentage of single
manager funds (24%).
In Panel B of Table 1, we report summary statistics of the fund-specific variables, categorized by the
three geographic groups that we had defined earlier. Within each category of funds, we report the fund and
manager characteristics in three columns: those for which there is the presence of at least one home-biased
manager on the portfolio management team, those for which the team has a majority of home-biased managers
(a subset of the first category), and those that are unbiased among managers. We report t-statistics of the simple

10
differences of those time-series averages for the characteristics between the first and third category. For each
group of Global, Regional and Country funds, funds with home-biased managers are relatively larger, although
the differences are magnified for the Regional and Country funds. The funds with home-biased managers also
appear to have lower fund return volatility, charge lower fees, have a lower turnover ratio, and hold fewer
stocks in their portfolios compared to unbiased funds.
Panel C exhibits the breadth of coverage across countries where the home-biased managers obtained
their undergraduate degrees. Figure 1 illustrates this using a map of the world with the radius of a circle
indicating the number of unique managers who are from a given country. There is a wide dispersion in the
home countries of the managers represented, but there is a significant concentration in the United Kingdom
(222 managers, 177 of which are home-biased). Our sample consists of 1,855 managers from 40 countries;
529 of the managers received their undergraduate degrees outside the United States, and 422 are home-biased.
The prevalence of funds with home-biased managers has grown over time. Figure 2 exhibits time-
series plots of the percentage of funds and the raw count of the number of home-biased funds and does so for
all funds as well as seven different sub-categories of funds. The plot for all funds shows that the number of
home-biased managers was less than a dozen in the early 1990s and the count has increased to as many as 220
by 2014, the last year of our sample. The percentage has grown from around 20% back in the early 1990s and
now exceeds 30%. The pace has been slower among some fund categories; the percentage has actually
declined among Japan and Europe Stock funds. The interest in hiring home-biased managers in India Equity
funds occurred in the late 1990s and only after 2002 for China Region funds.
3. Home-biased holdings of home-biased managers.
The growth in the number of managers hired from countries where the fund has a mandate to invest
suggests that they are being hired to invest in those countries. In the set of tests described below, we investigate
whether the managers exhibit a preference toward investing in their home country securities.
We first perform empirical tests using fund portfolio country weights. The dependent variable is the
equity portfolio weight a fund allocates to all firms domiciled in a country during a quarter, what we call wi,c,t
for fund i associated with country c in quarter t. The main variable of interest is the fraction of managers in
the team who are home-biased managers with respect to the particular country of interest. We denote this
11
measure as HBMgri,c,t - the fraction of home-biased (HB) managers (Mgr) in fund i for its allocation to country
c in quarter t (we will call it the “fraction country biased”). Consider as an example a world stock fund in a
quarter that has three managers on its team - one is from Canada, a second from Brazil and the third from the
U.S. – and that invests 40% in Canada, 30% in Brazil, 20% in Japan, and 10% in the U.S. In this case, wi,c,t
equals [40%, 30%, 20%,10%] and the corresponding HBMgri,c,t equals [33%, 33%, 0%, 0%] for that fund and
quarter. This variable measures home-bias separately by the country in its mandate. Of course, a fund can have
home-biased managers with respect to multiple home countries.
If home-biased managers tilt their portfolios toward their home countries, then we should observe a
positive coefficient estimate on fraction country bias. The mean (standard deviation) of HBMgr in our sample
is 0.0092 (0.0822). In Figure 4, we exhibit the countries with significant home bias from left to right. Among
Global funds, managers from Japan overweight their home-countries the most acutely. There is also a
significant bias in investing in home country stocks by managers from Brazil, Hong-Kong, China, and India.
The overweight estimates by year are presented in Panel B of Figure 4. While there is variation over time, the
estimates are always positive, suggestive of persistent home-bias of the overall group of home-biased
managers. We do not perceive any time-trend.
For our formal tests, we include fund characteristics as controls. Table 2 presents the coefficient
estimates and key regression diagnostics. On average, a global fund in our sample allocates about 5.1% of its
assets toward stocks from one country. This is the constant in the Model (1) in which the specification has no
fixed effects. The weights that home-biased managers place in stocks domiciled in their home countries are
considerably larger. For Global funds, the coefficient of HBMgrict is about 14%, which implies home-biased
managers place 14% more of their investible assets on stocks from their home countries. This is the simple
average of coefficients across Models (1) to (4) featuring different specifications. The overweight is
statistically significant and economically meaningful. It is even stronger when we limit our sample to Regional
funds (about 22% overweight) or Country funds (about 30% overweight). In Models (2), (3) and (4), we
control for various fixed-effects. In Model (2), we control for category×quarter fixed effects, and in Model (3)
we control for fund fixed effects. With fund fixed effects, the importance of fund-level controls becomes
insignificant as expected, but the home-bias overweight coefficient remains of the same magnitude. We also
choose to oversaturate our specifications with country×quarter fixed effects in Model (4) to alleviate the

12
concern that certain country characteristics drive the overweighting. The coefficient of HBMgrict remains
largely unchanged. Overall, there is a reliable bias towards investing in the manager’s home-country stocks
even after controlling for unobservable time-varying and category-, country-, or fund-specific common factors.
We further explore whether the heterogeneity across countries in the accessibility of local information
affects the overweighting. We take binary cuts of the data using a variety of country-level measures of
information quality - emerging versus developed markets, countries with high versus low levels of corporate
opacity, with high versus low scores on mandated corporate disclosures, and with high versus low cultural
distance from the U.S. We use the Disclosure index from the World Bank’s World Governance Indicators; it
measures the extent to which investors are protected through disclosure of ownership and financial information.
The index ranges from scores of 0 to 10 with higher values indicating more disclosure. Cultural distance is the
Euclidean distance computed based on the six cultural dimensions proposed in the book by Geert Hofstede
(2001). Corporate opacity is classified using the composite index of Karolyi (2015, Chapter 7), which is
available by year back to 2000. High and low values are determined using median cutoffs for the index. The
fewer number of stocks held by mutual funds in more informationally opaque countries leads to significantly
different subsamples. The results for Global funds are presented in Table 3. We find that the overweighting is
typically much stronger among home-biased managers who originate from emerging-market countries,
countries with high levels of corporate opacity, countries with poor disclosure standards, or countries that are
more distant culturally from the U.S. These results indicate a home-biased manager’s informational advantage
toward local investments is more significant in informationally weak environments.
While we interpret the above results as indicative of the manager’s preference to invest in home
country stocks, we need to consider the possibility that the causality may run from the fund to the manager. It
is possible that funds with a preference to invest in particular countries hire home-biased managers. One
natural way to examine the possible direction of the causation is by examining changes in country weights
around turnover events for these home-biased managers. When home-biased managers are appointed (and
when they depart a team), we can compare the changes in the fraction invested in the home countries of newly
appointed home-biased managers relative to the fraction invested in the same countries prior to their
appointment (departure). We also examine the differential effect of the hiring and resignations of home-biased
managers on the allocation to their home countries.

13
Panel A of Table 4 reports the average holdings around manager hiring and departure events. We
calculate the overweight as the actual portfolio weight in the managers’ home countries less the corresponding
category average weight in the same countries at the same time. Before home-biased manager departures,
funds on average overweight the home-country stocks of the managers by about 1.59%. Following that home-
biased manager’s departure, the funds no longer overweight the home-country stocks of the managers (0.31%).
There is no significant underweighting of the new managers’ home countries before the hiring of home-biased
managers (0.19%), but stocks from new managers’ home countries are overweighed by 1.96% after the
appointments. These differences are statistically significant (last column). The above result indicates that the
overweighting is a result of the exposure to the home countries of the managers. To confirm that this is not
due to omitted factors, we repeat the analysis using what we call “pseudo” turnover dates. For this purpose, a
random turnover date is chosen after excluding the first and last two quarters of a fund and the four quarters
before and four quarters after the actual manager turnover date. With pseudo turnover dates (Table 4, Panel
B), we do not find significant changes in the portfolio weights of former home-biased managers’ home country
stocks or the new home-biased managers’ home-country stocks, supporting our earlier conclusion that home-
biased managers choose to overweight their home country stocks.
There is considerable evidence that manager turnover events are not exogenous (among others, see
Fee, Hadlock, and Pierce, 2013). Funds that have decided to overinvest in particular countries may
strategically choose to hire managers from those countries. While this also suggests that funds are hiring them
for their local informational advantage, the direction of the causality for the home-bias is less clear. To address
this issue, we crudely consider all turnover events without negative prior performance as quasi-exogenous
events as they are more likely be due to retirements or voluntary departures for other jobs. The results (shown
in our internet appendix) remain unchanged when we only use this subset of turnovers.
The overweighting of home country stocks may be due to the home-biased manager’s informational
advantage regarding local investments, or it may be because they are most familiar with those stocks. If
investors perceive that it is due to the managers’ informational advantage, we should be able to observe that
home-biased managers attract more flows. We examine this in the next section.

14
4. Fund flows of home-biased managers.
We begin our analysis by testing whether home-biased funds attract relatively more fund flows than
unbiased funds. In Table 5, we present results from panel regressions of monthly fund flows on the manager’s
home bias. In the reported tables, we use two measures of home bias at the fund level. First, we use a home-
biased fund dummy to indicate the presence of at least one home-biased manager on the management team.
Second, in order to capture the intensity of home-bias as a treatment, we use the fraction of home-biased
managers in the team as our alternative measure of home bias. We have also attempted to use an indicator
variable when all of the fund managers are home-biased. Since the results are similar to the results using the
first variable mentioned above – the presence of a home-biased manager, we do not report results using this
variable separately. The home-biased manager measures are at the fund-quarter level and so differs from the
fund-country-quarter level home-biased measure we used for the overweighting tests above. The regressions
include the standard variables used in the literature to predict fund-flows: fund size, fund return, fund return
squared, fund risk, expense ratio, turnover, fund age, number of managers in the management team, and
manager work experience. In addition, we also consider lagged monthly fund flows as an independent variable
to alleviate concerns regarding fund-specific omitted variables that may be related to flows. When we exclude
the lagged monthly fund flow, we use fund category and year fixed effects or category×year fixed effect.
As can be expected from prior literature, fund flows are positively related to past performance as
captured by both fund returns and returns squared. Fund risk in terms of the trailing twelve months of monthly
fund return volatility as well as turnover are negatively related to flows. Fund flows also diminish with a
fund’s age, as previous research has shown. There is no empirical link between fund size and flows, except
among the Country funds and it is negative. Similarly, we find no reliable evidence that flows are correlated
to expense ratios or the number of managers on the portfolio team (Patel and Sarkissian, 2017).
Importantly, we find that the coefficient on the home-biased fund dummy is significantly positively
related to fund flows for all fund groups and specifications. The magnitudes of the estimates also increase as
the breadth of the geographic objective becomes narrower (from Global to Regional and then to Country
funds). These estimates are also large in economic magnitudes. The coefficient of 0.0066 among Country
funds in Model (5), for example, implies annual fund flows are 7.92 percentage points higher for a fund that
is managed by pure home-biased managers, which is meaningful compared to the mean fund flow of 8% per

15
month. In the last three columns of Table 5, we focus exclusively on funds with home-biased managers and
use the fraction of home-biased managers as the variable of interest. We think of this as a test of the intensive
margin rather than of the extensive margin in Models (1) to (5). The coefficients on the fraction of home-
biased managers are positive but not reliably different from zero. Conditional on having a home-biased team
member, having more home-biased managers on the team does not necessarily lead to even higher fund flows.
One interpretation of these findings is that investors prefer funds with home-biased managers. An
alternative interpretation is that funds that attract more flows when they invest in certain countries prefer to
hire managers from that country. As with our examination of overweighting in the previous section, we address
causality by examining changes around the turnover events for these home-biased managers. When home-
biased managers are appointed (and when they depart a team), we can compare the changes in fund flows in
event time around the home-biased managers’ departures (new appointments) to changes in fund flows around
manager appointments (departures) where there is no change in home-bias managers. We first use a difference-
in-difference analysis to compare fund flows around different types of turnover events (rather than comparing
home-biased manager turnover with all other fund months) to potentially control for omitted variables that
drive fund manager turnover events, in general. We also examine the differential effect of the hiring and
resignations of home-biased managers on fund flows.
Table 6’s Panel A presents the results from four regression specifications of fund flows around
manager actual turnover events. The regressions only include the 12 months prior and 12 months after the
turnover. We run regressions for home-biased manager hiring and home-biased manager resignations
separately. The dependent variable in the regressions is fund flows per month. We define a dummy variable
for post turnover months, which takes the value one for the 12 months after turnover and zero for the 12 prior
months. We then create a dummy variable for home-biased manager hiring that equals one when a fund with
no home-biased managers hires a home-biased manager (29 events) and zero for other turnover events
involving unbiased managers. The benchmark set includes 521 instances in which funds without any home-
biased managers in a previous quarter hire at least another new similarly non-home-biased manager this
quarter. We also define a dummy for home-biased manager departures, which equals one when a fund with
an entire team of home-biased managers in a quarter is replaced by an entire team of non-home-biased
managers in the following quarter (28 instances). The benchmark set of 1,653 events involve funds without

16
any home-biased managers replacing at least one other non-home-biased manager in a given quarter. The main
variable of interest is the interaction term between home-biased manager hire (or departure) dummy and the
post-turnover dummy. A positive (negative) coefficient suggests that the hiring (departure) of a home-biased
manager results in differentially higher (lower) fund flows during the following months. We use the same
control variables that we have used in Table 5 for monthly fund-flows across all the whole sample.
The coefficient of the interaction term is significantly positive after the new home-biased manager
hiring, consistent with home-biased managers attracting more flow. In the first specification reported as Model
(1), the coefficient on the interactive dummy variables between the New home-biased fund and Post turnover
of 0.0239 is reliably positive statistically and implies that the positive fund flows we observed in Table 5
indeed occurred in the months following the home-biased manager’s hiring. The corresponding coefficient in
the departures specification of Model (2) is negative at -0.0486 with a t-statistic of -1.97. This finding implies
fund flows decline when home-biased managers leave the fund.
We also conduct the analysis by only focusing on the hiring and resignations of home-biased managers
and include fund fixed effects in the regression. These findings are shown in Models (3) and (4), respectively.
The important difference here is that the tests do not benchmark against turnover events involving non-home-
biased managers. That is, these are pure time-series tests of Post- compared to Pre-turnover events.
Interestingly, the find the magnitudes of the impact of hiring and resignations of home-biased managers on
fund flows are very similar to the ones based on the difference-in-difference analysis. These results indicate
that the hiring and resignations of home-biased managers have a sizable impact on fund flows.
As with our analysis of portfolio weights, we push this event-time analysis one step further by
performing counterfactual tests using pseudo-turnover dates. Pseudo-turnover events (with an associated 24-
month horizon) are randomly drawn from the history of a given fund in which no turnover event took place.
We do this for turnover events associated with home-biased manager hirings and departures as well as for
non-home-biased manager hirings and departures. Fund flows should not react to the appointments and
departures of home-biased managers based on the pseudo-turnover dates. To make sure the results associated
with pseudo-turnover dates are not contaminated by the actual turnover dates, we choose a random turnover
date from all available quarters for a fund excluding the first and last 12 months of a fund and the 24 months
before and 24 months after the actual manager turnover date. In results relegated to the Internet Appendix, we

17
show that fund flows do not react to the hiring and resignations of home-biased managers based on pseudo-
turnover dates.
Even though the turnover results are suggestive of home-biased managers as the reason for the change
in fund-flows, it is possible that the turnovers arise due to partial anticipation about changes in fund flows due
to other contaminating events. We first address this concern by limiting the sample to “quasi-exogenous”
turnover events by considering only the sub-sample of turnover events without prior negative performance.
We find that our results remain unchanged. These results are also tabulated in the Internet Appendix.
We then propose two quasi-natural experiments to examine further whether fund flows reflect the
informational advantage of home-biased managers. The first event we examine is the November 2012 meeting
of the 18th National Congress of the Communist Party of China and our focus is on the China region funds.
There are relatively few such funds in our sample which limits the power of our experiment. But the identifying
assumption for salience of local market information was that, though major public announcements were fully
anticipated, the content of those announcements was unknown. Indeed, a large number of announcements
regarding the new leadership team of the party as well as important changes in economic policy were made
soon after the meeting concluded.4 If managers who grew up in China are perceived to have superior ability
to interpret the economic announcements and reports released right after the 18th National Congress of the
Communist Party of China or if they are expected to have had access to privileged information, then we would
expect significant increases in flows to China region funds managed by home-biased managers (Chinese
managers) relative to other China region funds during the meetings.
We use a standard difference in difference test around this event to examine the hypothesis. We use
the year before the congressional meeting as the control period (months -1 to -12 relative to the meeting date),
and the six months starting in the month of the meeting as the event period (months 0-5). China region funds
without Chinese managers are our control group, and China region funds with Chinese managers compose our
treatment group. The regression specification involves 206 fund months among these 16 unique funds, ten of
which are home-biased teams of managers. The results are presented in the Internet Appendix. Flows to China
4 Details about the members of the Standing Committee of the Political Bureau of the Central Committee of the Communist Party of China, including
General Secretary Xi Jinping, were announced and listed at: http://www.china.org.cn/china/18th_cpc_congress/2012-11/15/content_27124199.htm. The full text of the Constitution of the party adopted on November 14, 2012 details economic priorities as well as the party’s organizational system
is at: http://www.china.org.cn/china/18th_cpc_congress/2012-11/16/content_27138030.htm. Text of the speeches outlining the Central Commission
for Discipline Inspection and the anti-graft initiative as well as those related to housing, green investments, power transmission, the aviation industry, and liberalization of the currency are available at: http://www.china.org.cn/china/18th_cpc_congress/node_7167329.htm.

18
region funds run by home-biased managers experienced a 6.0% monthly increase for the six months after the
meeting. Compared to the average monthly flows (0.65%) for China funds, this is an economically large shift.
We include year fixed effects given that the sample spans a few years, but the results remain unchanged
without them. In the Internet Appendix, we exhibit in a figure the differential gap in monthly flows to home-
biased funds relative to non-home-biased funds and how they widen dramatically in October, November,
December and especially January following the close of Congress in November. No large differences arise in
the flows between China region funds with and without Chinese managers until the month prior to the meeting.
In our second quasi-experiment, we ask specifically whether the perceived advantage of home-biased
managers is associated with situations around periods of high uncertainty, similar to, but much more general
than, the experiment we outlined above. One major concern with delegated management is that investors
withdraw funds during periods of high uncertainty (Baker, Bloom, and Davis, 2016). We ask whether home-
biased managers mitigate withdrawals relative to funds that do not have such managers during such episodes.
To examine this question, we obtain the economic uncertainty index developed by Baker, Bloom, and Davis
(2016) and adapt it to our setting. They construct a national Economic Policy Uncertainty (EPU) index for the
U.S. and 11 other countries from 1997 to the present in which they capture the relative frequency of own-
country newspaper articles have terms pertaining to the economic, policy or uncertainty. In their study, they
provide evidence of how firm-level and aggregate outcomes evolve in wake of EPU index fluctuations.5 We
successfully match EPU indexes for Regional and Country funds in Japan, India, Brazil, and Europe. We then
run regressions of fund flows on home-biased fund dummy along with its interaction with the respective
matched EPU indexes. A positive coefficient on the interaction term suggests home-biased managers receive
more flows (or less negative outflows) during periods of higher uncertainty.
The results are not shown in the main paper, but can be found in the Internet Appendix. All the control
variables are the same as in Table 5. Also, as in Table 5, we include category and year fixed effects and cluster
standard errors at the fund and year level. The sample of fund months reduces from 13,591 observations in
Table 5 among Regional and Country funds to only 4,259 observations in Table 5. Nevertheless, the coefficient
on the home-biased fund dummy is positive and significant (0.0082). When we regress using the values of the
5 Gulen and Ion (2016) show how EPU is strongly negative linked to firm-level corporate investment overall and most acute for firms with higher
degrees of investment irreversibility and more dependence on government funding.

19
EPU index, the interaction term is not significantly different from zero. One reason could be that the
uncertainty is important only when it is unusually high. So, we create a dummy variable that equals one when
economic uncertainty exceeds the 75th percentile value of the index in a given region or country, and zero
otherwise. The coefficient associated with high EPU is not different from zero. And nor is that associated with
the fraction of home-biased managers. What happens is the coefficient associated with the interaction of
fraction home-biased and the High EPU dummy is positive and reliably so, which implies that the relative
perceived advantage of home-biased managers in more reliably associated with an uncertain environment.
To now, we document that home-biased fund managers attract more fund flows. Another important
facet of fund-flows is how they respond to fund performance. The literature on flow-performance sensitivity
often focusses on the fund manager’s risk-taking incentives (Chevalier and Ellison, 1997; Sirri and Tufano,
1998) since funds seem to benefit significantly from superior recent performance and not suffer as much from
poor performance. Instead, our motivation is to differentiate the trust and information hypotheses of home-
biased manager choice. If trust in the home-biased manager is an important determinant of how investors
choose funds, then we expect the home-biased fund performance (positive or negative) to have a smaller
impact on fund-flows relative to other funds. On the other hand, if investors consider home-biased managers
to be informed, it is possible that even a small sign of abnormal performance leads them to invest more with
the mutual fund, significantly increasing the flow-performance sensitivity. So, we estimate a regression similar
to fund-flow regressions in the previous subsection, except now we also interact the home-biased manager
measure with fund performance measured by its lagged one-month return.
We present the results in Table 7. The first four specifications are similar to the first set of
specifications in Table 5, except that we allow the dummy variable on Home-biased fund to interact with the
past Fund return. In these specifications, it is important to note that the coefficient for the Home-biased fund
is positive in each of Models (1) and (2) for the Global funds and Models (3) and (4) for the Regional and
Country funds, respectively, the magnitudes are slightly smaller than in Table 5, but the precision in terms of
robust t-statistics is much less. The coefficients on the other control variables are also mostly unchanged. But
what is new is that the coefficient on the interaction between the indicator variable for the presence of a home-
biased manager and Fund return is significantly positive in three of the four specifications. It is positive but
insignificant only for the Regional fund specification of Model (3). These findings are inconsistent with our

20
expectation of reduced sensitivity if home-biased managers are more trusted by investors. We find similar
results (unreported) when we separate out the returns further using a dummy variable for poor (good)
performance. The positive sensitivity of flows to performance observed for Global and Country funds is
consistent with how investors may react when they already suspect that home-biased managers have an
informational advantage. In Models (5) to (7), we examine the Fraction home-biased rather than a dummy
variable for whether the fund has a home-biased manager. This variable is applied only to the subset of funds
that are home-biased, so this experiment is testing our main hypothesis at the intensive margin: conditional on
being a home-biased fund, is the fraction of the management team that is home-biased related to the intensity
of the positive flow-performance sensitivity. It appears not. The coefficients on the Fraction home-biased are
positive but never significant and none of the interactions with past Fund return are reliably different from
zero. The extensive margin tests of Models (1) to (4) imply that it is the presence of a home-biased fund
matters much more than the number of such managers for a given home-biased fund that matters for flows.
5. Do home-biased fund managers outperform?
Our results to now show that home-biased managers invest significantly more in stocks in their home
countries and the funds they manage attract more fund flows than do those who manage peer funds. This
evidence can be interpreted to be as consistent with the familiarity hypothesis of Chan, Covrig, and Ng (2005)
and Pool, Stoffman, and Yonker (2012) as it could be with the informational advantage hypothesis (Van
Nieuwerburgh and Veldkamp, 2009). To differentiate between these two explanations, we test whether funds
managed by home-biased managers outperform their peers. According to theory, an information endowment,
such from having grown up in a country within the mandate of the fund of which you are a manager, should
be associated not only with excess investment in the stocks of your home country, but also with an advantage
that yields higher returns. Our experiments here run in two phases: the first phase constructs an as-if fund-of-
fund portfolio of home-biased and non-home-biased mutual funds; and, the second phase performs a calendar-
time portfolio performance analysis but only of the components (measured as the individual stock level) of
the home-biased and non-home-biased funds that relates to the country bias of the home-biased managers.
We start by computing equally-weighted and value-weighted portfolios of funds based on monthly
returns for those with and without home-biased managers, respectively. Value weights are determined by TNA

21
as of the end of the preceding quarter for the month. The returns for each fund are computed using raw and
net-of-fee returns as reported to Morningstar. We compute the returns of a portfolio that goes long on funds
with home-biased managers and takes a short position in funds without home-biased managers. At least three
funds are required in each long or short leg of the portfolio to qualify as a viable month for the analysis.
Table 8 reports the raw return and the Fama-French Global 4-factor alphas for the equally- and value-
weighted long/short portfolios. What we call the Fama-French Global 4-factor model includes the global
market index excess return portfolio (G_Mkt-Rf), the global size factor (small capitalization returns minus
large capitalization returns, small-minus-big, or G_SMB), the global value factor (high market-to-book stock
returns minus low market-to-book stock returns, high-minus-low, or G_HML), and a global momentum factor
(recent 12-month trailing return winners less loser returns, or G_MOM).6 All fund returns and those associated
with the factors are U.S. dollar-denominated returns. The first two specifications of the table are for the Global
funds, the next two for the Regional funds, and the last two are for the Country funds. Similar findings for the
fund-of-fund portfolios using net-of-fee returns are presented in the internet appendix. We report the average
loadings on the long-short portfolio returns, their associated t-statistics, along with the intercept alphas,
number of observations and adjusted R2.
The first finding of note is that the raw returns and the alphas are not distinguishable from zero for
Global funds. This is not surprising given that the average annualized raw returns of the home-biased funds
(9.2%, over 1991 through 2014) in Panel B of Table 1 were indistinguishably different from those of unbiased
funds (9.2%). It is interesting that the funds of home-biased managers have lower global market factor loadings
(negative coefficient on G_Mkt-Rf), but higher global momentum factor loadings. These net loadings are not
observable among the equally-weighted portfolio returns, only the value-weighted ones.
When we turn our attention to the performance results for Regional and Country funds, we see a more
consistent pattern of superior return performance among the home-biased funds. This is important for our key
inference about an information advantage as the salience magnifies with a home-biased manager from the
country or region when the geographic mandate is more closely linked to that country or region. The alphas
among the value-weighted funds in the Regional and Country portfolios are positive and reliably so. They
6 These data are obtained with thanks from Ken French’s data library under the category of Developed Market factors and returns at:
http://mba.tuck.dartmouth.edu/pages/faculty/ken.french/data_library.html. Details of their construction are in Fama and French (2012, 2017).

22
range from around 32 basis points per month (3.90% per year) to as high as 43 basis points per month (5.28%
per year) among country funds. The equivalent alphas for the equally-weighted portfolios are close to zero for
the Regional funds and positive, but not always statistically reliable, among Country funds.7 Among the
Regional funds, we also learn that the lower global market betas among home-biased managers are prevalent
across both value- and equally-weighted portfolios. The same tilt is revealed among the Country funds, but
the findings are not statistically precise. Here we also notice that the global size factor loadings are reliably
negative among Regional funds indicating that the home-biased managers favor larger capitalization stocks,
in general.
The alphas using the Fama-French Global 6-factor are reported in the Internet Appendix. The Fama-
French 6-factor model adds a global profitability factor (robust operating profitability minus weak operating
profitability returns, robust-minus-weak, or G_RMW) and, a global investment factor (conservative
investment less aggressive investment returns, conservative-minus-aggressive, or G_CMA) to the 4-factor
model. Operating profitability loads positively for Global, Regional, and Country funds, but they are not
reliable across all specifications. The alphas from these regressions are similar in magnitude to the alphas
reported earlier from 4-factor models.
If home-biased managers have an informational advantage, their investments in home-country
securities are where we expect to observe the advantage to be played out. The advantage may be masked at
the fund level, especially for more globally diversified funds. So, the second phase of our analysis of
performance takes a somewhat unorthodox turn. Here, we construct portfolios of the home-biased and non-
home-biased funds, but using only the home-country stocks of the overall portfolio holdings of the home-
biased managers to test whether they have an informational advantage. The benchmark portfolio is comprised
of the home-country stocks associated with the country of domicile of the home-biased manager, but only for
those of the non-home-biased funds. That is, at the beginning of a quarter, we take a long position in all
Chinese stocks held by a China Region fund with home-biased Chinese managers and take a short position in
all Chinese stocks held by China Region funds without home-biased Chinese managers. We hold those
7 We also evaluate performance of regional and country funds using Fama-French regional factors. The availability of regional factors from French’s
website is limited, and they only consider the major country stocks when computing the factors. For example, their Asia-Pacific ex-Japan factors are
computed using stocks from Australia, New Zealand, Singapore and Hong-Kong. Since markets are far more segmented, the estimated factors are
likely to be noisy. We find significant alphas only for home-biased funds from Europe using the European regional factors. The limited number of other regions do not yield significant alphas for home biased portfolios.

23
positions for each of the three months of the following quarter and then rebalance the portfolio based on
updated holdings of both sets of China region funds.
We use a standard calendar-time portfolio approach to examine the performance of these components
of the overall portfolios of the Global, Regional and Country funds. The first step is to construct a home-biased
portfolio by selecting the home-country stocks of home-biased managers. We next construct a non-home-
biased portfolio by selecting the stocks in home-biased managers’ home countries but held by the non-home-
biased managers in the same Morningstar category and in the same quarter. Portfolios are rebalanced every
calendar quarter, and within a given fund portfolio, stocks are weighted by the funds’ dollar holdings. Finally,
we compute value-weighted calendar-time portfolios by averaging across funds weighting individual fund
portfolios by the fund’s TNA value at the end of the previous quarter. Finally, we take a long position in the
home-biased portfolio and a short position in the non-home-biased portfolio. This approach has the advantage
of testing whether home-biased managers have superior stock-picking ability compared to their peers in terms
of picking their home country stocks while controlling for the investment objective. A key disadvantage of
the approach is the fact that the holdings are updated quarterly and thus too coarsely for monthly fund returns.
Table 9, Panel A shows key statistics for the long-short portfolio and just the long-only leg of the
long-short portfolio that focuses on the returns relative to a U.S. Treasury bill return. They are both reported
for each of the Global, Regional, and Country funds in turn. We present the raw returns as well as the Fama-
French 4-factor alphas along with the respective 4-factor loadings. The Fama-French 4-factor models
employed in this exercise are based on global ex US factors. To distinguish them from the global factors in
Table 8, we refer to them here in Table 9 using “F” for foreign reported as F_Mkt-Rf, F_SMB, F_HML, and
F_MOM.8 The raw returns for the Global long-short funds are insignificant 23 basis points, but the 4-factor
alpha of 31 basis points is significantly positive. Part of the reason for this is that the raw return difference of
23 basis points per month in part reflects the fact that the home-biased funds tend to avoid winner momentum
stocks among the holdings in their respective countries of domicile; this is revealed by means of a significant
negative loadings on F_MOM). To the right of the results on the long-short portfolios, we also present the raw
returns, alphas and loadings of only the long positions (in terms of excess returns relative to the U.S. short
8 We also report the Fama-French Global ex US 6-factor alphas in the internet appendix. The model adds a global ex US profitability factor (robust
operating profitability minus weak operating profitability returns, robust-minus-weak, or G_RMW) and, a global ex US investment factor (conservative investment less aggressive investment returns, conservative-minus-aggressive, or G_CMA) to the 4-factor model.

24
rate, Rf). Indeed, we can see positive returns of 92 basis points per month and a monthly alpha that is a reliably
significant 54 basis points per month using the 4-factor model, Among Regional funds, raw returns of the
country-specific holdings of the home-biased managers are weakly significant at 49 basis points per month.
The 4-factor alphas are 65 basis points per month. Loadings on F_HML are not significantly different from
zero using the long only excess returns, but they are negative, which confirms the preference for growth stocks.
Here, alphas of the long-only excess returns of the home-biased managers are positive and 72 basis points for
the 4-factor model. The small-cap tilt of the Regional funds are noteworthy with a reliably positive loading on
F_SMB for the long only leg.
The findings in favor of superior performance among home-biased managers for the stocks in their
home countries are similarly statistically reliable among Country funds. The 4-factor alphas in the long-short
portfolios are around 59 basis points per month. The negative loading on winner momentum factors are
exhibited as for the Regional funds – home-biased managers avoid winner momentum stocks relative to their
non-home-biased peers that also invest in those same markets. Taken with the evidence in the previous sub-
section, the results suggest that the benefits primarily exist in the home country portfolio of the managers,
consistent with the arguments about the salience of an information advantage.9
One way we can evaluate the power of the information advantage hypothesis for home-biased funds
by seeking to falsify our findings among individual stocks in which a relative advantage by home-biased
managers should be weaker. This effort is akin to the country-level test we conducted in Table 3 for the
country-level excess holdings of such funds. One could argue that American Depositary Receipts (ADRs) held
by the home-biased funds from the manager’s country of origin would be a reasonable place to conduct the
tests. Since the ADRs are cross-listed in the U.S., they need to comply with the disclosure requirements of the
Securities Exchange Act (1934) and related U.S. reporting regulations, so we would expect the language and
cultural advantage of home-biased managers to be diminished on the cross-listed stocks. In Panel B of Table
9, we summarize these findings. The tests are similar to those reported in Panel A, except that we now consider
only ADRs in the sample and associate the home-country of the company’s headquarters with each ADR. The
number of stocks in the respective long-short and long-only portfolios are fewer, so the qualifying rules limit
9 UK managers form a significant portion of the home-biased managers in our sample. Even though this does not invalidate any of our explanations,
we have replicated the results with a sample without UK managers. The results remain significant and the coefficients are very similar to those reported in this table.

25
somewhat the number of months for which we can run these regressions. Nevertheless, the raw returns and
the 4-factor alphas of these long-short portfolios are insignificant for all groups of funds, indicative of the
home-biased managers’ lack of information advantage in these stocks.
A potential alternative explanation of the portfolio-level and stock-level performance results is that
home-biased funds are simply able to attract talent from an ever-larger pool of managers globally, so the
superior returns reflect the higher quality of their hires, in general, and not about any information advantage
they have in their home countries, in particular. In order to distinguish this line of reasoning from the
informational advantage explanation, we specifically examine the performance of home-biased managers’
non-home-country holdings. If home-biased managers have an unconditionally higher ability, we expect to
find evidence of superior performance even on this portfolio. For this purpose, we construct long-short
calendar-time portfolios as in Panel A of Table 9, but now take long positions only in the non-home-country
holdings of the home-biased managers and take short positions in the holdings of other managers in the same
non-home-country-biased countries.
Table 9, Panel C presents the raw returns and alphas for these long-short and long-only portfolios for
the Global, Regional, and Country funds. The raw returns and the alphas are essentially zero for Global and
Regional funds. For Country funds, the 4-factor alphas are 49 basis points per month. In comparison, the 4-
factor alphas for the long-short portfolio of home-country stocks are about 30 basis points for Global funds,
about 65 basis points for Regional funds, and about 60 basis points for Country funds. So, while it appears
home-biased managers have some superior ability in choosing stocks for their portfolios, a significant portion
of the abnormal returns can be attributed to the information advantage of home-biased managers in their own
home-country stocks. To refine this experiment one step further, we evaluate the performance of home-region
stocks for home-biased managers excluding their own country of interest; that is, we want to learn whether the
information advantage arises from the assets in the specific country of domicile or perhaps from learning by-
product of that information advantage that arises for stocks within the region beyond the country of the home-
bias.10 In supplementary tests presented in the Internet Appendix, the 4-factor alphas for long-short portfolios
of home-region stocks are only 2 basis points for Global funds, 9 basis points for Regional funds, and 26 basis
10 We thank Stijn Van Nieuwerburgh for this additional suggestion to explore spillovers of payoffs that may be relevant for non-home-country, but
within-home-region investments.

26
points for Country funds. There appears to be negligible spillover benefits that accrue for home-biased
manager investments in a region.
As with our earlier investigation of the patterns in overweighting of home-biased stocks by several
country-level measures of information quality, we find that home-biased managers perform even better on
their home-country stocks if they originate from emerging-market countries, countries with high corporate
opacity, countries with poor disclosure, or countries that are more distant culturally from the U.S. The results
are presented in Table 10 and in the same order in which they were presented in Table 3 above. These findings
indicate that when local information is less accessible and harder to process, the informational advantage of
home-biased managers may be stronger.
We conduct several additional tests to evaluate this alternative hypothesis about unconditional skills
among home-biased managers. Certain non-US universities, such as the U.K.’s Cambridge and Oxford, are
regarded as global “magnets” that attract undergraduate students from around the world. The graduates of
these top universities are likely managers who deliver superior performance, but their skills are not necessarily
from investing in the U.K. To examine this argument, we deleted the graduates of the universities that at some
point of time during our sample period was ranked in the list of top 20 universities in the QS World University
Rankings (https://www.topuniversities.com/qs-world-university-rankings). Seventeen non-U.S. universities
are on the list: Australian National, Ecole Polytechnique, Ecole Normale Supérieure, Paris, Imperial College
London, London School of Economics, McGill University, National University of Singapore, Peking, Swiss
Federal Institute of Technology Zurich, Tokyo, University College London, Cambridge, Edinburgh,
University of Hong Kong, Melbourne, Oxford, and Toronto. The results in Table 2 (overweighting home
country stocks), Table 5 (fund flows), and Table 9, Panel A (performance of home-country stocks) are similar,
which adds support to the information-advantage explanation in the paper. These findings are available in the
accompanying internet appendix.11
11 Rather than just concentrating on the performance of the holdings, we can evaluate the performance of home biased managers by computing the
performance of their stock purchases and sales. For this purpose, we define a purchase (sale) as an increase (decrease) in the holdings of the manager
from one-quarter to the next. In unreported results, we examine purchases and sales separately. For the purchase part, we take a long position in all
of the purchases of home-biased managers in their home country stocks and a short position in all purchases by non-home-biased managers in that
country’s stocks. For the sales test, we short the home-biased manager’s sales in their country and go long on the sales of the other managers’ holdings
in that country’s stocks. We separate out whether the returns are symmetrical or whether the information benefits may only be on the positive side. We compute the monthly value-weighted returns on the long/short portfolio over the next three months, when we rebalance our portfolio. Overall,
the results suggest the abnormal performance by home-biased managers in selecting their home country stocks is concentrated on the purchases.

27
6. Active share, trading, and overall portfolio activity of home-biased funds.
The positive alphas we identify for home-biased managers may be due to inappropriate benchmark
factor models that we use for returns of these international mutual funds. There is considerable difficulty in
pricing assets with global models (see, for example, Cremers and Petajisto, 2009; Fama and French, 2012 and
2017). One way to confer additional power to our inferences is to study characteristics attributes from portfolio
holdings. To that end, we examine whether home-biased managers are more active in their holdings and in
their trading activity among the stocks in their portfolios than other non-home-biased managers. We compute
two such measures at the fund portfolio level overall and then also with the component of their portfolios
comprised of just their home country stocks.
First, we compute a fund’s Active Share, which measures how much the managers’ individual stock
holdings deviate from their respective weights in a defined benchmark index. The measure is as developed by
Cremers and Petajisto (2009) for U.S. mutual funds. Instead of using a commercially-generated index, such
as the Standard & Poor’s 500 index as they do for U.S. funds, we use a category appropriate index to examine
the deviation. The index we propose for these international funds is constructed by averaging the individual
stock holdings of all funds in a given category. These categories are all Global funds, all Regional funds, and
all Country funds respectively. For the stock weight in each constructed index in each quarter, we use the
weight of a stock held by all funds in a category. For a given fund, the Active Share is a sum across all
individual stock holdings of the absolute deviations of a given fund relative to this benchmark weight.12 Note
that we compute these measures separately for all individual holdings of the respective funds by category and
among only those stocks held in the countries in which the manager is biased. This is equivalent to Table 9 for
the performance of home-biased managers’ home-country stocks.
Second, we construct an Industry concentration measure similar to Kacperczyk, Sialm, and Zheng
(2005). It is a measure of the diversity of fund holdings computed as the sum across industry groups
represented of the squared deviations of fund weights in an industry relative to the benchmark index’s weight
in that industry. As we did with Active Share, we use the fund category’s average allocation to each industry
as the benchmark. Kacperczyk, Sialm, and Zheng (2005) show that more concentrated funds perform better
12 As in the key equation in Cremers and Petajisto (2009, Section 2.2), we multiply the sum of the absolute deviations by half to confer the appropriate
intuitive economic interpretation. A fund that has zero overlap with its benchmark index gets a 100% Active Share, since the measure does not count the long positions separately from the short positions.

28
than less concentrated funds after controlling for risk and style differences using various performance
measures. They interpret this active industry “bet” and the resulting superior performance as a reflection of an
information advantage that managers have with respect to that industry. As with Active Share, we will report
separately Industry Concentration measures overall for funds of home-biased managers relative to their non-
home-biased peers and separately only for those stocks in the countries in which they are biased.
To round out our measure of alternative fund management strategies, we also study the cash holdings,
and the amount of short selling by home-biased funds relative to non-home-biased funds by fund category.
Cash holdings is computed as the percentage of TNA a fund allocates to cash on average across fund quarters
in a given year (“Cash holdings”). Similarly, we compute the percentage of TNA a fund assigns to short selling
positions on average across each of the four quarters in a given year (“Short selling”).
Table 11 reports the results from regressions of the various measures on the presence of a home-biased
manager dummy and other control variables for global funds. The control variables include those featured in
Table 5 for fund flows (Fund size, Fund return, Fund return squared, Fund risk, Expense ratio, Turnover except
for the turnover regressions, Fund age, No. of managers, and Manager experience). We include category and
year fixed effects and cluster standard errors at the fund and year levels. At the fund level, home-biased
managers do not exhibit significantly positive Active Share regardless of whether these are Global, Regional
or Country funds. However, at the home-country stock level, we find that home-biased manager portfolios do
exhibit significantly higher Active Share. That is, their portfolio deviates significantly from the benchmark,
which is supportive of the informational advantage of home-biased managers. We do not see any noteworthy
differences in industry concentration overall. But at the fund level – and especially for Regional and Country
funds, home-biased funds concentrate on few industries. Together with the evidence from Kacperczyk, Sialm,
and Zheng (2005), this finding on industry concentration may (at least in part) explain why home-biased funds
outperform at fund level for regional and country funds. At the home-country stock level, we observe that
home-biased managers’ home-country holdings actually exhibit less industry concentration. This indicates
that the informational advantage of home-biased managers is not limited to certain industries. The home-
biased funds also hold less cash. Overall, the portfolios of home-biased managers differ significantly from the
portfolios of peer managers and appear to be more actively managed, consistent with a possible informational
advantage on portfolios related to their respective countries of domicile.

29
We acknowledge that the reliably positive alphas documented earlier in the paper may be difficult for
investors to exploit in practice. The long-short portfolios in the paper with significant alphas are formed with
all the stocks held by U.S. international mutual funds. This is unlikely to be a feasible strategy. Further, the
stock-level analysis does not include transactions costs, investability restrictions, differential tax treatments,
and other constraints associated with forming and rebalancing the portfolios each quarter. Liquidity is also a
major concern in many of these international markets. The long-short portfolio at the mutual fund level may
be a more practical alternative, but the abnormal returns from the strategy are low.
7. Assessing the economics of home-biased manager performance.
A natural question that arises from our results on the superior performance of these home-biased funds
is why all international mutual funds do not choose to hire home-biased managers. We seek explanations on
two related fronts. The first is an understanding of the potential scarcity of qualified home-biased managers
that could be hired. A second argument relates to potential self-selection or matching of managers – home-
biased and non-home-biased – and certain types of funds by attribute or objective. In this section, we consider
the endogeneity of manager-fund matching that arises from the home-biased manager’s hiring being correlated
with certain observed or unobserved fund or fund category characteristics. We will demonstrate that less risky,
older internationally-mandated mutual funds with larger management teams are more likely to be associated
with home-biased managers. To address the endogeneity concern, we advocate the use of a self-selection
control to reveal something closer to a pure effect of a present home-biased manager on a team. It turns out
that our results continue to hold after controlling for endogeneity using an extension to a Heckman (1979)
procedure, known as switching regression models with endogenous choice.13
It does appear that funds are increasingly hiring home-biased managers, especially if the fund has a
narrow geographic objective. As mentioned above in the discussion of Figure 2, the percentage of funds with
home-biased managers has grown from 22% in 1991 to 32% by 2014. The growth is primarily concentrated
in managers hired from India, China, and Latin America. There is no growth in the fraction of fund managers
from Japan and a declining percentage of home-biased funds for Europe. Interestingly, nearly 70% of the
13 We follow the procedures in Golubov, Petmezas, and Travlos (2012) who seek to uncover evidence on the role of financial advisors in acquisition
deals. Using switching regression models that capture the matching of certain acquirers with financial advisors, they demonstrate that top-tier advisors
deliver higher bidder returns than their non-top-tier counterparts in public deals. Their evidence runs counter to prior research and it stems from the fact that they model this endogenous matching directly.

30
home-biased managers do not earn any of their college degrees in the United States, including Master’s, MBA
or other graduate degrees. One possible explanation for the trend in hiring home-biased managers is that the
funds are mimicking the behavior of successful home-biased funds. While we do not formally test this
explanation, we note that (in unreported results) the performance of home-biased funds relative to unbiased
funds improves slightly over time.
A manual search of a random set of 100 home-biased managers reveals that a small majority of them
reside in their home countries.14 If the costs of setting up operations and making hires outside the United States
have declined over time, the increasing trend towards hiring them could be reflective of the reduction in trading
costs and improvement in communications over time.15 If funds are searching deeper into talent pools by hiring
outside the United States, it may not necessarily be reflected by the managers’ educational levels.16 We find
that home-biased managers are less likely to receive an MBA or other graduate degrees when compared with
other active U.S. international mutual fund managers. The evidence adds another dimension to the findings in
Pastor, Stambaugh, and Taylor (2015). They document an upward trend in skill among mutual funds and
rationalize the finding as linked to new funds entering the industry with better educated managers who have a
superior mastery of new technologies. Our finding that the home-biased managers are less likely to have an
MBA implies funds may be hiring home-biased managers not because they received a better education, but
because of their informational advantage about local investments. Also, many of the new entrants in the U.S.
international mutual fund industry are country funds; they are disproportionately more likely to be managed
by home-biased managers. That the trend is driven by country funds rather than other global funds again points
to informational rather than an educational advantage of home-biased managers.
We next address the question of the endogeneity of manager-fund matching as a partial explanation
for the return performance of home-biased managers using a switching regression framework. We use this
framework to control for the possibility that home-biased managers match themselves to certain “higher-
quality” funds which, in turn, are associated with larger flows and superior performance. Switching regression
is a two-stage procedure. In the first stage, we model the selection of home-biased managers by fund attributes
and objectives. Indeed, we will show that there is evidence of selection bias. In order to identify the pure effect
14 In their sample of over 5,000 institutional investors around the world obtained from the FactSet Ownership (“Lionshares”) database, Karolyi, Ng,
and Prasad (2016) show that only about 1% of them have subsidiary offices in the destination countries in which they have a mandate. 15 We thank a seminar participant for suggesting this explanation. 16 Suggestively, there has been a general increase in the number of CFAs granted internationally (See equivalent figures to Figure 2 including them).
31
of a home-biased manager on Fama-French 4-factor alphas, we need to ask the following question: what would
have been the outcome had the same fund been managed by a non-home-biased manager? In the second-stage
of the switching regression, we can answer this what-if question. We specify two second-stage regression
models – one for funds with home-biased managers, and another for unbiased funds – and then evaluate the
characteristics of the funds managed by home-biased managers in the non-home-biased manager regressions
and those of the funds managed by non-home-biased managers in the home-biased manager regressions. The
outcome variable is the fund home equity portfolio Fama-French 4-factor (Global ex US market, F_Mkt-Rf,
F_SMB, F_HML, and F_MOM) alphas. 17
The selection model requires variables that can act as instruments for home-biased manager selection
but that is not directly related to the outcome variable to satisfy instrument validity. To this end, we construct
two variables: Mandate and Recent 5-year trend. Mandate captures the geographic diversification of the fund
– the greater the mandate, the less likely the need to choose a home-biased manager as the salience of the
information advantage is lower. Three groups are formed based on the breadth of the geographic objective of
the fund and they take the values of 1, 2, or 3, in increasing geographic focus, in the regression. Recent 5-
year trend is the trend towards hiring home-biased managers in the fund category measured as the average
percentage of funds with home-biased managers within the category over the past five years (excluding the
fund itself). The measure is standardized by the five-year average of the percentage of all active funds with
home-biased managers. So, the variable measures the relative propensity of the funds in the category to hire
home-biased managers. It is likely that unbiased funds face pressure to hire home-biased managers when more
funds competing in their category start hiring them, especially if they perform well. The variable is unlikely
to be related to our scaled measure of fund flow, even though the dollar amount of fund flows increases over
time. It is possible to argue that alphas have reduced over time due to increasing competition and due to
decreasing returns to scale (Berk and Green, 2004). But, it is likely to impact returns of both home-biased and
unbiased funds equally. Indeed, when we segment our sample into two equal periods and examine the returns
to our long-short portfolio, we do not find any significant decreases in alpha.
In Table 12, we present the switching regression results. For brevity, we only report results for Global
funds in the paper and present the results for Regional and Country funds in the Internet Appendix. Models
17 The equivalent analysis of Global fund flows is presented in the internet appendix.

32
(1) to (3) show that home-biased managers perform significantly better on their home-country stocks than
non-home-biased managers in a simple panel regression setting. In Models (4) to (6), we then present the
results from the Heckman Selection Model and the switching regression results are in Models (7) and (8).18
The selection equation of Model (4) suggests that home-biased are hired by funds that are older and that have
a larger team of managers. There is evidence that less risky funds are more likely to have home-biased
managers on the team. Importantly, both the five-year relative trend in home-biased hiring (Recent 5-year
trend) and the breadth of the geographical mandate (Mandate) are important determinants of home-biased
manager choice. The coefficients on Recent 5-year trend are positive and significant, indicating that unbiased
funds face pressure to hire home-biased managers when more funds in their category start hiring them,
especially if they perform well.
The Inverse Mills ratio — a ratio of the probability density function to the cumulative distribution
function of a distribution — constructed from the first stage is included in the second stage equations to control
for self-selection. This allows us to state that certain unobserved fund characteristics that increase the
likelihood of choosing a home-biased manager further increase the flows and performance. The positive and
significant coefficients on the Inverse Mills ratio indicate that the unobserved fund characteristics are
important in determining home-country portfolio performance. However, the coefficients on the fraction of
home-biased managers are still positive and significant at about 22 basis points per month even after
controlling for the Inverse Mills ratio. This result implies that unobserved fund characteristics cannot fully
explain the superior performance exhibited by home-biased managers.
The switching regressions allow us to perform a hypothetical analysis of what would happen to alphas
if funds switched managers from home-biased to unbiased managers and vice versa. This can be done by
specifying two second-stage equations — one for funds with home-biased managers in Model (7) and one for
funds without home-biased managers in Model (8). What we learn is that the positive and statistically
significant coefficient on the Inverse Mills ratio in the Heckman tests arises from the subset of unbiased
managers. There is evidence of higher return performance that would be ascribed to those non-home-biased
funds that reveal a proclivity to hire home-biased managers based on the selection model, and yet they do not.
18 Column (3) of the panel regression includes macro-economic variables aimed at capturing some of the time-fixed effects from Models (1) and (2).
33
What we call what-if calculations are presented at the bottom of the panel and make this point clearer.
We find evidence that unbiased funds may have benefitted from switching to home-biased managers. The
hypothetical improvement in 4-factor alphas would have been 18 basis points per month for non-home-biased
Global funds (from 10 basis points per month to 28 basis points). Correspondingly, the alphas of home-biased
funds would have been lower by 22 basis points per month (from the actual alphas of 28 basis points to only
6 basis points) for home-biased Global funds had they not chosen home-biased managers. It is also interesting
to note that these hypothetical changes in alphas of home-biased managers’ home-country stocks are consistent
with the abnormal returns associated with home-biased managers we document in the panel regressions in
Models (1) to (3).
In sum, the switching regression analyses help us uncover and pin down the pure effect of the
informational advantage associated with home-biased managers. A key takeaway from this analysis is that
there are important selection effects at work in matching certain funds with home-biased managers on their
portfolio teams. Our inferences about the higher fund alphas they earn can be partially linked to these selection
effects, which can explain why not all U.S. based funds with international mandates will hire home-biased
managers. Our selection models are not perfect by any means, but they do indicate the sensitivity of those
inferences to endogeneity of fund-manager matching.
8. Conclusion
A large literature documents the “home bias” in investor portfolios, whereby investors forego the
benefits of geographic diversification (Lau, Ng, and Zhang, 2014) and prefer the rewards of local investments.
Can investors have it both ways? Can they get the geographic diversification while receiving the benefits of
a “home bias”? Consistent with the interest to diversify geographically and the lowering of barriers to investing
worldwide, the U.S. international mutual fund industry grew by a factor of 30 from 1991 to 2014 to over $800
billion. A significant number of the international funds hire managers who grew up in the region of the fund
objective. We find that these managers reveal a home-country bias towards investments in the funds they help
to manage. They attract more fund flows and perform better than other managers with similar investment
objective suggestive of their benefiting from informational advantage. It is possible that the advantage arises

34
from their building up their initial advantage of understanding the local knowledge and customs, and hence
sustainable (Covrig, Defond, and Hung, 2007).
We also know little about the reasons behind the growth in the international mutual funds and how
funds choose the managers. It is possible that the growth is aided by the widespread adoption of international
accounting standards that improve the information environment for foreign investors or to the easing of
investment restrictions around the globe. Bhattacharya and Groznik (2008) document that U.S. investments in
a foreign country are related to number of persons in the United States originating from that country. Perhaps
the growth of U.S. international mutual funds and the choice of home-biased managers are also related to
immigration trends in the US with investors investing in stocks that they grew up with through managers who
grew up in the same country. Perhaps the initially successful international funds were managed by home-
biased managers and other funds sought to mimic the successful funds by hiring managers with similar
backgrounds. If the initial endowment advantage of managers emanates from their knowledge of language and
customs, then it may be that the investing advantage we document will apply to all managers who have the
endowment advantage, not just those who got their undergraduate degrees in that country. The advantage may
also extend to countries that are proximate linguistically and culturally. We leave it to future research to
explore these important questions that undoubtedly lie in the background for many of our findings.

35
References
Adler, Michael, and Bernard Dumas, 1983, International Portfolio Choice and Corporation Finance: A
Synthesis, Journal of Finance 38, 925–984.
Baker, Scott R., Nicholas Bloom, and Steven J. Davis, 2016, Measuring economic policy uncertainty,
Quarterly Journal of Economics 131, 1593–1636.
Baxter, Marianne, and Urban J. Jermann, 1997, The International Diversification Puzzle is Worse Than You
Think, American Economic Review 87, 170–180.
Baxter, Marianne, Urban J Jermann, and Robert G King, 1998, Nontraded goods, nontraded factors, and
international non-diversification, Journal of International Economics 44, 211–229.
Berk, Jonathan, and Richard Green, 2004, Mutual Fund Flows and Performance in Rational Markets, Journal
of Political Economy 112, 1269–1295.
Black, Fisher, 1974, International capital market equilibrium with investment barriers, Journal of Financial
Economics, 1 (1974), pp. 337-352.
Bhattacharya, Utpal, and Peter Groznik, 2008, Melting pot or salad bowl: Some evidence from U.S.
investments abroad, Journal of Financial Markets 11, 228–258.
Brennan, Michael J., and H. Henry Cao, 1997, International portfolio investment flows, Journal of Finance
52, 1851–1880.
Busse, Jeffrey A., Amit Goyal, and Sunil Wahal, 2014, Investing in a global world, Review of Finance 18,
561–590.
Cao, Henry H., Bing Han, David Hirshleifer, and Harold H. Zhang, 2011, Fear of the Unknown: Familiarity
and Economic Decisions, Review of Finance, 15, 173–206.
Chan, Kalok, Vicentiu Covrig, and Lilian Ng, 2005, What determines the domestic bias and foreign bias?
Evidence from mutual fund equity allocations worldwide, Journal of Finance 60, 1495–1534.
Chevalier, Judith, and Glenn Ellison, 1997, Risk Taking by Mutual Funds as a Response to Incentives, Journal
of Political Economy 105, 1167–1200.
Choe, Hyuk, Bong-Chan Kho, and René M. Stulz, 2005, Do domestic investors have an edge? The trading
experience of foreign investors in Korea, Review of Financial Studies 18, 795–829.
Choi, Nicole, Mark Fedenia, Hilla Skiba, and TatyanaSokolyk, 2017. Portfolio concentration and performance
of institutional investors worldwide, Journal of Financial Economics 123, 189-208.
Cici, Gjergji, Monika Gehde-Trapp, Marc-André Goericke, and Alexander Kempf, 2014, What They Did in
Their Previous Lives: The Investment Value of Mutual Fund Managers’ Experience Outside the
Financial Sector, working paper.
Cooper, Ian, and Evi Kaplanis, 1994, Home bias in equity portfolios, inflation hedging, and international
capital market equilibrium, Review of Financial Studies 7, 45–60.
Cooper, Ian, Piet Sercu and Rosanne Vanpée, 2013, The Equity Home Bias Puzzle: A Survey, Foundations
and Trends in Finance 7, 289-416.
Coval, Joshua D, and Tobias J Moskowitz, 1999, Home Bias at Home: Local Equity Preference in Domestic
Portfolios, The Journal of Finance 54, 2045–2073.

36
Coval, Joshua D., and Tobias J. Moskowitz, 2001, The Geography of Investment: Informed Trading and Asset
Prices, Journal of Political Economy 109, 811–841.
Covrig, Vicentiu M., Mark L. Defond, and Mingyi Hung, 2007, Home bias, foreign mutual fund holdings, and
the voluntary adoption of international accounting standards, Journal of Accounting Research 45, 41–
70.
Cremers, Martijn, and Antti Petajisto, 2009, How Active Is Your Fund Manager A New Measure That Predicts
Performance, Review of Financial Studies 22, 3329–3365.
Cremers, Martijn, Miguel A. Ferreira, Pedro Matos, and Laura Starks, 2016, Indexing and active fund
management: International evidence, Journal of Financial Economics 120, 539–560.
Dahlquist, Magnus, Lee Pinkowitz, René M. Stulz, and Rohan Williamson 2003, Corporate governance and
the home bias, Journal of Financial and Quantitative Analysis 38, 87-110.
Dumas, Bernard, Karen K. Lewis, and Emilio Osambela, 2017, Differences of opinion and international equity
markets, Review of Financial Studies 30, 750–800.
Errunza, Vihang, Ked Hogan, and Mao-Wei Hung, 1999, Can the Gains from International Diversification Be
Achieved without Trading Abroad? Journal of Finance 54, 2075–2107.
Fama, Eugene F., and Kenneth R. French, 2012, Size, value, and momentum in international stock returns,
Journal of Financial Economics 105, 457–472.
Fama, Eugene F., and Kenneth R. French, 2017, International tests of a five-factor asset pricing model, Journal
of Financial Economics 123, 441–463.
Fee, Edward C., Charles J. Hadlock, and Joshua R. Pierce, 2013, Managers with and without style:Evidence
using exogenous variation,Review of Financial Studies 26, 567–601.
Ferreira, Miguel A., and Pedro Matos, 2008, The colors of investors’ money: The role of institutional investors
around the world, Journal of Financial Economics 88, 499–533.
French, Kenneth R., and James M. Poterba, 1991, Investor diversification and international equity markets,
The American Economic Review.
Gennaioli, Nicola, Andrei Shleifer, and Robert Vishny, 2015, Money doctors, Journal of Finance 70, 91–114.
Gehrig, Thomas, 1993, An Information Based Explanation of the Domestic Bias in International Equity
Investment, The Scandinavian Journal of Economics 95, 97–109.
Glassman, Debra A., and Leigh A. Riddick, 2001, What causes home asset bias and how should it be
measured? Journal of Empirical Finance 8, 35–54.
Golubov, Andrey, Dimitris Petmezas, and Nickolaos G. Travlos, 2012, When it pays to pay your investment
banker: New evidence on the role of financial advisors in M&As, Journal of Finance 67, 271–312.
Grinblatt, Mark, and Matti Keloharju, 2000, The investment behavior and performance of various investor
types: a study of Finland’s unique data set, Journal of Financial Economics 55, 43–67.
Grinblatt, Mark, and Matti Keloharju, 2001, What makes investors trade? Journal of Finance 56, 589–616.
Gulen, Huseyin, and Mihai Ion, 2016, Policy Uncertainty and Corporate Investment, The Review of Financial
Studies 29, 523–564.

37
Gurun, Umit G., Noah Stoffman, and Scott E. Yonker, 2017, Trust Busting : The Effect of Fraud on Investor
Behavior, The Review of Financial Studies, forthcoming.
Heckman, James J., 1979, Sample Selection Bias as a Specification Error, Econometrica 47, 153–161.
Hofstede, G., 2001. Culture’s Consequences: Comparing Values, Behaviors, Institutions and
Organizations Across Nations. second edition. SAGE Publications.
Hou, Kewei, G. Andrew Karolyi, and Bong-Chan Kho, 2011, What factors drive global stock returns?, Review
of Financial Studies 24, 2527–2574.
Jermann, Urban J, 2002, International portfolio diversification and endogenous labor supply choice, European
Economic Review 46, 507–522.
Kacperczyk, Marcin, Clemens Sialm, and L. U. Zheng, 2005, On the industry concentration of actively
managed equity mutual funds, Journal of Finance 60, 1983–2012.
Karolyi, G. Andrew, 2015, Cracking the Emerging Markets Enigma (Oxford University Press).
Karolyi, G. Andrew, 2016, The gravity of culture for finance, Journal of Corporate Finance 41, 610–625.
Karolyi, G. Andrew, and René M. Stulz, 2003, Are financial assets priced locally or globally?, Handbook of
the Economics of Finance. Financial Markets and Asset Pricing, Chapter 16, Elsevier North-Holland
Publishers, Amsterdam, The Netherlands.
Karolyi, G. Andrew, David T. Ng, and Eswar S. Prasad, 2015, The Coming Wave: Where Do Emerging
Market Investors Put Their Money? Working Paper, National Bureau of Economic Research.
Kumar, Alok, Alexandra Niessen-Ruenzi, and Oliver G. Spalt, 2015, What’s in a Name? Mutual Fund Flows
When Managers Have Foreign-Sounding Names, Review of Financial Studies.
Lau, Sie Ting, Lilian Ng, and Bohui Zhang, 2010, The world price of home bias, Journal of Financial
Economics 97, 191–217.
Lewis, Karen K., 2011, Global Asset Pricing, Annual Review of Financial Economics 3, 435–466.
Luo, Mancy, 2017, Financial Product Design and Catering: Evidence from the Global Mutual Fund Industry.
SSRN Working Paper, Social Science Research Network.
Pastor, Lubos, Robert F. Stambaugh, and Lucian A. Taylor, 2015, Scale and skill in active management,
Journal of Financial Economics 116, 23–45.
Patel, Saurin and Sergei Sarkissian, 2017, To Group or Not to Group? Evidence from Mutual Fund Databases,
Journal of Financial and Quantitative Analysis 52, 1989-2021.
Pool, Veronika K., Noah Stoffman, and Scott E. Yonker, 2012, No place like home: Familiarity in mutual
fund manager portfolio choice, Review of Financial Studies, 25(8), 2563-2599.
Schumacher, David, 2017, Home Bias Abroad: Domestic Industries and Foreign Portfolio Choice, Review of
Financial Studies, forthcoming.
Sialm, Clemens, Zheng Sun, and Lu Zheng, 2014, Home Bias and Local Contagion, Evidence from Funds of
Hedge Funds, Working Paper.
Sirri, Erik R., and Peter Tufano, 1998, Costly Search and Mutual Fund Flows, The Journal of Finance 53,
38
1589–1622.
Seasholes, Mark S., and Ning Zhu, 2010, Individual investors and local bias, Journal of Finance 65, 1987–
2010.
Solnik, Bruno H., 1974, An equilibrium model of the international capital market, Journal of Economic Theory
8, 500-524.
Solnik, Bruno H., 1983, International arbitrage pricing theory, The Journal of Finance, 38, 449-457.
Stulz, René M., 1981, On the Effects of Barriers to International Investment, The Journal of Finance 36, 923–
934.
Stulz, René M., 2005, The Limits of Financial Globalization, Journal of Finance 60(4), 1595-1638.
Teo, Melvyn, 2009, The Geography of Hedge Funds, The Review of Financial Studies 22, 3531–3561.
Van Nieuwerburgh, Stijn, and Laura Veldkamp, 2009, Information immobility and the home bias puzzle,
Journal of Finance 64, 1187–1215.
Van Nieuwerburgh, Stijn, and Laura Veldkamp, 2010, Information acquisition and Under-Diversification,
Review of Economic Studies 77, 779–805.

39
Table 1
Sample composition and summary statistics.
The table below summarizes the fund and manager characteristics of active U.S. international equity mutual funds from 1991 to 2014. Based on the breadth of the fund’s geographical objective, we
form three groups – from the broadest (Global funds) to the narrowest (Country funds). The first three columns of Panel A show how we group the Morningstar categories. The rest of Panel A reports
the sample composition. Home-biased managers are those who received their undergraduate degree from a country that includes the geographical mandate of the fund. We do not consider managers
who received their undergraduate degrees from the U.S. as home-biased managers. In this table, we report summaries for (i) funds with at least one home-biased manager in the team and (ii) funds with
a majority of home-biased managers on the team (including funds with a single-manager), and (iii) unbiased funds. Unbiased funds do not have any home-biased managers. Panel B reports the fund and
manager characteristics based on the presence of home-bias managers on the team and when the majority of the team managers are home-biased, classified by the three groups formed on fund’s
geographical objective. t-statistics reported in Panel B compares the characteristics of funds with at least a home-biased manager with unbiased funds. Fund size is the fund’s total net assets in $millions.
Fund flow is the net inflow into a fund in a month, defined as (TNAi,t−TNAi,t−1)/TNAi,t−1−ri,t, where TNAi,t denotes fund i’s total net assets in month t and rt denotes fund i’s return in month t. Fund age
is the number of years since the inception of the fund. Fund return is the fund’s monthly return. Fund return volatility is the time series standard deviation of fund monthly returns int the previous 12
months. Idiosyncratic volatility is the standard deviation of residuals from regressions of the previous 12 monthly fund returns on the Fama/French Global market, SMB, HML factors and momentum
factors. Expense ratio and turnover are as reported in Morningstar. No. of stocks held is the unique number of stocks held by a fund in a quarter. No. of countries is the number of unique countries
represented in the manager’s portfolio. No. of managers is the number of managers in the management team. Manager tenure is the average tenure of all members in the management team. Manager
experience is obtained from their profiles on Morningstar and is the percentage of managers with previous working experience in the investment objective regions. Percentage with MBA (Ph.D.) is the
percentage of managers with an MBA (Ph.D.) degree in the management team. Reported values in Panel B of Fund flow, Fund return, Fund return volatility, Idiosyncratic volatility, Expense ratio, and
Turnover are annualized. Panel C presents the distribution of countries where the managers received their undergraduate degrees and the number of managers who are home-biased.
Panel A: Home-Biased Managers – Sample Composition (averages per quarter)
Morningstar Category
Global
funds
Regional
funds
Country
funds
Average #
funds
Average fund
TNA
($ millions)
Funds with
home-biased
managers
Team
managed
funds per
quarter
Percent of team
managed funds
with home-biased
managers
Single-
manager
funds
Percent of single-
manager funds
with home-biased
manager
World Stock 1 56 596 19% 38 26% 18 8%
Foreign Large Blend 1 54 584 37% 32 41% 23 28%
Foreign Large Growth 1 33 683 23% 19 35% 15 33%
Foreign Large Value 1 26 918 31% 18 31% 9 16%
Foreign Small/Mid Blend 1 6 599 50% 5 36% 2 77%
Foreign Small/Mid Growth 1 10 683 23% 5 28% 6 20%
Foreign Small/Mid Value 1 9 365 31% 6 36% 3 17%
Diversified Emerging Markets 1 1 34 613 15% 20 14% 15 17%
Diversified Pacific/Asia 1 1 5 373 40% 3 51% 3 32%
Pacific/Asia ex-Japan 1 1 6 504 31% 4 53% 3 13%
China Region 1 1 1 8 302 39% 5 64% 3 11%
India Equity 1 1 1 3 449 62% 2 94% 1 29%
Japan Stock 1 1 1 4 198 23% 2 31% 3 13%
Europe Stock 1 1 1 8 316 50% 3 71% 5 37%
Latin America Stock 1 1 1 3 439 16% 2 10% 2 21%
Total 254 623 28% 152 39% 102 24%

40
Panel B: Fund and Manager Characteristics Global Funds Regional Funds Country Funds
Presence
of Home-
biased
manager
Majority
managers
Home-
biased
Unbiased
Funds
t-value
(1)-(3)
Presence
of Home-
biased
manager
Majority
managers
Home-
biased
Unbiased
Funds
t-value
(4)-(6)
Presence
of Home-
biased
manager
Majority
managers
Home-
biased
Unbiased
Funds
t-value
(7)-(9)
(1) (2) (3) (4) (5) (6) (7) (8) (9)
Fund Characteristics
Fund Size ($ millions) 779 557 739
2.98***
733 647 555
7.28***
492 450 269
12.94*** Fund age 11.6 11.1 10.6 8.42*** 10.6 11.0 9.5 5.62*** 9.5 9.7 12.1 -7.19***
Fund return 9.2% 10.2% 9.2% 0.01 12.3% 12.1% 8.7% 2.59*** 12.9% 13.4% 6.7% 2.54**
Fund flow 7.3% 10.8% 7.9% -0.84 10.8% 14.0% 9.8% 0.55 8.0% 14.4% -2.5% 3.64***
Fund return volatility 17.2% 16.9% 17.6% -5.32*** 19.5% 19.1% 21.2% -10.3*** 19.3% 18.3% 22.1% -9.40***
Idiosyncratic volatility 6.3% 6.6% 6.8% -12.14*** 9.9% 9.6% 11.0% -12.32*** 10.8% 10.4% 12.6% -9.86***
Expense ratio 1.42% 1.45% 1.44% -3.33*** 1.63% 1.60% 1.62% 0.94 1.66% 1.60% 1.66% 0.16
Turnover 68.6% 75.1% 73.9% -9.93*** 62.7% 72.6% 76.6% -12.98*** 54.7% 64.9% 76.2% -12.74***
No. of stocks held 119 114 157 -14.93*** 106 114 168 -9.77*** 87 65 142 -4.50***
No. of countries invested 19.9 18.9 19.9 0.07 13.3 13.8 16.6 -11.90*** 8.6 8.6 8.1 1.47
No. of managers per fund 2.7 1.6 2.1 20.43*** 2.3 1.4 1.9 5.93*** 2.2 1.3 1.5 9.41***
Manager Characteristics
Manager tenure 5.2 5.3 5.6 -7.18*** 5.3 5.1 5.3 -0.10 5.2 4.4 5.1 0.66
Manager experience 16.3% 19.0% 5.9% 23.69*** 23.9% 20.8% 11.7% 10.11*** 23.2% 13.8% 18.6% 2.14**
Percentage with MBA 45.4% 41.1% 54.6% -14.70*** 47.3% 48.9% 49.5% -1.59 35.2% 24.2% 51.3% -7.31***
Percentage with Ph.D. 5.2% 3.6% 5.6% -1.41 4.2% 2.3% 4.7% -0.90 1.72% 0% 1.31% -1.00
Average funds per quarter 76 33 178 18 9 46 8 4 12
Total fund-months 15869 6446 35499 4125 2069 9466 1757 854 2505

41
Panel C: Distribution of Portfolio Manager National Origin
Country Code Country No. of managers
No. of home-biased
managers
ARG Argentina 4 3 AUS Australia 14 11 AUT Austria 2 2 BEL Belgium 3 2 BRA Brazil 11 11 CAN Canada 58 17 CHE Switzerland 5 5 CHL Chile 2 2 CHN China 39 38 COL Colombia 1 1 DEU Germany 9 8 DNK Denmark 1 1 ESP Spain 2 2 FRA France 11 10 GBR United Kingdom 222 177 GRC Greece 1 1 HKG Hong Kong 9 8 HRV Croatia 1 0 IND India 37 35 IRL Ireland 9 6 ISR Israel 2 2 ITA Italy 7 6 JPN Japan 23 22 KEN Kenya 1 0 KOR South Korea 6 6 MEX Mexico 4 4 NLD Netherlands 3 3 NOR Norway 2 2 NZL New Zealand 3 3 PAK Pakistan 1 1 POL Poland 2 0 RUS Russia 5 5 SGP Singapore 11 10 SWE Sweden 2 2 TUR Turkey 3 3 TWN Taiwan 2 2 UKR Ukraine 1 1 VEN Venezuela 2 2 ZAF South Africa 8 8
Total (non-U.S. undergraduate)
degrees)
529 422
USA United States 1326 0
Total 1855 422

42
Table 2
Security weights of home-biased managers’ portfolios.
This table presents the extent of overweighting of home-country stocks by home-biased managers of active U.S. international equity funds from 1991 to 2014. Results shown
are from the following regression: 𝑤𝑖,𝑐,𝑡 = 𝑓(𝐻𝐵𝑀𝑔𝑟𝑖,𝑐,𝑡 , controls). The dependent variable 𝑤𝑖,𝑐,𝑡 is the fraction of the fund i’s assets (total equity investments) invested in
firms headquartered in country c during a quarter t. If a fund does not invest in firms headquartered in a country during a quarter, we set the corresponding 𝑤𝑖,𝑐,𝑡 as missing.
𝐻𝐵𝑀𝑔𝑟𝑖,𝑐,𝑡 is the ratio of the number of home-biased managers of fund i from country c to the total number of managers of fund i during quarter t. Following is a hypothetical
example. During a quarter, Fund A in the World Stock Category has three managers in the management team. Suppose that one manager is educated in Canada, the second in
Brazil, and the third in the U.S. Fund A invests 40% of its portfolio in Canada, 30% in Brazil, 20% in Japan, and 10% in the U.S. In this case, there are two home-biased
managers. We assign the following values for 𝑤𝐴,𝑐,𝑡 and 𝐻𝐵𝑀𝑔𝑟𝐴,𝑐,𝑡in quarter 𝑡: 𝑤𝐴,𝑐,𝑡 𝐻𝐵𝑀𝑔𝑟𝐴,𝑐,𝑡
Canadian stocks 40% 1/3 Brazilian stocks 30% 1/3 Japanese stocks 20% 0/3
U.S. stocks 10% 0/3
All other control variables are as defined in Table 1, and measured at the end of previous quarter. Fund size, Fund age, and No. of managers have been taken natural logarithm.
Model (2) includes category and quarter fixed effects. Model (3) includes fund fixed effects. Model (4) includes country and quarter fixed effects. FE denotes fixed effects.
Standard errors are clustered at the country and year level. t-statistics are reported in parentheses. *, **, ***, represent significance at the 10%, 5%, and 1% levels, respectively.
Global Funds Regional Funds Country Funds
(1) (2) (3) (4) (1) (2) (3) (4) (1) (2) (3) (4)
𝐻𝐵𝑀𝑔𝑟 0.174*** 0.139*** 0.138*** 0.121*** 0.338*** 0.221*** 0.221*** 0.203*** 0.499*** 0.307*** 0.323*** 0.096***
(16.06) (18.10) (17.34) (9.46) (12.93) (12.85) (12.39) (11.25) (10.37) (11.23) (10.73) (5.40) Fund size -0.002*** -0.001 -0.001*** -0.003*** -0.001 -0.004*** -0.002 -0.003 -0.000
(-13.87) (-0.73) (-6.24) (-8.72) (-1.43) (-8.57) (-1.33) (-0.70) (-0.23)
Expense ratio 0.021 0.126 0.858*** 0.185 -0.087 1.182*** -0.171 -0.496 0.677 (0.43) (0.41) (6.38) (1.61) (-0.22) (4.53) (-0.44) (-0.30) (1.19)
Turnover -0.002*** -0.001 -0.003*** -0.001** -0.003** -0.007*** -0.002 -0.007 -0.004
(-6.36) (-1.27) (-7.04) (-2.25) (-2.21) (-9.44) (-0.70) (-1.40) (-1.36) Fund age 0.001*** -0.003 -0.000 0.001* -0.001 0.008*** -0.004 0.003 -0.006
(2.62) (-1.30) (-0.05) (1.70) (-0.25) (5.41) (-0.91) (0.30) (-1.27)
No. of managers -0.001*** -0.001 -0.002*** -0.000 -0.001 -0.004*** -0.006 0.002 0.000 (-4.71) (-1.17) (-4.20) (-0.29) (-0.73) (-4.30) (-1.52) (0.21) (0.09)
Constant 0.051*** 0.062*** 0.110***
(25.72) (27.73) (17.64)
Observations 464,578 401,785 401,785 401,785 91,384 79,002 79,002 79,002 14,755 12,664 12,664 12,664
Adj R2 0.027 0.151 0.203 0.337 0.088 0.403 0.431 0.443 0.141 0.509 0.537 0.828 Category×Quarter FE NO YES NO NO NO YES NO NO NO YES NO NO
Fund FE NO NO YES NO NO NO YES NO NO NO YES NO
Country×Quarter FE NO NO NO YES NO NO NO YES NO NO NO YES

43
Table 3
Security weights of home-biased managers’ portfolios. By country-level measures of information quality.
This table presents the extent of overweighting of home-country stocks by home-biased managers of active U.S. international equity funds from 1991 to 2014. The dependent
variable 𝑤𝑖,𝑐,𝑡 is the fraction of the fund i’s assets (total equity investments) invested in firms headquartered in country c during a quarter t. If a fund does not invest in firms
headquartered in a country during a quarter, we set the corresponding 𝑤𝑖,𝑐,𝑡 as missing. 𝐻𝐵𝑀𝑔𝑟𝑖,𝑐,𝑡 is as defined in Table 2. We categorize the sample by several country-level
measures of information quality. The home-biased manager’s home country is used to bifurcate the sample – emerging-market countries or not, high and low corporate opacity,
high and low disclosure index, and high and low cultural distance from the U.S. Developed markets are Canada, France, Germany, Italy, Japan, the United States, and the
United Kingdom. All other countries are considered as emerging markets. High and low corporate opacity are based on above- and below-median scores in Karolyi (2015,
Chapter 7). Median values on the Disclosure Index of World Bank’s World Governance Indicators (http://info.worldbank.org/governance/wgi/#home) each year are used to
determine high and low disclosure values. Cultural Distance is the Euclidean distance measure based on the six cultural dimensions proposed by Hofstede (2001), and again,
median values are used to classify high and low value countries. FE denotes fixed effects. Standard errors are clustered at the country and year level. t-statistics are reported
in parentheses. F-statistics are from tests of differences between the coefficients on HBMgr of each paired groups. The associated p-value is reported in the row below. *, **, ***,
represent significance at the 10%, 5%, and 1% levels, respectively.
Emerging
Markets
Developed
Markets
High Corporate
Opacity
Low Corporate
Opacity
Low Disclosure
Index
High Disclosure
Index
High Cultural
Distance to U.S.
Low Cultural
Distance to U.S.
𝐻𝐵𝑀𝑔𝑟 0.158*** 0.102*** 0.285*** 0.052*** 0.208*** 0.085*** 0.205*** 0.109***
(7.52) (7.54) (9.90) (13.13) (7.80) (7.33) (5.63) (8.98) Fund size -0.000 -0.005*** -0.000 -0.002*** -0.002*** -0.001*** 0.001* -0.001***
(-1.25) (-7.36) (-0.90) (-5.21) (-4.40) (-5.70) (1.78) (-7.09)
Expense ratio 1.496*** -1.058*** 1.953*** 0.343** 0.765*** 0.967*** 3.428*** 0.290** (11.77) (-3.73) (5.58) (2.14) (5.29) (3.58) (7.18) (2.54)
Turnover -0.004*** 0.000 -0.005*** -0.002*** -0.003*** -0.004*** -0.006*** -0.003***
(-13.13) (0.15) (-7.21) (-3.55) (-4.09) (-7.04) (-6.40) (-8.62) Fund age -0.004*** 0.010*** -0.003** 0.001 0.001 -0.001* -0.009*** 0.001
(-9.17) (6.24) (-2.13) (1.06) (1.13) (-1.67) (-6.56) (1.41)
No. of managers -0.003*** 0.000 -0.007*** 0.000 -0.002*** -0.002*** -0.006*** -0.003*** (-9.15) (0.12) (-7.56) (0.26) (-2.64) (-4.07) (-6.37) (-6.45)
Observations 300,958 100,827 115,505 223,461 228,276 161,524 52,189 317,891 Adj R2 0.184 0.247 0.385 0.314 0.328 0.362 0.193 0.407
Country×Quarter FE YES YES YES YES YES YES YES YES
F-Statistics 4.88** 66.95*** 17.70*** 0.00
7.23*** 0.00 p-value 0.03 0.00

44
Table 4
Fund security weights around home-biased manager turnover.
The table reports the average excess weights placed by the fund in home-country stocks around home-biased
manager turnover. The sample of turnovers are obtained for all actively managed U.S. international equity funds
during 1991-2014. Excess portfolio weights is the fund’s actual portfolio weight in a country over the
corresponding Morningstar category average weight for the country. New Home-Biased Manager represents the
hiring of home-biased manager whose home country is not the home country of any of the managers on the team.
A similar definition applies to a manager who departs the fund. Former Manager represents the departure of home-
biased manager whose home country is not the home country of any other managers on the team. We consider the
four quarters prior and four quarters post the turnover to compute the pre and post excess weights. Panel A reports
the excess weights around actual turnover dates. Panel B is similar, but the results are from using a random
turnover date instead of the actual turnover date. The random turnover date is chosen after excluding the first and
last 12 months of a fund and the 24 months before and 24 months after the actual manager turnover date. FE
denotes fixed effects. Robust t-statistics are reported in parentheses. *, **, ***, represent significance at the 10%,
5%, and 1% levels, respectively.
Panel A: Security weights of home-biased managers around their hiring and departure
Excess Weight Pre-turnover Post-turnover
Difference
(Post - Pre)
Stocks in former home-biased managers’ home countries 0.0159*** 0.0031 -0.0128***
(5.42) (0.92) (-2.88)
Number of turnover events 262
Number of observations 1040 1040 1039
Stocks in new home-biased managers’ home countries 0.0019 0.0196*** 0.0177***
(0.76) (6.91) (4.67)
Number of turnover events 319
Number of observations 1270 1270 1270
Panel B: Security weights around home-biased manager turnover – Pseudo tests (random turnover dates)
Excess Weight Pre-turnover Post-turnover
Difference
(Post - Pre)
Stocks in former home-biased managers’ home countries 0.0227*** 0.0277*** 0.0049
(5.52) (6.48) (0.83)
Number of observations 450 450 450
Stocks in new home-biased managers’ home countries 0.0128*** 0.0191*** 0.0063
(4.38) (6.30) (1.50)
Number of observations 797 797 797

45
Table 5
Fund flows to home-biased funds.
This table presents the estimates of monthly fund flows regressed on measures of home bias and control variables. The sample consists of all active U.S. international equity funds
from 1991-2014. The dependent variable is monthly fund flow, defined as the net inflow into a fund in a month: (TNAi,t−TNAi,t−1)/TNAi,t−1−ri,t where TNAi,t denotes fund i’s total net
assets in month t and rt denotes fund i’s return in month t. Home-biased managers are managers who received their undergraduate degree from a country that includes the geographical
mandate of the fund. Home-biased fund is a dummy variable, which takes the value 1 for funds with at least one home-biased manager, and 0 otherwise. Fraction home-biased is the
ratio of home-biased managers in the management team of a mutual fund. Fund return squared is the square of fund monthly return lagged by one month. Fund size, Turnover, Fund
age, and No. of managers have been taken natural logarithm. All other variables are lagged by one month and are as defined in Table 1. In model (6), (7), (8), we only include
observations with at least one home-biased manager. See Table 1 for variable definitions. FE denotes fixed effects. t-statistics are reported in parentheses. Standard errors are clustered
at the fund and year level. *, **, ***, represent significance at the 10%, 5%, and 1% levels, respectively. Global Funds Regional Funds Country Funds Global Funds Regional Funds Country Funds
(1) (2) (3) (4) (5) (6) (7) (8)
Home-biased fund 0.0021** 0.0014** 0.0017** 0.0042* 0.0066** (1.97) (2.13) (2.06) (1.82) (2.47)
Fraction home-biased funds 0.0019 0.0018 0.0117
(0.51) (0.19) (0.82) Fund size 0.0003 0.0002 -0.0003 -0.0002 -0.0047*** -0.0007 -0.0021 -0.0039**
(0.92) (0.93) (-1.14) (-0.28) (-3.34) (-1.19) (-1.54) (-1.99)
Fund return 0.0937*** 0.0841*** 0.0818*** 0.0974*** 0.1029*** 0.1032*** 0.1255*** 0.1322*** (14.40) (14.28) (13.98) (8.53) (5.69) (10.10) (5.93) (4.53)
Fund return squared 0.3407*** 0.3160*** 0.1974*** 0.3309*** 0.2479** 0.2694*** 0.3998** 0.3649*
(5.70) (5.38) (3.60) (3.72) (2.04) (3.61) (2.42) (1.78) Fund risk -0.1687*** -0.1380*** -0.1365*** -0.1666*** -0.1295 -0.1365*** -0.1042** -0.1634**
(-5.06) (-5.10) (-8.82) (-2.68) (-1.49) (-5.27) (-2.08) (-2.02)
Expense ratio 0.2096* 0.2174*** 0.0743 -0.0394 0.2330 0.0992 0.2430 0.6500 (1.80) (2.99) (0.89) (-0.17) (0.77) (0.67) (0.66) (1.19)
Turnover -0.0019*** -0.0018*** -0.0014*** -0.0025** -0.0026* -0.0016* -0.0021 -0.0045*
(-3.51) (-5.38) (-3.43) (-2.35) (-1.81) (-1.88) (-1.42) (-1.91) Fund age -0.0150*** -0.0151*** -0.0101*** -0.0197*** -0.0096*** -0.0068*** -0.0113*** -0.0124**
(-17.37) (-28.85) (-16.64) (-10.40) (-3.58) (-5.95) (-3.68) (-2.53)
No. of managers -0.0009 -0.0009* -0.0008 0.0016 0.0008 -0.0016 -0.0033 -0.0009 (-1.13) (-1.89) (-1.35) (0.93) (0.39) (-0.95) (-0.72) (-0.11)
Manager experience -0.0049** -0.0044*** -0.0045*** -0.0039 0.0045 -0.0034 -0.0084** -0.0060
(-2.37) (-3.44) (-2.83) (-1.33) (1.13) (-1.42) (-2.18) (-1.08)
Lagged fund flow 0.2443*** 0.2684*** 0.2577*** 0.2908***
(17.10) (10.50) (5.16) (4.24)
Observations 51,368 51,368 51,362 13,591 4,262 15,867 4,124 1,757
Adjusted R2 0.0457 0.0614 0.0986 0.0795 0.1125 0.1047 0.1200 0.1615
Category FE YES NO NO NO NO NO NO NO Year FE YES NO NO NO NO NO NO NO
Category × Year FE NO YES NO YES YES NO NO NO

46
Table 6
Fund flows around fund manager turnover events.
The table presents the results from regressions of fund flows around home-biased manager turnovers in active
U.S. international equity funds from 1991 to 2014. The dependent variable is the monthly fund flow. Post turnover
is a dummy variable, which takes the value of one for the 12 months following the manager turnover; and zero
for the 12 months prior to the turnover. New home-biased fund is a dummy variable and compares the hiring of
home-biased managers with hiring of unbiased managers. It takes the value of one if the fund without any home-
biased managers hires a whole team of home-biased managers (one home-biased manager if fund is not team
managed), and zero if a fund without any home-biased managers hires new unbiased managers. In a similar vein,
Old home-biased fund compares the departures of home-biased manager with an unbiased manager. It is a dummy
variable that takes the value of one if a fund where the whole team is home-biased before the turnover has not
home-biased manager after the turnover and equals zero for manager departures in funds without any home-biased
manager prior to the turnover. See Table 1 for definition of the other variables. FE denotes fixed effects. t-statistics
are reported in parentheses. Standard errors are clustered at the fund and year levels in all regressions. *, **, ***,
represent significance at the 10%, 5%, and 1% levels, respectively.
(1)
Home-biased
manager hiring
(2)
Home-biased
manager resignation
(3)
Home-biased
manager hiring
(4)
Home-biased
manager resignation
Post turnover -0.0013 -0.0035 0.0256*** -0.0571**
(-0.67) (-1.39) (3.49) (-2.07)
Post turnover × New home-biased fund 0.0239***
(2.69)
New home-biased fund -0.0085*
(-1.96)
Post turnover × Old home-biased fund -0.0486**
(-1.97)
Old home-biased fund -0.0049
(-0.31)
Fund size -0.0019** -0.0026** -0.0107 -0.0479**
(-2.30) (-2.11) (-0.55) (-2.26)
Fund return 0.0662*** 0.0836*** 0.2070 0.3091***
(3.53) (3.52) (1.48) (3.49)
Fund return2 0.4101** 0.6515*** 0.6469 1.3941
(2.14) (2.71) (0.63) (1.45)
Fund risk -0.1397* -0.2368*** 0.5883*** -0.6324*
(-1.92) (-2.60) (2.96) (-1.73)
Expense ratio 0.5366* 0.1242 0.7330 -2.1289
(1.86) (0.29) (0.59) (-0.19)
Turnover -0.0024** -0.0012 0.0064 -0.0059
(-1.97) (-0.74) (1.11) (-0.34)
Fund age -0.0142*** -0.0124*** 0.0073 -0.0329
(-7.15) (-4.89) (0.20) (-0.31)
Number of managers 0.0050** 0.0032 0.0045 0.1624
(2.43) (1.41) (0.25) (1.48)
Manager experience -0.0052 -0.0019 -0.0562*** -0.0258
(-0.93) (-0.26) (-3.18) (-0.80)
Observations 9,057 10,707 390 260
Turnover events 550 1,681 29 28
Adjusted R2 0.0547 0.0651 0.2165 0.4242
Category FE YES YES NO NO
Fund FE NO NO YES YES
Year FE YES YES NO NO

47
Table 7
Flow-performance sensitivity.
This table presents estimates of fund flow-performance sensitivity of active U.S. international equity funds during 1991-2014.The dependent variable is monthly fund flow.
Home-biased managers are those who received their undergraduate degree from a country that includes the geographical mandate of the fund. Home-biased fund is a dummy
variable, which takes the value of 1 for funds with at least one home-biased manager, and 0 otherwise. Fraction home-biased is the ratio of home-biased managers in the
management team. Fund return squared is the square of fund monthly return, lagged one month. Fund size, Turnover, Fund age, and Number of managers have been taken
natural logarithm. All other variables are lagged one month and are as defined in Table 1. In model (5), (6), (7), we only include observations with at least one home-biased
manager. t-statistics are reported in parentheses. Standard errors are clustered at the fund and year level. *, **, ***, represent significance at the 10%, 5%, and 1% levels,
respectively.
Global Funds Regional Funds Country Funds Global Funds Regional Funds Country Funds
(1) (2) (3) (4) (5) (6) (7)
Home-biased fund 0.0018* 0.0014* 0.0044* 0.0060
(1.71) (1.74) (1.91) (1.54)
Home-biased fund × Fund return 0.0379*** 0.0356*** 0.0429 0.0967**
(2.68) (2.83) (1.51) (2.00)
Fraction home-biased 0.0015 0.0024 0.0138
(0.40) (0.25) (0.98)
Fraction home-biased × Fund return 0.0474 -0.1126 -0.1937
(1.48) (-1.58) (-1.59)
Fund size 0.0003 -0.0003 -0.0002 -0.0049*** -0.0007 -0.0020 -0.0037*
(0.85) (-1.09) (-0.24) (-3.26) (-1.17) (-1.49) (-1.93)
Fund return 0.0800*** 0.0688*** 0.1027*** 0.1071*** 0.0687*** 0.1986*** 0.2625***
(10.68) (10.34) (7.94) (4.23) (3.31) (3.78) (3.32)
Fund risk -0.1160*** -0.1143*** -0.1591*** -0.1333* -0.1076*** -0.0580 -0.1212*
(-3.55) (-7.87) (-2.84) (-1.68) (-4.46) (-1.21) (-1.72)
Expense ratio 0.2059* 0.0770 0.0936 0.4306 0.1061 0.2529 0.6637
(1.77) (0.92) (0.39) (0.99) (0.72) (0.69) (1.20)
Turnover -0.0020*** -0.0014*** -0.0027*** -0.0035** -0.0016* -0.0022 -0.0046*
(-3.54) (-3.38) (-2.58) (-2.02) (-1.86) (-1.44) (-1.93)
Fund age -0.0150*** -0.0102*** -0.0200*** -0.0087** -0.0068*** -0.0114*** -0.0127***
(-17.38) (-16.72) (-10.29) (-2.49) (-5.97) (-3.71) (-2.61)
No. of managers -0.0008 -0.0008 0.0014 -0.0007 -0.0016 -0.0037 -0.0010
(-1.10) (-1.35) (0.80) (-0.27) (-0.95) (-0.82) (-0.13)
Manager experience -0.0048** -0.0044*** -0.0036 0.0010 -0.0035 -0.0085** -0.0060
(-2.36) (-2.82) (-1.16) (0.17) (-1.44) (-2.19) (-1.08)
Lagged fund flow 0.2448*** 0.2684*** 0.2575*** 0.2930***
(17.10) (10.49) (5.14) (4.31)
Observations 51,368 51,362 13,591 4,262 15,867 4,124 1,757
Adjusted R2 0.0449 0.0985 0.0601 0.0726 0.1044 0.1194 0.1623
Category FE YES NO YES YES NO NO NO
Year FE YES NO YES YES NO NO NO

48
Table 8
Performance of funds with home-biased managers.
This table presents the performance comparison of funds with home-biased managers with funds without home-biased managers. The sample consists of all active U.S. international
equity funds during the period 1991-2014. We use a standard calendar time portfolio approach to compute monthly portfolio returns. We long a portfolio of funds with home-biased
managers and sell short a portfolio of funds without home-biased managers. Portfolios are rebalanced quarterly. For value-weighted portfolios, each fund’s return is weighted by the
weight of the fund’s total net assets at the end of the previous quarter. We require at least three funds in the quarter in both the long and short portfolio to be included in the tests.
Tables report the raw fund returns and the Fama-French Global Market, SMB, HML, and MOM factors adjusted returns. Raw fund returns are calculated by summing one-twelfth
of the annual expense ratios to the net of fees fund returns reported by Morningstar. Robust t-statistics are shown in parentheses. *, **, ***, corresponds to significance to the 10%,
5%, and 1% levels, respectively.
Global Funds Regional Funds Country Funds
Value Weighted Equally weighted Value Weighted Equally weighted Value Weighted Equally weighted
Raw Return -0.0000 -0.0005 0.0027* 0.0004 0.0033** 0.0026*
(-0.03) (-1.16) (1.85) (0.31) (2.03) (1.73)
Alpha -0.0001 -0.0006 0.0032** 0.0005 0.0043** 0.0031*
(-0.18) (-1.19) (2.04) (0.42) (2.38) (1.84)
G_Mkt-RF -0.0275** -0.0158 -0.0887*** -0.0850*** -0.0322 -0.0417
(-2.50) (-1.64) (-2.60) (-3.32) (-0.81) (-1.31)
G_SMB -0.0205 -0.0440** -0.1256* -0.2016*** -0.0213 -0.1114
(-0.80) (-2.05) (-1.66) (-3.40) (-0.25) (-1.54)
G_HML 0.0069 0.0238 -0.0621 0.0323 -0.0533 0.0291
(0.29) (1.04) (-0.96) (0.60) (-0.77) (0.46)
G_MOM 0.0301** 0.0090 0.0256 0.0301 -0.0936** -0.0520
(2.32) (0.71) (0.60) (0.78) (-2.20) (-1.19)
Observations 282 282 256 256 231 231
R2 0.0490 0.0325 0.0455 0.0944 0.0238 0.0327

49
Table 9
Performance of home-biased managers’ home-country and non-home-country stocks.
This table reports security-level portfolio performance comparison of home-biased managers and unbiased managers. The sample consists of all active U.S.
international equity funds during the period 1991-2014. For the results reported in Panel A, at the beginning of a quarter, we long home-biased managers’ home-
country stocks and sell short stocks from the same country but held by unbiased funds in the same corresponding category (As an example, suppose that at the
beginning of a quarter the China region fund category has two funds. One has only Chinese managers. The other one has only U.S. managers. In this case, the long
side consists of all Chinese stocks held by the fund with Chinese managers, and the short side consissts of all the Chinese stocks held by the fund with U.S. managers).
We exclude ADRs from the analysis, but perform a similar analysis with just ADRs and report it in Panel B. An analysis based on the home-biased manager’s non-
home-country portfolio is presented in Panel C. For this purpose, the long side holds all home-biased managers’ non-home-country stocks and the short side has all
the stocks held by unbiased managers. In the short side (unbiased manager portfolio), we exclude fund managers’ home-country stocks (In the example mentioned
in parentheses above, for the China region fund with Chinese managers, the non-home-country portfolio includes all the non-Chinese stocks held by the fund. For
the China region fund with only U.S. managers, the non-home-country portfolio includes all the stocks held by the fund excluding U.S. stocks). We use standard
calendar time portfolio approach to compute monthly portfolio returns. Portfolios are rebalanced every calendar quarter. For all the analyses presented in this table,
within a given fund portfolio, each stock is weighted by the fund’s dollar holdings of the stock as a fraction of the fund’s total dollar holdings of all selected stocks.
Finally, we weight individual fund portfolios by the fund’s total net asset value at the end of the previous quarter. We require at least three funds in the long and
short portfolio in the quarter for it to be considered for analysis. In Panels A and B, we report raw return and the Fama-French Global ex U.S. Market, SMB, HML,
and MOM factors adjusted returns. In Panel C, we report the raw return and the Fama-French Global Market, SMB, HML, and MOM factors adjusted returns. We
also report the results shorting the U.S. Treasury bill. Robust t-statistics are reported in parentheses. Significant levels are denoted by *, **, ***, which corresponds to
the 10%, 5%, and 1% levels, respectively.
Panel A: Performance of home-biased managers’ home-country stocks Global Funds Regional Funds Country Funds
Long -Short Long – T bill Long -Short Long – T bill Long -Short Long – T bill
Raw Return 0.0023 0.0092*** 0.0049* 0.0112** 0.0044* 0.0073
(1.34) (2.77) (1.69) (2.43) (1.80) (1.63)
Alpha 0.0031* 0.0054*** 0.0065** 0.0072** 0.0059** 0.0047**
(1.69) (2.67) (2.21) (2.33) (2.29) (2.04)
F_Mkt-RF -0.0001 0.9677*** -0.0098 1.1568*** 0.0256 1.1183***
(-0.00) (18.09) (-0.16) (16.88) (0.43) (17.31)
F_SMB 0.0350 0.1669* -0.0466 0.3395*** 0.0735 0.2010*
(0.42) (1.79) (-0.36) (2.62) (0.54) (1.71)
F_HML -0.0204 0.0977 -0.2371* -0.2074* -0.0601 -0.3477***
(-0.25) (0.78) (-1.85) (-1.67) (-0.59) (-3.65)
F_MOM -0.0931* -0.0554 -0.0570 0.0552 -0.1988** -0.0777
(-1.86) (-1.04) (-0.71) (0.71) (-2.53) (-1.28)
Observations 282 282 237 237 207 207
R2 0.0136 0.672 0.0145 0.600 0.0533 0.7711

50
Table 9 (continued)
Performance of home-biased managers’ home-country and non-home-country stocks.
Panel B: Performance of home-biased managers’ home-country ADRs. Global Funds Regional Funds Country Funds
Long -Short Long – T bill Long -Short Long – T bill Long -Short Long – T bill
Raw Return 0.0027 0.0118** -0.0083 0.0043 -0.0061 -0.0010
(0.80) (2.45) (-1.27) (0.51) (-0.90) (-0.11)
Alpha 0.0055 0.0071* -0.0012 0.0089 -0.0034 0.0069
(1.53) (1.88) (-0.20) (1.44) (-0.47) (0.94)
F_Mkt-RF -0.1220** 1.0786*** -0.1437 1.2123*** -0.1380 1.0029***
(-2.04) (13.94) (-1.01) (8.52) (-1.05) (7.48)
F_SMB 0.0895 0.1775 -0.7485** -0.4039 -0.1923 -0.2577
(0.48) (0.99) (-2.23) (-1.32) (-0.52) (-0.62)
F_HML -0.3235 -0.4758** -0.8137*** -0.9089*** -0.1924 -0.9307**
(-1.53) (-2.57) (-3.09) (-2.66) (-0.69) (-2.24)
F_MOM -0.1340 -0.0032 -0.3720** -0.4927*** -0.3522 -0.5068**
(-1.07) (-0.03) (-2.23) (-2.61) (-1.58) (-2.26)
Observations 243 243 180 180 138 138
R2 0.0302 0.4660 0.0886 0.4483 0.0305 0.3981
Panel C: Performance of home-biased managers’ non-home-country stocks. Global Funds Regional Funds Country Funds
Long -Short Long – T bill Long -Short Long – T bill Long -Short Long – T bill
Raw Return -0.0003 0.0059* 0.0022 0.0088** 0.0029 0.0079**
(-0.46) (1.96) (1.37) (2.42) (1.54) (2.02)
Alpha 0.0000 -0.0001 0.0029 0.0039** 0.0049** 0.0035*
(0.05) (-0.15) (1.62) (2.04) (2.46) (1.77)
G_Mkt-RF -0.0276* 1.1215*** -0.1034*** 1.1399*** -0.0932** 1.1243***
(-1.70) (43.95) (-3.15) (28.39) (-2.22) (26.22)
G_SMB -0.0139 0.2377*** -0.1223 0.3291*** -0.0929 0.1925
(-0.40) (5.15) (-1.49) (4.94) (-0.92) (1.54)
G_HML -0.0286 -0.0098 -0.0814 -0.1964** -0.2123** -0.3329***
(-0.69) (-0.19) (-0.95) (-2.45) (-2.10) (-3.45)
G_MOM -0.0162 0.0420* 0.0165 -0.0155 -0.1262** 0.0061
(-0.66) (1.73) (0.35) (-0.35) (-2.32) (0.09)
Observations 288 288 261 261 231 231
R2 0.0115 0.8924 0.0411 0.7637 0.0569 0.7924

51
Table 10
Performance of home-biased managers’ home-country stocks. By country-level measures of information quality.
In this table, we report the performance of home-biased managers’ home-country stocks of active U.S. international equity funds from 1991-2014. We categorize
the sample by several country-level measures of information quality. The home-biased manager’s home country is used to bifurcate the sample – emerging-market
countries or not, high and low corporate opacity, high and low disclosure index, and high and low cultural distance from the U.S. Developed markets are Canada,
France, Germany, Italy, Japan, the United States, and the United Kingdom. All other countries are considered as emerging markets. High and low corporate opacity
are based on above- and below-median scores in Karolyi (2015, Chapter 7). Median values on the Disclosure Index of World Bank’s World Governance Indicators
(http://info.worldbank.org/governance/wgi/#home) each year are used to determine high and low disclosure values. Cultural Distance is the Euclidean distance
measure based on the six cultural dimensions proposed by Hofstede (2001), and again, median values are used to classify high and low value countries. We follow
the presentation in Table 9, in which the long-short portfolios buy home-biased managers’ home-country stocks and sell short U.S. Treasury bill. We report raw
returns and the Fama-French Global ex U.S. market, SMB, HML, and MOM factors-adjusted returns. Robust t-statistics are reported in parentheses. Significant
levels are denoted by *, **, ***, which corresponds to the 10%, 5%, and 1% levels, respectively.
Emerging
Markets
Developed
Markets
High Corporate
Opacity
Low Corporate
Opacity
Low Disclosure
Index
High Disclosure
Index
High Cultural
Distance to U.S.
Low Cultural
Distance to U.S.
Raw Return 0.0121** 0.0071** 0.0116* 0.0052 0.0132*** 0.0066** 0.0146* 0.0087***
(2.30) (2.45) (1.96) (1.23) (2.89) (2.09) (1.95) (2.71)
Alpha 0.0082** 0.0041** 0.0082* 0.0032** 0.0065** 0.0044** 0.0111* 0.0046***
(1.99) (2.46) (1.87) (2.27) (2.44) (2.22) (1.78) (2.61)
F_Mkt-RF 1.0330*** 0.8549*** 1.1426*** 1.0359*** 1.2208*** 0.8755*** 1.0816*** 0.9821***
(12.56) (21.58) (12.10) (29.56) (22.27) (21.10) (8.07) (22.57)
F_SMB 0.5493*** -0.0218 0.7278*** -0.0558 0.0558 0.1674* 0.6277 0.0892
(2.97) (-0.27) (3.85) (-0.72) (0.47) (1.85) (1.47) (1.06)
F_HML 0.1543 -0.0028 -0.0402 -0.0971 0.1461 -0.0403 0.1371 0.0653
(0.92) (-0.03) (-0.21) (-0.93) (1.30) (-0.45) (0.53) (0.62)
F_MOM -0.1563 -0.0363 -0.0211 -0.0423 0.1730** -0.1445*** -0.0912 -0.0038
(-1.50) (-0.72) (-0.17) (-1.03) (2.52) (-2.64) (-0.41) (-0.07)
Observations 207 282 177 177 225 282 198 282
R2 0.4777 0.7035 0.5419 0.9004 0.7041 0.6542 0.2632 0.7379

Table 11
Active share, industry concentration, cash holdings, and turnover of home-biased managers.
This table reports results from regressions of various holding-based measures for active U.S. international equity funds during the 1991-2014 period. Active share is a measure of
the share of portfolio holdings that differ from the corresponding category index holdings, computed as ½*∑ |Wi,s,t- WIndex,s,t| where Wi,s,t denotes fund i’s weight in stock s in quarter
t and Windex,s,t denotes fund i’s category corresponding index`s weight in stock s in quarter t. Active share measures the deviation of fund portfolio from the index (Cremers and
Petajisto (2009)). We use the weight of a stock held by all funds in a category as the proxy for the weight of the stock in the category index fund holdings. For industry concentration
and Active Share, we also construct corresponding measures only based on home-biased managers` home-country stocks of each category. Industry concentration is a measure of
the diversity of the fund holdings based on Kacperczyk, Sialm, and Zheng (2005), and is computed as ∑ (Wi,s,t- Wc,s,t)2 where Wi,s,t denotes fund i’s weight in industry s stocks in
quarter t and Wc,s,t denotes fund i’s category average weight in industry s stocks in quarter t. When computing the measures with home-biased managers’ home-country stocks, we
only include the home-country stocks of the home-biased funds. For unbiased funds in the same category, we only consider the stocks held by the funds in the same countries as of
the home-biased managers in the same category and quarter. Turnover is the fund’s annual turnover rate. Number of stocks is the natural logarithm of the number of stocks held by
a fund. Cash holding is the percentage of total assets that is held in cash in a quarter. Short position is the percentage of assets a fund allocates to the short selling positions of assets.
Home-biased fund is a dummy variable, which takes the value of 1 for funds with at least one home-biased manager and 0 otherwise. All other variables are lagged by one quarter
and have previously been defined in Table 1. Fund and manager characteristics are included as controls in the regressions. t-statistics are reported in parentheses. The standard errors
are clustered at fund and year level. *, **, ***, represent significance at the 10%, 5%, and 1% levels, respectively.
Active Share
Active Share
(only home-
biased managers’
home-country
stocks)
Industry
concentration
Industry
concentration
(only home-biased
managers’ home-
country stocks)
Turnover Number of
stocks
Cash holding
(%)
Short position
(%)
Home-biased fund 0.0028 0.1462*** -0.0021 0.1693*** -0.0351** -0.0799*** -0.2357* -0.0288
(0.87) (42.88) (-1.17) (26.50) (-2.23) (-4.07) (-1.85) (-0.46)
Controls YES YES YES YES YES YES YES YES
Observations 18,349 17,543 18,317 17,385 17,847 18,551 17,437 17,437
Adjusted R2 0.396 0.4459 0.1030 0.2007 0.1487 0.1763 0.0868 0.0247
Category FE YES YES YES YES YES YES YES YES
Year FE YES YES YES YES YES YES YES YES

53
Table 12 Heckman and Switching Regression Models of Home-biased Managers’ Home-Country Portfolio Performance
This table presents the analyses of performance of home-biased managers’ home-country portfolios using Heckman two-stage regressions and switching regressions. The sample
consists of all active U.S. international equity funds from 1991-2014. The dependent variables are monthly alphas of from regressions of portfolio returns on the Fama-French Global
ex U.S. market, SMB, HML, and MOM factors. At the beginning of a quarter, for a fund with home-biased managers, the home-country portfolio consists of all home-biased
managers’ home-country stocks held by the fund. The corresponding portfolio for unbiased funds consists of stocks from the home countries of the home-biased managers in the
same Morningstar category (For example, suppose that at the beginning of a quarter, China region fund category only has two funds. One has only Chinese managers. The other one
has only U.S. managers. For the China region fund with Chinese managers, the home-country portfolio includes the Chinese stocks held by the fund. For the China region fund with
only U.S. managers, the corresponding home-country portfolio also includes only the Chinese stocks held by the fund). We exclude ADRs from the analysis. Within a given fund
portfolio, each stock is weighted by the fund’s dollar holdings of the stock as a fraction of the fund’s total dollar holdings of all selected stocks. Mandate refers to the geographical
diversification of the fund. The variable takes the value of 1 for funds in categories: World Stock, Foreign Large Blend, Foreign Large Growth, Foreign Large Value, Foreign
Small/Mid Blend, Foreign Small/Mid Growth, Foreign Small/Mid Value. It takes the value of 2 for funds in categories: Diversified Emerging Markets Diversified Pacific/Asia,
Pacific/Asia ex-Japan, and 3 for funds in categories: China Region, India Equity, Japan Stock, Europe Stock, Latin America Stock. Recent 5-year trend is the ratio of the average
percentage of funds with home-biased managers within a category (excluding the fund itself) over the recent five years to the average percentage of funds with home-biased managers
of all funds across all categories (excluding the fund itself) over the recent five years. Fund size, Fund age, and No. of managers have been taken natural logarithm. U.S. market
index is the monthly CRSP value-weighted returns. Global market index is the monthly return of MSCI world ex U.S. market index. VIX is the volatility index calculated and
published by the Chicago Board Options Exchange (CBOE), and measures the 30-day implied volatility of the S&P 500 Index Options. Home-biased fund is a dummy variable,
taking the value of 1 if a fund has at least one home-biased manager, and 0 otherwise. All other variables are lagged one month and are as defined in Table 1. We report results from
panel regressions of alphas in columns (1) to (3). Columns (4) to (6) report results from the Heckman selection model, with the first stage selection equation reported in Column (4).
The dependent variable in the selection equation takes the value of 1 if the fund has home-biased managers and 0 otherwise. The last two columns present the second stage of the
switching regressions. Columns titled Home-biased and Unbiased refer to funds with home-biased managers and with no home-biased managers, respectively. Actual alphas are the
monthly portfolio alphas for funds managed by home-biased (unbiased) managers; hypothetical alphas are the expected monthly home-country portfolio alphas if funds with home-
biased (unbiased) managers are managed by unbiased (home-biased) managers. The improvement is the difference between the hypothetical alphas and the actual alphas. We also
test whether the coefficients on Mandate and Recent 5-year trend are jointly zero and report the Chi-square (χ2) statistics. Z-statistics for the Probit regression. Standard errors are
clustered at fund and year level for panel regressions. t-statistics are reported in parentheses. *, **, ***, represent significance at the 10%, 5%, and 1% levels, respectively.

54
Table 12 (continued)
Heckman and Switching Regression Models of Home-biased Managers’ Home-Country Portfolio Performance.
Panel Regressions Heckman Two-Stage Regressions Switching Regressions
(1) (2) (3) (4) Selection
(5) Outcome
(6) Outcome
(7)
Home-biased
(8)
Unbiased
Fund size 0.0004** 0.0003* 0.0003* -0.0113*** 0.0003 0.0002 0.0004 0.0002 (2.15) (1.68) (1.76) (-2.94) (1.54) (1.49) (0.90) (1.02) Fund return 0.0088
(0.09)
Fund risk 0.0973*** 0.1174*** 0.1038*** -1.4670*** 0.1015*** 0.1025*** 0.1166*** 0.0976*** (3.00) (3.23) (6.44) (-5.88) (7.89) (7.96) (3.89) (7.19) Expense ratio 0.2055*** 0.1818*** 0.1023 2.9216** 0.1230** 0.1212** 0.0859 0.1317** (3.10) (2.62) (1.59) (2.14) (2.09) (2.06) (0.68) (2.04) Turnover -0.0009* -0.0009** -0.0013*** 0.0449*** -0.0013*** -0.0012*** -0.0022** -0.0008* (-1.90) (-1.98) (-2.71) (6.85) (-3.02) (-2.78) (-1.96) (-1.87) Fund age -0.0004 -0.0002 -0.0003 0.1279*** 0.0001 0.0002 0.0002 0.0003 (-1.01) (-0.50) (-0.79) (13.99) (0.32) (0.35) (0.19) (0.67) No. of managers -0.0001 -0.0002 -0.0002 0.4075*** 0.0010 0.0010 -0.0019 0.0024*** (-0.35) (-0.53) (-0.53) (42.75) (1.42) (1.47) (-1.22) (3.05) Manager experience -0.0026* -0.0017 -0.0027** -0.0017 -0.0025** -0.0027 -0.0023* (-1.96) (-1.27) (-2.01) (-1.60) (-2.33) (-1.34) (-1.75) Lagged fund flow 0.0054 0.0061 0.0022 0.1362* 0.0028 0.0027 -0.0057 0.0060
(1.41) (1.59) (0.54) (1.65) (0.76) (0.73) (-0.69) (1.53) U.S. market index -0.1068*** -0.1069*** -0.1069*** -0.0962*** -0.1116***
(-8.01) (-9.22) (-9.22) (-3.68) (-9.02) Global market index 0.0825*** 0.0824*** 0.0823*** 0.0851*** 0.0814*** (7.16) (7.95) (7.94) (3.65) (7.36) VIX -0.0072* -0.0074** -0.0077** -0.0065 -0.0083** (-1.66) (-2.17) (-2.24) (-0.84) (-2.27) Mandate -0.0996*** (-10.24) Recent 5-year trend 0.3846*** (25.75) Inverse Mills ratio 0.0036** 0.0047** -0.0016 0.0078*** (2.08) (2.17) (-0.34) (3.26) Home-biased fund 0.0018*** 0.0020*** 0.0021*** 0.0022*** (2.72) (2.89) (3.05) (4.05) Observations 39,963 39,963 39,963 55,447 39,963 39,963 11,507 28,456 Pseudo R2 (Adj R2) 0.0799 0.0802 0.0045 0.0394 0.0039 0.0043 0.0036 0.0056 Category FE NO YES NO NO NO NO NO NO Month FE YES YES NO NO NO NO NO NO χ2 statistic 821.03*** p-value 0.00 What-if analysis Actual Alphas 0.28% 0.10% Hypothetical Alphas 0.06% 0.28% Improvement -0.22%*** 0.18%***
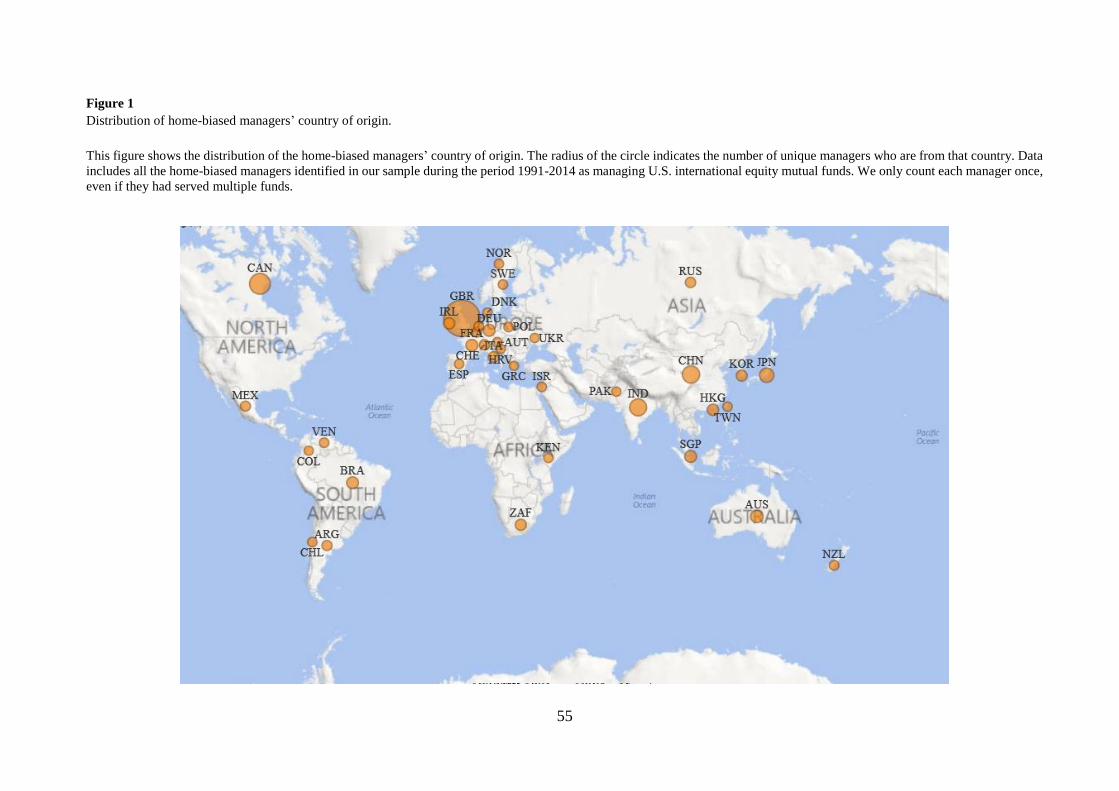
55
Figure 1
Distribution of home-biased managers’ country of origin.
This figure shows the distribution of the home-biased managers’ country of origin. The radius of the circle indicates the number of unique managers who are from that country. Data
includes all the home-biased managers identified in our sample during the period 1991-2014 as managing U.S. international equity mutual funds. We only count each manager once,
even if they had served multiple funds.

56
Figure 2.
Presence of home-biased managers. By count and a fraction of all international funds.
This figure shows the percentage of funds with home-biased managers and the number of home-biased managers in global funds, regional funds, and various country funds.
Figure 2. (continued)
0
50
100
150
200
250
0%
5%
10%
15%
20%
25%
30%
35%
40%
45%
50%
All Funds
% of Funds with Home-biased Managers No. of Home-biased Managers
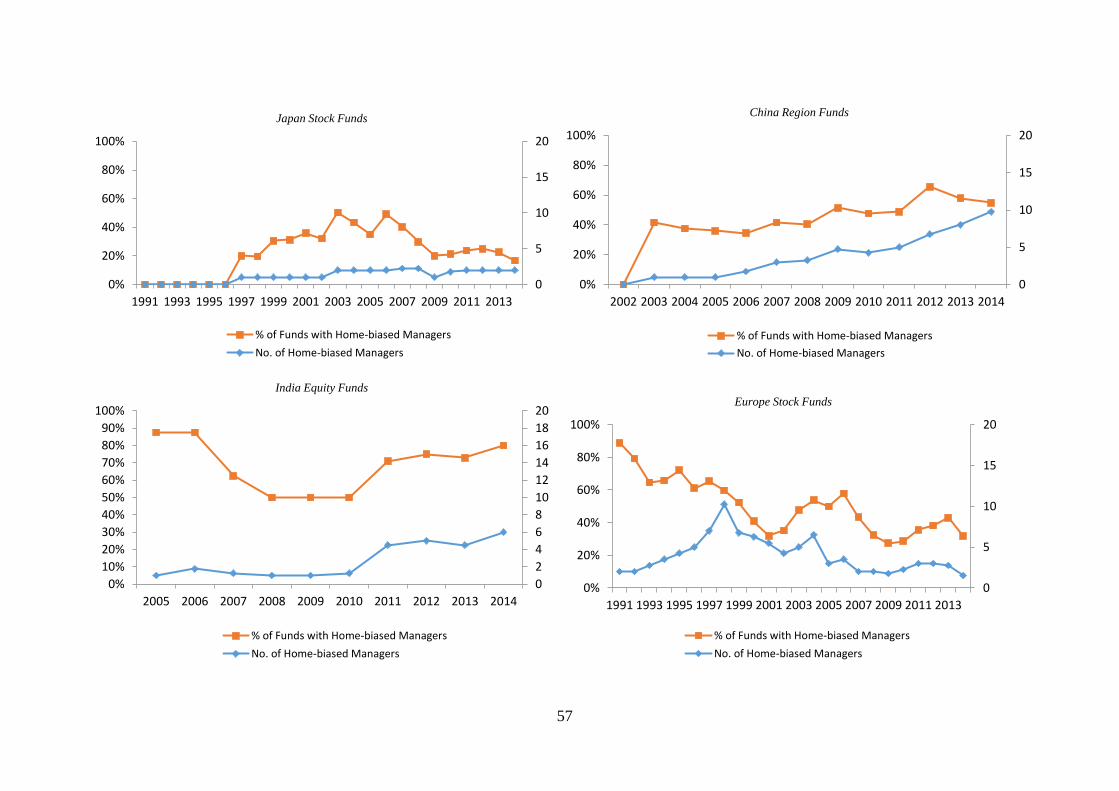
57
0
5
10
15
20
0%
20%
40%
60%
80%
100%
1991 1993 1995 1997 1999 2001 2003 2005 2007 2009 2011 2013
Japan Stock Funds
% of Funds with Home-biased Managers
No. of Home-biased Managers
0
5
10
15
20
0%
20%
40%
60%
80%
100%
2002 2003 2004 2005 2006 2007 2008 2009 2010 2011 2012 2013 2014
China Region Funds
% of Funds with Home-biased Managers
No. of Home-biased Managers
0
2
4
6
8
10
12
14
16
18
20
0%
10%
20%
30%
40%
50%
60%
70%
80%
90%
100%
2005 2006 2007 2008 2009 2010 2011 2012 2013 2014
India Equity Funds
% of Funds with Home-biased Managers
No. of Home-biased Managers
0
5
10
15
20
0%
20%
40%
60%
80%
100%
1991 1993 1995 1997 1999 2001 2003 2005 2007 2009 2011 2013
Europe Stock Funds
% of Funds with Home-biased Managers
No. of Home-biased Managers

Figure 3.
Overweighting of Home-Country Stocks by Home-Biased Managers.
The plots below display the overweighting on home-country stocks by home-biased managers. We plot the coefficients on 𝐻𝐵𝑀𝑔𝑟𝑖,𝑐,𝑡 from the following regression: 𝑤𝑖,𝑐,𝑡 =
𝑓(𝐻𝐵𝑀𝑔𝑟𝑖,𝑐,𝑡) in Table 3. The dependent variable 𝑤𝑖,𝑐,𝑡 is the fraction of the fund’s assets invested in firms headquartered in country c during a quarter t. 𝐻𝐵𝑀𝑔𝑟𝑖,𝑐,𝑡 is the ratio of
the number of managers of fund i from country c to the total number of managers of fund i during quarter t. The results are based on global funds. We first run the above regression
by countries and report results ranked by the coefficients. We then run the above regression by years and report the coefficients.
-20%
-10%
0%
10%
20%
30%
40%
50%
60%
70%
0%
5%
10%
15%
20%
25%
30%
1991 1992 1993 1994 1995 1996 1997 1998 1999 2000 2001 2002 2003 2004 2005 2006 2007 2008 2009 2010 2011 2012 2013 2014

Appendix A. Screenshots of examples of Morningstar management reports.

60
Appendix A. Screenshots of examples of Morningstar management reports. (continued).

61
Appendix B. Variable definitions.
The following table summarizes the variables used in the paper from the following databases: MS,
Morningstar Database; CRSP, CRSP Monthly Stock File; DS, Thomson Reuters Datastream Professional
Platform; and, KF, Kenneth French Data Library.
Variable Name Description Source
Home-biased manager A manager who earned the bachelor’s degree from the objective investment
regions/countries of the mutual fund under his/her management.
MS
Fraction home-biased The ratio of home-biased managers to all managers of a mutual fund. MS
𝐻𝐵𝑀𝑔𝑟𝑖,𝑐,𝑡 The ratio of the number of home-biased managers of fund i from country c
to the total number of managers of fund i in quarter t.
MS
Manager tenure The average tenure of all managers of a mutual fund. MS
Managers experience The ratio of managers who have past working experience on the objective
investment regions/countries of a mutual fund.
MS
Percentage with MBA The percentage of managers with MBA degrees of a mutual fund. MS
Percentage with Ph.D. The percentage of managers with Ph.D. degrees of a mutual fund. MS
Fund size The total net assets of a mutual fund in $ millions. MS
Fund return The monthly returns of a mutual fund. MS
Fund return2 The square of monthly returns of a mutual fund. MS
Fund risk The standard deviation of past 12 monthly fund returns. MS
Expense ratio The annual expense ratio of a mutual fund. MS
Turnover The annual turnover rate of a mutual fund. MS
Fund age The fund age of a mutual fund at the beginning of a year. MS
No. of managers The number of managers manage a mutual fund. MS
Fund flow Computed as (TNAi,t−TNAi,t−1)/TNAi,t−1−ri,t where TNAi,t denotes fund i’s
total net assets in month t and rt denotes fund i’s return in month t.
MS
Country holdings weight The weight in a mutual fund’s portfolio for stocks headquartered in a
country.
MS
Category ave. weight The average portfolio weight in a country of all funds within same
Morningstar category.
MS
Fund Idiosyncratic
Volatility
The standard deviation of error terms from the monthly Fama/French global
four-factor model regressions of past 12 monthly fund returns.
MS/KF
Active share Computed as ½*∑ |Wi,s,t- WIndex,s,t| where Wi,s,t denotes fund i’s weight in
stock s in quarter t and Windex,s,t denotes fund i’s category corresponding
index’s weight in stock s in quarter t. We use the weight of a stock held by
all funds in a category as the proxy for the weight of the stock in the category
index fund holdings.
MS
Industry concentration Computed as ∑ (Wi,s,t-Wc,s,t)2 where Wi,s,tdenotes fund i’s weight in
industry s in quarter t and Wc,s,t denotes fund i’s category average weight in
industry s in quarter t.
MS
Risk free rate U.S. one-month Treasury bill rate. KF
G_Mkt-RF Fama/French global market factor. KF
G_SMB Fama/French global SMB factor. KF
G_HML Fama/French global HML factor. KF
G_MOM Fama/French global momentum factor. KF
F_Mkt-RF Fama/French global ex U.S. market factor. KF
F_SMB Fama/French global ex U.S. SMB factor. KF
F_HML Fama/French global ex U.S. HML factor. KF
F_MOM Fama/French global ex U.S. momentum factor. KF