Is there a Business Case for Microinsurance? · PDF fileIs there a Business Case for...
19
Is there a Business Case for Microinsurance? Synthesizing 3 years of learning Richard Koven Business Case Project Manager The MILK Project March 2014
Transcript of Is there a Business Case for Microinsurance? · PDF fileIs there a Business Case for...

Is there a Business Case for Microinsurance?
Synthesizing 3 years of learning Richard Koven Business Case Project Manager The MILK Project March 2014

“There is a business case when the investment of capital and other resources in microinsurance are justified over time such that the benefits, costs and risks balance out to create a commercial rationale for an insurer, distributor, and intermediary to enter and sustain a position in microinsurance”
Is it profitable?

India Health
Philippines Life
Colombia Life
Kenya Health
Global Intermediaries
…looking at 5 year financial results including covered lives, premium earned claims, distribution and administrative expenses and profits
As of 2012, these firms covered 48 million people with USD 276 Million earned premium
MILK studied 20 firms intensively

Competition
Subsidy Business
Model Product Type
Distribution Enrollment
Mode
Scale Program
Age
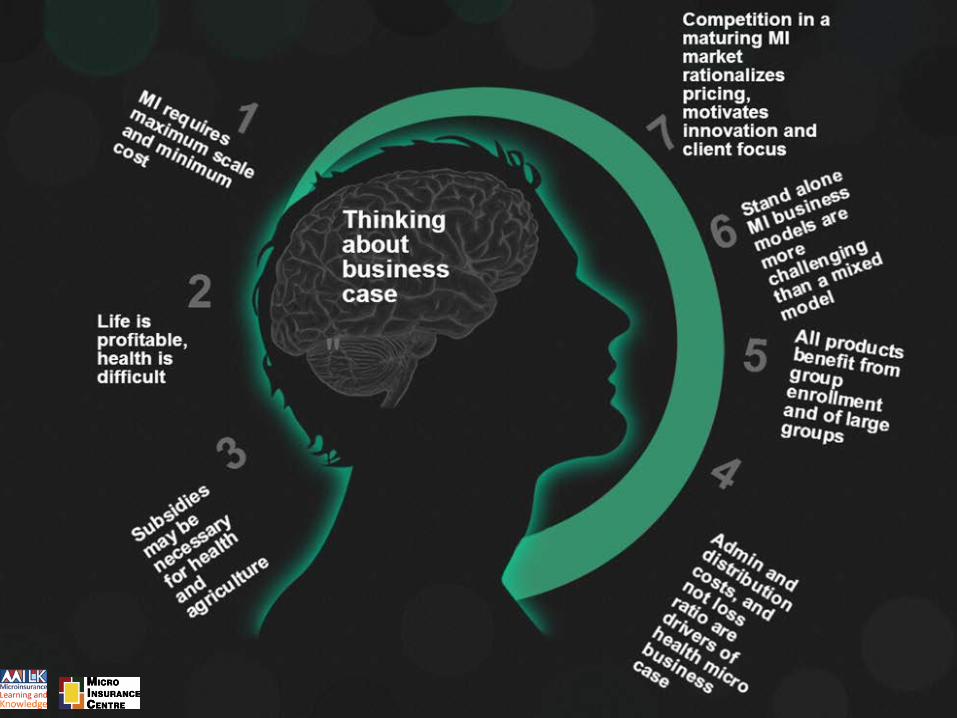
Eight Drivers of Microinsurance Business Case

…a big slice EU life policy EUR 1,150
…a small slice Colombia micro life EUR 17 Philippines micro life EUR 4
Scale

…a tiny slice Kenya micro health USD 6.18 India micro health USD 3.21
US health plan USD 4,250 …a big slice
Scale

margin
distribution & admin
claims Margin
-18%
Claims
57%
Admin
61%
Scale
The upside down Triangle
MILK Study Composite Private HMIs 2008-2012
microinsurance profitability relies on massive scale at minimal cost
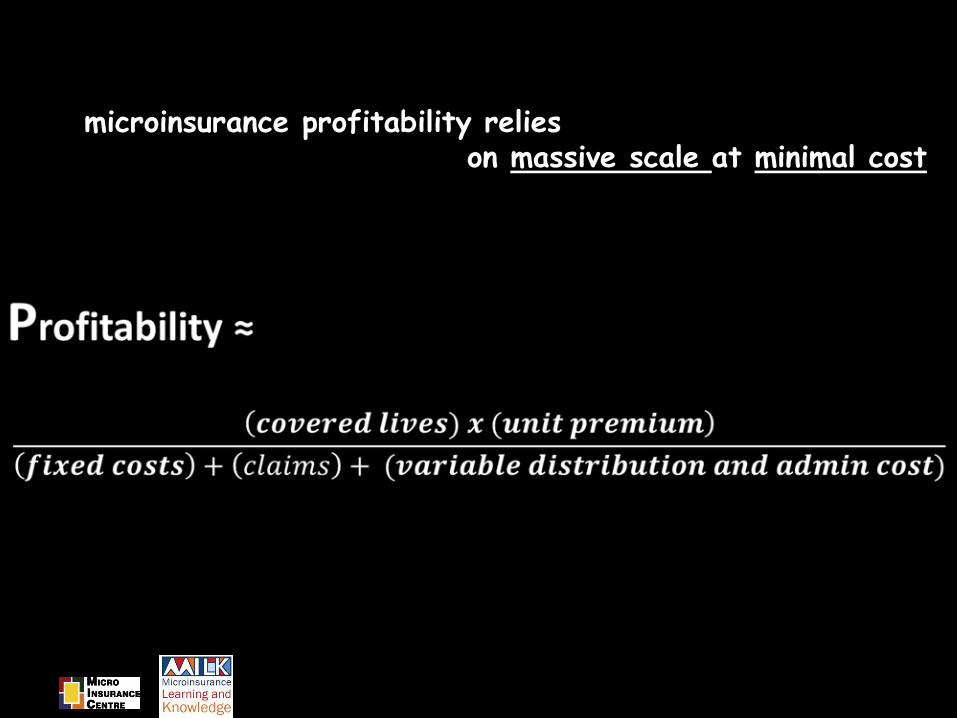
Voluntary, private models struggle with low scale and high expenses
Uptake is a function of participation rate and the size of the target population
Government subsidized health programs reach scale more quickly and crowd out private HMIs
Programs with individual enrolment
Public
Private
= 100,000 lives
>4M
~ 70,000
Average enrollment
0.74
2,56
Public
Private
Composite admin costs, per member per year, USD
Costs
20
36
41
99
124
190
1.365
3.070
5.753
11.570
18%
58%
8%
33%
100%
57%
91%
25%
94%
51%
Shepherd
SAS
BASIX
SEWA
Uplift
ME
Artisans
Yeshasvini
Weavers
ICICI RSBY
0 5.000 10.000 15.000 20.000 25.000
# enrolled Target population
SEWA
Shepherd
BASIX
Participation rate
Distribution Enrollment
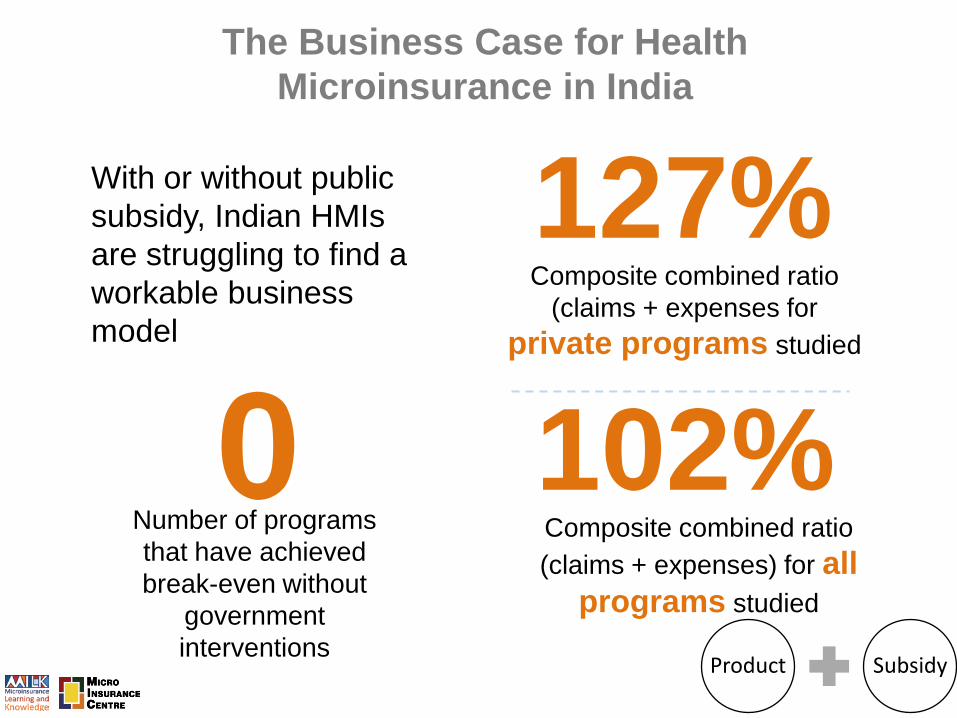
The Business Case for Health Microinsurance in India
With or without public subsidy, Indian HMIs are struggling to find a workable business model
0 Number of programs that have achieved break-even without
government interventions
102% Composite combined ratio (claims + expenses) for all
programs studied
127% Composite combined ratio
(claims + expenses for private programs studied
Product Subsidy

Private HMIs find it difficult to offer attractive products at affordable prices without
subsidy.
Expense ratio and not loss ratio In India is the primary driver of losses and lack of sustainability in private
programs
22%
78%
Public programs
63%
37%
Private programs
Admin Claims
Cost vs. Benefit per Member per Year (USD) Low scale leads to high
expense ratios
0,57
2,30
Premium charged to member
Benefit provided to member (claims)
Public
1,88
0.82
Private
Product Subsidy

Kenya HMI
Expense ratios are lower in Kenya…but premiums for HMIs are higher ; in Kenya subsidy is in the form of
absorbed loss ratio
0
1
2
3
4
5
6
7
8
0,00
1,00
2,00
3,00
4,00
5,00
6,00
7,00
8,00
USD
, per
mem
ber
per
year
Public HMIs
Premium Claims Admin
247% Claims
69% Claims
35% Exp.
45% Exp.
Private HMIs Kenya NHIF
Composite 282%
Kenya Composite 114%
2012 Premium, Claims, Expenses & Loss Ratios
NHIF
Private HMIs
3.1 Million
300,000
Covered Lives
Most programs are IP only and the opportunity to employ OP as a compliment to NHIFs IP is missed
Product Subsidy
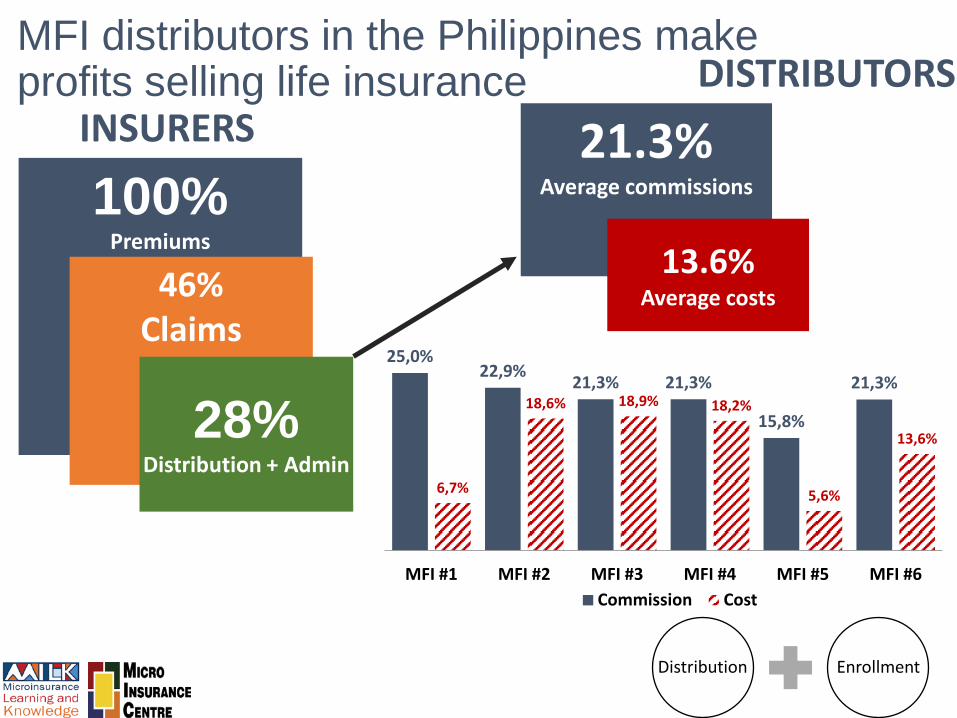
100% Premiums
46% Claims
2
INSURERS DISTRIBUTORS
MFI distributors in the Philippines make profits selling life insurance
21.3% Average commissions
13.6% Average costs
25,0% 22,9%
21,3% 21,3%
15,8%
21,3%
6,7%
18,6% 18,9% 18,2%
5,6%
13,6%
MFI #1 MFI #2 MFI #3 MFI #4 MFI #5 MFI #6 Commission Cost
Distribution Enrollment
28%
Distribution + Admin
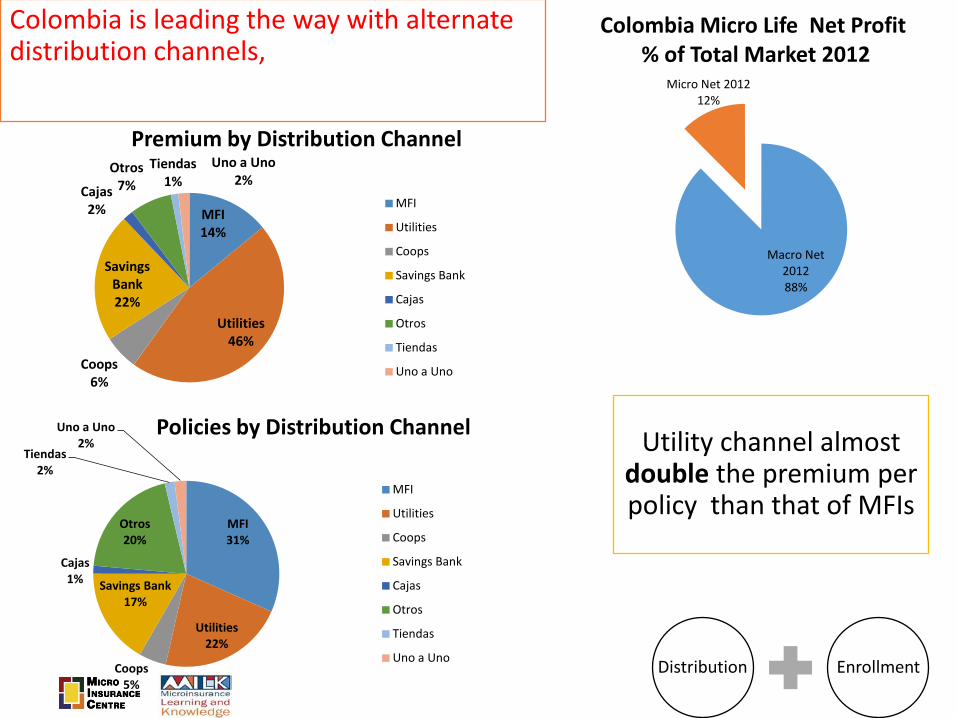
Colombia is leading the way with alternate distribution channels,
Utility channel almost double the premium per policy than that of MFIs
Distribution Enrollment
Macro Net 2012 88%
Micro Net 2012 12%
Colombia Micro Life Net Profit % of Total Market 2012
MFI 31%
Utilities 22%
Coops 5%
Savings Bank 17%
Cajas 1%
Otros 20%
Tiendas 2%
Uno a Uno 2%
Policies by Distribution Channel
MFI
Utilities
Coops
Savings Bank
Cajas
Otros
Tiendas
Uno a Uno
MFI 14%
Utilities 46%
Coops 6%
Savings Bank 22%
Cajas 2%
Otros 7%
Tiendas 1%
Uno a Uno 2%
Premium by Distribution Channel
MFI
Utilities
Coops
Savings Bank
Cajas
Otros
Tiendas
Uno a Uno

140.070
215.106
311.244
523.650
675.864
-168%
-30%
-33% -38%
-300%
-200%
-100%
0%
100%
200%
300%
0
100.000
200.000
300.000
400.000
500.000
600.000
700.000
800.000
2008 2009 2010 2011 2012
PlaNet Guarantee Covered lives and margin%, 2008-2012
Consolidation
Focus on consulting
484.208 587.692
2.000.347
3.467.008
4.202.597
-414%
-278% -177%
-73% -46%
-500%
-400%
-300%
-200%
-100%
0%
100%
200%
300%
400%
500%
0
500.000
1.000.000
1.500.000
2.000.000
2.500.000
3.000.000
3.500.000
4.000.000
4.500.000
2008 2009 2010 2011 2012
MicroEnsure Covered lives and margin %, 2008-2012
MNO initiative
Intermediaries are hugely leveraged to scale…they work off a small slice (commissions) of a small slice (micro premiums)
PG & ME have worked thru many strategies seeking scale and profits
Business Model
Health initiative

Intermediaries earn average revenue of just over USD 1.00 per year per life
Business Model
2008 2009 2010 2011 2012 All Years
ME & PG
Aon & Star
1,02 1,39 1,28 1,14 1,08 1,15 1,23 0,79
(5,40) (5,10)
(3,00)
(1,67) (1,49)
(2,34) (2,68)
(0,68)
Consolidated Revenues/Life & Expenses/Life (USD)
ME, PG & Star Micro (2008-2012); Aon Bolivia (2008-2011); AKAM (2008-2010)
Revenue/Life Expense/Life
… stand alones especially challenged. With expenses more than USD 2.50---both must support European based HQ
… when supported by commercial firms, costs are USD 0.68

In the Philippines... Competition rationalizes pricing, motivates innovation and client focus
43%
51% 52%
68% 74%
21%
29%
30%
38%
46%
22%
22% 21%
30% 28%
0%
10%
20%
30%
40%
50%
60%
70%
80%
2008 2009 2010 2011 2012
CARD, CLIMBS, PPLIC, TSPI, ME Claims & Expense Ratios 2008-2012
Combined Ratio Loss Ratio Expense Ratio
19.297.246
29.295.106
40.507.200
46.009.490
55.277.723
4.086.864
8.432.904 12.324.769
17.385.456
25.327.765
2008 2009 2010 2011 2012
Gross Premium Claims Expon. (Gross Premium)
Competition
Thank You!
Rick Koven [email protected]
Co-Authors India: Denis Garand, Taara Chandani
Kenya: Joseph Jamwaka, Anne Kamau, Donna Swiderek Philippines: John Wipf
Colombia: Xavier Martin Research Assistance
Emily Zimmerman, Katie Biese, Nick Winkleblack