Is the Financial Safety Net a Barrier to Cross-Border Banking? Ata Can Bertay (Tilburg University...
24
Is the Financial Safety Net a Barrier to Cross-Border Banking? Ata Can Bertay (Tilburg University and World Bank) Asli Demirgüç-Kunt (World Bank) Harry Huizinga (Tilburg University and CEPR) Bank Supervision and Resolution: National and International Challenges Vienna, October 3 – 4, 2011
-
date post
19-Dec-2015 -
Category
Documents
-
view
215 -
download
0
Transcript of Is the Financial Safety Net a Barrier to Cross-Border Banking? Ata Can Bertay (Tilburg University...
Is the Financial Safety Net a Barrier to Cross-Border Banking?
Ata Can Bertay(Tilburg University and World Bank)
Asli Demirgüç-Kunt(World Bank)
Harry Huizinga(Tilburg University and CEPR)
Bank Supervision and Resolution: National and International Challenges
Vienna, October 3 – 4, 2011

Motivation
• Banking becoming more and more international
• Many banking markets still dominated by domestic banks
• Issues with financial safety net for international banks and burden sharing in case of a bailout
• Then, is there market discipline exerted on internationalizing banks?
Outline
• Introduction– Literature– EU case
• Data• The model and empirical results• Conclusion• (Further progress)
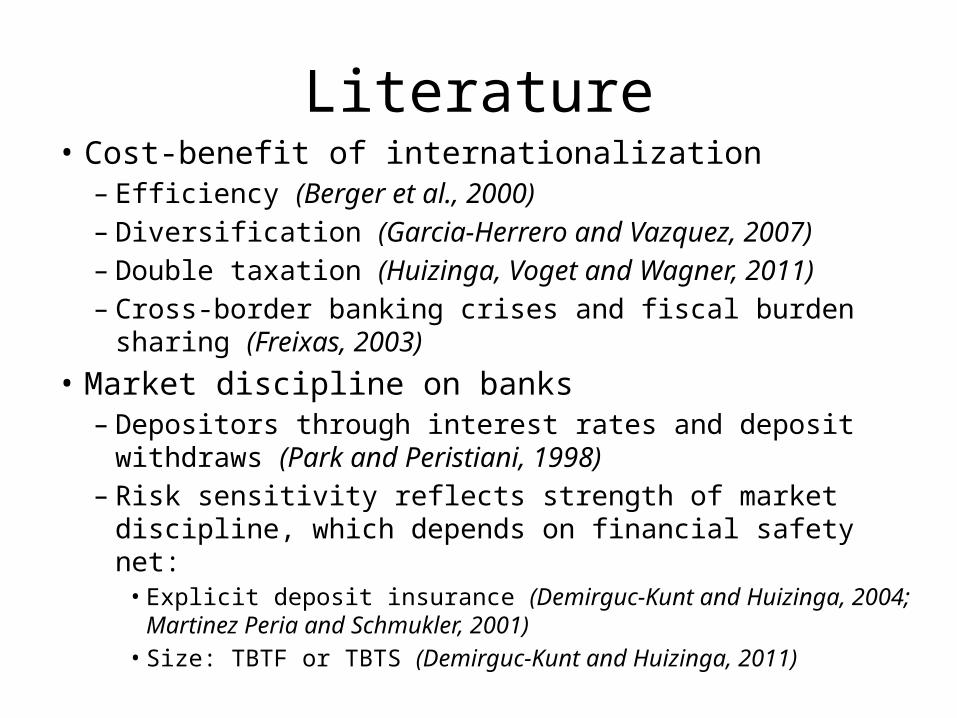
Literature• Cost-benefit of internationalization
– Efficiency (Berger et al., 2000)– Diversification (Garcia-Herrero and Vazquez, 2007)– Double taxation (Huizinga, Voget and Wagner, 2011)– Cross-border banking crises and fiscal burden sharing (Freixas,
2003) • Market discipline on banks
– Depositors through interest rates and deposit withdraws (Park and Peristiani, 1998)
– Risk sensitivity reflects strength of market discipline, which depends on financial safety net:
• Explicit deposit insurance (Demirguc-Kunt and Huizinga, 2004; Martinez Peria and Schmukler, 2001)
• Size: TBTF or TBTS (Demirguc-Kunt and Huizinga, 2011)

Cross-Border Banking: EU case
• Significant cross-border banking• Deposit insurance and organizational form:
– Branch=>Home country regime– Foreign subsidiary=>Host country regime
• Absence of clear rules on burden sharing to eliminate conflicts of interest
• Resolution outcomes may not take international externalities into account
• Not optimal decision in an international perspective

Data• International panel
– Bankscope– 900 publicly listed banks from 83 countries– 1999-2009 period
• Size of unconsolidated subsidiary relative to size of consolidated parent bank
• Alternative internationalization measures• Weighted by parent’s ownership share

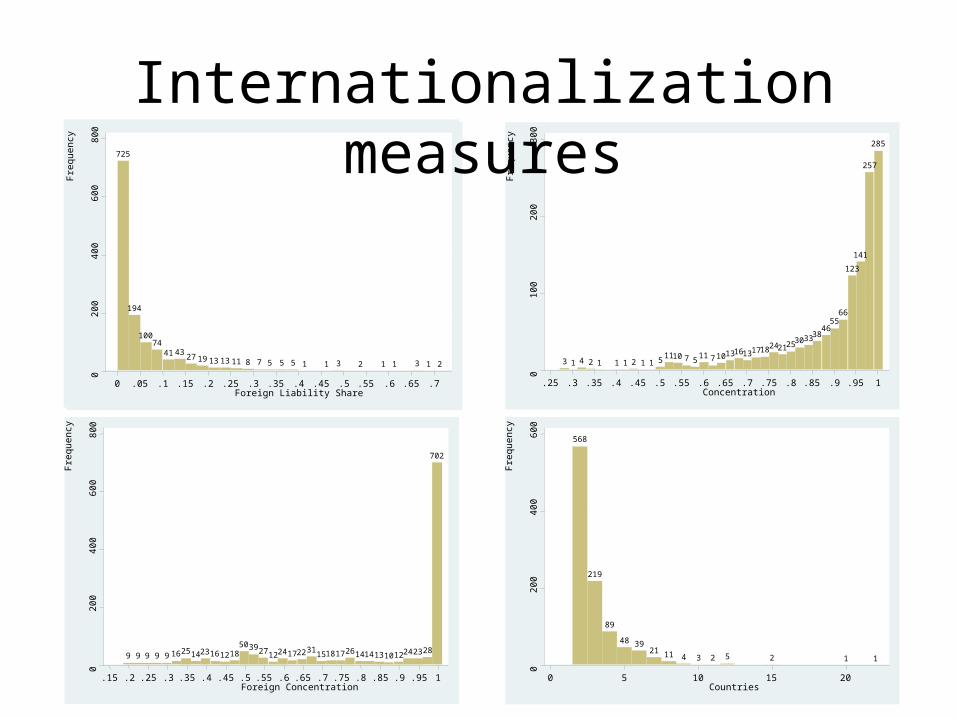
Internationalization measures• Foreign liabilities share
– Sum of the liabilities of foreign subsidiaries divided by the parent bank’s consolidated liabilities
• Concentration – Sum of squared shares of parent bank’s liabilities– Includes home country (1 minus share for all the
foreign countries)• Foreign concentration• Internationalization dummy• Number of countries
725
194
10074
41 4327 19 13 13 11 8 7 5 5 5 1 1 3 2 1 1 3 1 2
020
040
060
080
0
Fre
quen
cy
0 .05 .1 .15 .2 .25 .3 .35 .4 .45 .5 .55 .6 .65 .7Foreign Liability Share
3 1 4 2 1 1 1 2 1 1 51110 7 5
11 7 10131613171824212530333846
5566
123
141
257
285
010
020
030
0
Fre
quen
cy
.25 .3 .35 .4 .45 .5 .55 .6 .65 .7 .75 .8 .85 .9 .95 1Concentration
9 9 9 9 9 162514231612185039271224172231
151817261414131012242328
702
020
040
060
080
0
Fre
quen
cy
.15 .2 .25 .3 .35 .4 .45 .5 .55 .6 .65 .7 .75 .8 .85 .9 .95 1Foreign Concentration
568
219
89
48 3921 11 4 3 2 5 2 1 1
020
040
060
0
Fre
quen
cy
0 5 10 15 20Countries
Internationalization measures
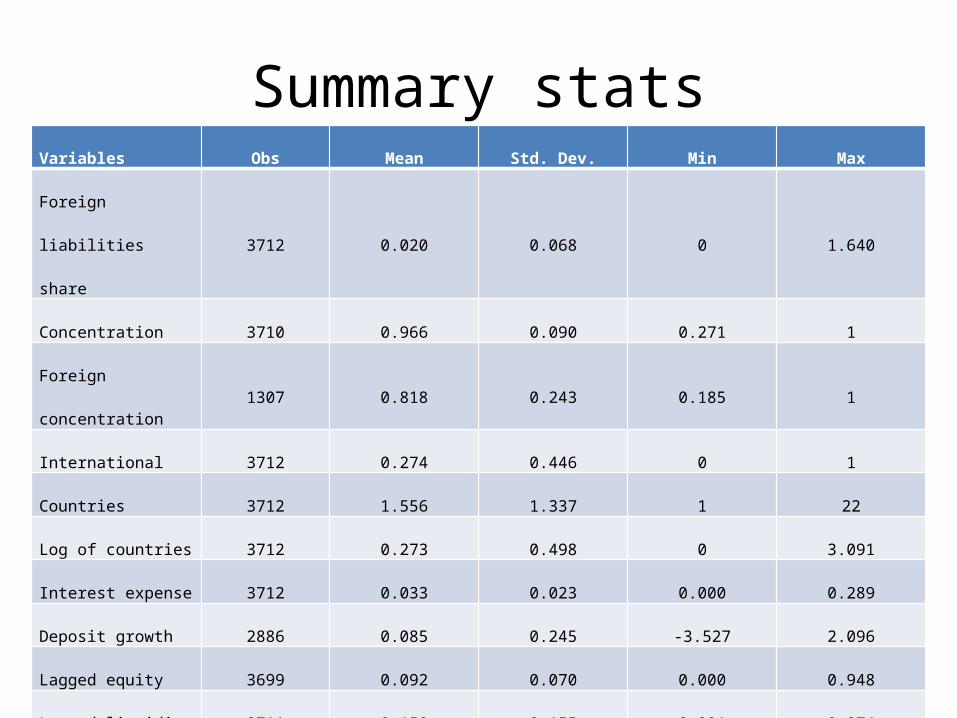
Variables Obs Mean Std. Dev. Min Max
Foreign liabilities share 3712 0.020 0.068 0 1.640
Concentration 3710 0.966 0.090 0.271 1
Foreign concentration 1307 0.818 0.243 0.185 1
International 3712 0.274 0.446 0 1
Countries 3712 1.556 1.337 1 22
Log of countries 3712 0.273 0.498 0 3.091
Interest expense 3712 0.033 0.023 0.000 0.289
Deposit growth 2886 0.085 0.245 -3.527 2.096
Lagged equity 3699 0.092 0.070 0.000 0.948
Lagged liquidity 3711 0.158 0.155 0.001 0.974
Lagged profit 3712 0.013 0.024 -0.437 0.293
Inflation difference 1299 -0.002 0.061 -0.430 0.451
Summary stats
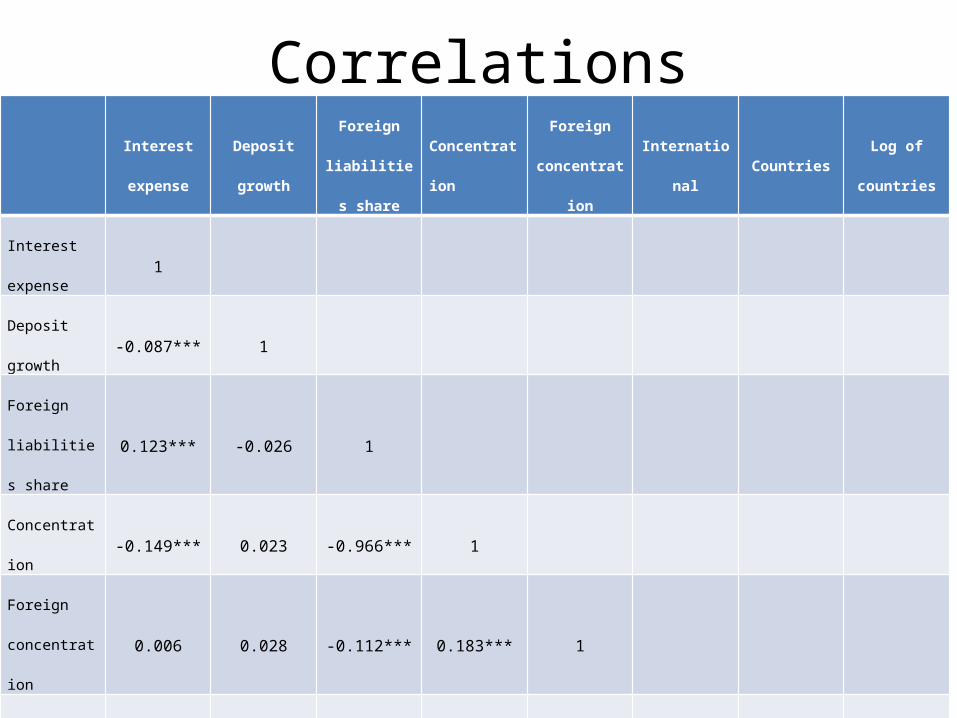
CorrelationsInterest
expense
Deposit
growth
Foreign
liabilities
share
ConcentrationForeign
concentrationInternational Countries
Log of
countries
Interest
expense1
Deposit
growth-0.087*** 1
Foreign
liabilities share0.123*** -0.026 1
Concentration -0.149*** 0.023 -0.966*** 1
Foreign
concentration0.006 0.028 -0.112*** 0.183*** 1
International 0.169*** -0.025 0.384*** -0.528*** -0.271*** 1
Countries 0.096*** -0.018 0.373*** -0.500*** -0.646*** 0.678*** 1
Log of
countries0.140*** -0.019 0.415*** -0.561*** -0.668*** 0.893*** 0.915*** 1
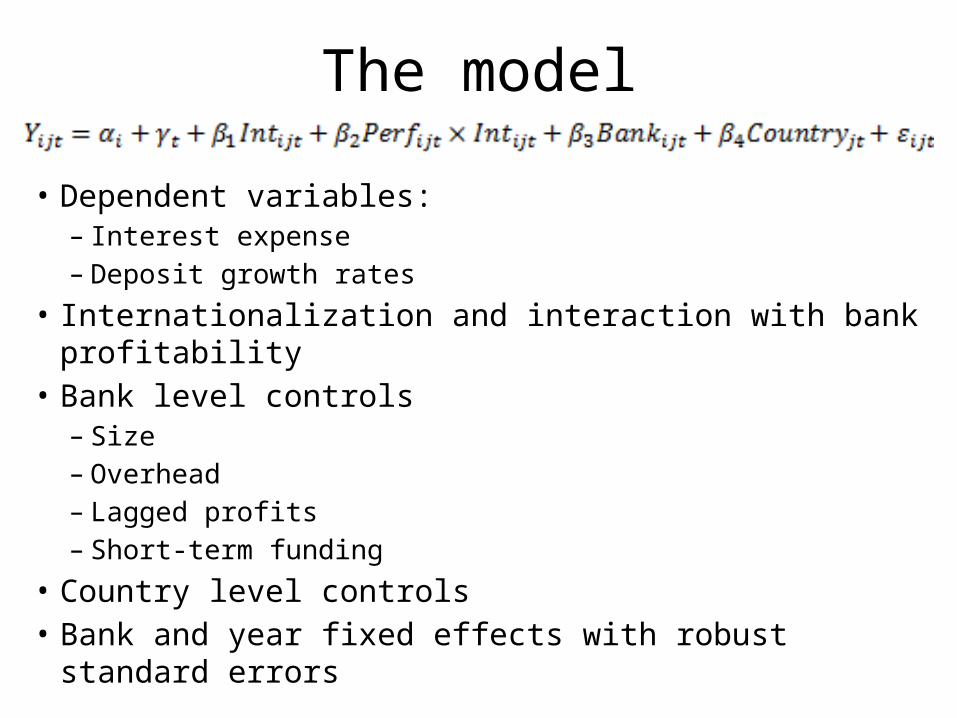
The model
• Dependent variables: – Interest expense– Deposit growth rates
• Internationalization and interaction with bank profitability• Bank level controls
– Size– Overhead– Lagged profits– Short-term funding
• Country level controls• Bank and year fixed effects with robust standard errors
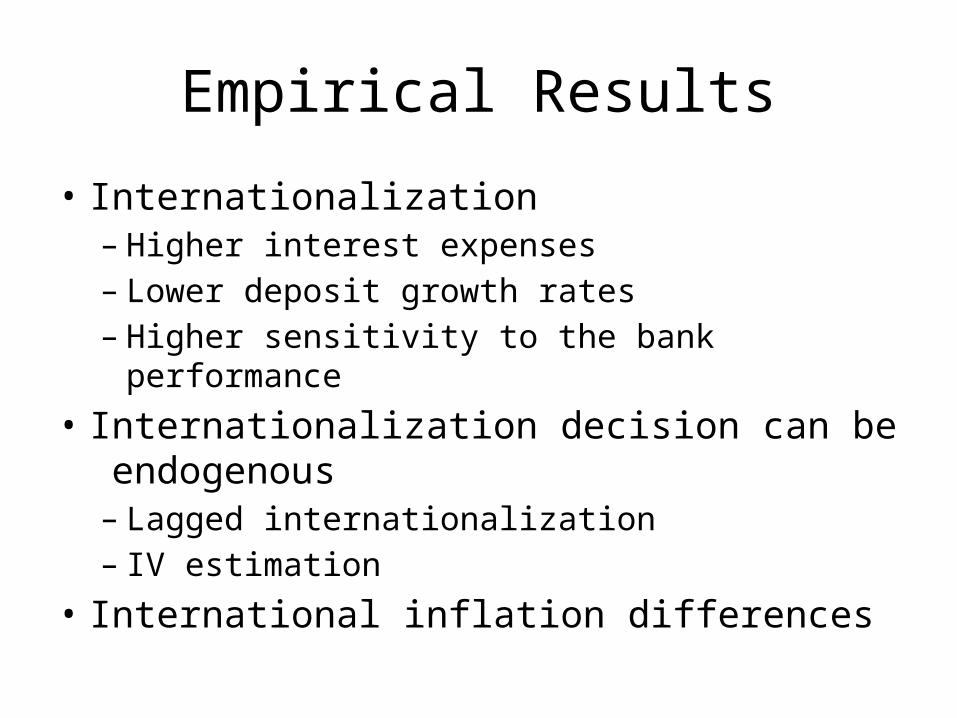
Empirical Results
• Internationalization– Higher interest expenses– Lower deposit growth rates– Higher sensitivity to the bank performance
• Internationalization decision can be endogenous– Lagged internationalization– IV estimation
• International inflation differences

Foreign liabilities proxying internationalization
(1) (2) (3) (4) (5) (6) (7) (8)
Interest expense
Interest expense
Interest expense
Interest expense
Deposit growth
Deposit growth
Deposit growth
Deposit growth
Foreign liabilities share
0.023*** 0.044** 0.023** 0.038** -0.254** -0.545*** -0.149 -0.421**
(0.008) (0.021) (0.010) (0.015) (0.110) (0.148) (0.167) (0.209)
Lagged profit -0.074* -0.055 -0.071* -0.06 -1.175 -1.341 -1.182 -1.32
(0.038) (0.042) (0.038) (0.041) (1.111) (1.134) (1.113) (1.145)
Lagged profit* Foreign liabilities share
-1.741 -1.098* 25.981** 22.930*
(1.078) (0.562) (10.882) (13.842)
N 3712 3712 3673 3673 2938 2938 2903 2903
R-sq 0.34 0.347 0.348 0.351 0.094 0.097 0.094 0.096
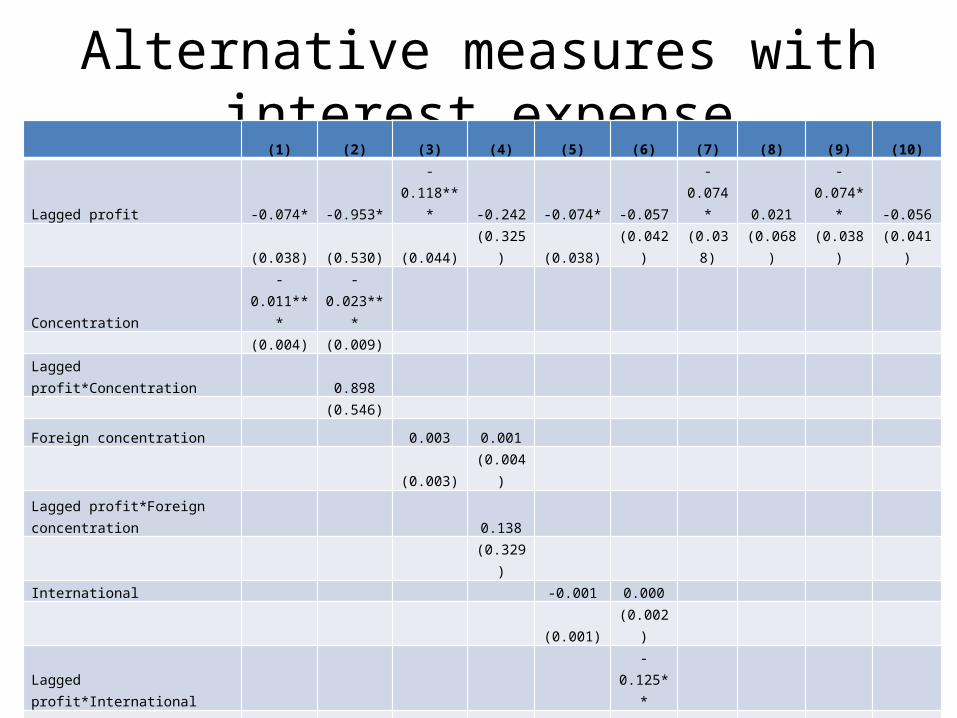
Alternative measures with interest expense(1) (2) (3) (4) (5) (6) (7) (8) (9) (10)
Lagged profit -0.074* -0.953* -0.118*** -0.242 -0.074* -0.057 -0.074* 0.021 -0.074** -0.056(0.038) (0.530) (0.044) (0.325) (0.038) (0.042) (0.038) (0.068) (0.038) (0.041)
Concentration -0.011*** -0.023***(0.004) (0.009)
Lagged profit*Concentration 0.898(0.546)
Foreign concentration 0.003 0.001(0.003) (0.004)
Lagged profit*Foreign concentration 0.138
(0.329)International -0.001 0.000
(0.001) (0.002)
Lagged profit*International -0.125**(0.050)
Countries -0.000 0.001(0.000) (0.000)
Lagged profit*Countries -0.082**(0.041)
Log of countries -0.001 0.001(0.001) (0.001)
Lagged profit*Log of countries -0.167**(0.071)
N 3710 3710 1307 1307 3712 3712 3712 3712 3712 3712R-sq 0.338 0.344 0.410 0.411 0.336 0.340 0.336 0.340 0.336 0.341
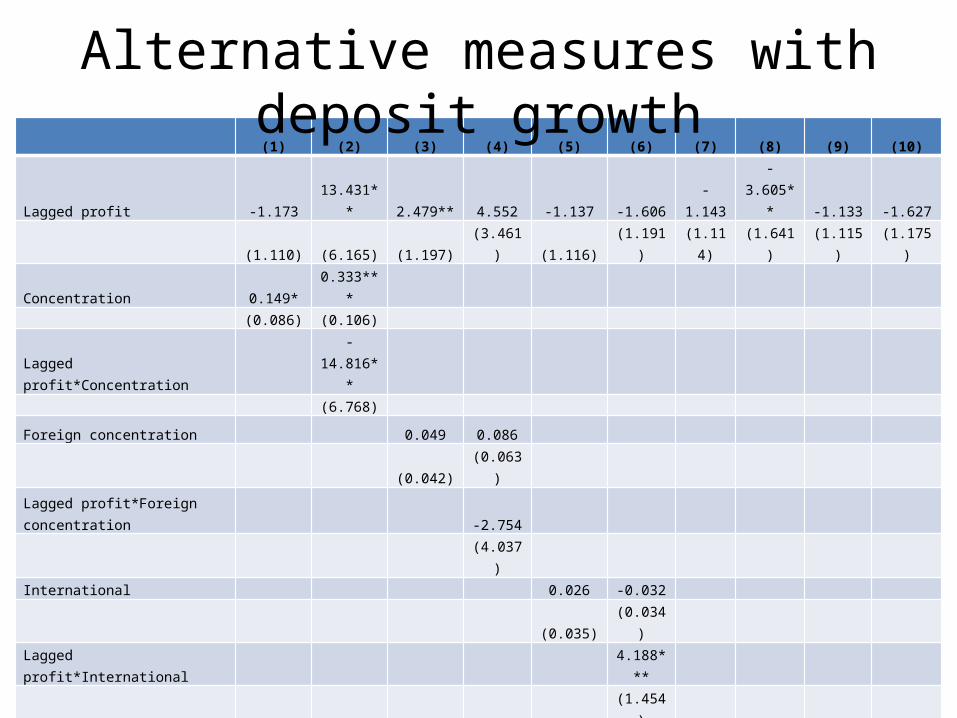
(1) (2) (3) (4) (5) (6) (7) (8) (9) (10)
Lagged profit -1.173 13.431** 2.479** 4.552 -1.137 -1.606 -1.143 -3.605** -1.133 -1.627(1.110) (6.165) (1.197) (3.461) (1.116) (1.191) (1.114) (1.641) (1.115) (1.175)
Concentration 0.149* 0.333***(0.086) (0.106)
Lagged profit*Concentration -14.816**(6.768)
Foreign concentration 0.049 0.086(0.042) (0.063)
Lagged profit*Foreign concentration -2.754
(4.037)International 0.026 -0.032
(0.035) (0.034)
Lagged profit*International 4.188***(1.454)
Countries -0.001 -0.019**(0.007) (0.007)
Lagged profit*Countries 2.088***(0.670)
Log of countries 0.014 -0.041(0.031) (0.029)
Lagged profit*Log of countries 4.764***(1.479)
N 2937 2937 1158 1158 2938 2938 2938 2938 2938 2938R-sq 0.094 0.097 0.207 0.208 0.093 0.101 0.093 0.101 0.093 0.102
Alternative measures with deposit growth
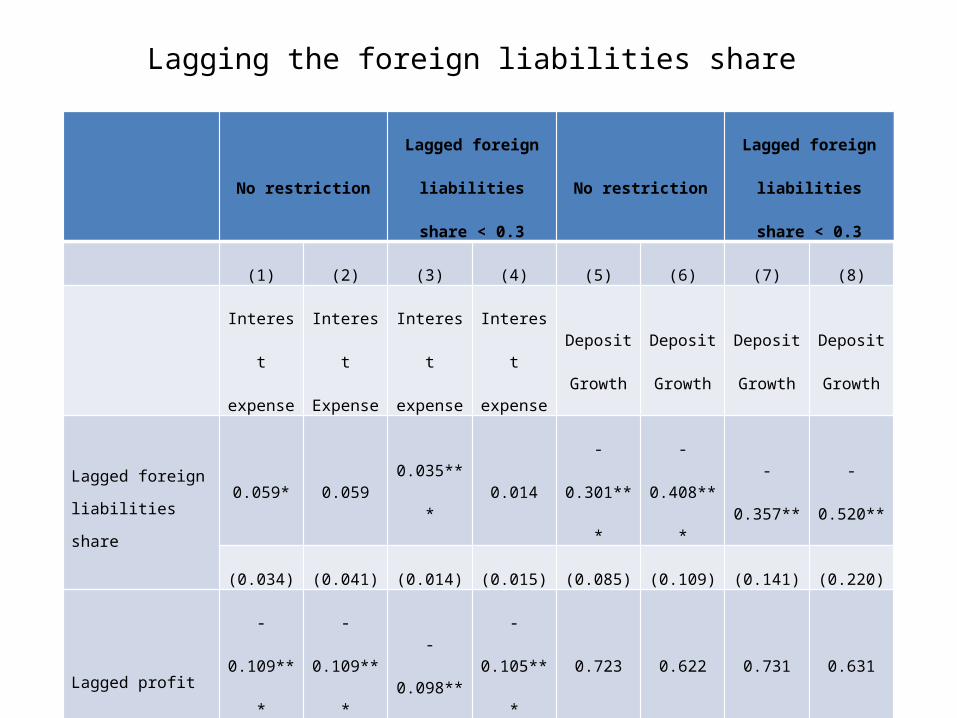
Lagging the foreign liabilities share
No restrictionLagged foreign
liabilities share < 0.3No restriction
Lagged foreign
liabilities share < 0.3
(1) (2) (3) (4) (5) (6) (7) (8)
Interest
expense
Interest
Expense
Interest
expense
Interest
expense
Deposit
Growth
Deposit
Growth
Deposit
Growth
Deposit
Growth
Lagged foreign
liabilities share
0.059* 0.059 0.035*** 0.014 -0.301*** -0.408*** -0.357** -0.520**
(0.034) (0.041) (0.014) (0.015) (0.085) (0.109) (0.141) (0.220)
Lagged profit-0.109*** -0.109*** -0.098** -0.105*** 0.723 0.622 0.731 0.631
(0.039) (0.039) (0.038) (0.038) (0.999) (1.008) (1.001) (1.013)
Lagged
profit*Lagged
foreign liabilities
share
0.016 1.489 11.925 13.351
(1.002) (1.085) (8.554) (10.588)
N 2364 2364 2339 2339 2407 2407 2381 2381
R-sq 0.338 0.338 0.336 0.338 0.077 0.078 0.077 0.078

IV estimation
• Country level measures of internationalization:– Tourism– Investments (FDI flows and Portfolio position)– Trade
• First stage regressions• Exclusion restriction
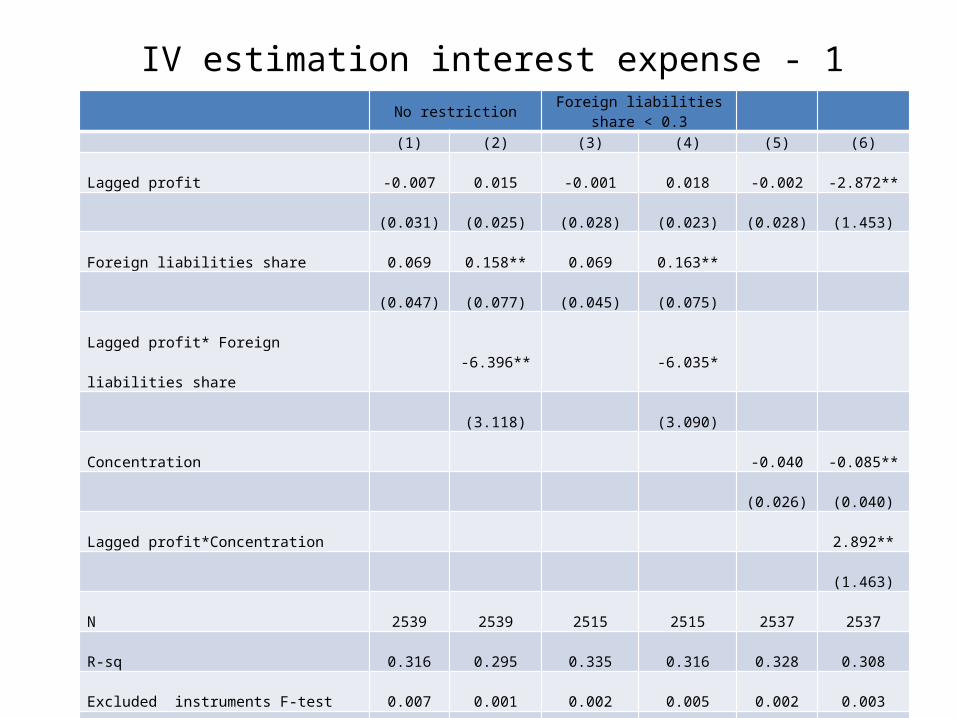
IV estimation interest expense - 1No restriction Foreign liabilities share < 0.3
(1) (2) (3) (4) (5) (6)
Lagged profit -0.007 0.015 -0.001 0.018 -0.002 -2.872**
(0.031) (0.025) (0.028) (0.023) (0.028) (1.453)
Foreign liabilities share 0.069 0.158** 0.069 0.163**
(0.047) (0.077) (0.045) (0.075)
Lagged profit* Foreign liabilities share -6.396** -6.035*
(3.118) (3.090)
Concentration -0.040 -0.085**
(0.026) (0.040)
Lagged profit*Concentration 2.892**
(1.463)
N 2539 2539 2515 2515 2537 2537
R-sq 0.316 0.295 0.335 0.316 0.328 0.308
Excluded instruments F-test 0.007 0.001 0.002 0.005 0.002 0.003
Hansen J-test (p-value) 0.842 0.732 0.976 0.827 0.866 0.767
Endogeneity test (p-value) 0.128 0.103 0.109 0.041 0.109 0.057
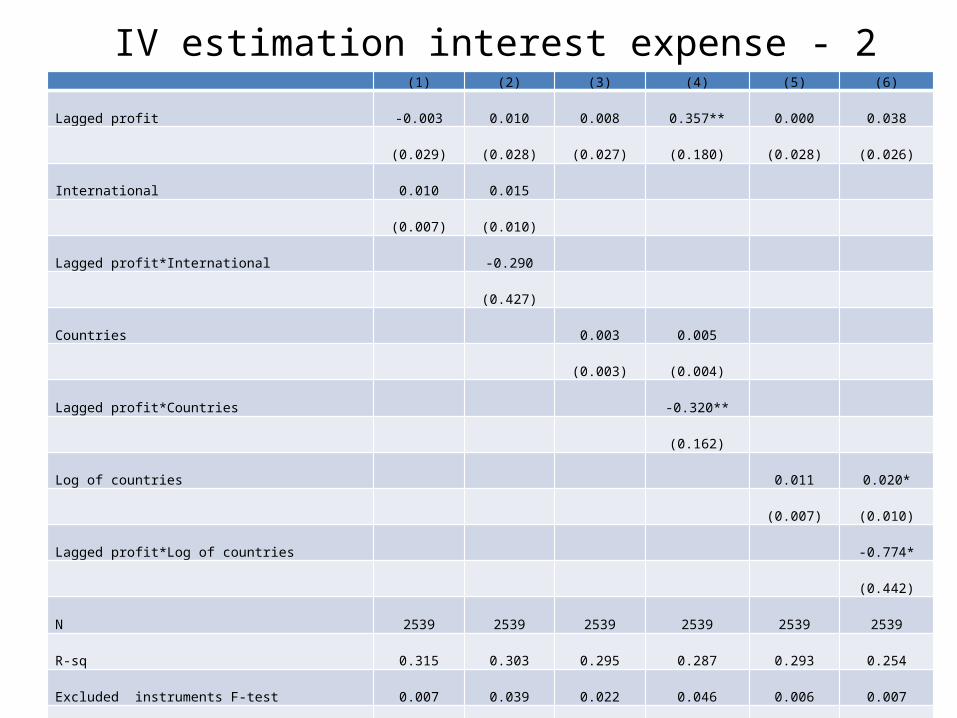
IV estimation interest expense - 2(1) (2) (3) (4) (5) (6)
Lagged profit -0.003 0.010 0.008 0.357** 0.000 0.038
(0.029) (0.028) (0.027) (0.180) (0.028) (0.026)
International 0.010 0.015
(0.007) (0.010)
Lagged profit*International -0.290
(0.427)
Countries 0.003 0.005
(0.003) (0.004)
Lagged profit*Countries -0.320**
(0.162)
Log of countries 0.011 0.020*
(0.007) (0.010)
Lagged profit*Log of countries -0.774*
(0.442)
N 2539 2539 2539 2539 2539 2539
R-sq 0.315 0.303 0.295 0.287 0.293 0.254
Excluded instruments F-test 0.007 0.039 0.022 0.046 0.006 0.007
Hansen J-test (p-value) 0.618 0.340 0.539 0.425 0.697 0.427
Endogeneity test (p-value) 0.173 0.109 0.226 0.306 0.127 0.147
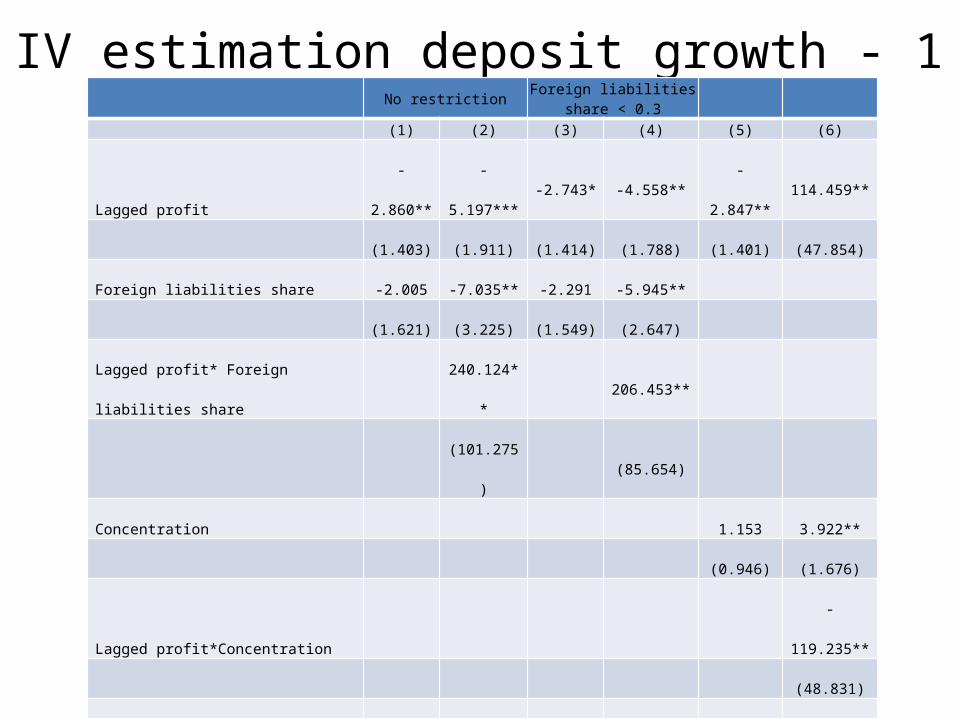
IV estimation deposit growth - 1No restriction
Foreign liabilities share < 0.3
(1) (2) (3) (4) (5) (6)
Lagged profit -2.860** -5.197*** -2.743* -4.558** -2.847** 114.459**
(1.403) (1.911) (1.414) (1.788) (1.401) (47.854)
Foreign liabilities share -2.005 -7.035** -2.291 -5.945**
(1.621) (3.225) (1.549) (2.647)
Lagged profit* Foreign liabilities share 240.124** 206.453**
(101.275) (85.654)
Concentration 1.153 3.922**
(0.946) (1.676)
Lagged profit*Concentration -119.235**
(48.831)
N 1846 1846 1829 1829 1846 1846
R-sq 0.082 -0.229 0.094 -0.043 0.088 -0.185
Excluded instruments F-test 0.017 0.000 0.033 0.000 0.012 0.000
Hansen J-test (p-value) 0.155 0.601 0.298 0.552 0.131 0.286
Endogeneity test (p-value) 0.137 0.005 0.050 0.004 0.163 0.009

IV estimation deposit growth - 2(1) (2) (3) (4) (5) (6)
Lagged profit -2.866** -0.710 -3.012** -8.104* -2.943** -2.948
(1.395) (2.304) (1.443) (4.184) (1.405) (1.805)
International -0.105 0.168
(0.358) (0.366)
Lagged profit*International -8.550
(13.992)
Countries -0.021 -0.027
(0.069) (0.064)
Lagged profit*Countries 4.629
(3.128)
Log of countries -0.096 0.006
(0.272) (0.266)
Lagged profit*Log of countries 8.200
(9.871)
N 1846 1846 1846 1846 1846 1846
R-sq 0.103 0.040 0.114 0.116 0.105 0.112
Excluded instruments F-test 0.047 0.156 0.019 0.011 0.016 0.001
Hansen J-test (p-value) 0.034 0.025 0.026 0.041 0.030 0.020
Endogeneity test (p-value) 0.757 0.865 0.688 0.923 0.694 0.784
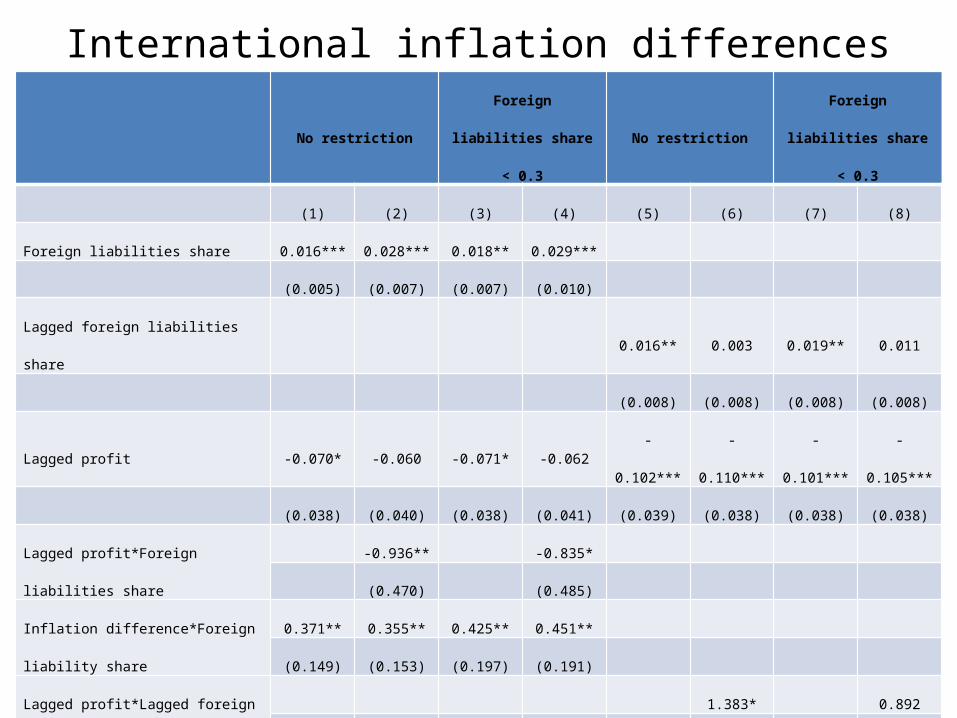
International inflation differencesNo restriction
Foreign liabilities share <
0.3No restriction
Foreign liabilities share <
0.3
(1) (2) (3) (4) (5) (6) (7) (8)
Foreign liabilities share 0.016*** 0.028*** 0.018** 0.029***
(0.005) (0.007) (0.007) (0.010)
Lagged foreign liabilities share 0.016** 0.003 0.019** 0.011
(0.008) (0.008) (0.008) (0.008)
Lagged profit -0.070* -0.060 -0.071* -0.062 -0.102*** -0.110*** -0.101*** -0.105***
(0.038) (0.040) (0.038) (0.041) (0.039) (0.038) (0.038) (0.038)
Lagged profit*Foreign liabilities share -0.936** -0.835*
(0.470) (0.485)
Inflation difference*Foreign liability share0.371** 0.355** 0.425** 0.451**
(0.149) (0.153) (0.197) (0.191)
Lagged profit*Lagged foreign liabilities
share
1.383* 0.892
(0.743) (0.623)
Inflation difference*Lagged foreign
liabilities share
0.301* 0.368** 0.241 0.267*
(0.155) (0.157) (0.147) (0.145)
N 3704 3704 3666 3666 2358 2358 2329 2329
R-sq 0.360 0.362 0.360 0.362 0.339 0.342 0.338 0.340

Conclusion and Discussion• Internationalizing banks are subject to heightened
market discipline by bank depositors• Consistent with less generous financial safety net
for bank internationalization• Competitive disadvantage due to lower implicit
subsidies.• Can an international resolution agency be a
solution? Internalizing externalities• But, is it desirable? Decreasing market discipline
on international banks, higher risk taking

Further Thoughts
• Using cross-sectional variation –Pooled OLS with country FE
• Controlling for systemic size (Liabilities over GDP)
• An alternative risk measure: Asset volatility• Impact of internationalization on
unconsolidated interest expense and deposit growth