Is the Evolution of India’s Outward FDI Consistent with ... · PDF filewith...
39
Economics Working Paper Series 2015/019 Is the Evolution of India’s Outward FDI Consistent with Dunning’s Investment Development Path Sequence? Edmund Amann and Swati Virmani The Department of Economics Lancaster University Management School Lancaster LA1 4YX UK © Authors All rights reserved. Short sections of text, not to exceed two paragraphs, may be quoted without explicit permission, provided that full acknowledgement is given. LUMS home page: http://www.lancaster.ac.uk/lums/
Transcript of Is the Evolution of India’s Outward FDI Consistent with ... · PDF filewith...
Economics Working Paper Series
2015/019
Is the Evolution of India’s Outward FDI Consistent
with Dunning’s Investment Development Path Sequence?
Edmund Amann and Swati Virmani
The Department of Economics Lancaster University Management School
Lancaster LA1 4YX UK
© Authors All rights reserved. Short sections of text, not to exceed
two paragraphs, may be quoted without explicit permission, provided that full acknowledgement is given.
LUMS home page: http://www.lancaster.ac.uk/lums/

IS THE EVOLUTION OF INDIA’S OUTWARD FDI CONSISTENT WITH DUNNING’S
INVESTMENT DEVELOPMENT PATH SEQUENCE?
Edmund Amann* Swati Virmani
**
September 2015
Abstract
This paper examines whether India’s Outward Foreign Direct Investment (OFDI) pattern is
consistent with Dunning’s Investment Development Path (IDP) sequence using macro data over
the period 1980-2010. We test whether the level of development - proxied by GDP per capita - is
the main factor explaining OFDI, and augment the IDP by studying other major determinants
such as Exports, Inward FDI (IFDI), Human Capital, and R&D using the Cointegration and
Error Correction Model techniques. Our results support the main proposition of the IDP, but
also highlight the importance of other factors. We also find that OFDI Granger-causes R&D,
suggesting a possibility of reverse technology spillover.
JEL Classification: F21, F23, O30
Keywords: Outward FDI, Investment Development Path, Error Correction Model, Granger
Causality, Reverse Technology Spillovers
* Reader in Development Economics, Department of Economics, School of Social Sciences,
University of Manchester, Manchester M13 9PL, UK. Email: [email protected]
** Teaching Associate, Department of Economics, the Management School, Lancaster
University, Bailrigg, Lancaster LA1 4YX, UK. Email: [email protected]

2
1. INTRODUCTION
The emergence of Transnational Corporations (TNCs) from developing countries is often
analysed in terms of the IDP theory. According to the IDP theory, the OFDI and IFDI position of
a country is systematically related to a country’s level and structure of development. Outward
investment is expected to be undertaken only when a country has reached a certain minimum
level of development. A brief overview of the IDP theory is depicted in Figure 1 (taken from
World Investment Report 2006) which correlates Net Outward Investment (NOI) with GDP per
capita, showing that in the broadest sense IDP holds.
Figure 1: Relationship between NOI per capita and GDP per capita for selected countries,
during 2004
3
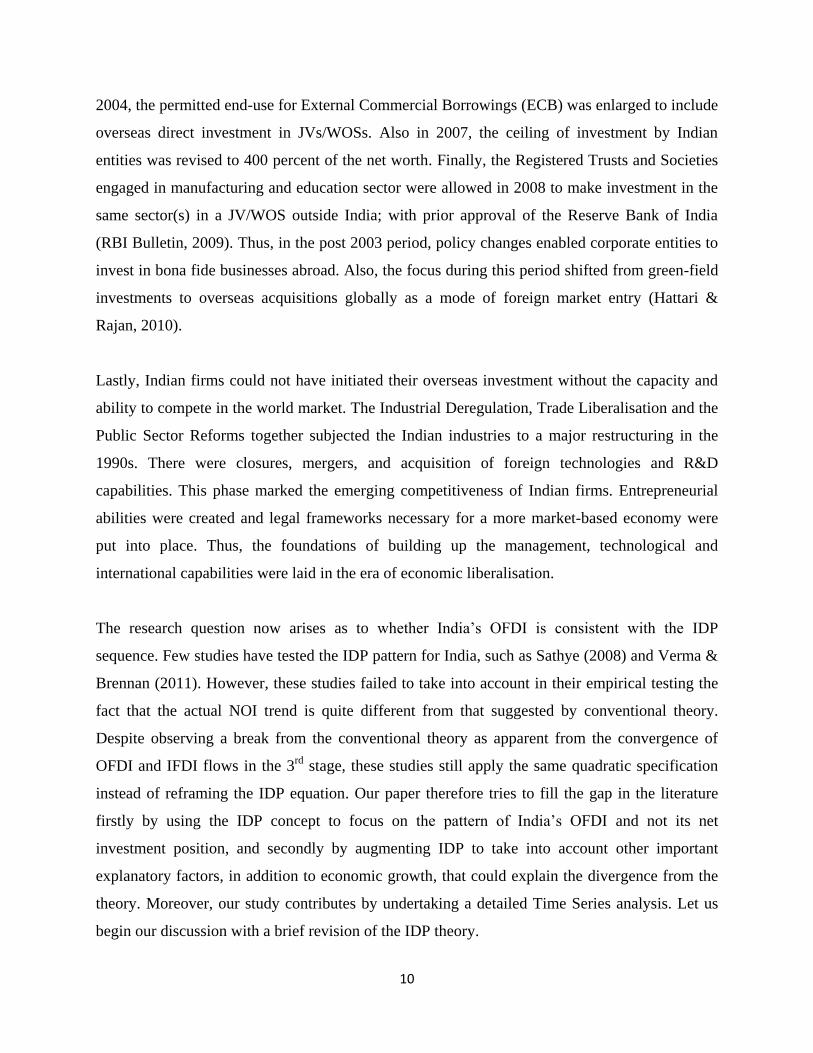
However the main question that needs to be addressed is whether there is a case for a refined
theory for investment from developing nations. Many authors, such as Mathews (2002), have
argued for alternative theories to explain internationalisation. Compared to developed nation
TNCs, a developing country’s TNCs, at a similar stage of development, may be investing
overseas at a very early stage. Furthermore, there could be a wide range of either firm-specific
advantages or policy implications affecting the investment climate. For example, the introduction
of the Foreign Exchange Management Act (FEMA) in 2000 brought about significant policy
liberalisation in India. Indian firms could now take 100 percent stakes in their overseas
subsidiaries in any line of business (Satyanand & Raghavendran, 2010).
The paper thus aims at studying to what extent the IDP sequence explains the pattern of OFDI
from India. The paper also augments the IDP model to include other significant factors affecting
OFDI. The twofold contribution highlighting the novelty of our paper is:
1. As supported by studies such as Stoian (2013), Kalotay (2008), and Kalotay & Sulstarova
(2010), the IDP alone cannot explain the surge in OFDI for countries that are in stage 2.
Moreover, many emerging economies have leapfrogged the development path. India whose NOI
position is negative throughout (stage 2 or stage 3) (Verma & Brennan, 2011), and is witnessing
an increase in both OFDI and IFDI flows, thus suggests a break in the IDP pattern. Also, the
empirical findings from the past literature on India, suggesting a U-shaped pattern, do not fall in
line with the actual investment sequence. Moreover, the same IDP equation cannot be used to
explain the pattern for both developed and developing countries. Therefore, our paper examines
IDP as a conventional theory explaining OFDI (and not the commonly used NOI) by augmenting
the IDP to explore other home country determinants. This forms our first contribution.
2. Unlike previous studies that use an augmented IDP version, we undertake an extensive Time
Series analysis by looking at India’s overseas investment data for the period 1980-2010.
Furthermore, the paper looks at the question of whether a two-way causal relationship exists
between OFDI and the determining factors. We also include Human Capital as one of the factors

4
explaining the growth of outward investment (Dunning & Narula, 1996). This is the second
important contribution.
Apart from these main contributions, the issues raised here have important policy implications
for other developing nations. Should the countries seeking internationalisation wait for their per
capita incomes to grow to undertake OFDI or should they invest at an early stage of their
development, breaking with IDP theory? In case of latter, this would emphasise the importance
of other factors - apart from the income level of a country - which need to be considered.
2. RECENT TRENDS: INDIA’S OFDI POSITION
Indian firms expanded overseas in two waves, first in the 1970s and 1980s, and, second, after
1995 with a major liberalisation in the 2000s. During the second wave outward investment was
not just on a bigger scale, but 60-70 percent of the investment was realised in highly advanced
countries. Despite having a low income per capita in 2005 and 2006, India had more OFDI than
inward, an outcome contradictory to the IDP sequence (Ramamurti & Singh, 2009). This section
mainly aims at sketching the profile of India’s OFDI position, outlining its sectoral and
geographical distribution.
Figure 2 summarises the trends for the period of July 2007 – May 2011, showing aggregate
monthly overseas investment by various Indian Companies, in Joint Ventures and Wholly
Owned Subsidiaries abroad. The graph shows a fairly consistent trend with OFDI ranging
between US$1 and US$4 billion over the entire period, except for a very high peak in June 2010.
The latter was due to the substantial overseas investment by Bharti Airtel Limited (a
communication services company) in two joint ventures in Netherlands and Singapore.

5
Figure 2: India’s monthly OFDI position (US$ million): 2007-2011
0
0001
0002
0003
0004
0005
0006
0007
0008
0009
00001
00011
00021
00031
July
August
Septe
mber
Octo
ber
Novem
ber
Decem
ber
January
Febru
ary
Marc
hA
pril
May
June
July
August
Septe
mber
Octo
ber
Novem
ber
Decem
ber
January
Febru
ary
Marc
h
April
May
June
July
August
Septe
mber
Octo
ber
Novem
ber
Decem
ber
January
Febru
ary
Marc
hA
pril
May
June
July
August
Septe
mber
Octo
ber
Novem
ber
Decem
ber
January
Febru
ary
Marc
hA
pril
May
2007 2008 2009 2010 2011
OF
DI
US
$ (
Mill
ions)
Source: RBI Database (www.rbi.org.in/scripts/statistics.aspx)
(Compiled by the Foreign Exchange Department, Central Office, Overseas Investment Division)
The sectoral composition of OFDI in US$ millions for the months of April-June for 2008 and
2009 is presented in Table 1. In both years the manufacturing sector accounted for the highest
percentage; 36.9 percent in 2008 and 47.29 percent in 2009. The share of trading was 15.26
percent (2008) and 12.4 percent (2009), and that of non-financial services was 12.26 percent
(2008) and 12.98 percent (2009).
An interesting aspect of India’s OFDI is its rising share in developed countries compared to
developing countries: 86.1 percent of India’s OFDI was targeted at developing countries until up
to 1990. It then fell to 46.2 percent between 2002 and 2006. On the other hand, OFDI to
developed nations increased from 35 percent in 1990-95 to 53.8 percent in 2002-06 (Athukorala,
2009). The direction of India’s OFDI is given in Table 2, for the same April-June period during
2008 and 2009. The main destinations were Singapore, Netherlands and the US in 2008, and
Mauritius, Singapore and the US in 2009. Thus most of the outward investment was in the
resource-rich industrialised countries.

6
Table 1: Sectoral Distribution of India’s Outward FDI (US$ millions)
Sectors
April – June
2008 2009
Trading 463.8 290.0
Manufacturing 1121.7 1105.3
Financial Services 97.2 10.0
Non-Financial Services 372.6 303.4
Others 983.6 628.5
Total 3039.0 2337.2
Source: RBI, Monthly Bulletin, October 2009
Table 2: Direction of India’s Outward FDI (US$ millions)
Country
April – June
2008 2009
Mauritius 284.1 551.1
Singapore 1023.8 480.1
US 352.4 446.0
UAE 275.8 346.3
Netherlands 723.4 149.8
Switzerland 42.6 64.2
British Virgin Islands 49.8 59.3
Cyprus 13.3 56.1
Hong Kong 22.8 23.0
Germany 14.8 20.8
Others 352 341.4
Total 3154.8 2538.2
Source: RBI, Monthly Bulletin, October 2009

7
To finish this section we provide a brief summary of India’s GDP per capita growth trends
(Figure 3). This is done to help establish a theoretical link between OFDI and growth in case of
India, something which will be analysed more formally later in the paper. India’s GDP per capita
has almost quadrupled between 1980 and 2010. Since the mid-1980s, India has slowly opened up
its markets through economic liberalisation. After more fundamental reforms since 1991, and
their renewal in the 2000s, India has progressed towards a free market economy. The late 2000s
saw India's annual GDP growth reaching 7.5 percent. The rising trend of GDP per capita poses
the question of whether overseas investment also took an upward trajectory during the same
period. Another issue concerns what, if any, OFDI-promoting advantages may have been
initially gained from increasing IFDI in India, mainly because of a surge in ODFI despite being
in stage 2/3 of IDP. Finally, as Indian Multinational Enterprises (MNEs) are different from
Developed Countries’ MNEs, studying the pattern of India’s OFDI gives a chance to understand
and further develop the process of internationalisation. These factors form the motivation for
testing the IDP theory for India.
Figure 3: India’s GDP per capita (Constant 2000 US$): 1980-2010
Source: World databank, World Development Indicators & Global Development Finance.
(www.databank.worldbank.org)

8
In the following sections we discuss the theoretical background, focusing on the factors
determining OFDI. Further, we revisit the IDP theory in detail, followed by a review of the
empirical literature based on other countries’ case studies, before setting up the hypotheses for
subsequent analysis. Next, we discuss the methodology, data and results before reaching some
preliminary conclusions.
3. THEORETICAL OVERVIEW
There is an extensive literature focusing on the factors driving OFDI. The most widely used
approach is based on Dunning’s Eclectic Paradigm, which attributes the level and structure of a
firm’s foreign value-adding activities according to four conditions (Dunning & Lundan, 2008):
1. The extent to which a firm possesses Ownership-specific (O) advantages vis-à-vis firms
of other nationalities in servicing of a group of markets, such as possession of intangible
assets.
2. The extent to which the enterprise adds value to its O-advantages rather than selling
them. This is achieved either by greater organisational efficiency or by exercising
monopoly power. Such advantages are called Internalisation (I) advantages.
3. The extent to which the global interests of a firm are met by creating and utilising its O-
advantages in a foreign location. This gives a competitive advantage to the country that
possesses them, called Locational (L) advantage.
4. Given the Ownership-Localisation-Internationalisation (OLI) advantages, the extent to
which a firm believes that foreign production would fulfil the long term objectives of its
stakeholders underpinning its managerial and organisational strategy.
The Eclectic Paradigm therefore seeks to offer a general framework for determining the extent
and pattern of foreign-owned production undertaken by a country’s own enterprises. However,
the evidence from developing countries suggests that there are a wide range of other important
factors. These include market access for exports, the degree of vertical integration, and access to
technology. For example: Dr. Reddy’s Laboratories acquired Betapharm in Germany suggests
that overseas investment is driven by the aim of accessing markets for exports. Similarly, the

9
acquisition of New Logic in Austria by WIPRO is an example of how access to technology is an
important factor (Nayyar, 2008). Stoian (2013) also supports the role of home country
institutional factors, such as trade openness and liberalisation, as determinants of OFDI. Das
(2013) shows that a source country’s political risk, technology investments, and degree of
openness contribute significantly to OFDI from developing countries.
A recent survey on TNCs from developing countries carried out by UNCTAD, revealed that
these enterprises are motivated by market-seeking, efficiency seeking, resource seeking or
created-asset-seeking behaviour. The survey showed that 51 percent of the respondents said that
market access was the most significant motive, 22 percent aimed at efficiency seeking, searching
for low cost inputs, while 13 percent and 14 percent of investments were directed at resource-
seeking and created-asset-seeking behaviour respectively (UNCTAD, 2006). A number of other
theoretical models, including Neoclassical Trade theory, and approaches using Aggregate and
Policy Variables, analyse the determinants of FDI using a combination of factors. For example,
Neoclassical Trade theory suggests that capital moves to countries with higher returns, while the
Aggregate Variables approach assesses the affect of host country characteristics such as market
size, cultural similarity, and firms’ experience (Faeth, 2009).
The Indian story is consistent with the strategic factors mentioned above, but there is another
significant dimension explaining OFDI from India: the changes in policy regime. Indian TNCs
started emerging in early 1960 when conglomerates like Tata and Birla began to expand by
investing in Sri Lanka and other African countries (Pradhan, 2005). However, as compared to the
past trends, Indian companies rapidly began investing abroad only in the 1990s and, in particular,
India’s overseas investment underwent a major liberalisation since 2000, with the introduction of
FEMA. An investment limit of up to US$ 50 million was now available annually without any
profitability conditions. Companies could now invest 100 percent of the proceeds of their
American Depository Receipts (ADR) and Global Depository Receipts (GDR) issues for
acquisition of foreign companies (RBI Bulletin, 2009).
Further in 2002, the automatic route was liberalised and the limit for investment in Joint
Ventures (JV) and Wholly Owned Subsidiaries (WOS) was increased to US$ 100 million. In
10
2004, the permitted end-use for External Commercial Borrowings (ECB) was enlarged to include
overseas direct investment in JVs/WOSs. Also in 2007, the ceiling of investment by Indian
entities was revised to 400 percent of the net worth. Finally, the Registered Trusts and Societies
engaged in manufacturing and education sector were allowed in 2008 to make investment in the
same sector(s) in a JV/WOS outside India; with prior approval of the Reserve Bank of India
(RBI Bulletin, 2009). Thus, in the post 2003 period, policy changes enabled corporate entities to
invest in bona fide businesses abroad. Also, the focus during this period shifted from green-field
investments to overseas acquisitions globally as a mode of foreign market entry (Hattari &
Rajan, 2010).
Lastly, Indian firms could not have initiated their overseas investment without the capacity and
ability to compete in the world market. The Industrial Deregulation, Trade Liberalisation and the
Public Sector Reforms together subjected the Indian industries to a major restructuring in the
1990s. There were closures, mergers, and acquisition of foreign technologies and R&D
capabilities. This phase marked the emerging competitiveness of Indian firms. Entrepreneurial
abilities were created and legal frameworks necessary for a more market-based economy were
put into place. Thus, the foundations of building up the management, technological and
international capabilities were laid in the era of economic liberalisation.
The research question now arises as to whether India’s OFDI is consistent with the IDP
sequence. Few studies have tested the IDP pattern for India, such as Sathye (2008) and Verma &
Brennan (2011). However, these studies failed to take into account in their empirical testing the
fact that the actual NOI trend is quite different from that suggested by conventional theory.
Despite observing a break from the conventional theory as apparent from the convergence of
OFDI and IFDI flows in the 3rd
stage, these studies still apply the same quadratic specification
instead of reframing the IDP equation. Our paper therefore tries to fill the gap in the literature
firstly by using the IDP concept to focus on the pattern of India’s OFDI and not its net
investment position, and secondly by augmenting IDP to take into account other important
explanatory factors, in addition to economic growth, that could explain the divergence from the
theory. Moreover, our study contributes by undertaking a detailed Time Series analysis. Let us
begin our discussion with a brief revision of the IDP theory.

11
4. REVISITING THE INVESTMENT DEVELOPMENT PATH THEORY
IDP is a theoretical notion that seeks to relate the IFDI and OFDI positions of a country to
different stages of development (Dunning, 1981, 1986, 1988). As a country increases its GDP
per capita and its asset base evolves, the level and pattern of its investment displays a systematic
change. The basic hypothesis is that as a country develops, its domestic Ownership-Localisation-
Internalisation (OLI) advantages alter. This affects both foreign owned firms considering IFDI
projects and national firms contemplating overseas investment.
In Stage 1 of the IDP, a country’s competitive advantages rest mainly on its possession of natural
resources. The country receives only a small amount of IFDI, and this is likely to be directed
towards primary product sector and labour intensive manufacturing sectors supplying simple
consumer goods for sale. In this stage the country undertakes insignificant OFDI due to no O-
advantages, giving a zero or even negative net FDI position.
Stage 2 is characterised by growing importance of investment capital in value added activity.
With rapid economic growth and enlargement of the domestic market, both market seeking and
resource seeking IFDI are induced. Elements of OFDI do emerge, due to experience gained from
international operations, but outward investment by indigenous MNEs is much less important
than IDFI. Hence, the country is still a net recipient of FDI. In both Stage 1 and 2, FDI tends to
be inter rather than intra industry in character.
In Stage 3, a country approaches economic maturity, with an emphasis on innovation driven
growth. The role of IFDI continues to be valued for the provision of O-specific assets in which
the country has comparative disadvantage. And as the indigenous firms begin to generate their
own O-advantage, there emerges a growing trend of OFDI. At this stage, in addition to the
resource or market seeking investment, firms also begin to engage in efficiency-seeking and
strategic asset seeking MNE activity.
12
By Stage 4, a country’s O-advantages begin to match those of developed countries. The country
is now characterised as a net outward investor, with OFDI exceeding IFDI. In both Stages 3 and
4, the composition of FDI becomes increasingly intra-industry in character. Finally, beyond
Stage 4, a country becomes a leading investor in R&D. The country continues to receive IFDI
and engages in OFDI in almost equal measure. Therefore, the net FDI position again hovers
around zero.
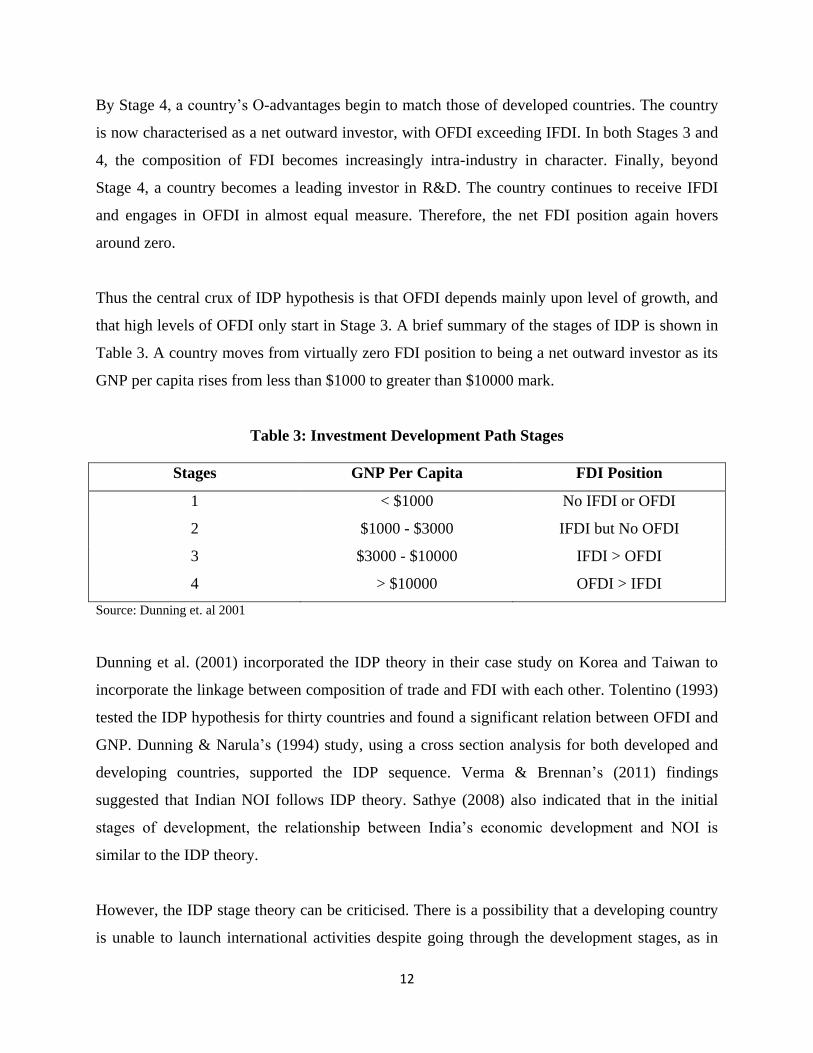
Thus the central crux of IDP hypothesis is that OFDI depends mainly upon level of growth, and
that high levels of OFDI only start in Stage 3. A brief summary of the stages of IDP is shown in
Table 3. A country moves from virtually zero FDI position to being a net outward investor as its
GNP per capita rises from less than $1000 to greater than $10000 mark.
Table 3: Investment Development Path Stages
Stages GNP Per Capita FDI Position
1 < $1000 No IFDI or OFDI
2 $1000 - $3000 IFDI but No OFDI
3 $3000 - $10000 IFDI > OFDI
4 > $10000 OFDI > IFDI
Source: Dunning et. al 2001
Dunning et al. (2001) incorporated the IDP theory in their case study on Korea and Taiwan to
incorporate the linkage between composition of trade and FDI with each other. Tolentino (1993)
tested the IDP hypothesis for thirty countries and found a significant relation between OFDI and
GNP. Dunning & Narula’s (1994) study, using a cross section analysis for both developed and
developing countries, supported the IDP sequence. Verma & Brennan’s (2011) findings
suggested that Indian NOI follows IDP theory. Sathye (2008) also indicated that in the initial
stages of development, the relationship between India’s economic development and NOI is
similar to the IDP theory.
However, the IDP stage theory can be criticised. There is a possibility that a developing country
is unable to launch international activities despite going through the development stages, as in

13
case of Ghana (Kuada and Sorensen, 2000). Moreover, as in case of Turkey, high rates of OFDI
may not occur because of localisation advantages (developed as a result of IFDI), but due to the
political and economic factors. New markets outside Turkey, political uncertainty at home, and
back-to-back domestic economic crises could be important factors (Erkilek, 2003).
At the same time, economic liberalisation may give a massive stimulus to OFDI, and as a result,
some of the stages of IDP may be skipped. This is known as accelerated IDP, and found in case
of ‘Leapfrogging Globals’ where firms are anxious to escape the strictures of local markets
(Svetlicic, 2003). Therefore, the relationship between rapid economic growth and OFDI, as
postulated by the IDP hypothesis, may not fully explain the internationalisation process of all
countries. Studies such as Das (2013) and Stoian (2013) respectively propose that IDP is
restrictive in nature as it takes for granted that underlying economic forces work in certain
fashion, and that inclusion of institutional factors would increase the explanatory power of the
IDP theory.
This paper looks at the relationship between India’s OFDI position and its development levels,
proxied by GDP per capita, to check whether there is a consistency with the Dunning’s IDP
sequence. It also extends the hypothesis by estimating a relationship between OFDI and other
determinants such as IFDI, Exports, Human Capital and R&D. In addition, the research even
tries to capture the endogeneity between OFDI and the independent variables, given that OFDI
could also affect a country’s growth and level of development (Liu, Buck and Shu, 2005).
5. REVIEW OF THE EMPIRICAL LITERATURE
The IDP theory is supported by a number of country experiences, but deviations have been
observed. Some countries have shown significant departures from the predicted path, with little
sign of returning to it. India, for instance, witnessed inefficient government interventions with a
long period of restrictive policies aimed at controlling large private firms, and hence keeping out
inward FDI. OFDI boomed only in the early 1980s when companies undertook promotion of
their exports and overseas investment of capital goods and know-how to escape the constrictions
of the domestic economy. However, further interventions retarded the fuller development of their

14
potential, resulting in low rates of growth of industry, exports and FDI (Lall, 1998). It is
therefore necessary to extend and modify the IDP theory to take into account such country-
specific patterns. Some of the empirical work on both the conventional IDP and augmented IDP
is summarised below.
Barry et al. (2003) studied the bilateral position of Ireland-US to test consistency with the IDP.
They estimated the quadratic specification to allow for non-linearity in the relationship between
net outward investment and economic development. The results provide an evidence of a U-
shaped relationship between Irish GDP and the country’s net outward investment position with
US; in line with the IDP concept. Fonseca et al. (2007) empirically estimated the hypothesis for
Portugal and 25 other countries in different stages of development, and found support for IDP
paradigm.
Duran & Ubeda (2001) suggested a new empirical approach to assess the IDP. They postulated
that it is necessary to include variables associated with the structural dimensions of countries in
the usual quadratic equation used to formulate IDP. Their study hypothesises the need to
supplement the information provided by GDP with other yardsticks of development such as
improvement in physical and human capital, percentage of exports in national output, and access
to technology. Also, factors that influence the type of investment, classified as presence of
natural resources, geographical distances etc, are taken into account. Their main aim was to
analyse a country’s behaviour during each sequence of IDP.
Liu, Buck & Shu (2005) used the GMM estimation method, suggesting that the level of
economic development, proxied by GDP per capita, is still the main factor explaining China’s
OFDI position. Their results show a consistency with the IDP hypothesis, though with certain
refinements in terms of including other explanatory factors affecting OFDI. On the other hand,
the Austrian experience, analysed by Bellak (2001), does not support the expectation that Austria
follows the stylised IDP on the macro level. The paper emphasises that a low net outward
investment position is a sign of weakness of a host location. The study calls for a need to replace
the single variable approach of the macro level analysis with a model with multiple independent
15
variables. The latter should reflect industry, firm and location specific factors, along with
government policies.
Finally, Buckley & Castro (1998) developed the idea of IDP, relating Portugal’s OFDI to per
capita income. Their findings suggest that Portugal’s position does not follow the previously
assumed quadratic equation and they postulate some weaknesses of the paradigm. For example,
institutional factors could be more important for the evolution of inward and outward FDI than
the economic factors encompassed by IDP theory. Still, despite such shortcomings, IDP theory
represents a major contribution towards explaining the evolution of international direct
investment.
6. HYPOTHESIS
As mentioned in the empirical section, country-specific studies propose various refinements to
the IDP hypothesis, taking on board the fact that the way FDI activity and development interact
is unique to each country. Moreover, the pattern of OFDI from Emerging Economies’ MNEs
differs from that of Developed Countries’ MNEs. These studies also suggest that there are other
important aspects affecting outward investment which are not captured by the GDP of a country,
necessitating modifications to the basic IDP theory. With these considerations in mind, our paper
tests the following hypotheses:
1. OFDI is positively influenced by a country’s level of development, measured in terms of
GDP per capita – as established by the IDP theory (Dunning, 1981, 1986, 1988).
2. OFDI is positively associated with a country’s Exports – as proposed by Dunning et. al.
(2001). Furthermore, there is an interaction between the IDP and Trade Development
Path (TDP). The knowledge gained from foreign exporting can contribute to O-
advantages and OFDI. Also, exports and OFDI exhibit a complementary nature in case of
vertical FDI, and are expected to be substitutes if FDI is horizontal (Amiti and Wakelin,
2003). This factor may also be characterised as an institutional variable – greater
openness and liberalisation allows local companies to learn about foreign markets and
operations internationally (Das, 2013).

16
3. OFDI is positively associated with IFDI – as seen in different stages of IDP. IFDI
ultimately leads to the accumulation of O-advantages, which are then exploited by
domestic firms. This points towards the spillover effects from foreign to local firms
(Duran & Ubeda, 2001).
4. OFDI is positively associated with Human Capital stock, which captures the O-
advantages in terms of resources capable of influencing the value of OFDI (Duran &
Ubeda, 2001; Dunning & Narula, 1996). GDP per person is used as a proxy here,
reflecting the productivity of labour1; as greater the productivity of employees, higher is
the suitability for internationalisation.
5. OFDI is positively associated with expenditure on R&D – the rate of investment
increases as the rate of acquisition of ownership-specific advantages increases, and the
latter is the outcome of innovations, R&D in particular. A number of studies support this
link (Cantwell, 1987; Dunning, 1993; Kogut & Chang, 1991).
7. MATERIAL AND METHODS
In this study we modify the IDP hypothesis and specify the OFDI position of a country as a
linear function of GDP per capita, Exports, IFDI, GDP per person and R&D. The analysis
includes time series data for India over the period 1980-2010. The variables of interest are: OFDI
stock, IFDI stock, Exports, GDP per capita, GDP per person, and national expenditure on R&D.
The source of data for FDI position is UNCTAD statistics (unctadstat.unctad.org). Data on
Exports, GDP per capita and GDP per person were drawn from World Bank
(www.databank.worldbank.org), and data on R&D was collected from the Department of
Science and Technology (Govt. of India). All the data series are expressed in natural logarithms.
Figure 4 gives a glimpse of the trends for these variables over time. For the time series analysis,
a standard regression may produce spurious result if the variables under consideration contain
unit roots or are non-stationary. In spurious regression there is statistical significance with a very
1 GDP per person is defined as Gross Domestic Product divided by total employment in the
economy. Hence it reflects the value added by labour – its productivity.

17
high R2, but actually there might be no causal relationship between the variables. It is therefore
important to test whether the variables are cointegrated and have a long run relationship.
Figure 4: Yearly Data Trend: 1980-2010
Source: Authors’ compilation

18
We start the analysis with the Augmented Dickey-Fuller (ADF) test for unit root. The procedure
is to reject the null hypothesis of a unit root against the one-sided alternative if the ADF statistic
is less than the critical value, and conclude that the series is stationary. Next we test for
cointegration using the ‘Engle-Granger’ approach, involving the following steps:
1. Pre-test the variables for their order of integration. By definition, cointegration
necessitates that two variables be integrated of the same order. The ADF test is used to
infer the number of unit roots (if any) in each variable, hence determine the order of
integration of each variable. There are three cases:
a. if all variables are stationary then it is not necessary to proceed further as the standard
time series methods can be applied
b. if all variables are integrated of different order, then we could conclude that they are
not cointegrated in the usual sense of the term
c. if all variables are integrated of the same order then we proceed to step 2
2. If the results of Step 1 indicate that both the dependent and independent variables are
integrated of order 1, i.e. I(1), the next step is to estimate the long run relationship2:
lnOFDIt = β1 + β2lnIFDIt + β3lnExportst + β4lnGDP PCt + β5lnGDP PPt + β6lnR&Dt + et
(i)
In order to determine that variables are actually cointegrated, we obtain the residual series
from the above equation. The residuals are basically the estimated values of the
deviations from the long run relationship.
2 Use of OFDI as the dependent variable, instead of NOI, also overcomes the loss of observations
associated with using net investment position when we take log transformation.

19
3. Check for the presence of unit root in the residual series obtained in Step 2. If the residual
series is stationary and is integrated of order zero, (I(0)), then we conclude that the
variables are cointegrated of order 1 and have a long run relationship.
4. Estimate the Error Correction Model (ECM). If Step 3 shows that the variables are
cointegrated, then the residuals obtained from the equilibrium regression in Step 2 can be
used to estimate the ECM as follows:
∆lnOFDIt = α1 + α2[lnOFDIt-1 – (β2lnIFDIt-1 + β3lnExportst-1 + β4lnGDP PCt-1 +
β5lnGDP PPt-1 + β6lnR&Dt-1)] + α3∆lnOFDIt-1 + α4∆lnIFDIt + α5∆lnExportst
+ α6∆lnGDP PCt + α7∆lnGDP PPt + α8∆lnR&Dt + εt (ii)
where βi = the parameters of the cointegrating equation (i)
εt = white-noise disturbances
αi = parameters
Note that the magnitude of the residual et-1 is the deviation from the long run equilibrium
in period (t-1). Hence, we could use the saved residuals obtained from equation (i) as an
instrument for the expression [lnOFDIt-1 – (β2lnIFDIt-1 + β3lnExportst-1 + β4lnGDP PCt-1 +
β5lnGDP PPt-1 + β6lnR&Dt-1)] in equation (ii). Thus the ECM can be written as:
∆lnOFDIt = α1 + α2et-1 + α3∆lnOFDIt-1 + α4∆lnIFDIt + α5∆lnExportst
+ α6∆lnGDP PCt + α7∆lnGDP PPt + α8∆lnR&Dt + εt (iii)
where et-1 = the error correction term
The ECM is particularly powerful since it allows estimating both short and long run effects of
explanatory time series variables in a single statistical model. For example, in equation (iii), α4
captures any immediate effect IFDI has on OFDI, described as the short-term effect, and the long
term effect occurs at the rate dictated by value of α2. Often in case of time series data, a change

20
in independent variables may affect the dependent variable either immediately (contemporaneous
effect) or the effect may be delayed. ECM allows us to analyse all types of effects.
5. The final step is to assess the model. Here the ‘speed of adjustment’ coefficient α2 is of
particular interest. It is clear from equation (iii) that for any given value of et-1, a large
value of α2 is associated with a large value of ∆OFDIt. If α2 is zero, the change in OFDIt
does not at all respond to the deviation from long-run equilibrium in (t-1). Hence α2
should be significantly different from zero if the variables are cointegrated.
To complete the analysis we also carry out the Granger Causality Test for exogeneity to find
whether there is a two-way causal relationship between OFDI and its explanatory variables.
8. RESULTS
The ADF3
test was conducted to determine whether the variables are stationary. The results for
non-differenced level series of each variable are given in Table 4, indicating that the null
hypothesis of a unit root in the level series is not rejected for any of the variables, i.e. all
variables are non-stationary. After testing for the level series, the ADF test is performed for the
1st difference of each of the variable. The results (also given in Table 4) for the 1
st difference
series indicate stationarity, implying that all the variables are integrated of order 1.
As all the variables are I(1), we proceed to estimating the long run relationship for 3 sets of
equations, the difference between the 3 equations is in terms of the explanatory variables
included.
3 An alternative test for stationarity was also performed, called Phillips-Perron Test, and similar
results were obtained. All the variables were found to be I(1). See Appendix A.

21
Table 4: t-statistics for Augmented Dickey Fuller (ADF) Tests for Stationarity (Null
Hypothesis: Series contains a unit root)
Variables
Level Series 1st Difference Series
ADF
ADF
(including
constant)
ADF
(including
constant &
trend)
ADF
ADF
(including
constant)
ADF
(including
constant &
trend)
lnOFDI 5.07 2.01 -1.59 -3.42* -5.19* -6.59*
lnGDP per capita 11.04 3.87 0.51 -1.13 -3.50* -5.17*
lnExports 6.29 1.28 -2.69 -2.52* -4.62* -4.81*
lnIFDI
lnGDP per person
lnR&D
2.82
9.28
2.72
0.94
2.39
-0.24
-2.82
-1.03
-1.98
-1.46
-1.58
-1.81**
-3.06*
-3.87*
-3.43*
-3.39
-4.67*
-3.34*
Notes: a *Denotes significance at 5 percent level b **Denotes significance at 10 percent level c All variables are non-stationary in level and stationary in 1st difference, i.e. the variables are I(1).
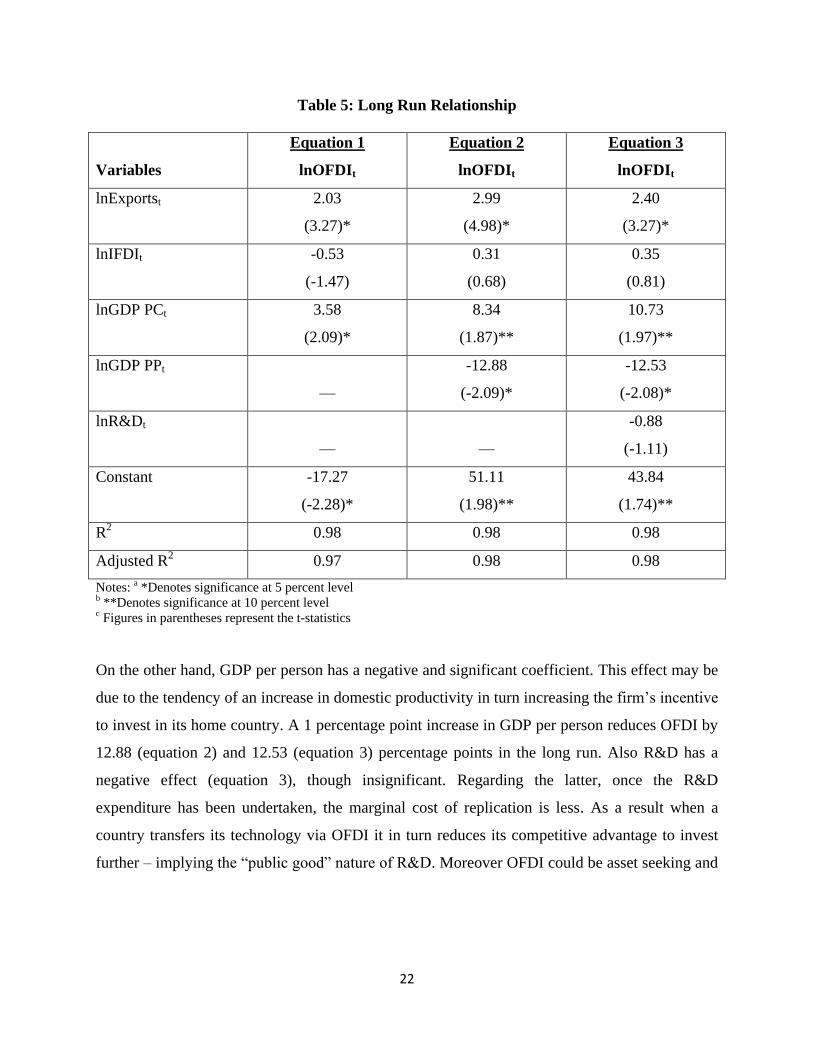
In all the equations (Table 5), Exports positively and significantly influence OFDI from India as
hypothesised. A 1 percentage point increase in Exports increases OFDI by 2.03 (equation 1),
2.99 (equation 2) and 2.40 (equation 3) percentage points in the long run. The other significant
and positive contributor in determining the OFDI from India is GDP per capita; a 1 percentage
point increase in GDP per capita increases OFDI by 3.58 (equation 1), 8.34 (equation 2) and
10.73 (equation 3) percentage points in the long run. The latter result is consistent with the IDP
theory and confirms that India’s OFDI is influenced by the level of development. Inward FDI is
also found to be a positive factor (equation 2 and 3), though insignificant.
22
Table 5: Long Run Relationship
Variables
Equation 1
lnOFDIt
Equation 2
lnOFDIt
Equation 3
lnOFDIt
lnExportst 2.03
(3.27)*
2.99
(4.98)*
2.40
(3.27)*
lnIFDIt -0.53
(-1.47)
0.31
(0.68)
0.35
(0.81)
lnGDP PCt 3.58
(2.09)*
8.34
(1.87)**
10.73
(1.97)**
lnGDP PPt
—
-12.88
(-2.09)*
-12.53
(-2.08)*
lnR&Dt
—
—
-0.88
(-1.11)
Constant -17.27
(-2.28)*
51.11
(1.98)**
43.84
(1.74)**
R2 0.98 0.98 0.98
Adjusted R2 0.97 0.98 0.98
Notes: a *Denotes significance at 5 percent level b **Denotes significance at 10 percent level c Figures in parentheses represent the t-statistics
On the other hand, GDP per person has a negative and significant coefficient. This effect may be
due to the tendency of an increase in domestic productivity in turn increasing the firm’s incentive
to invest in its home country. A 1 percentage point increase in GDP per person reduces OFDI by
12.88 (equation 2) and 12.53 (equation 3) percentage points in the long run. Also R&D has a
negative effect (equation 3), though insignificant. Regarding the latter, once the R&D
expenditure has been undertaken, the marginal cost of replication is less. As a result when a
country transfers its technology via OFDI it in turn reduces its competitive advantage to invest
further – implying the “public good” nature of R&D. Moreover OFDI could be asset seeking and

23
therefore may not rely on R&D, as supported by studies such as Stoian (2013) and Andreff
(2002) that suggested that technological development per se does not enhance OFDI4.
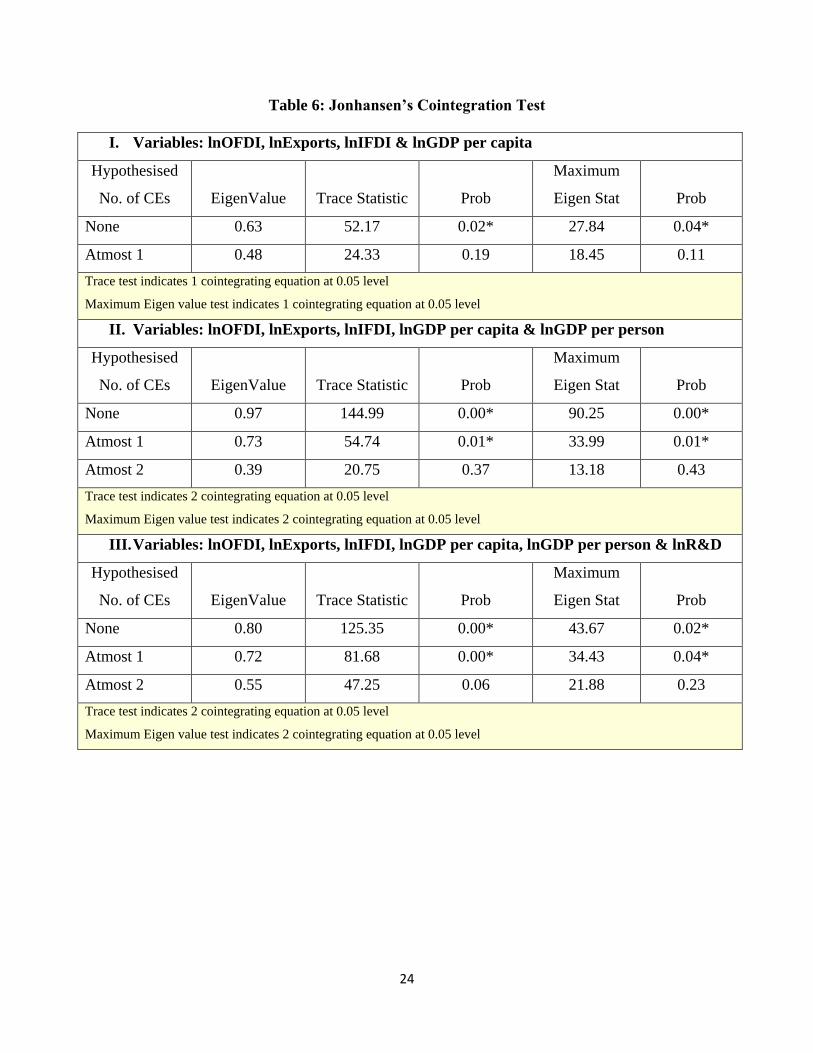
We also performed the Johansen’s Cointegration test to check for the presence and the number of
cointegrating vectors among the non-stationary series using the Trace Statistic and Maximum
Eigen Statistic. For all 3 equations results (Table 6) indicate the presence of at least 1
cointegrating vector at 5 percent significance level, suggesting the existence of a long run
relationship between the variables.
The residual series are then obtained from the equilibrium regressions for each of the 3 equations
to check for stationary. As the residuals are stationary in level (Table 7), i.e. I(0), it confirms that
the variables are cointegrated of order 1 and there exists an ECM that brings together the long
run relationship.
4 As a test for robustness, Equation 3 was also estimated using AYS: Average years of Total
Schooling (Age 25+) and PA: Number of Patent Applications filed by Residents (an output
based measure), instead of GDP per person and R&D Expenditure respectively. The results do
not change:
lnODFI = -27.84 + 1.37 lnExportst – 0.10 lnIFDIt + 6.36 lnGDP PCt – 4.41 lnAYSt – 0.31 lnPAt
(-5.29)* (3.01)* (-0.43) (3.83)* (-3.49)* (-0.49)
The error correction term for the new estimated equation (-0.7214) is significant at 5 percent
level and has the expected negative sign. All the stationarity tests hold.
24
Table 6: Jonhansen’s Cointegration Test
I. Variables: lnOFDI, lnExports, lnIFDI & lnGDP per capita
Hypothesised
No. of CEs
EigenValue
Trace Statistic
Prob
Maximum
Eigen Stat
Prob
None 0.63 52.17 0.02* 27.84 0.04*
Atmost 1 0.48 24.33 0.19 18.45 0.11
Trace test indicates 1 cointegrating equation at 0.05 level
Maximum Eigen value test indicates 1 cointegrating equation at 0.05 level
II. Variables: lnOFDI, lnExports, lnIFDI, lnGDP per capita & lnGDP per person
Hypothesised
No. of CEs
EigenValue
Trace Statistic
Prob
Maximum
Eigen Stat
Prob
None 0.97 144.99 0.00* 90.25 0.00*
Atmost 1 0.73 54.74 0.01* 33.99 0.01*
Atmost 2 0.39 20.75 0.37 13.18 0.43
Trace test indicates 2 cointegrating equation at 0.05 level
Maximum Eigen value test indicates 2 cointegrating equation at 0.05 level
III. Variables: lnOFDI, lnExports, lnIFDI, lnGDP per capita, lnGDP per person & lnR&D
Hypothesised
No. of CEs
EigenValue
Trace Statistic
Prob
Maximum
Eigen Stat
Prob
None 0.80 125.35 0.00* 43.67 0.02*
Atmost 1 0.72 81.68 0.00* 34.43 0.04*
Atmost 2 0.55 47.25 0.06 21.88 0.23
Trace test indicates 2 cointegrating equation at 0.05 level
Maximum Eigen value test indicates 2 cointegrating equation at 0.05 level

25
Table 7: t-statistics for Augmented Dickey Fuller (ADF) Tests for Stationarity (Null
Hypothesis: Residual Series contains a unit root)
Residual Series
(Level)
ADF
ADF (including
constant)
ADF (including
constant & trend)
Equation 1 -2.55* -2.51 -2.32
Equation 2 -3.89* -3.81* -3.67*
Equation 3 -3.46* -3.39* -3.27**
Notes: a *Denotes significance at 5 percent level b **Denotes significance at 10 percent level
The ECM results are summarised in Table 8. The lagged error correction terms for all 3
equations are statistically significant at 5 percent level and have the expected negative sign,
indicating that the ‘speed of adjustment’ coefficient is in accordance with convergence toward
the long run equilibrium. For example, in the 1st equation, in response to a one unit deviation
from long run equilibrium, OFDI tends to decrease by 0.4243 units, hence eliminating the
positive discrepancy from long run equilibrium present in period t-1; i.e. in the absence of other
intervention the dependent variable of OFDI converges fast to its long run equilibrium. Hence,
there is a cointegrating relationship between the dependent and independent variables.

26
Table 8: Error Correction Model
Variables
Equation 1
∆lnOFDIt
Equation 2
∆lnOFDIt
Equation 3
∆lnOFDIt
ECMt-1 -0.4243
(-2.8929)*
-0.6201
(-2.8871)*
-0.7489
(-3.5045)*
∆lnExportst 0.3989
(0.7301)
0.9436
(1.5345)
0.6755
(1.1761)
∆lnIFDIt 0.0578
(0.1348)
0.0652
(0.1491)
0.0806
(0.1949)
∆lnGDP PCt 5.6669
(2.6832)*
14.7842
(2.4784)*
23.5035
(3.7162)*
∆lnGDP PPt
—
-12.3782
(-2.0122)*
-19.9496
(-3.0842)*
∆lnR&Dt
—
—
-0.3246
(-0.3554)
∆lnOFDIt-1 -0.0391
(-0.2448)
0.0294
(0.1684)
-0.0066
(-0.0405)
Constant -0.0565
(-0.5149)
-0.0277
(-0.2440)
-0.0535
(-0.4461)
R2 0.49 0.55 0.65
Adjusted R2 0.38 0.41 0.51
F-Stat 4.42* 4.04* 4.69*
Notes: a *Denotes significance at 5 percent level b Figures in parentheses represent the t-statistics
In the above model we implicitly assume that all variables are exogenously determined.
However, there is a possibility that OFDI influences the explanatory factors. For instance, OFDI
may facilitate exports by establishing export-platform production facilities. Therefore we
perform the Granger Causality Test to investigate possible endogeneity or a two-way causation
between OFDI and its explanatory variables (Table 9). The result confirms exogeneity with

27
respect to Exports, IFDI, GDP per capita and GDP per person, pointing that reverse causation
does not exist5. But the peculiar outcome is the direction of causality between R&D and OFDI.
Table 9: Granger Causality Test for Exogeneity
1 Lag 2 Lag
F Statistic P-value F Statistic P-value
Exports → OFDI 17.14 0.00* 7.63 0.00*
OFDI → Exports 2.47 0.13 1.40 0.26
Exports granger cause OFDI, but OFDI do not granger cause Exports.
IFDI → OFDI 4.79 0.04* 2.06 0.15
OFDI → IFDI 0.00 0.94 0.01 0.99
IFDI granger cause OFDI, but OFDI do not granger cause IFDI.
GDP per capita → OFDI 5.21 0.03* 2.76 0.08**
OFDI → GDP per capita 1.43 0.24 0.79 0.47
GDP per capita granger causes OFDI, but OFDI do not granger cause GDP per capita.
GDP per person → OFDI 3.92 0.06** 1.86 0.18
OFDI → GDP per person 0.35 0.56 0.40 0.67
GDP per person granger causes OFDI, but OFDI do not granger cause GDP per person.
R&D → OFDI 1.91 0.18 0.94 0.40
OFDI → R&D 16.57 0.00* 7.01 0.00*
R&D does not granger cause OFDI, but OFDI granger causes R&D.
Notes: a *Denotes significance at 5 percent level b **Denotes significance at 10 percent level c → indicates the direction of causality. Akaike Information Criterion (AIC) suggests Lag order 2, and Schwarz
Information Criterion (SC) suggests Lag order 1.
The finding, that OFDI Granger causes R&D, suggests the possibility of OFDI bringing in a
reverse technology spillover effect. In fact, there are a number of mechanisms through which
5 This result is similar to Tolentino (2010) that suggests that OFDI from India is exogenous to
macroeconomic factors such as trade, using Impulse Response Functions to study the extent to
which OFDI responds to a shock in macroeconomic variables, and to estimate the direction of
such a response.

28
OFDI influences home country’s technology. One of the ways is resource sharing, wherein the
host and home country firms jointly undertake technological research. Another mechanism is
particularly effective when firms carry out asset seeking FDI through mergers and acquisitions,
obtaining advanced technologies and enhancing their core competitiveness. Also, OFDI
facilitates the access to technology in foreign markets, and stimulates the firms to strengthen
their R&D base when they face competitors worldwide (Huang & Wang, 2009). For instance,
Taiwanese firms’ outward investment has stimulated their R&D base, implying that OFDI and
domestic R&D are complementary (Chen & Yang, 2013).
Looking particularly at the Indian case, companies are aspiring to buy technology, processes,
managerial know-how, and marketing networks. The pharmaceutical companies are looking to
expand their R&D base as a part of their strategic asset seeking investment (Hattari & Rajan,
2010). Automotive companies such as Tata and Amtek Groups are seeking external
complementary technical and value-added manufacturing assets. When these companies
undertake greenfield investments and strategic acquisitions, they not only form a source but also
a recipient of cross-border knowledge flows (Pradhan & Singh, 2009). Moreover, if we look at
the number of patent applications by Indian residents as the measure of the technology outcome
of spillover effect of OFDI, there appears a linear rising trend between 1990 and 2010 (Figure 5).
Meanwhile, the pace of internationalisation of Indian firms has also been increasing. Especially
from 2005 onwards, both the number of patent applications and OFDI have shown a growing
trend, though the increase in latter may be because of policy liberalisation. Nonetheless, it would
be interesting to test the relationship between the two by establishing a model to analyse whether
there exists a positive cointegration in the long run – a subject of further research.

29
Figure 5: Trends in Patent Application by Indian Residents & OFDI
Source: Compiled from the Annual Reports of Office of the Controller General of Patents, Designs, Trade Marks
and Registrar of Geographical Indications, GoI (Ministry of Commerce & Industry) & UNCTAD Stats.
9. CONCLUSION
The present study proposes the necessity for certain refinements to the IDP hypothesis, implying
a country-specific approach, and also calls for a theoretical need to accommodate
interdependence between the variables under consideration. The main research question
addressed in this paper is whether OFDI from India could be explained in terms of India’s stage

30
of development only, as postulated by the IDP hypothesis, or whether it requires an extension of
the conventional theory – augmenting IDP to include the impact of institutional reforms, trade
liberalisation and inflows of foreign investment. This question is examined through an extensive
use Time Series analysis, thus adding further to the literature.
The importance of the central question, whether India’s OFDI position is consistent with the IDP
sequence, is raised by earlier studies, suggesting that the IDP theory needs to be tailored
according to country-specific patterns. Moreover, the IDP itself cannot explain India’s surge in
OFDI despite being in stage 2 (or stage 3). Similar to previous empirical studies, such as
Tolentino (1993), this paper supports a significant and positive relation between India’s GDP per
capita and its OFDI position. However, the paper has demonstrated that additional variables are
important long run explanatory factors, which help to capture the distinct features of policy
reforms affecting India’s OFDI, not incorporated in the original IDP hypothesis. Another
important observation is that OFDI causes a reverse technology spillover effect, as indicated by
direction of causality between OFDI and R&D.
Finally, certain policy implications of the study may be highlighted. First of all, it might be
suggestive that as OFDI follows economic development, the policy makers should encourage
growth. Secondly, the augmented IDP hypothesis postulates that policies directed towards
promoting exports and inflows of foreign investment are unlikely to deter OFDI, and such
policies should be prioritised. This follows from the evidence that OFDI is jointly determined by
the level of development, the export position, IFDI and human capital in the long run. Lastly, it
needs to be ensured that overseas investment by Indian companies does not crowd out domestic
investment. The potential implications of a rising trend in OFDI for domestic investment, growth
and employment needs to be examined against the benefits that domestic companies derive
elsewhere in terms of an expanded market base, backward and forward vertical integration, and
cheap skilled labour.

31
Appendix A: Phillips Perron Test
Table: Z(t)-statistics for Phillips Perron Test for Stationarity (Null Hypothesis: Series
contains a unit root)
Variables
Level Series 1st Difference Series
Including
Constant
Including
Constant &
Trend
Including
Constant
Including
Constant &
Trend
lnOFDI 2.78 -1.54 -5.21* -7.22*
lnGDP per capita 4.39 0.79 -3.57* -5.17*
lnExports 1.19 -2.73 -4.63* -4.79*
lnIFDI 1.62 -1.89 -3.05* -3.37**
lnGDP per person 2.65 -1.01 -3.90* -4.67*
lnR&D -0.56 -1.99 -3.42* -3.33**
Notes: a *Denotes significance at 5 percent b ** Denotes significance at 10 percent
The above table indicates that all the variables are integrated of order 1.

32
Appendix B: Long Run Regression: A Sub-Classification (1990-2010)
Equation 1: lnOFDIt = -27.01 + 1.13 lnExportst - 0.23 lnIFDIt + 5.28 lnGDP PCt
(-4.58)* (2.40)* (-0.94) (3.98)*
Equation 2: lnODFI = 9.36 + 0.89 lnExportst + 0.31 lnIFDIt + 12.08 lnGDP PCt – 9.66 lnGDP PPt
(0.25) (1.06) (0.55) (2.13)* (-1.17)
Equation 3: lnODFI = 8.65 + 0.99 lnExportst + 0.29 lnIFDIt + 11.34 lnGDP PCt
(0.15) (1.09) (0.35) (1.72)
– 8.90 lnGDP PPt – 0.15 lnR&Dt
(-0.67) (-0.07)
(*Denotes significance at 5 percent level)
We consider a sub-classification from 1990-2010 that categorises India’s i) Liberalisation (1992-
95) – introduction of ‘Automatic Route’ for overseas investment in 1992 and a comprehensive
policy framework in 1995; ii) Creation of a Fast Track Route (1995-2000) - raising the limits
from US$ 2 million to US$ 4 million; and iii) Introduction of FEMA (2000s) (Khan, 2012). The
results are similar to those obtained for the overall 1980-2010 period, except that only Exports
and GDP per capita are significant variables.

33
REFERENCES
Amiti, M., and Wakelin, K. (2003). “Investment Liberalization and International Trade”, Journal
of International Economics, Vol. 61: 101-126.
Andreff, W. (2002). “The New Multinational Corporations from Transition Countries”,
Economic Systems, Vol. 26(4): 371-379.
Asterious, D., and Hall, S.G. (2006). Applied Econometrics: A Modern Approach (New York:
Palgrave MacMillan).
Athukorala, P. (2009). “Outward Foreign Direct Investment from India”, Asian Development
Review, Vol. 26(2): 125-153.
Barry, F., Gorg, H., and Mcdowell, A. (2003). “Outward FDI and the Investment Development
Path of a Late-Industrializing Economy: Evidence from Ireland”, Regional Studies, Vol. 37(4):
341-349.
Bellak, C. (2001). “The Austrian Investment Development Path”, Transnational Corporations,
Vol. 10(2).
Buckley, P., and Castro, F. (1998). “The Investment Development Path: The Case of Portugal”,
Transnational Corporations, Vol. 7(1): 1–15.
Buckley, P. J., Forsans, N., and Munjal, S. (2012). “Host-Home Country Linkages and Host-
Home Country Specific Advantages as Determinants of Foreign Acquisitions by Indian Firms”,
International Business Review, Vol. 21(5): 878-890.
Cantwell, J. (1987). “The Reorganization of European Industries after Integration: Selected
Evidence on the Role of Transnational Enterprise Activities”, Journal of Common Market
Studies, Vol. 36(1): 127-152.

34
Chen, K. and Yang, S. (2013). “Impact of Outward Foreign Direct Investment on Domestic
R&D Activity: Evidence from Taiwan’s Multinational Enterprises in Low-wage Countries”,
Asian Economic Journal, Vol. 27(1): 17-38.
Chowdhury, M.B. (2011). “India’s Outward Foreign Direct Investment: Closed Doors to Open
Souk”, MRPA Paper No. 32828.
Das, K. C. (2013). “Home Country Determinants of Outward FDI from Developing Countries”,
Margin: The Journal of Applied Economic Research, Vol. 7(1): 93-116.
Dunning, J.H. (1981). “Explaining the International Direct Investment Position of Countries:
Towards a Dynamic or Developmental Approach”, Weltwirtschaftliches Archiv, Vol. 119(1): 30-
64.
Dunning, J.H. (1986). “The Investment Development Cycle Revisited”, Weltwirtschaftliches
Archiv, Vol. 122(4): 667-677.
Dunning, J.H. (1988). Explaining International Production (London: George Allen and Unwin).
Dunning, J.H. (1993). Multinational Enterprises and the Global Economy (Workingham:
Addison-Wesley).
Dunning, J.H., and Narula, R. (1994). Transpacific Foreign Direct Investment and the
Investment Development Path: the Record Assessed, Essays in International Business, No. 10
(South Carolina: University of South Carolina).
Dunning, J.H., and Narula, R. (1996). “The Investment Development Path Revisited: Some
Emerging Issues”, in J. Dunning, and R. Narula, eds., Foreign Direct Investment and
Government (London: Routledge).

35
Dunning, J.H., Kim, C., and Lin, J. (2001). “Incorporating Trade into the Investment
Development Path: A Case Study of Korea and Taiwan”, Oxford Development Studies, Vol.
29(2): 145–154.
Dunning, J.H., and Lundan, S.M. (2008). Multinational Enterprises and the Global Economy
(Cheltenham: Edward Elgar).
Duran, J.J., and Ubeda, F. (2001). “The Investment Development Path: A New Empirical
Approach and Some Theoretical Issues”, Transnational Corporations, Vol. 10(2).
Enders, W. (2004). Applied Econometric Time Series (USA: Wiley).
Erkilek, A. (2003). “A Comparative Analysis of Inward and Outward FDI in Turkey”,
Transnational Corporations, Vol. 12(3): 79–105.
Faeth, I. (2009). “Determinants of Foreign Direct Investment—A Tale of Nine Theoretical
Models”, Journal of Economic Surveys, Vol. 23(1): 165-196.
Fonseca, M., Mendonça, A., and Passos, J. (2007). “The Investment Development Path
Hypothesis: Evidence from the Portuguese Case – A Panel Data Analysis”, Working Paper No.
21, Technical University of Lisbon, Lisbon.
Hattari, R., and Rajan, R.S. (2010). “India as a Source of Outward Foreign Direct Investment”,
Oxford Development Studies, Vol. 38(4): 497-518.
Huang, S., and Wang, Q. (2009). “Reverse Technology Spillover from Outward FDI: The Case
of China”, Proceedings of the 2009 International Conference on Management of e-Commerce
and e-Government, 2009, pp. 550-553.
Kalotay, K. (2008). “Russian Transnationals and International Investment Paradigms”, Research
in International Business and Finance, Vol. 22(2): 85-107.

36
Kalotay, K., and Sulstarova, A. (2010). “Modelling Russian Outward FDI”, Journal of
International Management, Vol. 16(2): 131-142.
Khan, H.R. (2012). “Outward Indian FDI – Recent Trends & Emerging Issues”, Address
Delivered at the Bombay Chamber of Commerce & Industry, Mumbai on March 2, 2012.
Kogut, B., and Chang, S.J. (1991). “Technological Capabilities and Japanese Direct Investment
in the United States”, The Review of Economic and Statistics, Vol. 73(3): 401-413.
Kohli, A. (2004). State-Directed Development: Political Power and Industrialization in the
Global Periphery (UK: Cambridge University Press).
Kuada, J., and Sorensen, O. J. (2000). Internationalization of Companies from Developing
Countries (Binghampton: International Business Press).
Lall, S. (1998). “The Investment Development Path: Some Conclusions”, in J. Dunning, and R.
Narula, eds., Foreign Direct Investment and Government (London: Routledge).
Liu, X., Buck, T., and Shu, C. (2005). “Chinese Economic Development, the Next Stage:
Outward FDI?”, International Business Review, Vol. 14: 97-115.
Mathews, J. A. (2002). Dragon Multinationals: A New Model for Global Growth (Oxford:
Oxford University Press).
Nayyar, D. (2008). “The Internationalization of Firma from India: Investment, Mergers and
Acquisition”, Oxford Development Studies, Vol. 36(1): 111-131.
Pradhan, J.P. (2005). “Outward Foreign Direct Investment from India: Recent Trends and
Patterns”, Gujarat Institute of Development Research, Working Paper No. 153.
37
Pradhan, J. P. and Singh, N. (2009). “Outward FDI and Knowledge Flows: A Study of Indian
Automotive Sector”, International Journal of Institutions and Economics, Vol. 1(1): 156-187.
Ramamurti, R., and Singh, J.V. (2009). “Generic Strategies of India’s Emerging Multinationals”,
in R. Ramamurti, and J. V. Singh, eds., Emerging Multinationals from Emerging Markets
(Cambridge: Cambridge University Press).
Ramamurti, R. (2012). “What is Really Different about Emerging Market multinationals?”,
Global Strategy Journal, Vol. 2(1): 41-47.
Reserve Bank of India (2009). “Indian Investment Abroad in Joint Ventures and Wholly Owned
Subsidiaries: 2009-10 (April-June)”, Monthly Bulletin, October 2009.
Satyanand, P.N., and Raghavendran, P. (2010). “Outward FDI from India and its Policy
Context”, Columbia FDI Profiles, Vale Columbia Center on Sustainable International
Investment, September 2010.
Sathye, S. (2008). “Investment Development Path Theory and the Case of India”, International
Review of Business Research Papers, Vol. 4(1): 299-309.
Sauvant, K.P. (2005). “New Sources of FDI: The BRICS”, Journal of World Investment and
Trade, Vol. 6(5): 639-709.
Stoian, C. (2013). “Extending Dunning’s Investment Development Path: The Role of Home
Country Institutional Determinants in Explaining Outward Foreign Direct Investment”,
International Business Review, Vol. 22: 615-637.
Svetlicˇicˇ, M. (2003). “Theoretical Context of Outward Foreign Direct Investment from
Transition Economies”, in M. Svetlicˇicˇ, and M. Rojec, eds., Facilitating Transition by
Internationalization: Outward Direct Investment from European Economies in Transition
(Aldershot: Ashgate), pp. 3-28.

38
Tolentino, P. (1993). Technological Innovation and Third World Multinationals (London:
Routledge).
Tolentino, P. (2008). “The Determinants of the Outward Foreign Direct Investment of China and
India: Whither the Home Country?”, Working Paper Series No. 2008-049, United Nations
University, UNU-Merit, The Netherlands.
Tolentino, P. E. (2010). “Home Country Macroeconomic Factors and Outward FDI of China and
India”, Journal of International Management, Vol. 16: 102-120.
UNCTAD (2006). World Investment Report 2006. FDI from Developing and Transition
Economies: Implications for Development (New York and Geneva: United Nations).
Verma, R. and Brennan, L. (2011). “The Investment Development Path Theory: Evidence from
India”, International Journal of Emerging Markets, Vol. 6(1): 74-89.