Is the Economic Crisis Impairing Convergence in Innovation ... · Is the Economic Crisis Impairing...
34
1 Is the Economic Crisis Impairing Convergence in Innovation Performance across Europe? Journal of Common Market Studies (forthcoming, 2011) Daniele Archibugi* § Andrea Filippetti*° § *Italian National Research Council – CNR - IRPPS °University “La Sapienza” of Rome – Department of Economic Science § Birkbeck College – University of London Abstract Are EU Member States converging in terms of their innovative effort? To what extent the current economic downturn is impairing the convergence across the European Union countries in innovation performance? Using macro and micro data, we show that the European Union Member States have converged in their innovative potential over the 2004-2008 period. The economic crisis of the Fall 2008 is striking innovative investment in almost all EU countries, but the catching-up countries are the most affected leading to increasing divergence. The danger of growing disparities in innovative capabilities may lead to divergence also in income and well-being. The paper discusses some of the innovation policies that can be carried out at the EU level to facilitate cohesion. Keywords: convergence, technological capabilities, European innovation and technological policy, financial crisis, cross-country comparison
Transcript of Is the Economic Crisis Impairing Convergence in Innovation ... · Is the Economic Crisis Impairing...
1
Is the Economic Crisis Impairing Convergence in
Innovation Performance across Europe?
Journal of Common Market Studies
(forthcoming, 2011)
Daniele Archibugi*§
Andrea Filippetti*°§
*Italian National Research Council – CNR - IRPPS
°University “La Sapienza” of Rome – Department of Economic Science §Birkbeck College – University of London
Abstract
Are EU Member States converging in terms of their innovative effort? To what extent the current
economic downturn is impairing the convergence across the European Union countries in
innovation performance? Using macro and micro data, we show that the European Union Member
States have converged in their innovative potential over the 2004-2008 period. The economic crisis
of the Fall 2008 is striking innovative investment in almost all EU countries, but the catching-up
countries are the most affected leading to increasing divergence. The danger of growing disparities
in innovative capabilities may lead to divergence also in income and well-being. The paper
discusses some of the innovation policies that can be carried out at the EU level to facilitate
cohesion.
Keywords: convergence, technological capabilities, European innovation and technological policy,
financial crisis, cross-country comparison

2
Introduction
The European Union (EU) is grounded on three main pillars: cohesion, integration and
convergence. It will be important for analysis and policy advise to investigate what the impact will
be of the 2008 global financial crisis on each of these pillars (see Hodson and Quaglia, 2009 p.
944). While a few recent studies have addressed the impact of the financial crisis in terms of
income, productivity and employment convergence, less attention has, so far, been devoted to the
impact on innovation performance.1Convergence in innovation is a crucial component of a
successful European integration since, on the one hand, innovation provides a key asset to enhance
economic competitiveness and, on the other hand, it facilitates cohesion in the social and political
sphere (see Sharp, 1998). We assume, in fact, that the lack of convergence in innovative activities
will jeopardize also EU cohesion policies, since it will make the least developed countries more
dependent on the knowledge generated elsewhere or, even worse, will not allow them to benefit at
the same level from the available knowledge.
The existence of major technological gaps within Europe has traditionally been recognized as
constraining the building of a European System of Innovation (see, for example, Pavitt, 1998,
Lorenz and Lundvall, 2006). Enlargement has led to a more heterogeneous EU in terms of
innovation capabilities and technological development. Moreover, New Member Countries are
more vulnerable not only in terms of scientific and technological infrastructure, but also in terms of
financial institutions, and are therefore likely to be hit more severely by adverse economic effects.
The reduction of national disparities in scientific and technological competences is therefore a key
priority in allowing the EU to close the gap with the US and Japan (see Archibugi and Coco, 2005).
This article’s aim is to investigate the dynamics of countries’ technological convergence and
innovation performance in the light of two major events: the EU enlargement, and the impact of the
global financial crisis.
European policy makers have widely recognized the importance of science, technology and
innovation for the continent’s economic growth and well-being. The “Lisbon strategy” puts the
“Knowledge Economy” at the centre of its economic policy and asks Member States to make a
major effort to invest more in R&D and other innovation related activities. But the European Union
is composed of countries which vary considerably in terms of technological expertise. While some
of them, such as Sweden and Finland, are world innovation leaders, others are lagging behind.
1 For a preliminary attempt, see European Commission 2009a.

3
Moreover, the 2004 and 2007 enlargements have substantially increased not just the number of
Member States, but also the range of countries’ technological expertise and stages of development.
Even more than before, EU policy needs to take explicitly into account the existing variety in
technological competence, innovation performance and industrial structure. In contrast to the
United States and Japan, a proper European System of Innovation is still far from being in place.
Rather, the EU still appears to be an agglomeration of autonomous and highly diverse national
innovation systems (Lorenz and Lundvall, 2006).
A large body of literature has already demonstrated the fundamental role played by innovation and
technological capabilities in fostering long-term growth performance (Castellacci, 2004; Fagerberg,
1994; Fagerberg and Godinho, 2005). In order to catch up, emerging countries need to develop an
endogenous capability allowing them to absorb the knowledge and technology developed elsewhere
(Castellacci, 2008; Cohen and Levinthal, 1990). As far as the European case is concerned,
differences in economic growth across European regions have already been explained by looking at
the differences in generating and adapting technologies developed abroad (Cantwell and
Iammarino, 2003; Fagerberg et al., 1999; Fagerberg and Verspagen, 1996). This has led policy
makers to rely on EU innovation policy as a fundamental instrument in reaching convergence,
including key variables such as productivity and income (Borras, 2003; Lundvall and Borras, 2004;
Von Tunzelmann and Nassehi, 2004).
International economic integration may have opposite effects on the distribution of innovative
activities. On the optimistic view, economic, social and political integration helps to disseminate
best-practice technologies and the diffusion of expertise. Through trade, scientific exchanges,
technological collaborations and direct foreign investment, backward countries have windows open
which allow them to exploit the technological opportunities offered by the most developed
countries (Perez and Soete, 1988). On the pessimistic view, on the contrary, the strongest areas will
attract the most knowledge intensive economic activities, providing job opportunities to the best
talents. Eventually, backward areas will find themselves confined in an economic specialization in
the low technology industries and with decreasing returns, while the most developed areas will
further reinforce their leadership (Rodriguez-Pose, 1999).
In the real world, both mechanisms are at work since innovative activities are not homogeneous
entities. As shown by a large theoretical and empirical literature, innovation is nurtured by a variety
of different sources, including R&D, design, engineering, equipment and machinery, and

4
infrastructure (Pavitt, 1984; von Hippel, 1988). The effect of economic integration is not necessarily
the same on all these activities. While economic integration may help in disseminating innovative
infrastructure, such as ICTs and other general purpose technologies, integration may have an
opposite effect on core activities associated to the generation of new knowledge and innovation
which may agglomerate in the most advanced areas.
In this paper we discuss the dynamics of innovation performance across EU Member States. We
address empirically the following crucial questions:
i) Has convergence in innovation been achieved in the last years? This will follow previous
research carried out for the EU15 (Archibugi and Coco, 2005) and that can now be
expanded to include the New Member States (NMS);
ii) To what extent is the current economic downturn impairing the convergence process
across the European Union in terms of innovation performance and technological
capabilities of countries?
The paper is organised as follows. In the next section we put forward the theoretical background of
the analysis. In section II we present the data sources and the methodology. In section III we
explore the process of convergence across Europe in terms of technological capabilities and
innovation performance over the period 2004-2008. In sections IV and V the impact of the financial
crisis is investigated. In section VI we describe the functioning of the European System of
Innovation and discuss some policy suggestions in the light of the empirical analysis, while section
VII concludes.
I. Cohesion, enlargement and economic convergence in the European Union
In this article, we concentrate on a specific dimension of economic convergence, namely,
convergence in innovation capabilities. In this section we first introduce the notion of convergence,
we then examine research dealing with convergence in the EU and present the most important
empirical results.
The economics of growth literature has always questioned whether there is some kind of
mechanism at work leading to convergence across countries in terms of level of income per capita.

5
Boldrin et al. (2001) distinguish four main hypotheses about convergence proposed by the
literature: from a strong convergence hypothesis a la Solow (1956), to a non-convergence one
caused by the presence of strong increasing returns, as proposed by the new growth literature
(Romer 1986; Grossman and Helpman 1991), and reinforced by the role of agglomeration
economies (Krugman, 1991). The convergence versus divergence argument has been central to the
European integration debate. This is the result of the importance of the socio-political dimension of
the EU process of integration – cohesion – which profoundly differentiated EU integration from
other regional organizations such as NAFTA or MERCOSUR. During the 1970s the Community
regional policy, inspired by the hypotheses of Gunnar Myrdal (1957), tried to counter-balance the
agglomeration of capital and human resources towards the more developed regions at the expense
of the peripheral ones. Both the Structural Funds and later the Cohesion Fund were grounded on the
non-convergence hypothesis and therefore aimed to compensate regions that were lagging behind
due to the asymmetric effects of integration (Boldrin et al., 2001; Holland, 1975; Leonardi, 1995).
A great deal of empirical research has investigated the convergence versus divergence hypothesis
across European countries at both national and regional level. In a comprehensive study Leonardi
(1995) analysed per capita income convergence relative to the period 1970-1995, finding
convergence at both regional (NUTS II) and national level. Using data for 64 European regions in
the 1980s, Fagerberg et al. (1997) show that innovation and the diffusion of technology are
important factors behind European growth. Most of the regions fail to take advantage of more
advanced technologies developed elsewhere due to a lack of R&D absorptive capabilities, and
therefore they show lower growth rates with respect to rich regions. Boldrin et al. (2001) find
neither significant income convergence nor divergence across EU15 regions during the 1980s and
the first half of 1990s, while labour productivity shows a moderate tendency to convergence. Martin
(2001) provides additional analysis of patterns of regional productivity trends and employment
growth over the period 1975-1998. Whilst labour productivity shows very weak convergence across
the EU regions, there is a sharp divergence in regional employment. Taking into account the effects
of innovation in the EU countries from 1969 to 1998, Jungmittag (2004) shows that technology
diffusion is a driving force for growth and labour productivity convergence of catching up
countries. Using three alternative methodologies to measure convergence, Neven and Gouymte
(2008) investigate the pattern of convergence in output per head across regions in the European
Community for the period 1975–90. They find strong differences across sub-periods and across
subsets of regions. Southern European regions seem to have caught up in the early 1980s, while the
regions in the north of Europe tended to stagnate or diverge in the first part of the 1980s, but

6
converge strongly thereafter. In recent years an increasing attention has been devoted to innovation
and convergence at the sub-national regional level.2 There is, in fact, a rising concern that
increasing cross-country interactions are intensifying regional disparities within countries due to
intense spillover effects, proximity effects and agglomeration economies.3
More recent studies address convergence in technology across Europe.4 Zizmond and Novak (2007)
find significant technology convergence between 15 old EU Member States and the eight New
Member States. Krammer (2009) explores the main driver of innovation in sixteen Eastern
European transition countries. He emphasizes the role played by universities and the national
knowledge base, complemented by both public and private R&D expenditure, as well as the
important part played by inflows of foreign direct investment and trade. Johnson et al. (2010)
describe the technological development of 13 countries in Europe, claiming that there is substantial
potential growth in the technological development of Eastern European nations, and that there are
high expectations that they will catch up over the coming 15 years. Finally, Filippetti and Peyrache
(2010) show how EU New Member States are part of a global trend of technological capabilities
convergence over the last decades.
Summing up, a huge number of empirical studies have addressed the convergence issue in terms of
income, productivity, and more recently in technological capabilities.5 The difficulties in coming to
definitive conclusions arise from the fact that the geometry of the EU is a variable one due to the
continuous process of integration and enlargement. Most of the studies reviewed do not take into
account the recent enlargement process and therefore they do not include the EU New Member
States. However, these studies show a general confirmation that domestic technological capabilities
– in terms of R&D activities, infrastructure, human resources – are key factors in enhancing catch
up processes on which our empirical exercise will build upon. Our contribution will in fact try to
shed new light on innovation performance convergence across the EU27 countries taking into
account the process of enlargement, but also looking at how the current economic downturn is and
will impact on the convergence in progress.
2 See Cappellen et al., 2003; Cantwell and Iammarino, 2003; Maurseth, 2001; Moreno et al. 2005; Paci and Usai, 2009;
Rodriguez-Pose, 1999; among others. 3 We are grateful to an anonymous referee for this point. This is related to the growing literature dealing with regional
innovation systems (see Iammarino 2005; Rodr guez-Pose and Crescenzi, 2008) and localized technical change (see
Antonelli, 2001. 4 For more structural analysis see Keyat et al., 2004 and Palan 2010.
5 For some review studies and methodological assessments see Quah, 1996; Petrakos, 2009; Bazo et al., 1999; Lundvall
and Lorenz, 2006.
7
II. Data sources
The analysis is grounded on the data provided in two Reports from the European Commission, the
Innobarometer 2009 and the European Innovation Scoreboard 2008 (European Commission,
2009a; European Commission, 2009b). The first is a survey conducted in April 2009 in the 27
Member States of the EU6 and it is now in its eighth wave. Overall, a statistically significant sample
of 5,238 enterprises across Europe was considered according to three main criteria: country,
company size (20-49, 50-249, 250+ employees) and industry.
The European Innovation Scoreboard (EIS) is a Report of the European Commission – Directorate
General Enterprises and Industry - carried out by the MERIT since 2001.7 The EIS aims at
measuring and comparing the innovation performance at country level using a synthetic composite
indicator. For our analysis we will use the current EIS composite indicator methodology (European
Commission, 2009a), which is based on twenty-nine indicators addressing several dimensions of a
country’ system of innovation (see table A1 in the Appendix). The composite indicator, the
Summary Innovation Index (SII), has been calculated with the same methodology over the period
2004-2008. This allows addressing the convergence of innovation performance of countries over a
period of five years using both the SII as a whole and its seven dimensions.
As regards the Innobarometer, our analysis is based on the following three questions of the survey:
(see table A2 in the Appendix):
1. Question no. 1: “Compared to 2006, has the amount spent by your firm on all innovation
activities in 2008 increased, decreased, or stayed approximately the same (adjust for
inflation)?”
2. Question no. 2 “In the last six months has your company taken one of the following
actions[increased, decreased or maintained the innovation spending] as a direct result of the
economic downturn?”
3. Question no. 3 “Compared to 2008, do you expect your company to increase, decrease or
maintain the total amount of its innovation expenditures in 2009?”
6 We have excluded non-EU countries to limit our analysis to the EU Member States.
7 Both the Innobarometer and EIS reports can be find on the web site: http://www.proinno-
europe.eu/index.cfm?fuseaction=page.display&topicID=51&parentID=48

8
The first question will be used to investigate the medium-term steady-state trend of the European
firms’ innovation spending before the crisis. The second question sheds some light on the direct
effects of the current economic downturn on the firms’ innovation investments. Finally, the third
question captures the expectation of firms on innovation investment.
A major caveat in the Innobarometer data is that respondents are not requested to provide the
amount of innovation investment. Thus, we are not able to take into account how much the firms
modify their total investment or disinvestment in innovation. However, the data are able to inform
on the firms changing strategies and this provides a reliable source for our main objectives on the
convergence hypothesis.
III. The good news: the convergence in innovation performance across the EU
As already mentioned, economic convergence represents one of the main pillars of the EU project
and enlargement. Since the very beginning of European integration, a good deal of effort and
resources has been put forward by policy makers to achieve this goal. In this section we assess to
what extent convergence across EU Member States8 has occurred in terms of innovation
performance.
Methodology
To address convergence we use the SII and its seven dimensions as a measure of innovation
performance at a country level (see European Commission, 2009a). Composite indicators of
innovation and technological capabilities have demonstrated they are quite stable over time
(Archibugi et al., 2009), which is not surprising considering that they capture an economic
structural dimension. The emergence of a convergence over a medium term period of five years
would already be a significant achievement. Moreover, the SII also allows exploring convergence in
the seven innovation dimensions of the SII indicator, disentangling the areas in which convergence
is actually occurring and shedding some light on its components’ dynamics.
In order to make our results robust we apply two different methodologies already used to address
convergence in the growth literature (Barro and Sala-i-Martin, 2005). Both rely on the simple
8 Malta and Cyprus have been excluded from the analysis of the paper due to a lack of data.
9
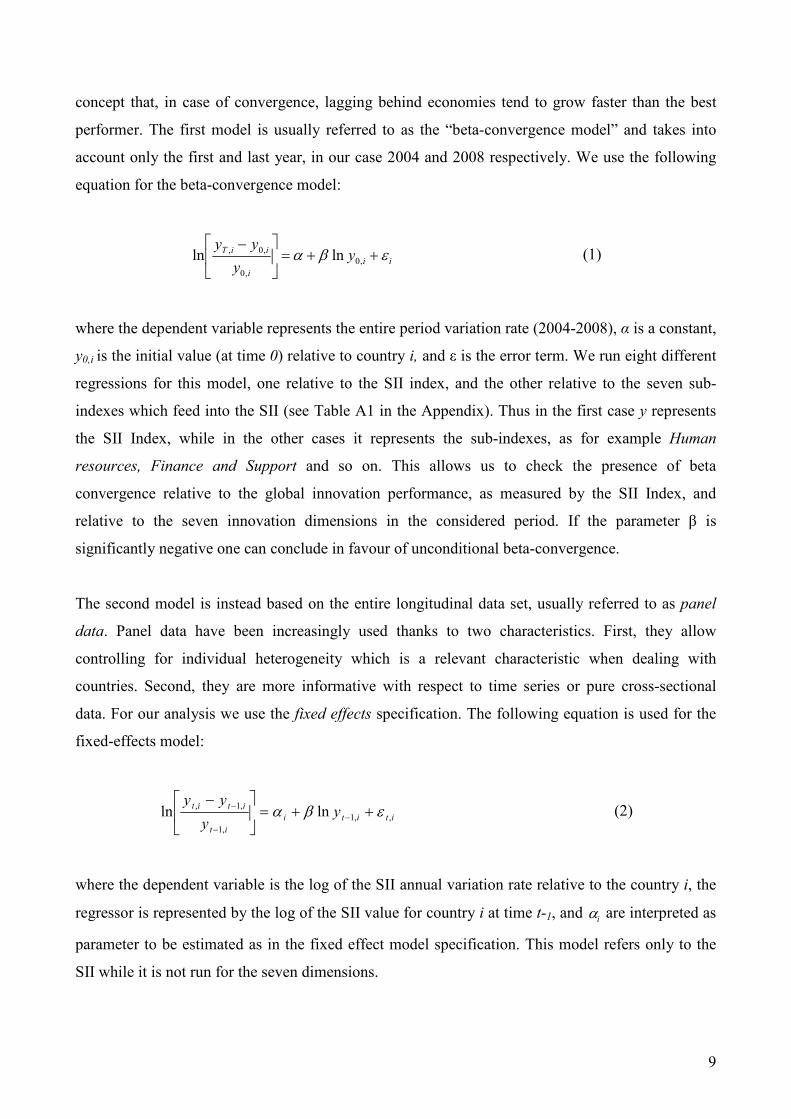
concept that, in case of convergence, lagging behind economies tend to grow faster than the best
performer. The first model is usually referred to as the “beta-convergence model” and takes into
account only the first and last year, in our case 2004 and 2008 respectively. We use the following
equation for the beta-convergence model:
ii
i
iiT yy
yyεβα ++=
−,0
,0
,0, lnln (1)
where the dependent variable represents the entire period variation rate (2004-2008), α is a constant,
y0,i is the initial value (at time 0) relative to country i, and ε is the error term. We run eight different
regressions for this model, one relative to the SII index, and the other relative to the seven sub-
indexes which feed into the SII (see Table A1 in the Appendix). Thus in the first case y represents
the SII Index, while in the other cases it represents the sub-indexes, as for example Human
resources, Finance and Support and so on. This allows us to check the presence of beta
convergence relative to the global innovation performance, as measured by the SII Index, and
relative to the seven innovation dimensions in the considered period. If the parameter β is
significantly negative one can conclude in favour of unconditional beta-convergence.
The second model is instead based on the entire longitudinal data set, usually referred to as panel
data. Panel data have been increasingly used thanks to two characteristics. First, they allow
controlling for individual heterogeneity which is a relevant characteristic when dealing with
countries. Second, they are more informative with respect to time series or pure cross-sectional
data. For our analysis we use the fixed effects specification. The following equation is used for the
fixed-effects model:
ititi
it
itity
y
yy,,1
,1
,1,lnln εβα ++=
−−
−
− (2)
where the dependent variable is the log of the SII annual variation rate relative to the country i, the
regressor is represented by the log of the SII value for country i at time t-1, and iα
are interpreted as
parameter to be estimated as in the fixed effect model specification. This model refers only to the
SII while it is not run for the seven dimensions.

10
Results
Figure 1, where we plot the SII performance in 2004 against the 2004-2008 SII variation rate,
shows the achievement of convergence in technological capabilities and innovation performance
across European countries. Countries with a low SII figure in 2004, including Bulgaria, Romania,
Latvia and Slovak Republic, have been performing relatively better over the last five years in
comparison with the countries which were better performing in 2004, i.e. Denmark, Sweden and the
United Kingdom.
[Figure 1]
Table 1 summarizes the “robust” estimates of the two models showing the coefficients related to the
SII indicators. As a whole the results of both the models confirm the hypothesis of convergence
among European countries. Both coefficients are negative, as expected, and significant. In Table 2
we report the results of the beta-convergence model relative to the seven EIS dimensions. Also in
this case, coefficients have negative and significant signs with the only exception of the
“Innovators” dimension.9 Our results also show that “Finance and Support”, which includes Public
R&D, venture capital, private credit and broadband, and “Throughputs”, which include patents,
trademarks, design registrations and the technology balance of payments, are the two dimensions in
which convergence occurs at a faster rate.
[Table 1]
[Table 2]
Composite indicators like the SII are likely to show a stable dynamic performance over time due to
the structural nature of the phenomena they deal with. The fact that both models account for
convergence over a period of five years signals the presence of a significant process of convergence
across Europe in innovative activities. An analysis of the coefficients for the seven SII sub-indices
related to the innovation dimensions of the SII also shows that convergence has been faster in less
structural variables such as venture capital and broadband access. On the other hand, structural
9 The fact that the “Innovators” dimension is not significant can depend on the circumstance that relative to this
indicator data are taken from the Community Innovation Survey which are available only for two years.

11
dimensions such as “Firm investment”, “Human Resources” and “Economic Effects” consistently
show a slower convergence over the considered period.
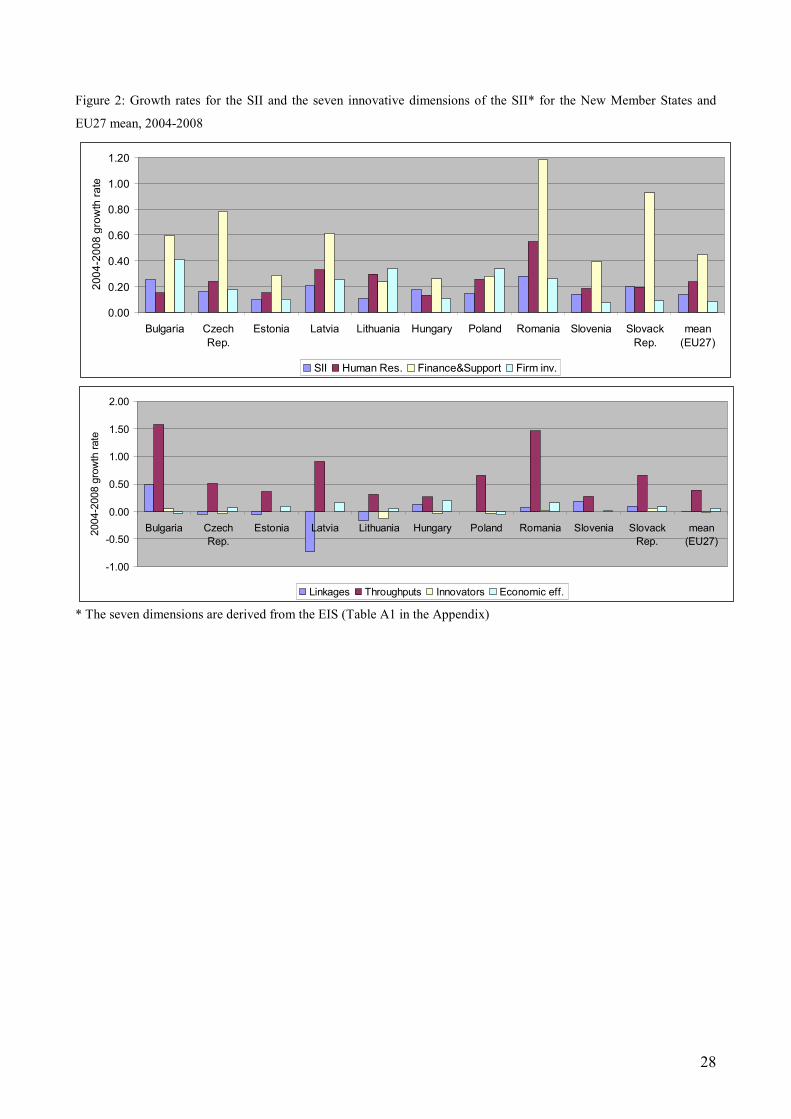
In Figure 2 we report the dynamic of the SII and the seven innovation dimensions for New Member
States (NMS) compared to the EU27 simple average over the period 2004-2008. Romania, Bulgaria
and Latvia show a faster growth of the SII composite indicator. As a whole, the NMS show a
similar growth composition to the EU27 average, with some notable exceptions. Specifically,
Bulgaria and Hungary seem to be relatively weak on “Human Resources”, while Poland shows a
strong dynamic regarding “Firm Investment” relatively to its other dimensions. With regard to the
“Firm Investment” dimension, all the NMS perform better than the EU27 average.
To summarize, this evidence shows that a process of convergence in innovation performance has
been occurring. Laggard countries, mostly the NMS, have been narrowing their gap in terms of
technological accumulation and innovation performances in comparison to the European leading
nations. We cannot associate the convergence in innovation to deliberate EU policies rather than to
other factors. But the announcement and the implementation of the EU integration is associated to a
decrease rather than an increase in divergence in innovative performance.
[Figure 2]
IV. The bad news: the effect of the crisis on innovation investment across European
countries
The economic crisis had a rather significant effect on the investment in innovation across all
Europe. But this bad effect has not been even across countries. In this section we first explore the
dynamics of firms’ innovation investment over the three years 2006-2008. This allows us to identify
four groups of countries based on their innovation investments patterns. We then assess the impact
of the crisis on the firms’ innovation investments across Europe as a whole and upon the four
groups of countries.
The raise of the Parvenu
To explore the dynamics of the firms’ innovation investments over the period 2006-2008 we build a
simple composite indicator, the Innovation Investments Indicator(InnoInv06-08). InnoInv06-08is based
on the balance between the percentage of firms increasing and decreasing their innovation

12
expenditures over the period 2006-2008 (see the methodology in the Appendix). In this way, the
InnoInv06-08represents an indicator of medium-term firms’ innovation investments. Similarly to the
SII of the EIS, the indicator is normalized ranging between 0 and 1.
In Figure 3 we plot on the x-axis the InnoInv06-08 performance, while on the y-axis we report an
index of structural innovative capacity such as the SII. A clear correlation between the innovative
performance relative to the period 2006-2008 and the structural innovative capacity does not arise,
being the correlation rate equal to 0.05. In this way we are able to define the following four
quadrants and relative groups of countries:
1. The Parvenu: although they do not exhibit a high strength of their national innovation systems,
they have been increasing their investments more than the average relative to the considered
period. This group includes several NMS, including Poland, Slovakia, Lithuania, Bulgaria,
Romania, Slovenia which come from the ex-socialist block.
2. The Aristocracy: this group consists of those countries which show both a structural
consolidated leadership of their innovation performance, and at the same time they are keeping
on increasing their investments in innovation. These countries are Sweden, Austria, Germany,
Finland and Belgium. This brilliant performance is associated not only to hereditary privileges,
but also to continuous efforts in learning and innovation.
3. The Declining 5obility: these countries, even though they have a strong national innovation
system, have been increasing their innovation expenditures relatively less over the 2006-2008
period. They include Denmark, Ireland, United Kingdom, Luxemburg, France and the
Netherlands. Also a new member country, Estonia, belongs to this group.
4. Finally, the Third State: this group of countries is characterized by both a low innovation
performance at the national level and a low performance in firms’ innovation spending.
Interestingly, this group includes both NMS such as Hungary, Latvia and the Czech Republic,
but also the Southern European countries (Italy, Spain, and Portugal).
[Figure 3]
The data presented in this section confirm the results reported in the previous section and based on
the EIS. Until the financial crisis, Europe as a whole was expanding its investment in innovation,
and firms in at least some of the laggard countries were expanding their innovative investment more
than the EU average.

13
The impact of the crisis across European countries
In Figure 4 we plot the average firms’ answers relative to questions no. 1 and 2 of the
Innobarometer (see above). The responses clearly show that the economic downturn is having a
profound impact on the firms’ innovation behaviour across Europe. The percentage of firms
increasing their innovation expenditures drops dramatically from 40% to 11% as a direct effect of
the crisis. In turn, the percentage of firms decreasing their innovation spending surges from 11% up
to 27%. The number of firms which are expected to maintain their innovation spending at the same
level has increased to more than 60% from about 50%. The crisis is cutting programmes aimed at
expanding innovation, but it is having less of an effect on the disinvestment of ongoing investment.
Given the structural nature of innovative activities, this comes as no surprise.
[Figure 4]
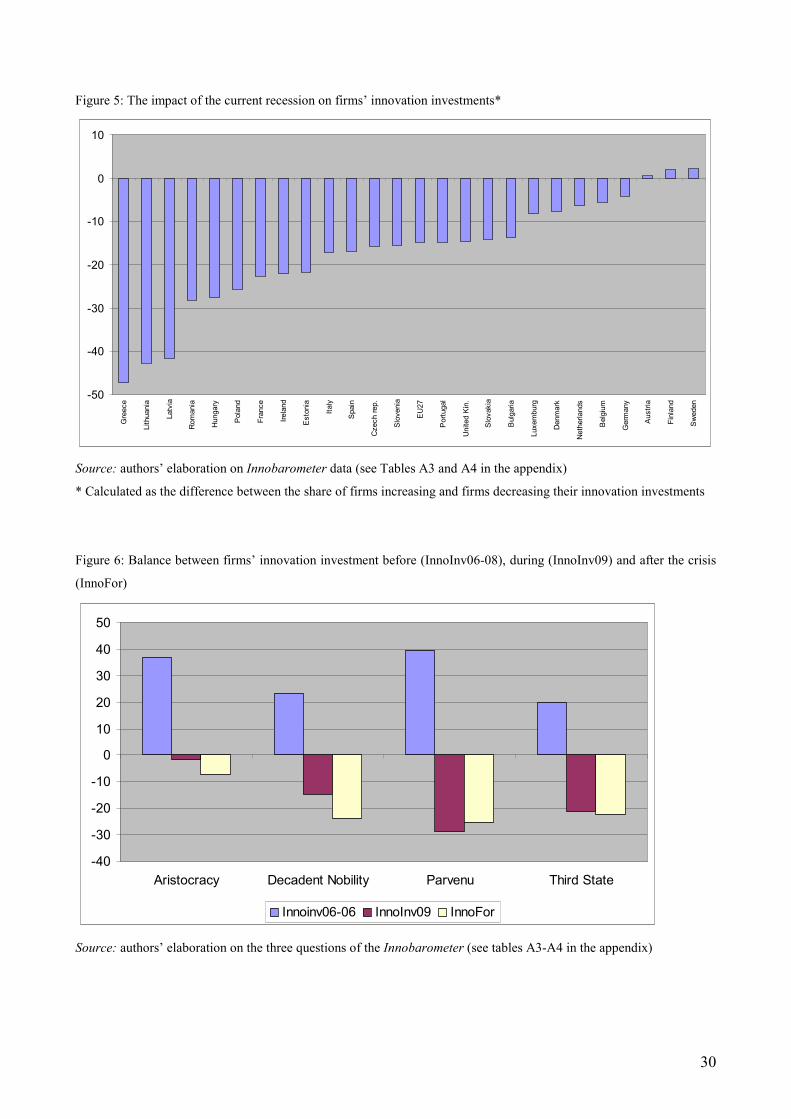
The impact of the economic downturn on firms’ innovation spending is also evident by looking at
the data at the country level, as reported in the Figure 5. The figures report the difference between
the share of firms increasing and those firms decreasing their innovation investments in response to
the crisis. In general, apart from Austria, Finland and Sweden, in all the other countries the share of
firms reducing innovation investments exceeds that increasing them in response to the crisis.
Crucially, among the countries with the strongest negative impact, most belong to the Parvenu
group. It is worth observing that we also find Greece within this group of countries. Among the
relatively less affected by the recession we find advanced and dynamic economies such as Austria,
Finland and Sweden. Let us look at this evidence in greater detail.
[Figure 5]

14
V. How bad is the bad news? The impact of the crisis within the four groups of countries
Our hypothesis is not only that the crisis is affecting countries to a different extent, but also that it is
somehow reversing the convergence in innovation performance achieved in the past. In order to test
this hypothesis, we put together all the three questions of the Innobarometer (see section two and
tables A2 in the Appendix). Also for the second and third question we use the balance between the
percentage of firms increasing and decreasing their innovation respectively in 2009 as a response of
the crisis (InnoInv09) and in terms of expectations (InnoFor) (see methodology in the Appendix).
This will allow testing if the reduction of innovation investment is occurring in the short term only,
or if it will instead have consequences also in the medium term.
In Figure 6 we summarize the results for the three indicators. As expected, the Parvenu is the group
of countries with the greatest increase in innovation investment over the period 2006-2008.
However, the Parvenu is also the group most negatively affected by the crisis, followed by the
Third State. The other two groups, the Aristocracy and the Declining 5obility, are also those with
the highest innovative rate, as shown by the SII. In a nutshell, as a direct result of the crisis, the
innovation leaders are doing relatively better that the catching-up and lagging behind countries.
This is exactly the opposite of the convergence process highlighted in Section two.
However, when we turn to look at the prospects as shown by InnoFor, the picture seems to change
again. First, the groups Aristocracy, Declining 5obility and Third State seem to persist in reducing
further their innovation expenditures: the number of firms reducing innovation investment is even
larger then in the previous case (InnoInv09). And the only group that is showing a moderate counter-
cyclical behaviour is the Parvenu. That is, in this case the number of firms which foresee reducing
their expenditures in innovative activities is lower than in the previous situation. Although the
Parvenu’s figure remains the highest among the four groups, it is quite close to those of the
Declining 5obility and Third State.
[Figure 6]
To sum up, if we take into account also firms’ expectations on innovation investment, the impact of
the recession is even more profound than what emerged in the previous section. The persistence of
the crisis is emphasized by the fact that there is a marked tendency of the firms in the Aristocracy,
the Declining 5obility and the Third State countries to keep on decreasing innovation investment.

15
This is true in particular for the Western countries which belong to the first two groups, but it holds
to a lesser extent for the Third State as well. On the contrary, the Parvenu show a moderate signal
of prompt recovery.
VI. Lessons for the European Innovation System
The polarization of innovation capabilities across the EU countries
So far, our analysis has been grounded on the innovation intensity of European countries. This
method of presenting the data is certainly relevant in guiding policy making, but it may hide the
reality that some countries are larger than others. In Table 3 we report some among the most
relevant variables which address the state-of-the-art of the innovation capabilities relative to the
four groups of identified countries in the EU in comparison to the United States. Additionally, a
broader distinction between the EU15 and the ten countries of Central and Eastern Europe that
joined the EU in 2004 and 2007 (what we call EU10) is also put forward.10
The differences across the four groups are striking. The Aristocracy, which accounts for nearly one
fourth of the total EU labour force and population, concentrates more than half of the triadic patent
and around 45 per cent of business R&D: this group of countries, dominated by Germany and
shaped by Sweden, Finland, Austria and Belgium, appears as the engine of the European industrial
innovation. The Declining 5obility is the largest group of countries in terms of labour force and
population, and it plays an even greater role in terms of public knowledge: it has the largest share of
public R&D and scientific articles; not surprisingly, this group is dominated by the United Kingdom
and France, both countries with large governmental activities in science and technology. The
Parvenu accounting for less than 18 per cent of the EU27 labour force shows a negligible share of
both patents and business R&D. The contribution of these countries in generating new industrial
innovation is still very small.
[Table 3]
10
This EU10 including Bulgaria, Czech Republic, Estonia, Hungary, Latvia, Lithuania, Poland, Romania, Slovak
Republic, Slovenia. We exclude from the analysis Cyprus and Malta.

16
It may be equally useful to divide the EU countries between the pre-2004 and the post-2004
members, especially since the dividing line is able to capture (with the exclusion of two small
economies such as Cyprus and Malta) the contribution provided by the ex-planned economies. Not
surprisingly, the differences between the EU15 and the new EU10 are even more acute. The EU10 –
which accounts for one fourth of the EU labour force, provides almost an irrelevant contribution in
terms of patents (less than 1 per cent of the total EU), and a minor one in terms of business R&D
(less than 5 per cent). The situation is less impressive when we look at the research sector as
measured in terms of researchers (both public and private), the number of technical and scientific
articles and the public R&D expenses. Here the difference is less dramatic especially with regards
to the number of researchers. These simple data show that the transition to business oriented
innovation system is far from being completed in the ex-planned economies. If the main goal of the
EU innovation policy is to build a European System of Innovation, it seems obvious that the core
priority is to better integrate such an important part of the continent.
We have also sketched in Table 4 a comparison between EU27 and the United States.11
The USA
has 66 per cent of the European labour force,12
but it is far ahead, compared to the EU, in business
sector innovation expenditure and for number of researchers. In quantitative terms, the EU still has
to make substantial changes before becoming the largest knowledge economy of the world. In terms
of internal disparities, it is certainly true that also across the Unites States there are differences as
large as those in Europe (it is sufficient to compare the Silicon Valley with the Midwest). However,
there are at least three main reasons for believing that these differences play a greater role across the
EU: i) within the US national system of innovation there exist consolidated mechanisms of
transmission of knowledge and technology which have been built over the last century; ii) the US
system of innovation shares the same institutional setting, such as the same education system, STI
policies, industrial policies, immigration policies, and the same rules of the game more in general
(Rodríguez-Pose, 1999); iii) human resources represent a fundamental mechanism of diffusion of
knowledge, especially of tacit knowledge (Polanyi, 1966). The large mobility of human resources
within the US, also encouraged by a homogeneous labour market, is a fundamental driver of the
diffusion of knowledge generated in specific areas across the country (Zimmermann 1995, 2005).13
11
For a comparison between the EU and US see Crescenzi et al. 2007; Dosi et al., 2006; European Commission, 2009c. 12
As is well known, activity rates are higher than in Europe, a fact that should be borne in mind when analyzing the
drivers of US competitiveness compared to the EU. 13
For an investigation of the convergence within the Unite States see Barro and Sala-i-Martin, 1991. For studies which
consider the European and United States experiences similar in terms of market integration see Sala-i-Martin and Sachs,
1991.

17
The functioning of the European Innovation System and some policy recommendations
What can this evidence tell us about the European Innovation System? We take for granted that the
European system should build upon substantial variety between National systems. Moreover, the
tools available within European governance are substantially limited if compared to those operated
by national and local governments. However, there is an increasing awareness of the need to
coordinate science, technology and innovation policies at the Community level. In Figure 7 we plot
an “ideal” European Innovation System taking into account the EU multi-level (Community and
Member States) governance of innovation. We single out the different components of the European
system: the four groups of countries which contribute to the core of the innovation activities; the
production of core innovation and new knowledge; the cross-European flows of knowledge,
technology and human resources; the absorptive capacity which allows countries to take advantage
of the technological opportunities generated outside national boundaries; and joint large-scale
projects in basic research.
[Figure 7]
With the polarization of the generation of knowledge and innovation across the EU, a few countries
are responsible for the bulk of innovation and knowledge production. The technology gap provides
a fundamental potentiality for lagging behind countries to catch-up and, in fact, some of them have
already benefited from this. However, we have pointed out the presence of a general fragility as the
effects of the crisis have shown.
The lessons learnt about catching up, indicate that international differences in the rate of innovation
are explained by: (i) capital accumulation and infrastructure; (2) investment in education and
quality of human resources; (iii) expenditure in R&D and related activities (see Abramowitz, 1986
and Fagerberg, 1994 among many others). R&D expenditures by themselves (both public and
private) cannot be expected to make a substantial difference (Pavitt, 1998). Therefore, we claim that
a more articulated policy needs to be put in practice beyond the R&D 3% target established by the
Lisbon Agenda. As suggested by the Report A Knowledge-intensive Future for Europe (European
Commission, 2009c, pp. p. 24-25), more importance should be given to investment in knowledge
diffusion and absorption depending on the specific national context. In the light of our own
empirical findings, we can provide the following policy recommendations.

18
• EU innovation policies aimed at enhancing the mechanisms underlying the diffusion of
knowledge and the circulation of human resources seem totally justified since they will facilitate
the catching up of laggard and more fragile areas, and increase the potential innovative output of
Europe.
• A greater harmonization of the labour market and of the educational system will also be able to
increase absorptive capacity and therefore the innovative potential generated by an increased
number of countries. As shown above, a highly qualified labour force reduces the risk of
disinvestment in innovation in adverse economic conditions.
• Large-scale European projects in basic research would serve to push the EU towards the
scientific frontier making possible to tap future major technological development. In fact,
evidence from the US shows that the academic research that corporate practitioners find more
useful is publicly funded, performed in universities, and publicly accessible (Mansfield, 1995;
Narin et al. 1997; Pavitt, 2001). This will be also a good method to make knowledge available
to all European players and, consequently, to generate the conditions for convergence,
especially if priority is given to the creation of absorptive capabilities in the laggard countries.
• Finally, countries need to build their own endogenous capacity to tap and absorb knowledge and
technology generated elsewhere, as well as a suitable environment for attracting human
resources. That is, policies aimed at restructuring and developing technological capabilities in
the EU10 countries are a condition sine qua non to spur innovation and catching-up processes.
Conclusion: is the economic downturn impairing the convergence in innovation performance
in Europe?
A decade has passed since the 2000 Lisbon summit, in which the European Council declared its
intention of making the European research area the “world’s most competitive and dynamic
knowledge-based economy” in the world. As a result of the process of enlargement, we have shown
that the EU has become not only larger but also more heterogeneous and polarized in terms of
knowledge generation, innovation performance and development of technological capabilities. In
the South and in the East, there are substantial European areas that are still lagging behind in
knowledge and competence-building, but the current gap in innovation performance can also be an
opportunity for the NMS to catch-up with the more advanced countries. In a few years, these
countries have managed to narrow, albeit to a limited extent, their divergence with the leading
nations. This still leaves these countries far behind the scientifically and technologically more

19
developed European countries, but we show that there is at least a trend toward the reduction of the
divergence. The emerging countries, however, are also those most vulnerable to external shocks:
these are also the countries that have most reduced their innovative investment as a direct
consequence of the economic crisis. This casts some doubts on the structural nature of the observed
convergence process in innovation capabilities.
Our results reinforce the idea that specific innovation policies should be considered as important as
structural policies in the overall cohesion strategy of the EU. To fully exploit the benefits of these
policies, three specific factors of the EU context should be considered: i) the high polarization in
terms of the creation of knowledge, ii) the potential offered by a system of public R&D and human
resources that has not yet been transformed into a consistent business innovation strategy, iii) a
weakness of the newcomers in sustaining their innovative projects when there are external shocks,
such as the recent financial crisis.
In the light of our findings, can we argue that the economic downturn is hampering the convergence
in innovation in Europe? Answering this question is complicated by the fact that many other
interrelated elements play a role, such as fiscal imbalances, capital flows, and the credit and
currency markets among others (for the role played by differences in the financial system see Begg,
2009). However, from our results we can certainly conclude that the negative effects of the crisis
are remarkable and this, at least from the innovation investment viewpoint, is not likely to improve
in the immediate future. Insofar as the New Member States are the worst hit by the recession, this is
also affecting the process of convergence in innovation performance. The possibility that some
countries will take a long time to recover is not good news for the EU as a whole. This could
seriously hinder the reduction of regional disparities which is a key factor for the EU to compete
today with US and Japan, and in the very near future also with emerging economies such as China,
India and others. Strengthening the innovative potential of laggard countries may become a crucial
priority to allow the EU to grow and to compete in the global economy.
Finally, an important issue to address would be the impact of the crisis at the sub-national regional
level. Is the crisis exacerbating regional disparities in terms of technological innovation as well?
This would shed some light on the presence of a double-level effect of divergence in innovation
performance across countries and regions, and on the mechanisms underlying this relationship. The
availability of data at the regional level describing the impact of the crisis would therefore be useful
(see for example European Commission, 2010).

20
References
Abramovitz, M. (1986) ‘Catching up, forging ahead, and falling behind’. Journal of Economic
History, Vol. 46, No. 2, pp. 385-406.
Antonelli, C. (2001) The microeconomics of technological change, (Oxford: Oxford University
Press).
Archibugi, D. and Coco, A. (2005) ‘Is Europe becoming the most dynamic knowledge economy in
the world?’ Journal on Common Market Studies, Vol. 43, No. 3,pp. 433-59.
Archibugi, D., Denni, M. and Filippetti, A. (2009) ‘The technological capabilities of nations: A
review of the synthetic indicators’. Technological Forecasting and Social Change, Vol. 76, No. 7,
pp. 917-31.
Barro, R. J. and Sala-i-Martin, X. (2005) ‘Economic growth’, (New York: McGraw Hill).
Barro, R. J. and Sala-i-Martin, X. (1991) ‘Convergence across states and regions’. Brookings
Papers on Economic Activity, Vol. 1, No. April.
Barry, F. (2003) ‘Economic integration and convergence processes in the EU cohesion countries’.
Journal of Common Market Studies, Vol. 41, No. 5, pp. 897-921.
Bazo-Lopez, E., Vayà, E., Mora, A. J. and Surinach, J. (1999) ‘Regional economic dynamics and
convergence in the European Union’. The Annals of Regional Science, Vol. 33, No. 3, pp. 343–370.
Begg, I. (2009) ‘Regulation and supervision of financial intermediaries in the EU: The aftermath of
the financial crisis’. Journal of Common Market Studies, Vol. 47, No. 5, pp. 1107-28.
Boldrin, M., Casanova, F., Pischke, J. and Puga, D. (2001) ‘Inequality and convergence in Europe's
regions: Reconsidering European regional policies’. Economic Policy, Vol. 32, No. April, pp. 207-
253.
Borras, S. (2003) The innovation policy of the EU, (Cheltenham: Edward Elgar).
Cantwell, J. and Iammarino, S. (2003) Multinational enterprises and European regional systems of
innovation, (London: Routledge).
Cappelen, A., Castellacci, F., Fagerberg, J. and Verspagen, B. (2003) ‘The impact of EU regional
support on growth and convergence in the European Union’. Journal of Common Market Studies,
Vol. 41, No. 4, pp. 621-644.
Castellacci, F. (2004). Innovation and economic growth in Europe: Evolutionary perspectives.
Oslo: Centre for Technology, Innovation and Culture.
Castellacci, F. (2008) ‘Technology clubs, technology gaps and growth trajectories’. Structural
Change and Economic Dynamics, Vol. 19, No. 4, pp. 301–14.
Cohen, W. M. and Levinthal, D. A. (1990) ‘Absorptive capacity: A new perspective on learning and
innovation’. Administrative Science Quarterly, Vol. 35, No. 1, pp. 128-52.

21
Crescenzi, R., Rodriguez-Pose, A. and Storper, M. (2007) ‘The territorial dynamics of innovation:
A Europe-united states comparative analysis’. Journal of Economic Geography, Vol. 7, No. 6, pp.
673-709.
Dosi, G., LLerena, P. and Labini, M. S. (2006) ‘The relationship between science, technologies and
their industrial exploitation: An illustration through the myths and realities of the so-called
European paradox’. Research Policy, Vol. 35, No. 10, pp. 1450-1464.
European Commission (2010) Regional Innovation Scoreboard (RIS) 2009, DG Enterprise and
Industry (Brussels).
European Commission (2009a) European Innovation Scoreboard 2008. Comparative analysis of
innovation performance, European Commission, DG Enterprise and Industry (Brussels).
European Commission (2009b) Innobarometer 2009, DG Enterprise and Industry (Brussels).
European Commission (2009c) A knowledge-intensive future for Europe, Expert Group Report,
European Commission - DG Research (Brussels).
Fagerberg, J. (1994) ‘Technology and international differences in growth rates’. Journal of
Economic Literature, Vol. 32, No. 3, pp. 1147-75.
Fagerberg, J. and Godinho, M. M. (2005) ‘Innovation and catching-up’. In Fagerberg, J., et al.
(eds.) Innovation and catching-up (Oxford: Oxford University Press).
Fagerberg, J., Guerrieri, P. and Verspagen, B. (1999) The economic challenge for Europe,
(Cheltenham: Edward Elgar).
Fagerberg, J., Verspagen, B. and Caniels, M. (1997) ‘Technology, growth and unemployment
across European regions’. Regional Studies, Vol. 31, No. 5, pp. 457-466.
Fagerberg, J. and Verspagen, B. (1996) ‘Heading for divergence? Regional growth in Europe
reconsidered’. Journal of Common Market Studies, Vol. 34, No. 3, pp. 431-48.
Filippetti, A. and Peyrache, A. (2010) ‘The patterns of technological capabilities of nations: A dual
approach using composite indicator and data envelopment analysis’. SSRN Working Paper.
Grossman, G. M. and Helpman, E. (1991) Innovation and growth in the global economy, (MIT
Press, Cambridge, MA).
Holland, S. (1975) Capital versus the regions, (Macmillan, London).
Hodson, D. and Quaglia, L. (2009) ‘European perspective on the global financial crisis:
Introduction’. Journal of Common Market Studies, Vol. 47, No. 5, pp. 939-53.
Iammarino, S. (2005) ‘An evolutionary integrated view of regional systems of innovation:
Concepts, measures and historical perspectives’. European Planning Studies, Vol. 13, No. 4, pp.
497-519.
Johnson, D. M. (2010) ‘High-tech indicators: Assessing the competitiveness of selected European
countries’. Technology Analysis & Strategic Management, Vol. 22, No. 3, pp. 277-296.
22
Jungmittag, A. (2004) ‘Innovations, technological specialization and economic growth in the EU’.
International Economics and Economic Policy, Vol. 1, No. 2-3, pp. 247-273.
Kejak, M., Seiter, S. and Vávra, D. (2004) ‘Accession trajectories and convergence: Endogenous
growth perspective’. Structural Change and Economic Dynamics, Vol. 15, No. 1, pp. 13–46.
Krammer, S. M. S. (2009) ‘Drivers of national innovation in transition: Evidence from a panel of
eastern European countries’. Research Policy, Vol. 38, No. 5, pp. 845-860.
Krugman, P. (1991) Geography and trade, (MIT Press, Cambridge, MA).
Leonardi, R. (1995) Convergence, cohesion and integration in the European Union, (Macmillan,
London).
Lorenz, E. and Lundvall, B. A. (eds.) (2006) How Europe’s economies learn, (Oxford: Oxford
University Press).
Lundvall, B. A. and Borras, S. (2004) ‘Science, technology, and innovation policy’. In Fagerberg,
J., et al. (eds.), Science, technology, and innovation policy (Oxford: Oxford University Press).
Mansfield, E. (1995)‘Academic research underlying industrial innovation: Sources, characteristics,
and financing’. The Review of Economics and Statistics, Vol. 77, No. 1, pp. 55-65.
Martin, (2001) ‘Emu versus the regions? Regional convergence and divergence in Euroland’.
Journal of Economic Geography, Vol. 1, No. 1, pp. 51-80.
Maurseth, P. B. (2001) Convergence, geography and technology. Structural Change and Economic
Dynamics, Vol. 12, No. 3, pp. 247-276.
Molle, W. (2006) The economics of European integration, Burlington: Ashgate Publishing
Company).
Moreno, R., Paci, R. and Usai, S. (2005) ‘Spatial spillovers and innovation activity in European
regions’. Environment and Planning, Vol. 37, No. 10, pp. 1793-1812.
Myrdal, G., (1957) Economic theory and underdeveloped regions,(Duckworth, London).
Narin, F., Hamilton, K. and Olivastro, D.(1997) ‘The increasing linkage between the U.S.’
Technology and public science. Research Policy, Vol. 26, No. 3, pp. 317-330.
Neven, D. and Gouymte, C. (2008) ‘Regional convergence in the European Community’. Journal of
Common Market Studies, Vol. 33, No. 1, pp. 47-65.
Paci, R. and Usai, S. (2009) ‘Knowledge flows across European regions’. The Annals of Regional
Science, Vol. 43, No. 3, pp. 669-690.
Palan, N. and Schmiedeberg, C. (2010) ‘Structural convergence of European countries’. Structural
Change and Economic Dynamics doi:10.1016/j.strueco.2010.01.001.

23
Pavitt, K. (2001) ‘Public policies to support basic research: What can the rest of the world learn
from the us theory and practice? (and what they should not)’. Industrial and Corporate Change,
Vol. 10, No. 3, pp. 761-779.
Pavitt, K. (1984) ‘Sectoral patterns of technological change: Towards a taxonomy and a theory’.
Research Policy, Vol. 13, No. 6, pp. 343-73.
Pavitt, K. (1998) ‘The inevitable limits of EU R&D funding’. Research Policy, Vol. 27, No. 6, pp.
559-568.
Perez, C. and Soete, L. (1988) ‘Catching up in technology: Entry barriers and windows of
opportunities’. In Dosi, G. et al. (eds.), ‘Technical change and economic theory’ (London: Pinter
Publisher).
Petrakos, G. and Artelaris, P. (2009) ‘European regional convergence revisited: A weighted least
squares approach’. Growth and Change, Vol. 40, No. 2, pp. 314–331.
Polanyi, M. (1966) The tacit dimension, (New York: Doubleday).
Quah, D. T., (1996) ‘Empirics for economic growth and convergence’. European Economic Review,
Vol. 4 , No. 3, pp. 1353-1375.
Rodriguez-Pose, A. (1999) ‘Innovation prone and innovation averse societies: Economic
performance in Europe’. Growth and Change, Vol. 30, No. 1, pp. 75-105.
Rodriguez-Pose, A. and Crescenzi, R. (2008) ‘Research and development, spillovers, innovation
systems, and the genesis of regional growth in Europe’. Regional Studies, Vol. 42, No. 1, pp. 51-67.
Romer, P. (1986) ‘Increasing returns and long run growth’. Journal of Political Economy, Vol. 94,
No. 5, pp. 1002-1037.
Sala-i-Martin, X. and Sachs, J. (1991) ‘Fiscal federalism and optimum currency areas: Evidence for
Europe from the U.S.’National Bureau of Economic Research, Working Paper n. 3855.
Sharp, M. (1998) ‘Competitiveness and cohesion – are the two compatible?’ Research Policy, Vol.
27, No. 6, pp. 569-588
Solow, R. (1956) ‘A contribution to the theory of economic growth’. Quarterly Journal of
Economics, Vol. 70, pp. 65-94.
Stough, R. (1993) ‘Rise of the southern periphery in the united states: Understanding the Frostbelt-
sunbelt shifts’. In R. Leonardi (ed.) The state of economic and social cohesion in the community
prior to the creation of the single market, (Brussels: European Commission).
von Hippel, E. (1998) The sources of innovation, (New York: Oxford University Press).
Von Tunzelmann, N. and Nassehi, S. (2004) ‘Technology policy, European Union enlargement, and
economic, social and political sustainability’. Science and Public Policy, Vol. 31, No. 6, pp. 475-83.
Zimmermann, K., (2005) ‘European labour mobility: Challenges and potentials’. De Economist,
Vol. 127, No. 4, pp. 425-450.

24
Zimmermann, K. (1995) ‘Tackling the European migration problem’. Journal of Economic
Perspectives, Vol. 9, No. 2, pp. 45-62.
Zizmond, E. and Novak, M. (2007) ‘Controversies of technology convergence within the European
union’. Industrial Management & Data System, Vol. 107, No. 5, pp. 618-635.

25
TABLES
Table 1: Results of the Model 1 (beta-convergence) and Model 2 (fixed effects), relative to the SII performance
beta-regression estimates fixed-effects estimates
Independent variable
SII variation rate
(2004-2008)
Yearly SII variation rate
(2004-2008)
β -0.36*** -1.76***
Observations 32 96
F-test 0.04
Note: Robust standard errors: *** p<0.01, ** p<0.05, * p<0.1
Table 2: Results of the Model 1 (beta-convergence) relative to the seven innovation dimensions* of the SII
Independent
variable
Human
resources
Finance and
Supp.
Firm
investment
Linkages &
Entrepr. Throughputs Innovators
Economic
effects
β -0.90*** -1.46*** -0.34** -0.35** -1.51*** -0.02 -0.59***
Observations 32 32 32 32 32 32 32
Note: Robust standard errors: *** p<0.01, ** p<0.05, * p<0.1
* The seven dimensions are derived from the EIS (Table A1 in the Appendix)

26
Table 3: Innovation variables for group of countries ordered by labour force and population, 2007
Total
researchers
Triadic
Patents BERD PUBR&D Articles Population Labor force
Declining Nobility 35.78 37.40 38.47 38.02 40.33 30.85 31.36
Third State 21.15 7.22 14.97 22.62 22.69 27.47 26.55
Aristocracy 32.65 54.89 44.62 33.04 30.05 23.48 24.62
Parvenu 10.26 0.46 1.85 6.17 6.84 18.14 17.39
EU15 86.73 99.18 95.32 91.76 91.45 78.84 79.53
EU10 13.27 0.82 4.68 8.24 8.55 21.16 20.47
European Union 100.00 100.00 100.00 100.00 100.00 100.00 100.00
United States 112.28 107.57 159.52 94.17 83.41 61.35 66.61
Source: Our elaboration on OECD “Main Science and Technology Indicators 2009”, and World Bank “World
Development Indicator”, 2009.
Note: BERD is business R&D; PUBR&D is public R&D; articles are scientific and technical articles in international
journals recorded by the Institute of Scientific Information.
EU15: Member countries up to 2004.
EU10: Eastern and Central European member countries that joined the Union in 2004 and 2007: Bulgaria, Czech
Republic, Estonia, Hungary, Latvia, Lithuania, Poland, Romania, Slovak Republic, Slovenia.

27
FIGURES
Figure 1: Convergence in innovation performance across the EU27 countries over the five years 2004-2008
Belgium
Bulgaria
Czech Rep.
Denmark
Germany
Estonia Ireland
Greece
Spain
France
Italy
Latvia
Lithuania
Luxemburg
Hungary
Netherlands
Austria
Poland
Portugal
Romania
Slovenia
Slovack Rep.
Finland
SwedenUK
0.1
.2.3
2004-2008 SII growth
.2 .3 .4 .5 .6SII perfomance in 2004
Source: Author’s elaboration on European Commission (2008, 2009) – SII: Summary Innovation Indicator.
28
Figure 2: Growth rates for the SII and the seven innovative dimensions of the SII* for the New Member States and
EU27 mean, 2004-2008
* The seven dimensions are derived from the EIS (Table A1 in the Appendix)
0.00
0.20
0.40
0.60
0.80
1.00
1.20
Bulgaria Czech
Rep.
Estonia Latvia Lithuania Hungary Poland Romania Slovenia Slovack
Rep.
mean
(EU27)
2004-2008 growth rate
SII Human Res. Finance&Support Firm inv.
-1.00
-0.50
0.00
0.50
1.00
1.50
2.00
Bulgaria Czech
Rep.
Estonia Latvia Lithuania Hungary Poland Romania Slovenia Slovack
Rep.
mean
(EU27)
2004-2008 growth rate
Linkages Throughputs Innovators Economic eff.

29
Figure 3: Medium-term firms’ innovation performance (InnoInv06-08) and national innovation system strength 2006 SII
Source: authors’ elaboration on Innobarometer data, and on EIS data (see tables A2 and A3 in the appendix)
5ote: axes cross at average values
Figure 4: Firms’ innovation investment: 2006-2008 versus the first six months of 2009
0.0
10.0
20.0
30.0
40.0
50.0
60.0
70.0
Increassed
%
Decreased
%
Stayed the
same %
Percentages of firm
s which are reported to have increased,
decreased or maintained their innovation expenditures
Firms' innovation expenditures 2006-2008 Firms' innovation expenditures 2009
Source: authors’ elaboration on the two questions of the Innobarometer (see tables A3 and A4 in the appendix)
AustriaBelgium
Czech rep.
Estonia
Finland
France
Germany
GreeceHungary
Ireland
Italy
Latvia
Lithuania
Luxemburg
PolandSlovakia
Slovenia
Spain
United Kingdom
Bulgaria
Denmark
Netherlands
Portugal
Romania
Sweden
0.1
0.2
0.3
0.4
0.5
0.6
0.7
0.0 0.1 0.2 0.3 0.4 0.5 0.6 0.7 0.8 0.9 1.0
InnoInv 06-08 performance
SII 2006 perform
ance
Declining Nobility Aristocracy
Parvenu Third State
30
Figure 5: The impact of the current recession on firms’ innovation investments*
-50
-40
-30
-20
-10
0
10
Greece
Lithuania
Latvia
Romania
Hungary
Poland
France
Ireland
Estonia
Italy
Spain
Czech rep.
Slovenia
EU27
Portugal
United K
in.
Slovakia
Bulgaria
Luxemburg
Denmark
Netherlands
Belgium
Germ
any
Austria
Finland
Sweden
Source: authors’ elaboration on Innobarometer data (see Tables A3 and A4 in the appendix)
* Calculated as the difference between the share of firms increasing and firms decreasing their innovation investments
Figure 6: Balance between firms’ innovation investment before (InnoInv06-08), during (InnoInv09) and after the crisis
(InnoFor)
-40
-30
-20
-10
0
10
20
30
40
50
Aristocracy Decadent Nobility Parvenu Third State
Innoinv06-06 InnoInv09 InnoFor
Source: authors’ elaboration on the three questions of the Innobarometer (see tables A3-A4 in the appendix)

31
Figure 7: An “ideal” European System of Innovation: the development and diffusion of innovation outcomes across the
EU countries
New Knowledge
CoreCore
InnovationInnovation
Absorbtive
capacity
ParvenuThird State
AristocracyDeclining
Nobility
Knowledge and
Human resources flows,
Innovation diffusion,
Technology transfer
EuropeanEuropean policypolicy
Absorbtive
capacity
Large-scale
projects
Source: authors’ elaboration

32
Appendix
Table A1. Indicators for the InnoStruct of the European Innovation Scoreboard 2008
Dimension Indicators
S&E and SSH graduates per 1000 population aged 20-29 (first stage of tertiary education)
S&E and SSH doctorate graduates per 1000 population aged 25-34 (second stage of tertiary education)
Population with tertiary education per 100 population aged 25-64
Participation in life-long learning per 100 population aged 25-64
Youth education attainment level
Public R&D expenditures (% of GDP)
Venture capital (% of GDP)
Private credit (relative to GDP)
Broadband access by firms (% of firms)
Business R&D expenditures (% of GDP)
IT expenditures (% of GDP)
Non-R&D innovation expenditures (% of turnover)
SMEs innovating in-house (% of SMEs)
Innovative SMEs collaborating with others (% of SMEs)
Firm renewal (SME entries plus exits) (% of SMEs)
Public-private co-publications per million population
EPO patents per million population
Community trademarks per million population
Community designs per million population
Technology Balance of Payments flows (% of GDP)
SMEs introducing product or process innovations (% of SMEs)
SMEs introducing marketing or organisational innovations (% of SMEs)
Share of innovators where innovation has signifi cantly reduced labour costs (% of firms)
Share of innovators where innovation has signifi cantly reduced the use of materials and energy (% of firms)
Employment in medium-high & high-tech manufacturing (% of workforce)
Employment in knowledge-intensive services (% of workforce)
Medium and high-tech manufacturing exports (% of total exports)
Knowledge-intensive services exports (% of total services exports)
New-to-market sales (% of turnover)
New-to-firm sales (% of turnover)
Firm investments
Finance and support
Human resources
Economic effects
Innovators
Throughputs
Linkages &
entrepreneurship
Source: European Innovation Scoreboard 2008 (Merit 2009)

33
Table A2. Results from the three questions from the Innobarometer 2009*
Question no. 1 (2006-2008) Quesiton no. 2 (2009) Quesiton no. 3 (forecast)
Country Increased
%
Decreased
%
Stayed
the
same
%
Total
Increased
%
Decreased
%
Stayed
the
same
%
Total
Increased
%
Decreased
%
Stayed
the
same
%
Total
Austria 40.8 5.8 53.4 100 11.2 10.7 78.1 100 15.25 17.88 66.88 100
Belgium 40.1 9.4 50.5 100 12.0 17.6 70.5 100 16.23 20.56 63.21 100
Bulgaria 52.6 10.1 37.3 100 11.9 25.7 62.3 100 20.09 30.06 49.85 100
Czech rep. 40.3 13.1 46.6 100 13.8 29.6 56.5 100 16.86 35.98 47.15 100
Denmark 35.2 10.4 54.4 100 17.2 24.9 57.9 100 13.42 34.63 51.95 100
Estonia 32.0 14.9 53.1 100 7.9 29.6 62.5 100 6.61 43.11 50.28 100
Finland 42.7 6.4 50.9 100 16.7 14.8 68.5 100 19.58 20.94 59.48 100
France 35.3 7.0 57.7 100 7.0 29.7 63.2 100 8.61 37.81 53.58 100
Germany 43.2 5.2 51.5 100 10.3 14.4 75.3 100 10.1 20.94 68.96 100
Greece 45.8 15.0 39.2 100 2.0 49.3 48.7 100 11.61 45.06 43.33 100
Hungary 36.0 21.3 42.7 100 4.6 32.2 63.2 100 17.59 37.85 44.56 100
Ireland 30.8 14.9 54.3 100 9.9 32.1 58.0 100 12.43 42.32 45.25 100
Italy 35.8 13.4 50.8 100 8.9 26.1 65.0 100 9.84 35.46 54.7 100
Latvia 27.3 21.2 51.5 100 9.2 51.0 39.8 100 11.23 53.41 35.36 100
Lithuania 54.9 11.0 34.2 100 6.3 49.1 44.6 100 14.5 61.3 24.2 100
Luxemburg 31.9 5.6 62.5 100 8.6 16.9 74.5 100 11.9 31.81 56.28 100
Netherlands 35.6 8.7 55.7 100 10.4 16.8 72.8 100 9.16 27.8 63.05 100
Norway 35.8 6.9 57.3 100 12.9 27.2 59.8 100 16.74 27.2 56.06 100
Poland 46.1 13.3 40.6 100 8.2 33.8 58.0 100 17.84 31.07 51.09 100
Portugal 37.2 14.0 48.8 100 13.4 28.2 58.4 100 18.7 26.67 54.62 100
Romania 56.4 9.2 34.4 100 10.7 38.8 50.5 100 18.24 39.65 42.12 100
Slovakia 48.6 9.9 41.5 100 16.5 30.7 52.7 100 15.1 41.79 43.11 100
Slovenia 39.5 9.1 51.3 100 5.1 20.6 74.2 100 9.06 31.98 58.96 100
Spain 28.8 11.2 60.0 100 10.1 27.2 62.7 100 11.55 40.89 47.55 100
Sweden 54.2 5.8 40.0 100 14.8 12.6 72.6 100 21.99 25.4 52.61 100
Switzerland 47.8 8.9 43.4 100 17.5 9.0 73.5 100 13.7 18.2 68.1 100
UK 32.9 9.6 57.5 100 8.5 23.2 68.4 100 14.21 25.53 60.27 100
Source: European Innovation Scoreboard 2008 (European Commission 2009)
* With respect to the Innobarometer 2009, the results are been re-scaled to make them comparable across countries

34
Methodology: the three indicators
1. The InnoInv06-08 Indicator: is based on following Innobarometer 2009 question: “Compared to
2006, has the amount spent by your firm on all innovation activities in 2008 increased, decreased,
or stayed approximately the same (adjust for inflation)?”.
InnoInv06-08country-i = (Xcountry-i – Xcountry-min) / (Xcountry-max – X country-min)
Where Xcountry-i = (% firms increasing - % firms decreasing) - see Table A3
2. The InnoInv09 Indicator is based on following Innobarometer 2009 question: “In the last six
months has your company taken one of the following actions [increased, decreased or maintain the
innovation spending] as a direct result of the economic downturn?”
InnoInv09country-i = (Xcountry-i – Xcountry-min) / (Xcountry-max – X country-min)
Where Xcountry-i = (% firms increasing - % firms decreasing) - see Table A4
3. The InnoFor Indicator is based on following Innobarometer 2009 question: “Compared to 2008,
do you expect your company to increase, decrease or maintain the total amount of its innovation
expenditures in 2009?”.
InnoForcountry-i = (Xcountry-i – Xcountry-min) / (Xcountry-max – X country-min)
Where Xcountry-i = (% firms increasing - % firms decreasing) - see Table A5