
Is the decision made by someone to trust equivalent to ...
47
1 Master Thesis Is the decision made by someone to trust equivalent to taking a risky bet? Evidence from a binary-choice trust game. Name: Yujun He Student Number: 331679 Erasmus School of Economics Erasmus University Rotterdam Supervised by Zhihua Li
Transcript of Is the decision made by someone to trust equivalent to ...

1
Master Thesis
Is the decision made by someone to trust
equivalent to taking a risky bet? Evidence
from a binary-choice trust game.
Name: Yujun He
Student Number: 331679
Erasmus School of Economics
Erasmus University Rotterdam
Supervised by Zhihua Li

2
Abstract
Through experiments, we investigate whether the decision made by someone to trust
is equivalent to taking a risky bet. It can be examined by comparing people’s
minimum acceptance risk probability (MAP) in trust game and risky dictator game.
As a result, we find that experiment participants’ mean MAP in trust game is
significantly higher than their mean MAP in risky dictator game, no matter the stake
size is small or large. That is to say people do not treat trust equivalent to a risky bet.
We argue it is because people perceive certain social risk in trust. What’s more, we
observe that people behave in general more risk averse in large stake size scenario
games than in small stake size scenario games. In addition, we find out that some
human characteristics seem to be able to win more trust from others.

3
Table of content
1 Introduction ................................................................................................................. 4
2 Literature review ......................................................................................................... 7
2.1 Risk....................................................................................................................... 7
2.1.1 Risk construction ........................................................................................... 7
2.1.2 Risk attitudes ................................................................................................. 9
2.2 Trust ................................................................................................................... 10
2.2.1 Determinants of trust ................................................................................... 10
2.2.2 Measurement of trust ................................................................................... 11
3 Experiment design .................................................................................................... 13
3.1 Introduction of experiment models .................................................................... 13
3.2 Experiment Form................................................................................................ 17
4 Results ....................................................................................................................... 21
5 Conclusion ................................................................................................................ 29
6 Limitation .................................................................................................................. 30
7 Questionnaire ............................................................................................................ 31
8 Bibliography ............................................................................................................. 45
4
1. Introduction
In today’s society, people face the dilemma whether to trust each other. Take the
famous Chinese milk scandal as an example: before this incident, more than 80
percent Chinese consumed and relied on domestic milk; while after the milk has been
reported to be substandard or even hazardous to people, domestic milk industry
encountered a big trust crisis. Up to now about 70 percent Chinese still refuse to buy
domestic milk. The sharp drop of demand hit the Chinese milk industry severely, and
the milk scandal incident influenced the export of relative products in a way. It can
be seen that ‘trust’ played an important role in this example. So what is trust? It’s
hard to give a universal answer that covers each discipline’s point of view. In
Psychology, trust is seen as a gradually formed stable personality trait through
individuals’ acquired social learning (Rotter, 1967). People trust when they believe
the person who is trusted will do what is expected. In Sociology, trust is seen as an
embedded attribution to relationships between individuals and institutions. Trust is
reliance and confidence. The core of trust is altruism (Zuker, 1986). In Economics,
trust is expressed in a more calculative way. Williamson (1993) explains trust as
human beings’ rational calculation which aims to maximize individual benefits.
Despite there are controversies over the definition of trust, many scholars have
tended to reach a consensus that trust is related to risk. In other words, there are
always risks involved in trust relations. Williamson(1993)describes trust as a
subclass of risk. From his point of view, trust requires people to bear the risk which
depends on the performance of another actor. Mayer (1995) refers trust to be a

5
risk-taking behavior, because trust makes trustor vulnerable. When one party (trustor)
chooses to trust another party (trustee), trustor abandons the control over trustee’s
action. Trustee’s action is uncertain, thus the uncertainty brings risk to the trustor
once the trustee does not behave as expected. Moreover, Das and Teng (2004)
present a mirror-image relationship between trust and risk. They argue that low trust
always implies high perceived risk. However, even risk can be defined in many
different ways. In Economics, risk is about the probability of experiencing a loss or
undesirable outcome. Knights (1921) defines risk as measurable uncertainty, it can be
denoted through probability. The probability of risk has objectivity. That is to say,
risk can be naturally taken as probabilistic risk. Different to this traditional economic
view of risk, some scholars put forward a novel opinion. Slovic (1987) argues that in
real situations people do not take risk merely as nature risk or probabilistic risk.
Certain social, cultural and psychological factors may all be incorporated into
people’s risk measurement. Towards this kind of social embedded risk, we call it
social risk.
Sztompka (1999) mentions that trust is a bet about the future contingent actions of
others. That is to say, people who decide to trust confront a risky situation where the
outcome is uncertain, which is very similar to taking a risky bet. In a risky bet or
simply say a gambling, people also need to face uncertain risk and outcome. Hence
intuitively, it seems reasonable to equate trust with a risky bet. From the perspective
of probabilistic risk view, the risk involved in trust or gambling should be anyway

6
probabilistic to people. No matter the counterpart is nature or a person. If trust and
gambling have same possible outcomes or payoffs, people should perceive similar
risk from these two cases. Trust can therefore be equated with taking a risky a bet.
However, according to social risk opinion, due to the fact that trust behavior involves
social relations, people may perceive additional social risk from trust. Therefore,
trust should not be treated as gambling. A previous research paper Bohnet and
Zeckhauser (2004) has already proved trust is different from a risky bet by putting
forward a concept named ‘Betrayal Aversion’. They find that most people are
betrayal averse when the counterpart is a person instead of a random device like
computer. People’s decision to trust requires additional risk premium to compensate
possible betrayal costs result from trustee’s betrayal. In fact, the term ‘betrayal
aversion’ can be deemed as a kind of social risk.
Nevertheless, the empirical works with respect to whether trust should be treated as a
risky bet are still very limited. The discussion over probabilistic risk concept and
social risk concept can be hardly found either. Therefore in this paper we are inspired
to investigate again whether people’s decision to trust is equivalent to taking a risky
bet. In other words, whether the risk people perceived from trust is similar to the one
they perceived from an equivalent risky bet. Through this paper, we aim to introduce
a novel risk concept named the social risk, and show how social risk differs from
probabilistic risk. Moreover, we are interested to study which personal characteristics
may influence people’s risk evaluation of trust.

7
In society, trust is a very important component of social capital. The presence of trust
enables public policy to be implemented more smoothly and effectively. Society
needs trust to brace its long term development. As for every human being, trust
simplifies the cooperate relation between people. It contributes to reduce social
complexity (Luhmann, 1979). We believe it will be very meaningful if everyone who
lives in the society can gain more knowledge on trust and in turn utilize the
knowledge to together facilitate social and individual efficiency for the long term
development.
2. Literature Review
2.1 Risk
2.1.1 Risk construction
According to Adam and van Loon (2000), risk is not a thing out there for people to
observe, it needs to be constructed. Bradbury (1989) summarizes two recognized
concepts of risk. One concept conceives risk as a physically given attribute or an
objective fact, which is derived from nature. We call it probabilistic risk. The
alternative conceives risk as a socially contributed attribute or a social process which
depends on human’s subjective assessment and experience. We call it social risk.
Social risk highlights the social attribute of risk.
Through the ages, when risk is mentioned in the field of economics, it conventionally

8
means probabilistic risk. Knights (1921) proposes a profoundly influential idea
supports that risk only relates to objective probabilities. He states that the probability
of a proposition should be intrinsic and it should be independent from any subjective
factors. Keynes (1921) confirms this idea. He argues that risk is made up by two
elements, probability and severity. Probability implies randomness, probabilistic risk
is wholly objective. However, not every scholar supports this point of view. In the
paper Finetti (1970), the author mentions “ to objectify probability is an illusory
attempt to exteriorize or materialize our true probabilistic beliefs”. In accordance
with the later developed prospect theory, Kahneman and Tversky (1979) argue in
reality people take subjective value of probability. Slovic (1987) proposes that
people’s perception of risk can be very complex, so the role of their emotions and
cognitive progress towards risk should be involved in risk assessment. The concept
of social risk makes more sense in the real world. Bradburry (1989) therefore
suggests instead of solely identify the objective probabilistic risk, it’s better to
integrate the probabilistic risk assessment together with the social risk evaluation.
In accordance with above arguments, it can be seen that although both trust and
gambling contains uncertain risk, their risk construction seems different from each
other. To gambling, it’s a game which its situation is relatively pure. The risk is fully
determined by nature or say by some random devices that pick outcome
stochastically. There are no social factors involved. The risk of gambling belongs to
objective probabilistic risk. However in the case of trust, the counterpart a trustor

9
confronts changes to a person instead of nature. The uncertainty of trust is caused by
the possibility of trustee’s exit, betrayal and defection (Gambetta, 1988). Because
trust itself represents a social relation, the risk of trust should be constructed socially.
It is social risk. Considering two different risk constructions respectively to gambling
and trust, it is reasonable for us to presume that people’s decision to trust is different
from taking a risky bet.
2.1.2 Risk attitudes
According to Hillson and Webster (2007), risk attitude is defined as “the chosen
response of an individual or group to uncertainty that matters, driven by perception.”
That is to say, risk attitude is a person’s chosen response to the risk he perceived.
Risk attitude is a critical element to understanding humans’ decision-making in risky
situations. Humans’ risk attitudes to a particular situation vary from gender to gender,
age to age, wealth to wealth and also nation to nation (Dohmen et al, 2005). Basically,
risk attitude can be classified into three categories: risk averse, risk neutral and risk
seeking. Table 1 summarizes the definitions of these three risk attitudes from
Kahneman and Tversky (1979). For those people who are risk averse, they tend to
perform in a conservative and reliable way while making decisions, and they should
be very sensitive to risk. Conversely, for those people who are risk seeking, they will
tend to be risk loving, and do not fear to bear the losses from risk. In our paper, if
individuals treat trust equivalent to gambling, then if same condition holds their risk
attitudes should be indifferent in both cases. But if individuals treat trust and

10
gambling differently and perceive different risk from these two cases, their risk
attitudes towards trust and gambling may differ as well.
Table 1 Definition of three risk attitudes
Attitude Definition
Risk averse Expect value of prospect for sure is preferred to prospect
Risk neutral Indifferent between expect value for sure and prospect
Risk seeking Prospect is preferred to expected value of prospect for sure
2.2 Trust
2.2.1 Determinants of trust
There’s no doubt that trust decisions are always accompanied with risk. The word
‘risk’ has been frequently used in the definitions of trust. Sabel (1993) believes trust
is to take risk with the trustee. Currall and Judge (1995) define trust as individual’s
behavioral reliance on another person under a condition of risk. The risk of trust is
considered to be mainly derived from trustee. Although trustees’ actions are uncertain
to the trustors to some extent, they still choose to trust as there are certain factors
which can influence trustor’s trustworthiness assessment to the trustee. Flores and
Solomon (1998) mentions that one’s trustworthiness inspires trust. Nickel and Vaesen
(2012) also confirms the determination of trust depends on a qualitative evaluation
on trustee. From the social risk perspective, trustee’s trustworthiness should affect
trustor’s risk assessment of trust. Especially when the trustee appears to be a totally
stranger to the trustor, the trustor will rely on trustee’s personal characteristics to

11
judge his trustworthiness (Croson and Buchan, 1999). Bohnet and Croson (2004)
sum up several personal characteristics which can influence trustworthiness: gender,
age, ethnicity and social distance.
Many scholars also point out people with certain demographic characteristics simply
prone to trust others easier. First important character relates to gender. It seems that
women are more likely to trust others than men (Croson & Buchan, 1999; Eckel &
Grossman, 1998; Bohnet & Zeckauser, 2004). Croson and Buchan (1999) find
women are in general more altruistic than men. The second important character
relates to race. Black people seem to have lower level of trust on others than Whites
(Smith, 1997; Uslaner, 2002). Moreover, variables like income, education level also
matters (Frank et al, 1993; Snijder, 2001). In addition, the stake size matters too.
People tend to be more risk averse to larger stakes, and it implies lower trust
(Stenman et al, 2005).
2.2.2 Measurement of trust
Trust can be measured in a number of ways. Date back to early stage, the form of
scale was usually used by scholars to measure trust. In the paper of Wrightsman
(1964), a so called ‘Trustworthiness Subscale of the Philosophies of Human Nature
Scale’ is designed for the measurement. The scale consists of 14 items and focus on
measure humans’ universal recognition to trustworthiness. Through this scale,
Wrightsman found that female owns more positive outlook to trust than male. Couch

12
(1994) prior designed a trust inventory scale to measure together global trust and
relational trust. Global trust refers to humans’ generalized trust to good and evil of
human nature. Relational trust refers to humans’ specific trust level under specific
circumstances. Jones and Burdette (1994) designs an interpersonal betrayal scale to
measure trust, this scale contrasts in previous scales as it measures trust indirectly
from the perspective of betrayal. It measures individuals’ betrayal tendency to other
people includes strangers, friends and families.
Until 1980s, along with the development of game theory, more and more scholars
began to use the form of game to measure trust, and it is called the trust game. Trust
game is evolved from Prisoner’s Dilemma. It measures trust level through observing
the occurrence frequency of cooperation in the game between 2 players. Nowadays,
trust game has been revised to various models. The most classic model is designed
by Berg et al. (1995) and it can be viewed as an extension form of the dictator game.
Firstly, the game starts with a dictator who decides whether to split his initial
endowment (money) between himself and another partner A. If he decides to split,
then A receives the split amount times three in total. In this case, A will then decide
whether to give a portion of money back to the dictator to honor his trust. Another
familiar trust game model is introduced by Dasgupta (1988) and Kreps (1990), it is
called the binary-choice trust game. The game includes two players with two
subgames, they make choice sequentially. That is to say, both players are decision
makers. Considering given payoffs under each choice, player 1 initially choose

13
whether to trust, and then it’s player 2’s turn to choose whether to honor the trust. In
order to study whether the decision made by someone to trust is equivalent to taking
a risky bet, it is better to construct a decision making situation for our observation in
the first place. Compare to trust scale, trust game is more appropriate for us to
construct such a situation. Hence in this paper we will use trust game to conduct
related research observations.
3. Experiment Design
3.1 Introduction of Experiment Models
In our research, we aim to investigate whether the decision made by someone to trust
is equivalent to taking a risky bet, or simply say gambling. The basic method is
conducting experiments to compare people’s risk attitude and tolerable risk level
between trust and gambling. If it can be proved that most experiment participants
hold similar risk attitudes and tolerable risk levels in both trust and gambling cases,
we can then conclude that trust is equivalent to gambling. In order to make the
experiment results comparable, we need to make sure that similar decision making
propositions or experiment models are constructed for these two cases in the
experiments. In the case of trust experiments, we pick the binary-choice trust game
(see fig 1) as our trust experiment model, other than the classic trust game model.
There are two reasons: firstly, it can simplify our data collecting process. In the
binary-choice trust game, payoffs under each choice could be set by us, thus the

14
payoffs stay constant for every participant in the game. In this paper, it is not our
research point to elicit participants’ trust level by observing their different given
amounts of money. We emphasize to observe after knowing the possible payoffs
under each choice, how the existence of player 2 as another decision maker
influences player 1’s decision to trust. Secondly, the binary-choice trust game model
can be revised and further adapted to gambling experiments. The only thing we need
to change is to replace player 2 by nature and remove player 2’s relevant payoffs. We
call it the gambling experiment model (see fig 2). In this way, we ensure that all
other conditions in the trust case could stay similar with the gambling case. Since the
experiment model for trust is in general similar to the experiment model for
gambling, the observation data under two cases can be preliminarily comparable.
Figure 1 demonstrates a binary-choice trust game model paradigm. Figure 2
demonstrates a gambling model paradigm.
In addition to gambling and trust game model, another experiment model named the
risky dictator game model is added in our research. Figure 3 demonstrates a risky
dictator game model paradigm. Although the gambling model already looks similar
to the trust game model, they do have one difference that can hardly be ignored. In
gambling there’s only one player, so possible payoffs just go to that player. But in the
trust game, another player is involved and possible payoffs go to two players. This
difference may exert influence to the results of our experiments. Therefore, we need
to add a risky dictator game model to help balance the difference. The risky dictator

15
game could reproduce a player 2 apart from a trust situation (Bohnet & Zeckhauser,
2004). Actually, the risky dictator game is a revised gambling game. It’s a different
form of gambling and it’s fully comparable to trust game. In the risky dictator game,
Player 1 (decision maker)’s payoff is decided by nature, just like gambling. The only
difference is Player 1’s choice of quit or play affects another player (player 2)’s
payoffs as well. But player 2 is only a recipient, he makes no decision. Therefore, in
experiment we actually have two gambling games: normal gambling and risky
dictator game.
In all three paradigms, the possible payoffs for player 1 stay the same. However,
compare with gambling and risky dictator game, player 2 in the trust game is a
decision maker as well as player 1. He has right to decide which outcomes should
happen: good or bad. The probability of good or bad outcome in Gambling and risky
dictator game is decided by nature, but the probability of good or bad outcome in
trust game is decided by another person, in this case player 2. From the perspective
of probabilistic risk, the risk under all three cases for player 1 should stay similar.
Because firstly player 1’s possible payoffs are the same in all three games. Secondly,
the probabilities of good or bad outcome are all uncertain to player 1 in three games
too. It doesn’t matter who made the decision, nature or player 2. The probability
should be anyway stochastic. If player 1 cares only about his own payoff, his
decision under all three games should stay the same as well. Yet, from the
perspective of social risk, the situation under trust game is bit different for player 1.

16
In trust game, player 1’s possible payoffs are determined by player 2. The risk player
1 needs to bear is not stochastic anymore. It may be influenced by certain social
factors. For instance: betrayal, compare mindset with player 2’s payoffs. It’s social
risk. Snijders and Keren (1998) doesn’t mention the social risk concept in their paper,
however they do noticed a fact that player 2’s possible payoffs may influence player
1’s trust decision. They name it temptation and calculate it by take the ratio
(T-R)/(R-S).
Figure 1 Binary Choice Trust Game
Player 1
Player 2
No Trust Trust
Abuse Trust Honor Trust
Player 1 gets P
Player 2 gets P
Player 1 gets S
Player 2 gets T
Player 1 gets R
Player 2 gets R
Note: derived from Snijders and Keren (1998)

17
Figure 2 Gambling
Figure 3 Risky Dictator Game
3.2 Experiment Form
Because of time and money limitation, we conduct experiments by using
questionnaires. The questionnaire contains three parts: Scenario 1, Scenario 2, and
two Appendixes. Under each scenario, there includes three games: a gambling game,
a trust game and a risky dictator game. In scenario I, the possible payoffs are in small
Player 1
Nature
Quit Play
Good Bad
Player 1 gets P
Player 1 gets S
Player 1 gets R

18
amounts. In scenario II, the possible payoffs are 5 times larger than scenario 1’s. We
want to test besides small stake size, how larger stake size influence people’s
decision to trust and gambling. In two appendixes, we ask experiment participants’
backgrounds including their age, ethic group, education level and so on. In addition,
we ask which people looks trustworthy to them. We expect to investigate for
different groups of people, how their trust groups different from each other.
The experiment participants are deemed as game players in the experiments. Each of
them needs to play 6 games in total. In the case of gambling, they are the only player
in the game. In the case of risky dictator game or trust game, they need to imagine as
if there was another player S in the game. Player S is a totally stranger to them. In the
questionnaire, each game’s content and rule is described particularly. Players are
required to read game description carefully. Next, they are given two options: to play
the game or quit. Of course, different options correspond to different payoffs. If
player quits the game, he gets a participation fee for sure. If player plays the game,
he then has the possibility to win either a higher amount of money or a lower amount
of money, according to a good outcome happened or a bad one. Table 2 summarizes
the possible payoffs for all 6 games. In each game description, we tell players who
decides the game outcome. In the case of gambling and risky dictator game, it’s a
computer who picks the outcome between a good one and a bad one. In the case of
trust game, it’s Player S who makes the decision. In order to show clearly how each
game is played and also its possible game payoffs, we provide players a game

19
diagram for each. Finally, we ask every player to write down their MAPs for play the
game. In other words, we ask players how large the probability of a good outcome
happens should at least be for them to play the game rather than receive a payoff for
sure. MAP stands for minimum acceptance probabilities. It can elicit people’s risk
acceptance level and their risk attitudes (Bohnet and Zeckerhauser, 2004). Hence,
MAP is a very important indicator in our analysis. Assume the possible payoffs for
players stay identical in risky dictator game and trust game, if players treat trust
equivalent to a risky bet, their MAPs in all these games should be the same, or at
least similar.

20
Table 2 Possible Payoffs summary
Players’ choice Probability Players’ payoff Payoff to another player S
Gambling
Play P 20
1-P 5
Quit 1 10
Risky dictator game
Play P 20 20
1-P 5 35
Quit 1 10
Trust game
Play P 20 20
1-P 5 35
Quit 1 10
Sm
all Stak
e Size (S
cenario
1)

21
Players’ choice Probability Players’ payoff Payoff to another player S
Gambling
Play P 100
1-P 25
Quit 1 50
Risky dictator game
Play P 100 100
1-P 25 175
Quit 1 50
Trust game
Play P 100 100
1-P 25 175
Quit 1 50
4. Results
We sent 80 questionnaires in total, either in the C-hall of Erasmus University or
through Email. Among the 80 questionnaires, 30 of them have incomplete
information. Eventually, we collected 50 valid questionnaires as our research data. In
order to compare participants’ MAPs between games, we conduct the analysis of
mean, median and mode. Table 3 and 4 respectively show the results, one is for
scenario 1 with the small stake size, and the other is for scenario 2 with the larger
Larg
e Stak
e Size (S
cenario
2)

22
stake size. Next, we sort those experiment participants by gender and ethic group,
and compare their MAPs between two trust games. With respect to the ethic group,
we only compare Caucasian group with Asian group. The reason is that these two
groups are in the majority of 50 participants. Finally, we summarize based on our
data what kinds of people may looks more trustworthy or win more trust. Following
are the results.
Result 1 MAPG = MAPRD in both scenarios
According to table 3 and 4, players’ mean MAP of gambling almost equals to their
mean MAP of risky dictator game, no matter the stake size is small or large. In order
to be prudent towards this result, we use the Mann-Whitney U test to check whether
the mean MAPs in these two games have any significant difference. In the small
stake size scenario, the mean rank of gambling is 50.32 and the mean rank of risky
dictator game is 50.68. The difference between gambling and risky dictator game is
not significant at a 5% significance level (0.95>0.05). Same to the larger stake size
scenario, the difference between gambling and risky dictator game is not statistically
significant (0.59>0.05). Therefore we can conclude that compare to the normal form
gambling, even though risky dictator game includes another player S and his payoffs,
it doesn’t affect people significantly. As long as the probabilities of outcome is
decided by nature, people treat these two gambling similarly.
Results 2 MAPT > MAPRD in both scenarios

23
It can be seen directly that there are big differences in mean MAPs between trust
game and risky dictator game, no matter in small or larger stake size. Again, we use
the Mann-Whitney U test to check whether the mean MAPs in these two games are
indeed significantly different. In the small stake size scenario, the mean rank of trust
game is 63.29 and the mean rank of risky dictator game is 37.71. The difference
between trust game and risky dictator game is significantly different at a 5%
significance level (0.00>0.05). In the large size scenario, the mean rank of trust game
is 67.49 and the mean rank of risky dictator game is 33.51. The difference between
trust game and risky dictator game is statistically significant (0.00>0.05). We have
mentioned earlier that the risky dictator game can be considered as a revised
gambling game. Compare to the normal form gambling, it’s a kind of gambling
which also benefits another player, though this player is and only is a recipient. Now
we find players’ mean MAPs in trust game are apparently higher than in risky
dictator game in both scenarios. Thus, it can be concluded that the decision made by
someone to trust is not equivalent to gambling.
According to expected value theory, as long as the probability of a good outcome is
larger than 0.34, players should play all those 6 games. However, as is shown in table
3 and 4, players’ mean MAPs are all higher than 0.34. Players are in general risk
averse. Especially in trust game, players’ mean MAPs are much higher than 0.34 and
also higher than their mean MAPs in risky dictator game and gambling in both
scenarios. Players seem to behave more risk averse in trust games.

24
Result 3 Mean MAPs under large stake size scenario > Mean MAPs under
small stake size scenario
Comparison of table 3 and 4 shows that players’ mean MAPs in gambling, risky
dictator game and trust game under large stake size scenario are higher than their
mean MAPs under small stake size scenario. Mann-Whitney U test again verifies this
result. Players tend to be more risk averse with higher stakes. The MAP value that
appears most often in trust game with large stakes is 0.8, while with small stakes the
value is 0.55. Larger stakes seem to induce players to behave more cautious than
small stakes in the trust game.

25
Table 3 MAPs in three games with small stake size
Gambling Risky Dictator Game Trust Game
Mean 0.44 0.45 0.6
Median 0.4 0.4 0.6
Mode 0.4 0.4 0.55
N 50 50 50
Table 4 MAPs in three games with larger stake size
Gambling Risky Dictator Game Trust Game
Mean 0.57 0.55 0.75
Median 0.56 0.56 0.78
Mode 0.5 0.55 0.8
N 50 50 50

26
Result 4 Females’ mean MAPs > Males’ mean MAPs in both scenarios
Asians’ mean MAPs > Caucasians’ mean MAPs in both scenarios
Table 5 illustrates players’ mean MAPs to trust game, which are sorted by their
gender and ethic group. The results show that female players’ mean MAPs to play the
trust game are larger than male players’ in both small stake scenario and larger stake
scenario. In addition, Asian players’ mean MAPs to play the trust game are larger
than Caucasian players’ in both scenarios. These two differences are statistically
significant at a 5% significance level. That is to say, female players act more risk
averse than male players in the trust game. On the other hand, Asian players tend to
be more risk averse in the trust game than Caucasian players. The result is in line
with Bohnet and Zeckerhauser (2004)’s research conclusion.
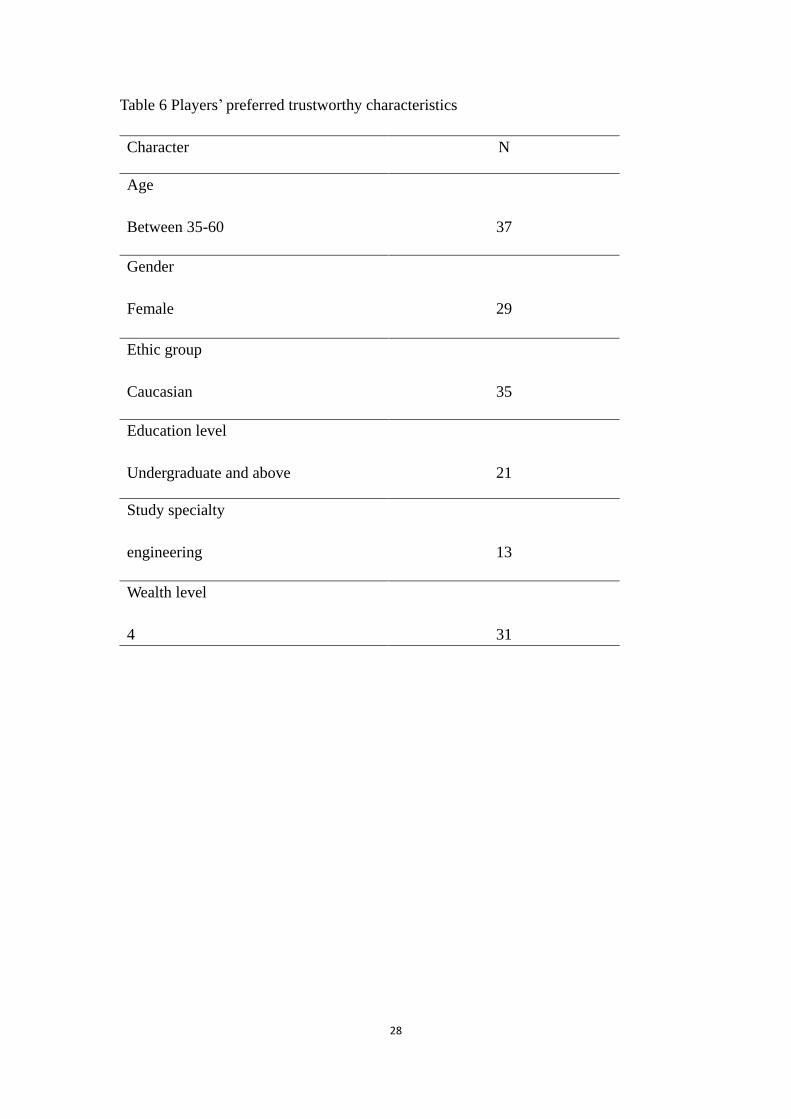
Result 5 Players’ preferences towards trustworthy counterparts
In the questionnaire appendix, we ask players to choose their preferred trustworthy
counterparts. There are in total 6 characters, we summarized the majorities’
preferences for each character in Table 6. According to table 6, females and
Caucasians seems to be more trustworthy to the experiment participants. In addition,
people with higher education level and wealth level looks more trustworthy as well.
Other than those, it is worth to mention the study specialty character. Among the 50
experiment participants, 13 of them pick people who study engineering as a
trustworthy character. Except for engineering, 9 participants pick mathematics. It
seems that the science based study is a trustworthy character to our participants.

27
However, it’s surprising to find that nobody pick the economics study as a
trustworthy character.
Table 5 MAPs sorted by gender and ethic group in trust game
Small stake size Larger stake size
Male
Mean 0.52 0.72
N 22 22
Female
Mean 0.66 0.8
N 28 28
Caucasian
Mean 0.56 0.73
N 24 24
Asian
Mean 0.62 0.76
N 17 17
28
Table 6 Players’ preferred trustworthy characteristics
Character N
Age
Between 35-60 37
Gender
Female 29
Ethic group
Caucasian 35
Education level
Undergraduate and above 21
Study specialty
engineering 13
Wealth level
4 31

29
5. Conclusion
Stephen Covey once said: “Trust is the glue of life”. It is not only a kind of public
‘social capital’, but also one of individual’s important intangible assets. In a society
with high level of trust, the possible organization costs and transaction costs can be
relatively decreased. People can expect more unhindered social lives and more
prosperous economy. Therefore, it’s very meaningful to understand trust and its
relative issues. Trust relations involve risk, thus many people tend to equate trust to a
risky bet. However, based on the social risk concept, we argue that the risk
constructions between trust and a risky bet are different. A risky bet contains solely
probabilistic risk, but trust as a social behavior contains social risk. Hence, in this
paper we investigate whether the decision made by someone to trust is equivalent to
taking a risky bet. We are also interested in finding which human characteristics may
have influence on trust.
In conclusion, the results show that the MAPs between trust game and two gambling
games are significantly different. People actually do not treat trust as same as a risky
bet. In addition, we found that male or Caucasian are relatively easier to trust
strangers than female or Asian. What’s more, the experiment results show that female
or Caucasian looks more trustworthy to people. Same to people with high education
level and high wealth level, they receive more trust from people. However, it’s
surprising to find that people whose study special is economics at school become a
distrust indicator in our research.

30
6. Limitation
There are few limitations in our research. First and the foremost, our sample
population is small. We only collected 50 valid data during the experiments, thus the
experiment results may not be widely representative. In fact, the larger the database is,
the more reliable the results should be. Secondly, our sample population is not very
diversified. The experiments are conducted mainly at university or among friends and
relatives, thus the sample population diversity is limited. And it blocks some of our
research conclusions. For example, because only 9 of 50 experiment participants are
Latinos or Africans, it’s hard for us to draw a conclusion on their trust tendency in this
paper. In order to deepen the research on different demographic groups’ trust levels,
more balanced and diversified sample population is required. Last but not the least,
use questionnaire as a research instrument in our research has weak points. Because of
time and money limitation, we use questionnaire to collect research data. However,
results derived from questionnaire may be biased. Questionnaire requires people to
read and answer questions, so participants may feel restricted and frustrated. Actually,
the best experiment method for our research is to let everything go real. It’s better to
create real gambling, risky dictator game and trust game situations for players and
invite them to actually play those games, to feel the win and loss. In such way, we can
expect more powerful and reliable results.

31
Questionnaire
Scenario 1
Game I
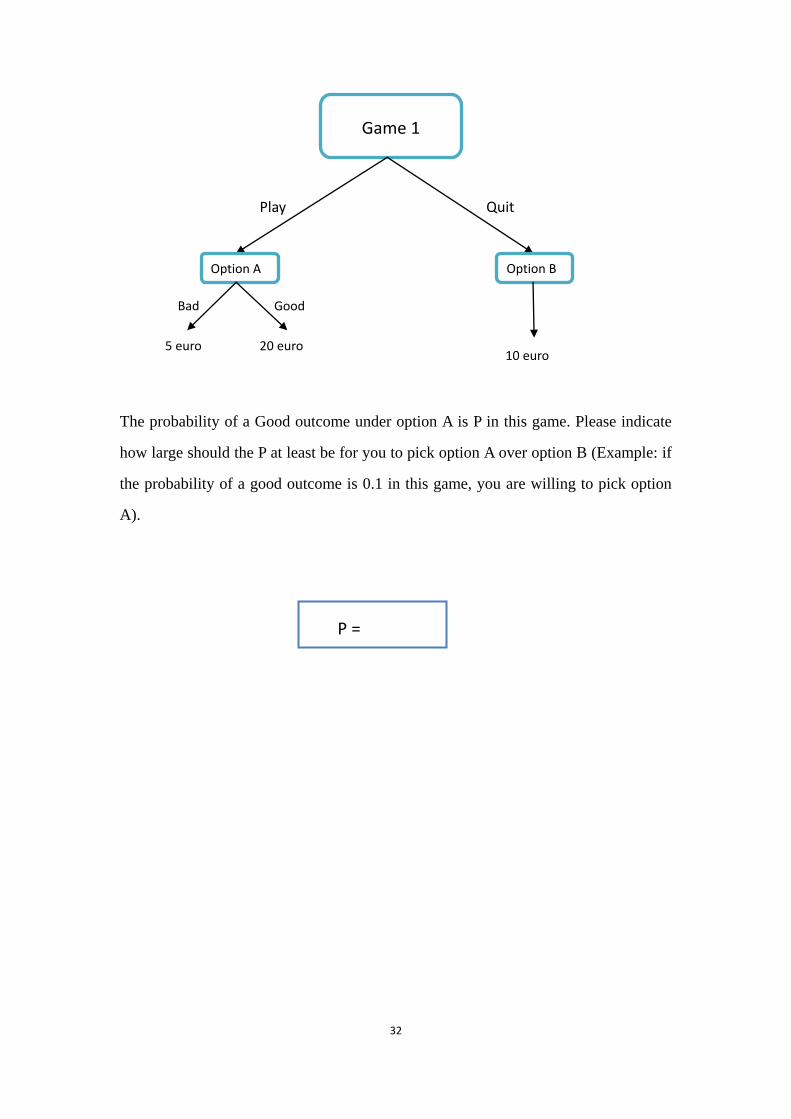
Suppose now you are being invited to play a game. The game is played by one single
player and in this case it’s you. It consists of two possible outcomes: a good outcome
and a bad outcome. These two outcomes are exclusive to each other which means
only one of them will happen. Different outcomes bring you different payoffs. If
Good outcome happens, you earn a reward of 20 euro. If Bad outcome happens you
earn 5 euro. However you do not know which outcome will happen to you. The
occurrence of the two possible outcomes is randomly determined by a computer.
Before the game really starts, you can freely choose either to play it or quit.
Option A: You would like to play the game. Thus your payoff will be either 20 euro or
5 euro. Your exactly payoff is determined by a computer.
Option B: You prefer not to play this game. You can quit immediately and earn 10
euro participation fee
32
The probability of a Good outcome under option A is P in this game. Please indicate
how large should the P at least be for you to pick option A over option B (Example: if
the probability of a good outcome is 0.1 in this game, you are willing to pick option
A).
Game 1
Option B
Play Quit
10 euro 5 euro 20 euro
Good
Option A
Bad
P =
33
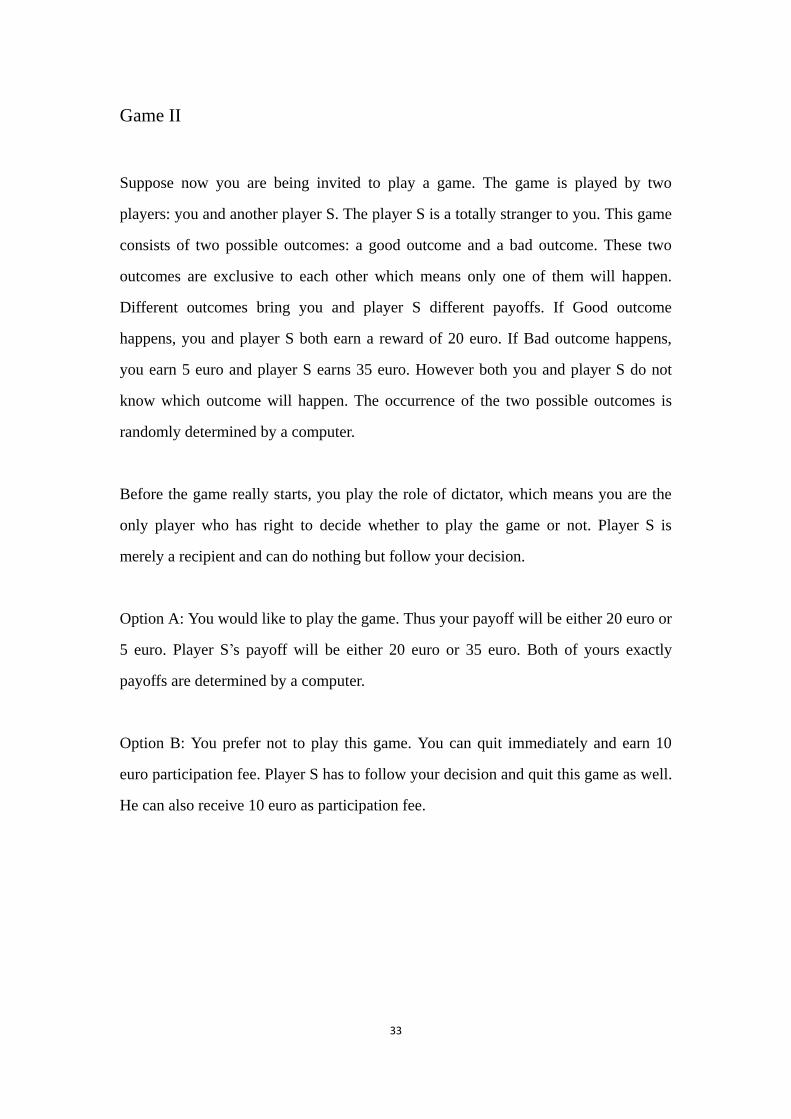
Game II
Suppose now you are being invited to play a game. The game is played by two
players: you and another player S. The player S is a totally stranger to you. This game
consists of two possible outcomes: a good outcome and a bad outcome. These two
outcomes are exclusive to each other which means only one of them will happen.
Different outcomes bring you and player S different payoffs. If Good outcome
happens, you and player S both earn a reward of 20 euro. If Bad outcome happens,
you earn 5 euro and player S earns 35 euro. However both you and player S do not
know which outcome will happen. The occurrence of the two possible outcomes is
randomly determined by a computer.
Before the game really starts, you play the role of dictator, which means you are the
only player who has right to decide whether to play the game or not. Player S is
merely a recipient and can do nothing but follow your decision.
Option A: You would like to play the game. Thus your payoff will be either 20 euro or
5 euro. Player S’s payoff will be either 20 euro or 35 euro. Both of yours exactly
payoffs are determined by a computer.
Option B: You prefer not to play this game. You can quit immediately and earn 10
euro participation fee. Player S has to follow your decision and quit this game as well.
He can also receive 10 euro as participation fee.

34
The probability of a Good outcome under option A is P in this game. Please indicate
how large should the P at least be for you to pick option A over option B (Example: if
the probability of a good outcome is 0.1 in this game, you are willing to pick option
A).
Game 2
Play Quit
Option A Option B
You: 10 euro
S: 10 euro
You: 5 euro
S: 35 euro
You: 20 euro
S: 20 euro
Good Bad
P =

35
Game III
Suppose now you are being invited to play a game. The game is played by two
players: you and another player S. The player S is a totally stranger to you. This game
consists of two possible outcomes: a good outcome and a bad outcome. These two
outcomes are exclusive to each other which means only one of them will happen.
Different outcomes bring you and player S different payoffs. If Good outcome
happens, you and player S both earn a reward of 20 euro. If Bad outcome happens,
you earn 5 euro and player S earns 35 euro. In this game, player S can choose his
preferred outcome. In other words, the occurrence of the two possible outcomes is
determined by player S.
Before the game really starts, you play the role of dictator, which means you are the
only player who has right to decide whether to play the game or not. Player S is
merely a recipient and can do nothing but follow your decision.
Option A: You would like to play the game. Thus your payoff will be either 20 euro
or 5 euro. Player S’s payoff will be either 20 euro or 35 euro. Both of yours exactly
payoffs are determined by player S.
Option B: You prefer not to play this game. You can quit immediately and earn 10
euro participation fee. Player S has to follow your decision and quit this game as well.
He can also receive 10 euro as participation fee.

36
The probability that player S would choose ‘Good outcome’ under option A is P.
Please indicate how large should the P at least be for you to pick option A over option
B (Example: if the probability of a good outcome is 0.1 in this game, you are willing
to pick option A).
Play Quit
Game 3
Option A Option B
You: 5 euro
S: 35 euro
You: 20 euro
S: 20 euro
You: 10 euro
S: 10 euro
Good Bad
P =

37
Scenario 2
Game I
Suppose now you are being invited to play a game. The game is played by one single
player and in this case it’s you. It consists of two possible outcomes: a good outcome
and a bad outcome. These two outcomes are exclusive to each other which means
only one of them will happen. Different outcomes bring you different payoffs. If
Good outcome happens, you earn a reward of 100 euro. If Bad outcome happens you
earn 25 euro. However you do not know which outcome will happen to you. The
occurrence of the two possible outcomes is randomly determined by a computer.
Before the game really starts, you can freely choose either to play it or quit.
Option A: You would like to play the game. Thus your payoff will be either 100 euro
or 25 euro. Your exactly payoff is determined by a computer.
Option B: You prefer not to play this game. You can quit immediately and earn 50
euro participation fee.

38
The probability of a Good outcome under option A is P in this game. Please indicate
how large should the P at least be for you to pick option A over option B (Example: if
the probability of a good outcome is 0.1 in this game, you are willing to pick option
A).
Game 1
Option A Option B
Play Quit
50 euro 25 euro 100 euro
Good Bad
P =

39
Game II
Suppose now you are being invited to play a game. The game is played by two
players: you and another player S. The player S is a totally stranger to you. This game
consists of two possible outcomes: a good outcome and a bad outcome. These two
outcomes are exclusive to each other which means only one of them will happen.
Different outcomes bring you and player S different payoffs. If Good outcome
happens, you and player S both earn a reward of 100 euro. If Bad outcome happens,
you earn 25 euro and player S earns 175 euro. However both you and player S do not
know which outcome will happen. The occurrence of the two possible outcomes is
randomly determined by a computer.
Before the game really starts, you play the role of dictator, which means you are the
only player who has right to decide whether to play the game or not. Player S is
merely a recipient and can do nothing but follow your decision.
Option A: You would like to play the game. Thus your payoff will be either 100 euro
or 25 euro. Player S’s payoff will be either 100 euro or 175 euro. Both of yours
exactly payoffs are determined by a computer.
Option B: You prefer not to play this game. You can quit immediately and earn 50
euro participation fee. Player S has to follow your decision and quit this game as well.
He can also receive 50 euro as participation fee.

40
The probability of a Good outcome under option A is P in this game. Please indicate
how large should the P at least be for you to pick option A over option B (Example: if
the probability of a good outcome is 0.1 in this game, you are willing to pick option
A).
Game 2
Play Quit
Option A Option B
You: 50 euro
S: 50 euro
You: 25 euro
S: 175 euro
You: 100 euro
S: 100 euro
Good Bad
P =

41
Game III
Suppose now you are being invited to play a game. The game is played by two
players: you and another player S. The player S is a totally stranger to you. This game
consists of two possible outcomes: a good outcome and a bad outcome. These two
outcomes are exclusive to each other which means only one of them will happen.
Different outcomes bring you and player S different payoffs. If Good outcome
happens, you and player S both earn a reward of 100 euro. If Bad outcome happens,
you earn 25 euro and player S earns 175 euro. In this game, player S can choose his
preferred outcome. In other words, the occurrence of the two possible outcomes is
determined by player S.
Before the game really starts, you play the role of dictator, which means you are the
only player who has right to decide whether to play the game or not. Player S is
merely a recipient and can do nothing but follow your decision.
Option A: You would like to play the game. Thus your payoff will be either 100 euro
or 25 euro. Player S’s payoff will be either 100 euro or 175 euro. Both of yours
exactly payoffs are determined by player S.
Option B: You prefer not to play this game. You can quit immediately and earn 50
euro participation fee. Player S has to follow your decision and quit this game as well.
He can also receive 50 euro as participation fee.

42
The probability that player S would choose ‘Good outcome’ under option A is P.
Please indicate how large should the P at least be for you to pick option A over option
B (Example: if the probability of a good outcome is 0.1 in this game, you are willing
to pick option A).
Trust Not Trust
Game 3
Option A Option B
You: 25 euro
S: 175 euro
You: 100 euro
S: 100 euro
You: 50 euro
S: 50 euro
Honor Trust Betrayal
P =

43
Appendix 1 Trustworthy characteristics
Given following personal characteristic options, please indicate which of them would
increase your trust on strangers? Or, which of them would increase your possibility to
choose option A under game III.
Age:
□younger than 35 □between 35 to 60 □older than 60
Gender:
□Male □Female
Ethnic group:
□African □Asian □Caucasian □Latino
Education level:
□senior high school □undergraduate and above □graduate and above
□PhD and above
Study specialty
□economics □business management law mathematics
□medical science psychology art engineering
Wealth level on a scale from 1 to 5:
1--------2--------3--------4--------5
Poor--------------------------------Rich

44
Appendix 2 Personal Information
Please fill in your personal information below.
What is your age?
What is your gender?
□Male □Female
Which ethnic group do you belong to?
□African □Asian □Caucasian □Latino
What is your education level?
□vocational school □undergraduate □graduate □PhD
What is your study specialty?
□economics □business management law mathematics
□medical science psychology art engineering
Please indicate your wealth level on a scale from 1 to 5:
1--------2--------3--------4--------5
Poor--------------------------------Rich

45
Bibliography
Adam, R., van Loon, J., 2000. Introduction: Repositioning risk:the challenge for
social theory. In The risk society and beyond: critical issues for social theory. 1-32.
Ashraf, N., Bohnet, I., Piankov, N., 2003. Is trust a bad investment? Working paper,
Kennedy School of Government, Harvard University.
Baier, A., 1986. Trust and Antitrust. Ethics 96, 231-260.
Bedford, T., Cooke, R., 2001. Probabilistic Risk Analysis: foundations and methods.
Cambridge university press. NJ.
Ben-Ner, A., Putterman, L., 2001. Trusting and trustworthiness. Boston University
Law Review 81, 523–551.
Bohnet, I., Zeckhauser, R., 2004. Trust, risk and betrayal. Journal of Economic
Behavior and Organization 55, 467–484.
Bradbury, J. A., 1989. The use of social science knowledge in implementing the
nuclear waste policy Act. Ph.D.diss., Graduate School of Public and International
Affairs, University of Pittsburgh.
Cook, K.S., Cooper, R.M., 2003. Experimental studies of cooperation, trust, and
social exchange. In: Ostrom, E.
Croson, R., Buchan, N., 1999. Gender and Culture: international experimental
evidence from trust games. The American Economic Review, 89. 386-391.
Currall, S. C., & Judge, T. A. (1995). Measuring trust between organizational
boundary role persons. Organizational Behavior and Human Decision Processes, 64,
151--170.
Das,T.K.,Teng,B.S., 2004. The risk-based view of trust: a conceptual framework.
Journal of Business and Psychology 19. 85-116.
Dohmen, T., Falk, A., Huffman, D., Sunde, U., Schupp, J., Wagner, G., 2005.
Individual Risk Attitude: new evidence from a large, representative,
experimentally-validated survey. Masstricht Universty of Business and Economics.
Eckel, C.C.,Wilson, R.K., 2004. Is trust a risky decision? Journal of Economic
Behavior and Organization 55 (4), 447–465.
Eckel, C.C.,Wilson, R.K., 2003. Conditional trust: sex, race and facial expressions in

46
a trust game.Working paper.
Eckel, C.C., & Grossman, P.J. (1998). Are Women Less Selfish than
Men? Evidence from Dictator Experiments. Economic Journal, 108(448), 726-735.
Frank, R.H., Regan, D.T., 1993. Does studying economics inhibit cooperation?
Journal of Economics Perspectives 7, 159-171.
Gambetta, D., 1988. Can we trust trust? In Trust: Making and Breaking Cooperative
Relations. 213-237.
Hardin, R., 2002. Trust and Trustworthiness. Russell Sage, New York.
Hillson,D., Webster, R.M., 2007. Understanding and Managing Risk Attitude.
Gower Publishing.
Keynes, John Maynard. 1921. A Treatise on Probability. London: Macmillan.
Knight, Frank H. 1921. Risk, Uncertainty and Profit. New York: Hart, Schaffner and
Marx.
Leroi E., Bonnard C., Fell R., Mc Innes R., 2005. State of the art paper: Risk
assessment and management, International Conference on Landslide Risk
Management, Vancouver, Canada
Luhmann, Niklas (1979) Trust and Power. Chichester: John Wiley.
Luhmann, N., 1988. Familiarity, Confidence, Trust: Problems and Alternatives. In
Trust: Making and Breaking Cooperative Relations. Chapter 6. 94-107.
.
Mayer,R.C., 1995. An integrative model of organizational trust. Academy of
Management Review, 20. 709—734.
Nickel, P.J., Vaesen, K., 2012. Risk and trust. In S. Roeser, R. Hillerbrand, P. Sandin
& M. Peterson (Eds.), Handbook of risk theory : epistemology, decision theory,
ethics and social implications of risk (pp. 857-876). Berlin: Springer.
Slovic, P., 1987. Perception of risk. Science 236(4799): 280–285.
Smith TW. 1997. Factors relating to misanthropy in contemporary American society.
Soc. Sci. Res. 26:170–96
Snijders, C., Keren, G., 1998. Determinants of trust. In: Budescu, D.V., Erev, I.
Zwick, R. (Eds.), Games and Human Behavior: Essays in Honor of Amnon Rapoport.
Lawrence Erlbaum, Mahwah, NJ, pp. 355–385.

47
Snijders, C., 2001. Do you trust? Whom do you trust? When do you trust? In: S.R.
Thye, E.J. Lawler, M.W. Macy and H.A. Walker (2001, eds.), Advances in Group
Processes 18. Amsterdam: JAI, Elsevier Science, pages 129-160.
Sztompka, P., 1999. Trust: A sociological theory. Cambridge University Press,
Cambridge, NJ.
Stenman, O.J., Martinsson, P., Mahmud, M., 2005. Does stake size matter in trust
games? Economics Letters 88, 365-369.
Tripp, T. M., & Sondak, H. (1992). An evaluation of dependent variables in
experimental negotiation studies: Impasse rates and Pareto efficiency. Organizational
Behavior and Human Decision Processes, 51, 273-295.
Uslaner EM. 2002. The Moral Foundations of Trust. Cambridge, UK: Cambridge
Univ. Press
Walker, J. (Eds.), Trust and Reciprocity. Russell Sage, New York, pp. 209–244.
Coleman, J. S. (1990). The foundations of social theory. Cambridge, MA: Harvard
University Press.
Williamson, O.E. 1993. Calculativeness, trust, and economics organization. Journal
of Law and Economics 36, 453-486.