Is the Corporate Governance of LBOs E ective? · Is the Corporate Governance of LBOs E ective?...
41
Is the Corporate Governance of LBOs Effective? * Francesca Cornelli (London Business School and CEPR) O ˜ guzhan Karakas ¸ (Boston College) This Version: May, 2010 * Correspondence: Oguzhan Karakas, Finance Department - Fulton 324A, Boston College, 140 Com- monwealth Avenue, Chestnut Hill, MA 02467, U.S.A. — Tel.: +1-617-552-1175 — e-mail address: [email protected]. 1
Transcript of Is the Corporate Governance of LBOs E ective? · Is the Corporate Governance of LBOs E ective?...

Is the Corporate Governance of LBOs Effective?∗
Francesca Cornelli(London Business School and CEPR)
Oguzhan Karakas(Boston College)
This Version: May, 2010
∗ Correspondence: Oguzhan Karakas, Finance Department - Fulton 324A, Boston College, 140 Com-monwealth Avenue, Chestnut Hill, MA 02467, U.S.A. — Tel.: +1-617-552-1175 — e-mail address:[email protected].
1

1 Introduction
When looking at the performance of private equity in recent years two possible explana-tions have been given. The first one is that the private equity model is superior from thecorporate governance point of view, as private equity concentrates the ownership in thehands of few shareholders. Since these shareholders are also involved in running the com-pany operations, they have strong incentives to maximize the value of the firm. In addition,private equity partners often have a long experience in restructuring companies, and thustheir advice can be very useful. As Sir David Walker states in his July 2007 Consultationdocument, “. . . alignment [of interests] is achieved in private equity through control exercisedby the general partner over the appointment of the executive and in setting and overseeingimplementation of the strategy of a portfolio company. Lines of communications are shortand direct, with effectively no layers to insulate or dilute conductivity between the generalpartner and the portfolio company executive team.” The second rationale is instead less flat-tering: the success has been attributed to financial engineering, to the ability to raise veryhigh levels of leverage paying relatively low interests, or to be able to acquire companies at aprice lower than it would have been fair. Kaplan and Stromberg (2009) talk about “financialengineering” versus “operating” and “corporate governance” engineering.
The aim of this paper is to look at one of the most important type of private equitydeals, the leveraged buy-outs (LBOs), to see if the corporate governance is at least in partresponsible for the success of private equity. In particular, we focus on the boards of theseLBOs, since the literature on corporate governance has long stressed the role of boards inmonitoring and providing advice to management. In a similar spirit, Lerner (1995) showsthat venture capitalists sit on the board of the companies they have invested in, and theirpresence on the board increases when their support is particularly valuable. We studywhether this is the case also for leveraged buyouts: i.e. the active involvement of the privateequity sponsors takes place through participation in the board, and such involvement ishigher the higher is the need for monitoring and/or advising.
So far, there has been limited empirical evidence about private equity boards, since theprivate nature of the companies implies that much less information is publicly available.Are these boards dramatically different from the boards of public companies? Are they justnominal boards, with no relevance for the restructuring of the company? Or do they servean important supervisory and advisory role in the restructuring process?
One could also look at the results in this paper and read them in the opposite direction.If one were convinced that the successful performance of many private equity investmentsis due to their superior ability of running a business and reduced conflict of interests, thenby looking at the characteristics of LBO boards we can have further evidence about whatmakes a board effective. Similarly, Kaplan and Gertner (1996) look at the boards of reverseLBOs to learn more about positive characteristics of a board.
In this paper, we have constructed a new data set, which follows the board compositionof all public to private transactions that took place in the UK between 1998 and 2003. Out
2

of 142 such transactions, 88 were sponsored by at least one private equity fund. We canthus look first at the change in the size and composition of the board when the companybecame private and second at any subsequent board and CEO change throughout the periodin which the private equity fund was still involved. We find that when the company goesprivate fundamental shifts in the board size and composition take place. The board sizedecreases and the presence of outside directors is drastically reduced, as they are replacedby individuals employed by the private equity sponsors.
We look at the presence on the board by representatives of the private equity firm andinterpret a larger presence as a sign of the private equity intention to be involved (whichwe interpret as a sign of their willingness to use corporate governance). To see whetherprivate equity companies are more involved when there is more need of their expertise, wehave to identify which cases need more such expertise. The most important way in which wedo so is by identifying presumably more difficult deals by looking at deals where the CEOchanges when the company is taken private. There are three possible reasons why these arethe difficult deals. First, these were cases where the management team performance wasmost unsatisfactory and a larger overhaul of the company may be necessary.1 Second, evenif the departure of the CEO was completely voluntary, one could also argue that losing aCEO who is most familiar with the business could constitute a significant challenge to asuccessful restructuring of the company. Third, these could be the deals where the privateequity investors objective is to restructure the company taken private, while the deals wherethe CEO was not changed are the ones where the private equity investors plan to rely mainlyon financial engineering. We find that if there is a CEO change the board size decreases lesswhen the company is taken private, the private equity sponsor representation on the boardis larger and the fraction of management on the board is smaller. This suggests that in thesepresumably more difficult cases the private equity sponsor is more actively involved and itspresence on the board is larger.
Another way to identify the difficult deals is to look at the deals which were not exitedwithin five years (or that went bankrupt after the LBO). Obviously, ex post these turned outto be the most difficult companies to restructure. If the expectation of the private equitysponsor at the beginning is on average correct, one would assume that on average the privateequity firm had anticipated these deals to be the most difficult. We find that the privateequity presence on the board, immediately after the company went private, is larger fordeals that take longer to exit. Finally we look at companies that had a larger proportion ofoutsiders sitting on the board while still public, as a signal that these companies are moredifficult companies in general to run. The literature on boards has used this measure as aproxy for the complexity of the company. We find that these companies also have a largerpresence of private equity sponsors sitting on the board after the LBO.
The board size and presence of LBO sponsors on the board may also depend on the“style” or preferences of the private equity firm. We find a smaller decrease in size when theprivate equity firm backing the LBO has a larger experience. We also find that if more than
1Looking at the statements around the time of transition this seems to be what happened in most cases.
3

one private equity firm is sponsoring the deal, then the board size decrease is smaller andthe proportion of LBO sponsors on the board is larger, presumably because each sponsorwants to have a representative on board.
Therefore, the evidence shows that in more difficult cases, when extra management sup-port or monitoring is needed, boards are larger and the LBO sponsors are more likely to siton it. This suggests that in the private equity deals the board is central to the restructuringprocess and for the relation between management and shareholders (i.e. the private equityfirms). Individuals on the board can help the restructuring process, but since those withmanagement experience and ability to help in this process are a scarce resource, they areadded to the board only if the additional benefit of their presence is significant (which islikely to be only in the most difficult deals).
After looking at the changes in the board when the company goes private, we focus onwhat happens to the board between then and when the deal is exited, i.e. while the privateequity sponsors are restructuring the company. In particular, we focus on the CEO turnoverduring this period. The CEO turnover has been very much studied in the corporate gover-nance literature, as a low turnover may be indicative of a captive (or inattentive) board. Onthe other hand, private equity companies often claim that, despite their active involvementand monitoring (or rather as a consequence of them), one of their advantages is that theygive management a longer term horizon and allow them to focus on the restructuring processand not on the short-term results.2
We find that CEO turnover is significantly lower when the company becomes private, andsignificantly lower than the turnover in similar (matched) public companies. In particular,the turnover is lower in LBOs where the CEO of the public company remained in chargeafter the LBO. This can be explained in two ways: either these are the easiest companiesto restructure (since the CEOs who were not changed have typically already shown theirhigh quality and have inside knowledge about the company) and therefore where monitoringand intervention by the private equity sponsors is less important; or these are the LBOswhere the private equity sponsors are relying only on financial engineering and thus haveno intention to intervene. In both cases, however, the message is that when there is theneed for the private equity company expertise their presence on the board is larger and theirintervention is felt.
The problem with studying whether a private equity sponsor who is more present on theboard is more likely to intervene is that there could be a reverse causality story. Therefore,we conduct a 2SLS analysis of what determines a change in the CEO turnover after thecompany has gone private. Since the dependent variable is the change in CEO turnover, thepercentage of outsiders sitting on the board before the LBO, as a proxy for the complexityof the firm, should affect the presence of private equity sponsors on the board, but shouldnot directly affect the change in the CEO turnover. We therefore use it as an instrumentalvariable and we find that the level of involvement of the LBO sponsors (as captured by theirpresence on the board) decreases the CEO turnover, while the fact that there was a CEO
2See, for example, Rogers, Holland and Haas (2002).
4
change when the company was taken private implies a higher turnover. This suggests that amore difficult LBO will lead to higher turnover, but a high level of involvement, and thus ofmonitoring, does not necessarily imply a higher CEO turnover. This supports the claim byprivate equity that they have a longer term horizon and at the same time puts in question theuse in the corporate governance literature of CEO turnover as a sign of an effective board.
We also find that board turnover is unusually high in private equity firms, whether wecompare it to the turnover of the same companies before the LBO, to the turnover of com-panies that went private through an MBO, or to the turnover of matched public companies.This however is at least in part due to the turnover of the LBO sponsors themselves.
Finally, we look at the operating performance of these LBOs. The results are weakenedby the difficulty in having this type of information, which reduces the number of observations.However, we do find some evidence that the deals where the CEO was changed during thetransition to private have a higher operating performance and a larger private equity presenceon the board leads to higher operating performance. This evidence is consistent with the ideathat the higher private equity sponsors involvement ultimately leads to better performance.It is also somewhat consistent with the idea that the cases where the CEO was not changedare not the best and easiest restructuring deals, but rather the ones where the private equitybacker intends to rely mainly on financial engineering.
In the discussion of our results, we will often refer to the results of the existing literatureon public company boards. This literature so far has focused on whether certain boardcharacteristics make a board more effective in its supervisory role, and whether this translatesinto improvements in company performance. For example, Weisbach (1988) shows that CEOare more likely to be fired when prior performance is not satisfactory if there are more outsidedirectors on the board. The presence of outsiders is thus crucial in ensuring that the boarddoes not collude with the management and thus become useless as a monitor. Similarly, ithas been suggested (see for example, Jensen 1993) that larger boards may be less effectivethan smaller ones. Yermack (1996) finds that larger boards are associated with a lowerTobin’s Q (i.e. worse performance).
Other studies have looked at what factors might determine the characteristics of theboard. Boone, Casares Field, Karpoff and Raheja (2007) track the evolution of the boardof public companies from their IPO until 10 years later, and find that board independence(measured by the proportion of outside directors) decreases when the manager has moreinfluence. Coles, Daniel and Naveen (2007) show that complex firms, which have a greaterneed for advisors, have larger boards with more outside directors. Linck, Netter and Yang(2007) look at public companies and find that firms structure their boards in ways consistentwith the costs and benefits of the monitoring and advisory roles of the board. We will alsoshow that this trade-off of costs and benefits of monitoring is present in the context ofprivate equity firms, and argue that it is easier for private equity firms to identify the costof allocating one more experienced individual to one board. Some papers (see, for example,Adams 1998) also stress the fact that the board does not only have a monitoring role,but also has an advisory role. Following on this idea, Adams and Ferreira (2007) argue that
5
management-friendly boards can be optimal when the advisory role is particularly important.This view may also help to shed some light on private equity boards.
While the focus of this paper is many the corporate governance of LBOs and the involve-ment of the private equity partners in the firm, we also look at the financial performance,and we find results in line with the rest of the literature. Acharya, Hahn and Kehoe (2010)analyse a sample of 110 private equity transactions in Western Europe from 14 large andmature PE houses. They distinguish between “organic” deals, focused on internal valuecreation, and ”inorganic” deals, with an M&A focus. They find that general partners withan operational background generate higher performance in organic deal and general partnerswith a finance background generate higher performance in inorganic deal. This evidence isconsistent with the evidence in this paper about the importance of PE sponsors involvement.Finally, Guo, Hothchkiss and Song (2010) study LBOs in US between 1990 and 2006 andfind that gains in operating performance are higher for deals where the CEO was replaced.
The rest of the paper is structured as follows. The next section explains how we con-structed the data set, and give a general description of the data. Section 3 studies how theboard changes when the company becomes private. Section 4 looks at the presence of theprivate equity sponsors and Section 5 studies the CEO turnover. Section 6 looks at operatingperformance, Section 7 at board turnover and Section 8 concludes.
2 Description of the data
Using Capital IQ we identified all public to private transactions that took place in UK fromJanuary 1998 until October 2003. We identified 148 transactions, but had to drop 6 cases,because of the lack of data for those specific cases. We were then left with 142 deals, whichwere divided into the following 3 groups. For 88 of the public to private transactions, atleast one of the sponsors is a financial institution, that has invested in the equity of thecompany.3 These cases are thus categorized as “proper LBOs” or “private equity deals”,and will constitute the main focus of the analysis. 42 of the remaining cases are puremanagement buyouts; there is no private equity fund involved and therefore they cannot beclassified as private equity deals. Nonetheless, in what follows we will also look at these casesand compare them to the private equity deals. This will allow us to isolate effects that maybe due purely to the change in the corporation status from public to private, and those thatare associated with the presence of a private equity group. Finally, there are 12 cases whichare not pure management buyouts, but where the investor is not a financial sponsor or, morespecifically, a professional private equity fund: it could be a wealthy individual or a company.We will call them “other transactions”. In most of the analysis we will analyze these last12 transactions together with the 42 management buyouts as a unique group, which will becompared to the private equity deals. However, we have also computed all the tables of the
3For one of these 88 buyouts we could only find the board before the company went private, but notafterwards. Therefore, this company will be dropped from the analysis of changes in the boards when thecompanies are taken private.
6

paper using only the 42 pure management buyouts as a comparison to the private equitydeals, and we have found no major difference.
Figure 1 shows the distribution of the deals over the years. Notice that in the first coupleof years (i.e. 1998-1999) there are almost only private equity backed LBOs, while in lateryears management buyouts and other transactions become a substantial fraction of the deals.
From Capital IQ we also identified the total value of the company implied by the pricepaid to take the company private. In Table 1 we present summary statistics for the companysize.4 Moreover, in Figure 2 we show the distribution of the company size for LBOs, MBOsand other transactions. LBOs are in general larger in size than MBOs: their mean is $328Mversus $55M for MBOs. In general, private equity companies, thanks to their ability to raisehigh level of debt, are able to acquire larger companies. The 12 other transactions also havea large average, but that is mainly driven by one very large outlier which has a value largerthan $7B. If we drop that outlier, they are not significantly different in size from the MBOs.LBOs also have two large outliers but the mean remains significantly larger than the MBOs’one even after dropping those two outliers.
We identified which of 142 deals were exited and the way in which they were exited usingCapital IQ and information from the press. Then, using the data set Dash, we tracked theboard composition of these companies from two or three years before the announcement ofthe buyout until the exit of the private equity group or until 2008, whichever was later.5
We encountered several challenges when creating this time series. Once the company wastaken private, a complex ownership structure was created, with several layers of companies.Therefore, it was not clear any more which company housed the relevant board. For example,the board of the company which was originally taken private could become a very small boardof two people (the CEO and another member of management), but at the same time a newcompany was created, which owned the original one and whose board was the one making allthe important decisions. In other cases, several layers of companies were created, each oneowning the company below (or there were more complex ownership structures, not simplyvertical) and the board that took the relevant decision was not housed in the company thatwas the direct owner of the original one, but two or three layers above that. Moreover, thisstructure could change over the years of the LBO, and therefore the relevant board couldbe housed in different companies over time. In order to identify which board to observe,we had to proceed in the following manner. First, we used the data sets Dash, Fame andAmadeus to reconstruct the post-LBO ownership structure of the various companies andtheir subsidiaries. Then, we downloaded the compositions of the boards of each of thesecompanies, in order to identify the relevant board. To identify the relevant board a certain
4Information was missing on the implied company value for two MBOs, and therefore those two are notin Table 1.
5An exit takes place when the private equity sponsor (or the management that took it private in an MBO)sells its stake in the company, or when the company goes bankrupt. In some cases, there is an IPO, but theprivate equity firms retain a stake in the firm. We consider these cases exits because, although the sponsorhas not sold its entire equity stake, the company is not anymore a private company, but has returned to bea public company. Secondary buyouts are also considered exits.
7
degree of discretion had to be exercised. We took into account the hierarchical ownershipstructure and then looked at various aspects, for example whether an outside director wassitting on the board, or how large the board was.6 We also looked at whether some privateequity general partner was sitting on the board, since they tended to be reported only in therelevant board and in none of the other boards, while a subset of the management directorswas reported in all the other boards. This was repeated for each year, since the relevantboard was not necessarily in the same company through the entire time period (althoughin most cases it was). We went through several iterations, until we felt comfortable withthe choice of the company and its board. In cases where there was uncertainty about whichboard was the relevant one, we considered more than one board and also conducted theanalysis with the alternative boards.
In order to conduct our analysis, we also had to identify the year before and after thecompany was taken private. We proceeded in the following way. From Capital IQ weknew the announcement date of the transaction. Since we only observe the board onceper year at fixed dates, the date in which we observe the board could be very close to theannouncement date, or almost a year afterwards. Therefore, we started by looking at thedirectors of the first board observed after the announcement date and the last board beforethe announcement date. By comparing these boards and the identities of the directors, wecould determine whether the first board after the announcement date was still the board ofthe public company (i.e. the transition to private company had not been completed yet) orit was already the board of the private company. In some cases, however, the board on thefirst date after the announcement was still a “transitional” board (especially when the boarddate was close to the announcement date). For example, immediately after the transaction,not all new board members had been nominated to the board. In some cases, the CEOwas only present in the second board following the transaction, since at the time of the firstboard the CEO had not yet been assigned. For this reason, the analysis in Section 3 hasbeen conducted comparing the characteristics of the board prior to the announcement to thesecond board after the announcement date, instead of the first date.7
For each director, the data report the date of birth and country of residence. The dataalso provides information on how many other boards the director was also involved in (sincethe Dash data set which reports the board starts in 1996, two years before the first LBO inthe data set, we also collected how many directorships the director had before 1996, althoughwe do not have that information year by year). The data also includes information on whichindustries (SIC code) the companies belong to, the number of employees they have, and theirturnover. From Capital IQ we can also determine which private equity funds were involvedin each leveraged buyout. Finally, using Capital IQ and press coverage we could find howmany deals had been exited and what type of exit they had. 56 of the 142 deals were notexited as of December 2007: of these deals, 37 were pure MBOs (which are less likely to be
6As mentioned above, some boards were obviously only nominal boards and had only two or three peoplewho were also in what we finally identified as the relevant board, so some boards were easy to rule out asthe relevant ones.
7We have conducted the same analysis by taking the first board afterwards, or the board two years beforegoing private or any combination of these cases, and the results do not change.
8

exited anyway) and 19 were LBOs.8 Among all the exited deals, 25 were secondary buyouts,11 IPOs, 1 MBOs, 32 trade sales, 15 bankruptcies and 2 exits of an unknown type.
Finally, we looked for the identity of all the directors sitting in the boards each year.We did this using a series of data sets (Capital IQ, Fame, Amadeus, Perfect Informationand a general search in press releases) and divided the directors in the following categories:CEO, management, other non-management insiders (including previous CEOs), outsiders,and LBO sponsors. Outside directors are directors who neither work for the firm nor forany of the private equity groups backing the LBO, and who have no other obvious specialrelationship to the firm. A director can be classified as an LBO sponsor only after theLBO. This category identifies whether the director is employed by one of the private equityfunds that are backing the LBO. For all other directors (also the ones involved in the boardbefore the LBO) we identify those who have some past or present connection to any privateequity group.9 We also identify the outside directors who are or have been CEOs in othercompanies.
3 Changes in the board following an LBO or an MBO
In this section we show what changes in size and composition occur in the board whenthe company is taken private. The purpose of this is twofold. The main objective is todocument that when the company goes private the board changes dramatically. We comparethe change of boards of company taken private witha private equity backing (LBOs) to thechanges taking place in MBOs, in order to distinguish the changes that are due to the factthat the company is now private and the changes due to the fact that the company is privateequity backed.
A second objective raises from the fact that the existing literature on public firms arguesthat some board characteristics are associated with better management incentives and thuswith better firm performance. Given that private equity groups aim to improve firm per-formance, one may wonder whether this improved performance is achieved by changing thecharacteristics of the board.
In Table 2, Panel A, we first compare the size of the boards of companies that underwentan LBO to the size of boards of companies that underwent an MBO or other types oftransactions.10 In the year before the companies were taken private there is no significantdifference in the size of the boards of the two types of companies (both have approximately 6.5directors). We also checked whether in these boards, before an MBO or an LBO, there wasan outside director with a connection to private equity, since we expected that there would
8Naturally, the most recent deals were less likely to be exited because there has not been enough time,still if one considers only the LBOs that had been announced by the end of 2000, 9 have not yet been exited.
9For example, they sit or have sat on the board of a private equity group, or they have taken part in thepast in an LBO sponsored by a private equity group, may be as management.
10We have also compared changes in the board size of LBOs and pure MBOs only, with no difference inthe results.
9

have been more people with such connections in companies that subsequently underwent anLBO. We find that in 44% of the LBOs there was a director with such a connection (beforethe LBO), while only in 26% of the non-LBO cases there was such connection (the differenceis statistically significant).
Looking at the boards after the companies have been taken private, one can see thatcompanies that undertook an MBO have a significantly smaller board than for LBOs (4.2versus 5.4 people). On average, MBOs lose 2 directors out of 6, i.e. they are 30% smaller,while LBOs lose 1 director out of 6.5, i.e. they are 15% smaller. The difference betweenMBOs and LBOs sizes and changes in size, however, could be due to the fact that LBOtransactions are on average larger than MBOs (in terms of implied enterprise value, asshown in Table 1 and Figure 2), and we know that on average larger companies have largerboards (at least in public companies). Therefore, we construct a size-matched sample of 39MBOs and 39 LBOs and in Panel B we conduct the same analysis as in Panel A but forthe matched companies only. As before, we find that before being taken private there is nosignificant difference in size between LBOs and MBOs. However, we now also find that thereis no significant difference between LBOs and MBOs after the private equity transaction.The drop in the board size when the company goes private is also not significantly differentfor LBOs and MBOs. In other words, once we take into account the size of the company,there is a considerable drop in the size of the board in both cases.
The decrease in board size is consistent with the existing literature about boards ofpublic companies, which suggests that board sizes are correlated with company performance.The movement to smaller boards is thus consistent with a move towards better corporategovernance. This is also consistent with Kaplan and Gertner (1996) who look at boards ofreverse LBOs (after they went public) and find that reverse LBOs have smaller boards thanthe other firms trading in the market, matched by size and industry.
We then look at the board composition. Figure 3 presents charts with the compositionof the board before and after going private for LBOs, MBOs and other transactions. Tobegin with, note that members of the private equity groups actively sit on the board of firmsthat have undergone LBOs: the percentage of LBO sponsors sitting on the board after anLBO is 33%. This is consistent with the fact that private equity firms are active investors.Figure 3 shows that before being taken private MBOs have a larger proportion of insidersand a smaller proportion of outsiders than both LBOs and other transactions. Insiders(defined as CEO, other management and other non-management insiders) make-up 62% ofthe board in MBOs, 56% in LBOs and 45% in the other transactions. For MBOs and LBOs,the proportion of outsiders drops dramatically after the company is taken private: 15%for MBOs and 11% for LBOs (note that in the case of MBOs we have highlighted outsidedirectors with a known private equity connection). Given the size of the board afterwards(5.4 for LBOs and 4.3 for all others), that means that in most of the companies there is nooutsider on the board.11
11In the other transactions the fraction of outsiders is more substantial, 35%, but this could be due to thefact that it is more difficult in this case to establish a connection with the insiders (since often the acquireris another company or a private individual) and therefore we may be overstating the fraction of outsiders.
10
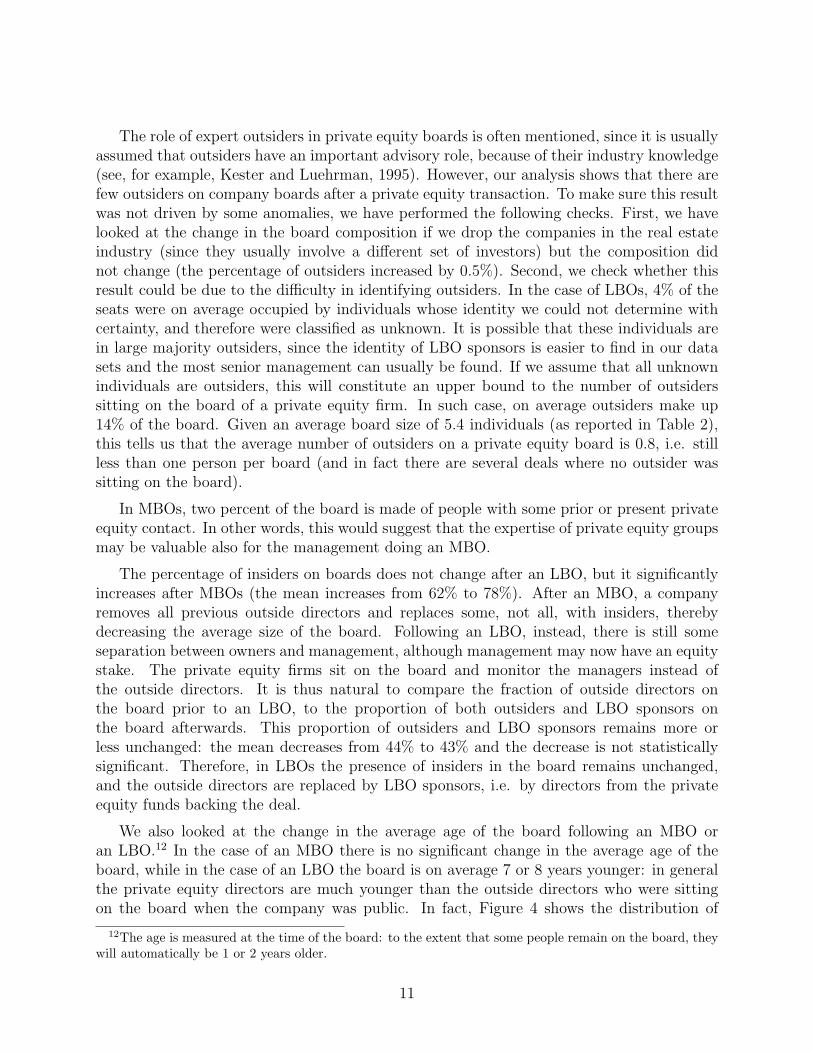
The role of expert outsiders in private equity boards is often mentioned, since it is usuallyassumed that outsiders have an important advisory role, because of their industry knowledge(see, for example, Kester and Luehrman, 1995). However, our analysis shows that there arefew outsiders on company boards after a private equity transaction. To make sure this resultwas not driven by some anomalies, we have performed the following checks. First, we havelooked at the change in the board composition if we drop the companies in the real estateindustry (since they usually involve a different set of investors) but the composition didnot change (the percentage of outsiders increased by 0.5%). Second, we check whether thisresult could be due to the difficulty in identifying outsiders. In the case of LBOs, 4% of theseats were on average occupied by individuals whose identity we could not determine withcertainty, and therefore were classified as unknown. It is possible that these individuals arein large majority outsiders, since the identity of LBO sponsors is easier to find in our datasets and the most senior management can usually be found. If we assume that all unknownindividuals are outsiders, this will constitute an upper bound to the number of outsiderssitting on the board of a private equity firm. In such case, on average outsiders make up14% of the board. Given an average board size of 5.4 individuals (as reported in Table 2),this tells us that the average number of outsiders on a private equity board is 0.8, i.e. stillless than one person per board (and in fact there are several deals where no outsider wassitting on the board).
In MBOs, two percent of the board is made of people with some prior or present privateequity contact. In other words, this would suggest that the expertise of private equity groupsmay be valuable also for the management doing an MBO.
The percentage of insiders on boards does not change after an LBO, but it significantlyincreases after MBOs (the mean increases from 62% to 78%). After an MBO, a companyremoves all previous outside directors and replaces some, not all, with insiders, therebydecreasing the average size of the board. Following an LBO, instead, there is still someseparation between owners and management, although management may now have an equitystake. The private equity firms sit on the board and monitor the managers instead ofthe outside directors. It is thus natural to compare the fraction of outside directors onthe board prior to an LBO, to the proportion of both outsiders and LBO sponsors onthe board afterwards. This proportion of outsiders and LBO sponsors remains more orless unchanged: the mean decreases from 44% to 43% and the decrease is not statisticallysignificant. Therefore, in LBOs the presence of insiders in the board remains unchanged,and the outside directors are replaced by LBO sponsors, i.e. by directors from the privateequity funds backing the deal.
We also looked at the change in the average age of the board following an MBO oran LBO.12 In the case of an MBO there is no significant change in the average age of theboard, while in the case of an LBO the board is on average 7 or 8 years younger: in generalthe private equity directors are much younger than the outside directors who were sittingon the board when the company was public. In fact, Figure 4 shows the distribution of
12The age is measured at the time of the board: to the extent that some people remain on the board, theywill automatically be 1 or 2 years older.
11
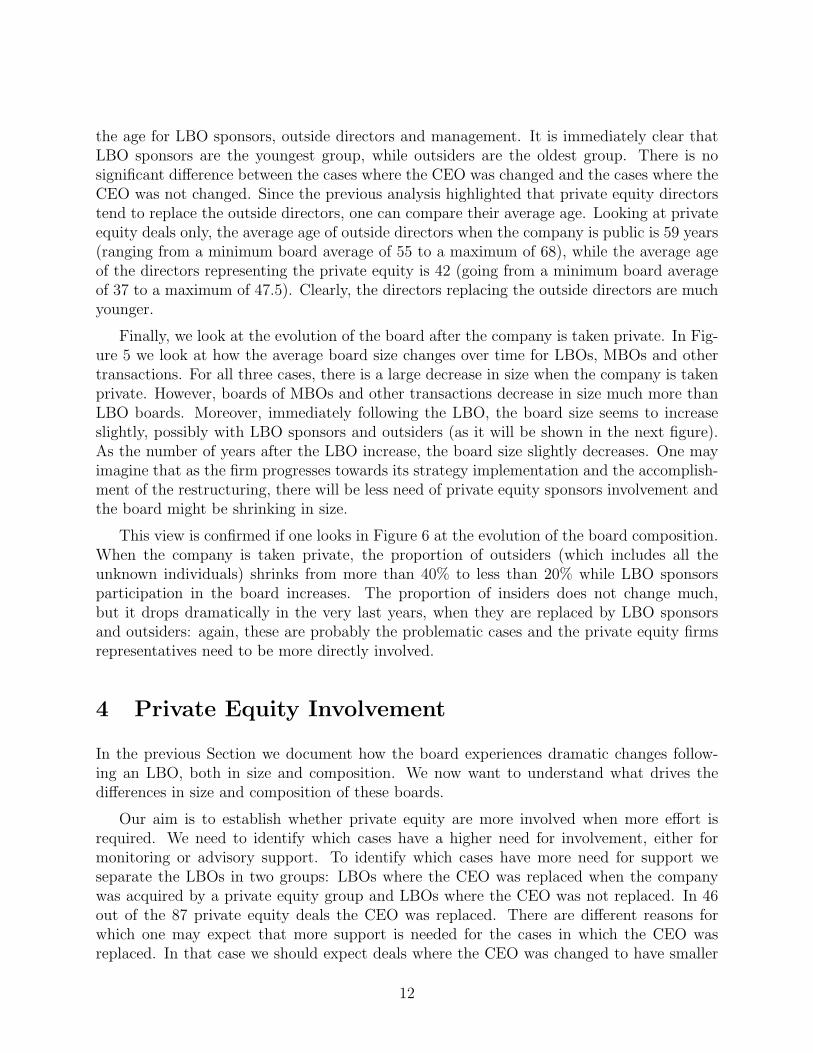
the age for LBO sponsors, outside directors and management. It is immediately clear thatLBO sponsors are the youngest group, while outsiders are the oldest group. There is nosignificant difference between the cases where the CEO was changed and the cases where theCEO was not changed. Since the previous analysis highlighted that private equity directorstend to replace the outside directors, one can compare their average age. Looking at privateequity deals only, the average age of outside directors when the company is public is 59 years(ranging from a minimum board average of 55 to a maximum of 68), while the average ageof the directors representing the private equity is 42 (going from a minimum board averageof 37 to a maximum of 47.5). Clearly, the directors replacing the outside directors are muchyounger.
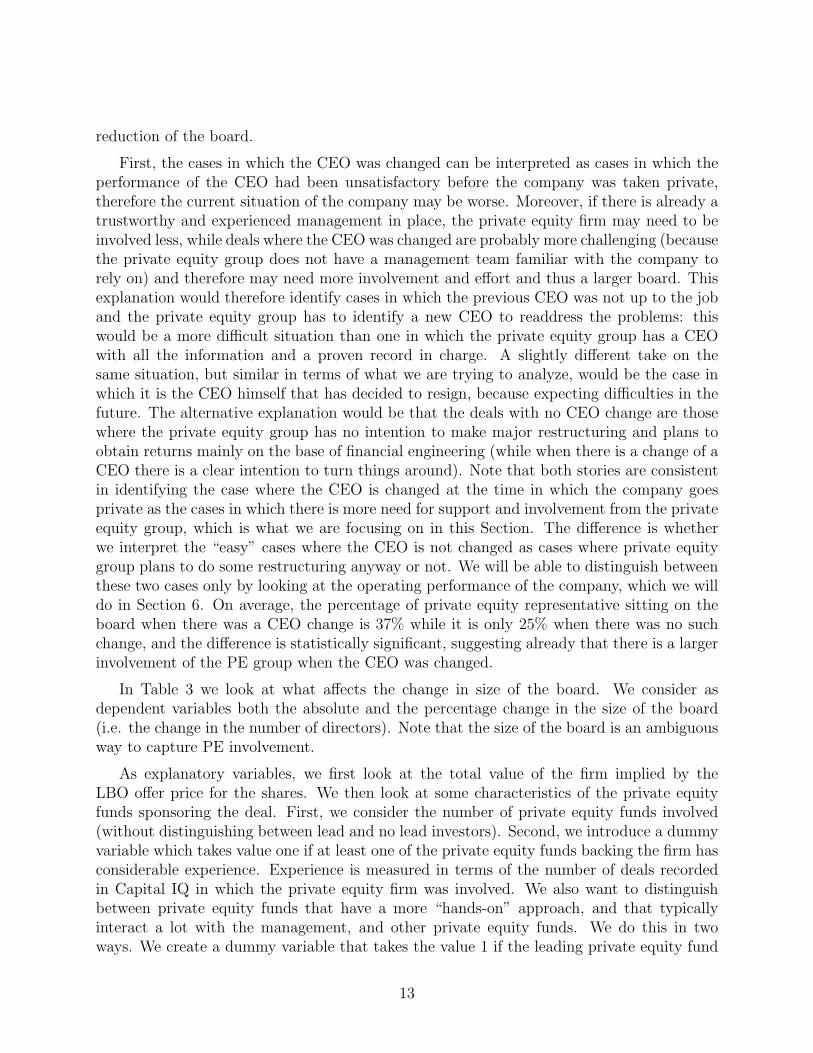
Finally, we look at the evolution of the board after the company is taken private. In Fig-ure 5 we look at how the average board size changes over time for LBOs, MBOs and othertransactions. For all three cases, there is a large decrease in size when the company is takenprivate. However, boards of MBOs and other transactions decrease in size much more thanLBO boards. Moreover, immediately following the LBO, the board size seems to increaseslightly, possibly with LBO sponsors and outsiders (as it will be shown in the next figure).As the number of years after the LBO increase, the board size slightly decreases. One mayimagine that as the firm progresses towards its strategy implementation and the accomplish-ment of the restructuring, there will be less need of private equity sponsors involvement andthe board might be shrinking in size.
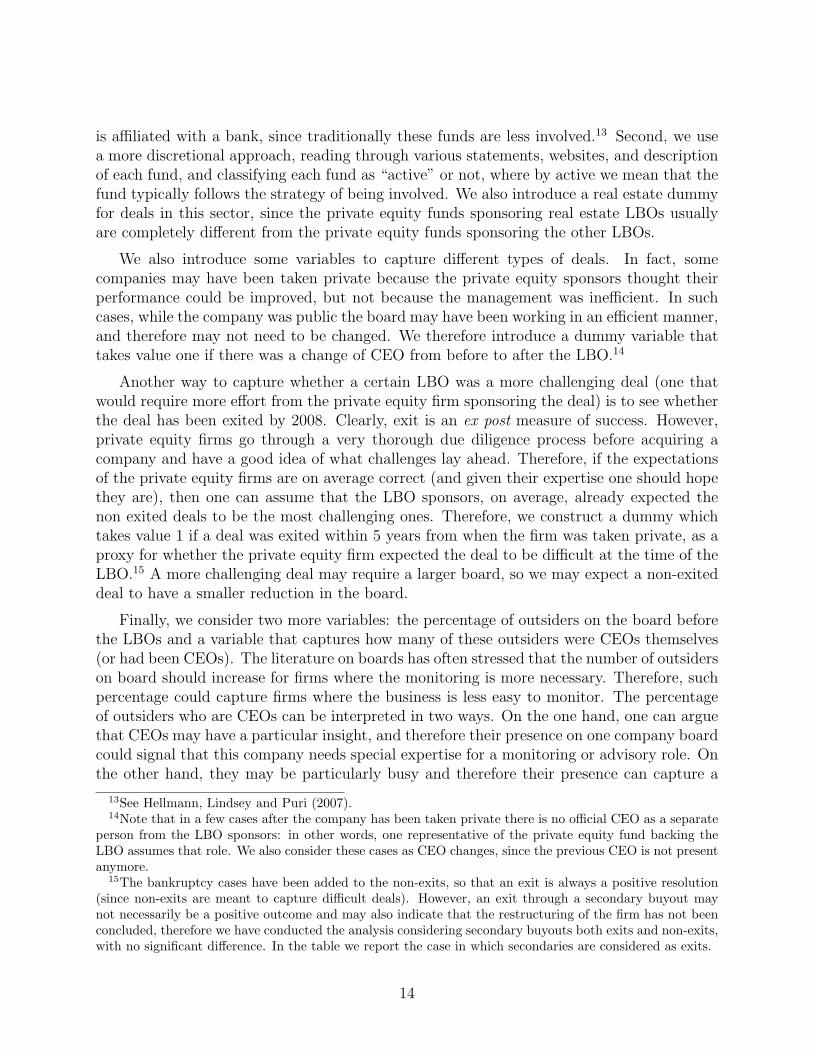
This view is confirmed if one looks in Figure 6 at the evolution of the board composition.When the company is taken private, the proportion of outsiders (which includes all theunknown individuals) shrinks from more than 40% to less than 20% while LBO sponsorsparticipation in the board increases. The proportion of insiders does not change much,but it drops dramatically in the very last years, when they are replaced by LBO sponsorsand outsiders: again, these are probably the problematic cases and the private equity firmsrepresentatives need to be more directly involved.
4 Private Equity Involvement
In the previous Section we document how the board experiences dramatic changes follow-ing an LBO, both in size and composition. We now want to understand what drives thedifferences in size and composition of these boards.
Our aim is to establish whether private equity are more involved when more effort isrequired. We need to identify which cases have a higher need for involvement, either formonitoring or advisory support. To identify which cases have more need for support weseparate the LBOs in two groups: LBOs where the CEO was replaced when the companywas acquired by a private equity group and LBOs where the CEO was not replaced. In 46out of the 87 private equity deals the CEO was replaced. There are different reasons forwhich one may expect that more support is needed for the cases in which the CEO wasreplaced. In that case we should expect deals where the CEO was changed to have smaller
12
reduction of the board.
First, the cases in which the CEO was changed can be interpreted as cases in which theperformance of the CEO had been unsatisfactory before the company was taken private,therefore the current situation of the company may be worse. Moreover, if there is already atrustworthy and experienced management in place, the private equity firm may need to beinvolved less, while deals where the CEO was changed are probably more challenging (becausethe private equity group does not have a management team familiar with the company torely on) and therefore may need more involvement and effort and thus a larger board. Thisexplanation would therefore identify cases in which the previous CEO was not up to the joband the private equity group has to identify a new CEO to readdress the problems: thiswould be a more difficult situation than one in which the private equity group has a CEOwith all the information and a proven record in charge. A slightly different take on thesame situation, but similar in terms of what we are trying to analyze, would be the case inwhich it is the CEO himself that has decided to resign, because expecting difficulties in thefuture. The alternative explanation would be that the deals with no CEO change are thosewhere the private equity group has no intention to make major restructuring and plans toobtain returns mainly on the base of financial engineering (while when there is a change of aCEO there is a clear intention to turn things around). Note that both stories are consistentin identifying the case where the CEO is changed at the time in which the company goesprivate as the cases in which there is more need for support and involvement from the privateequity group, which is what we are focusing on in this Section. The difference is whetherwe interpret the “easy” cases where the CEO is not changed as cases where private equitygroup plans to do some restructuring anyway or not. We will be able to distinguish betweenthese two cases only by looking at the operating performance of the company, which we willdo in Section 6. On average, the percentage of private equity representative sitting on theboard when there was a CEO change is 37% while it is only 25% when there was no suchchange, and the difference is statistically significant, suggesting already that there is a largerinvolvement of the PE group when the CEO was changed.
In Table 3 we look at what affects the change in size of the board. We consider asdependent variables both the absolute and the percentage change in the size of the board(i.e. the change in the number of directors). Note that the size of the board is an ambiguousway to capture PE involvement.
As explanatory variables, we first look at the total value of the firm implied by theLBO offer price for the shares. We then look at some characteristics of the private equityfunds sponsoring the deal. First, we consider the number of private equity funds involved(without distinguishing between lead and no lead investors). Second, we introduce a dummyvariable which takes value one if at least one of the private equity funds backing the firm hasconsiderable experience. Experience is measured in terms of the number of deals recordedin Capital IQ in which the private equity firm was involved. We also want to distinguishbetween private equity funds that have a more “hands-on” approach, and that typicallyinteract a lot with the management, and other private equity funds. We do this in twoways. We create a dummy variable that takes the value 1 if the leading private equity fund
13
is affiliated with a bank, since traditionally these funds are less involved.13 Second, we usea more discretional approach, reading through various statements, websites, and descriptionof each fund, and classifying each fund as “active” or not, where by active we mean that thefund typically follows the strategy of being involved. We also introduce a real estate dummyfor deals in this sector, since the private equity funds sponsoring real estate LBOs usuallyare completely different from the private equity funds sponsoring the other LBOs.
We also introduce some variables to capture different types of deals. In fact, somecompanies may have been taken private because the private equity sponsors thought theirperformance could be improved, but not because the management was inefficient. In suchcases, while the company was public the board may have been working in an efficient manner,and therefore may not need to be changed. We therefore introduce a dummy variable thattakes value one if there was a change of CEO from before to after the LBO.14
Another way to capture whether a certain LBO was a more challenging deal (one thatwould require more effort from the private equity firm sponsoring the deal) is to see whetherthe deal has been exited by 2008. Clearly, exit is an ex post measure of success. However,private equity firms go through a very thorough due diligence process before acquiring acompany and have a good idea of what challenges lay ahead. Therefore, if the expectationsof the private equity firms are on average correct (and given their expertise one should hopethey are), then one can assume that the LBO sponsors, on average, already expected thenon exited deals to be the most challenging ones. Therefore, we construct a dummy whichtakes value 1 if a deal was exited within 5 years from when the firm was taken private, as aproxy for whether the private equity firm expected the deal to be difficult at the time of theLBO.15 A more challenging deal may require a larger board, so we may expect a non-exiteddeal to have a smaller reduction in the board.
Finally, we consider two more variables: the percentage of outsiders on the board beforethe LBOs and a variable that captures how many of these outsiders were CEOs themselves(or had been CEOs). The literature on boards has often stressed that the number of outsiderson board should increase for firms where the monitoring is more necessary. Therefore, suchpercentage could capture firms where the business is less easy to monitor. The percentageof outsiders who are CEOs can be interpreted in two ways. On the one hand, one can arguethat CEOs may have a particular insight, and therefore their presence on one company boardcould signal that this company needs special expertise for a monitoring or advisory role. Onthe other hand, they may be particularly busy and therefore their presence can capture a
13See Hellmann, Lindsey and Puri (2007).14Note that in a few cases after the company has been taken private there is no official CEO as a separate
person from the LBO sponsors: in other words, one representative of the private equity fund backing theLBO assumes that role. We also consider these cases as CEO changes, since the previous CEO is not presentanymore.
15The bankruptcy cases have been added to the non-exits, so that an exit is always a positive resolution(since non-exits are meant to capture difficult deals). However, an exit through a secondary buyout maynot necessarily be a positive outcome and may also indicate that the restructuring of the firm has not beenconcluded, therefore we have conducted the analysis considering secondary buyouts both exits and non-exits,with no significant difference. In the table we report the case in which secondaries are considered as exits.
14

particularly ineffective board.
Looking at the results in Table 3, note first that the fact that the intercept in Regression1 and 2 is positive and significant confirms what we already showed before: on average,the board shrinks following an LBO. The results are not very different whether we look atthe absolute or percentage change of the board size. Deals where the CEO changed at thetime of the LBO have on average a smaller reduction in the board. This is consistent withthe view that they are more challenging deals and therefore there is a need for more LBOsponsors or outsiders on the board, as we will study in Table 4, where we look at the boardcomposition. Exited deals do not seem to have significantly different boards. The proportionof outsiders sitting in the board before the LBO is not significant. The coefficient of CEOs inthe previous boards is significant (only in Regression 1) but positive: in companies that hada larger number of CEOs as outsiders, the board shrinks more. Since this type of outsidersare more likely to be dropped when the company is taken private, one possible interpretationis that they are less effective than other outsiders.16 Finally, we see that more experiencedprivate equity firms reduce the size of the board less.
In Regression 3, we introduce the average size of the board before the LBO, whichhas a positive and significant coefficient.17 In this regression the coefficient of firm sizebecomes negative and significant. That means that larger boards tend to be reduced morein proportion, unless the large size of the board is due to the fact that the company islarge: in such case, the reduction is less strong (in fact, notice that the coefficient of firmsize is now negative and significant). This implies that boards that are more likely to havebeen inefficient—since they were very large even when the company was not particularlylarge—are reduced more drastically following an LBO.
In Table 4, we focus on the composition of the board and what affects it. The dependentvariables are: the percentage of LBO sponsors sitting on the board measured one year afterthe LBO, the average percentage of LBO sponsors from the LBO until exit (or 2008 if notexit has taken place), the percentage of insiders, the average percentage of insiders, thepercentage of outsiders, and the average percentage of outsiders. The explanatory variablesare the same as in Table 3. In addition, we create a dummy when the LBO sponsor is 3i,since this fund can be considered different because of its large size, government roots, andtraditional (though changing) reluctance to take a hands-on role.18
16For example, they may have been particularly busy, if they were still CEOs. More research could beconducted about this result, by looking in more detail at the identity of these individuals.
17Since there could be a collinearity problem of the average board size with the firm size (we know from theexisting literature on public companies that larger companies have larger boards) we have also run Regression3 introducing, in addition to firm size, also the squared firm size. The results do not change: the coefficientof average size of the board before the LBO does not change and the t-stat decreases from 3.7 to 3.4.
18See Lerner, Hardymon and Leamon (2002) and the HBS case “3i Group plc: May 2006” (HBS 9-807-006) for a description of the origins and evolution of 3i. The case mentions that in early times “3i . . . wouldprovide funding to an experienced management team . . . and relied on the operating team’s expertise inmanagement issues. One 3i executive might be responsible for 30 or 40 companies, a ratio that precludedclose involvement.” The case also argues that in more recent time 3i “began taking majority ownershippositions [and started] playing a more active role in managing its companies.” Yet the case also shows that
15
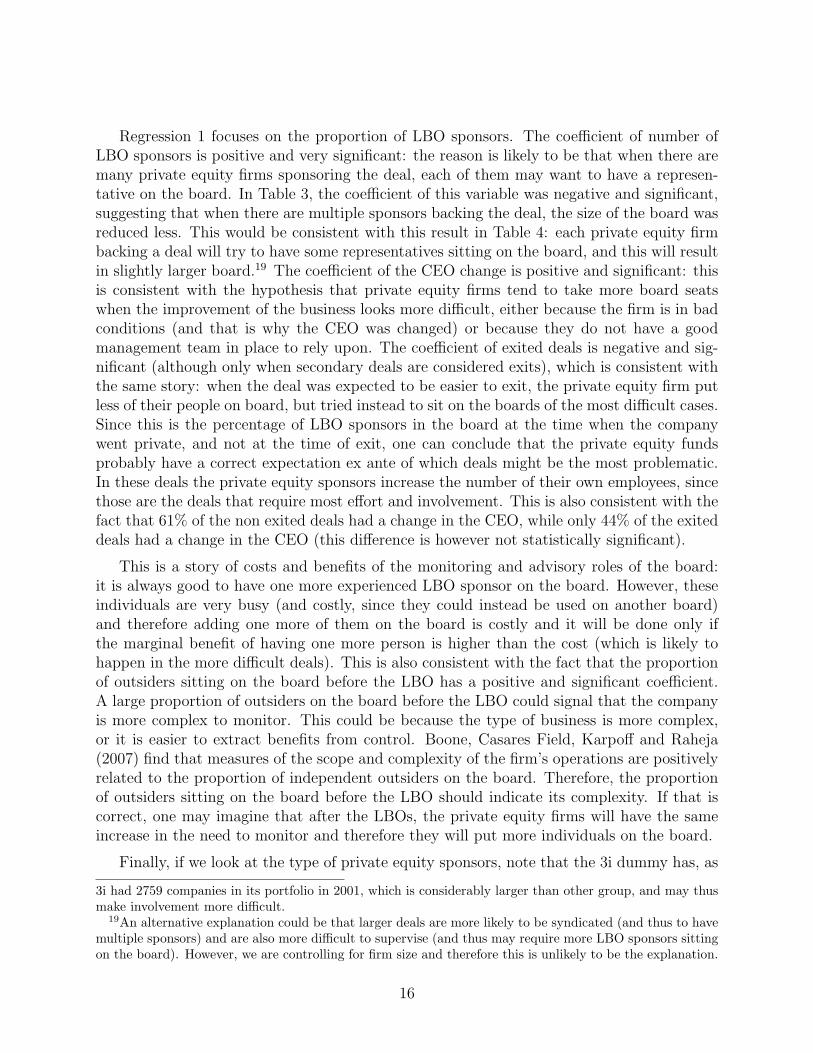
Regression 1 focuses on the proportion of LBO sponsors. The coefficient of number ofLBO sponsors is positive and very significant: the reason is likely to be that when there aremany private equity firms sponsoring the deal, each of them may want to have a represen-tative on the board. In Table 3, the coefficient of this variable was negative and significant,suggesting that when there are multiple sponsors backing the deal, the size of the board wasreduced less. This would be consistent with this result in Table 4: each private equity firmbacking a deal will try to have some representatives sitting on the board, and this will resultin slightly larger board.19 The coefficient of the CEO change is positive and significant: thisis consistent with the hypothesis that private equity firms tend to take more board seatswhen the improvement of the business looks more difficult, either because the firm is in badconditions (and that is why the CEO was changed) or because they do not have a goodmanagement team in place to rely upon. The coefficient of exited deals is negative and sig-nificant (although only when secondary deals are considered exits), which is consistent withthe same story: when the deal was expected to be easier to exit, the private equity firm putless of their people on board, but tried instead to sit on the boards of the most difficult cases.Since this is the percentage of LBO sponsors in the board at the time when the companywent private, and not at the time of exit, one can conclude that the private equity fundsprobably have a correct expectation ex ante of which deals might be the most problematic.In these deals the private equity sponsors increase the number of their own employees, sincethose are the deals that require most effort and involvement. This is also consistent with thefact that 61% of the non exited deals had a change in the CEO, while only 44% of the exiteddeals had a change in the CEO (this difference is however not statistically significant).
This is a story of costs and benefits of the monitoring and advisory roles of the board:it is always good to have one more experienced LBO sponsor on the board. However, theseindividuals are very busy (and costly, since they could instead be used on another board)and therefore adding one more of them on the board is costly and it will be done only ifthe marginal benefit of having one more person is higher than the cost (which is likely tohappen in the more difficult deals). This is also consistent with the fact that the proportionof outsiders sitting on the board before the LBO has a positive and significant coefficient.A large proportion of outsiders on the board before the LBO could signal that the companyis more complex to monitor. This could be because the type of business is more complex,or it is easier to extract benefits from control. Boone, Casares Field, Karpoff and Raheja(2007) find that measures of the scope and complexity of the firm’s operations are positivelyrelated to the proportion of independent outsiders on the board. Therefore, the proportionof outsiders sitting on the board before the LBO should indicate its complexity. If that iscorrect, one may imagine that after the LBOs, the private equity firms will have the sameincrease in the need to monitor and therefore they will put more individuals on the board.
Finally, if we look at the type of private equity sponsors, note that the 3i dummy has, as
3i had 2759 companies in its portfolio in 2001, which is considerably larger than other group, and may thusmake involvement more difficult.
19An alternative explanation could be that larger deals are more likely to be syndicated (and thus to havemultiple sponsors) and are also more difficult to supervise (and thus may require more LBO sponsors sittingon the board). However, we are controlling for firm size and therefore this is unlikely to be the explanation.
16
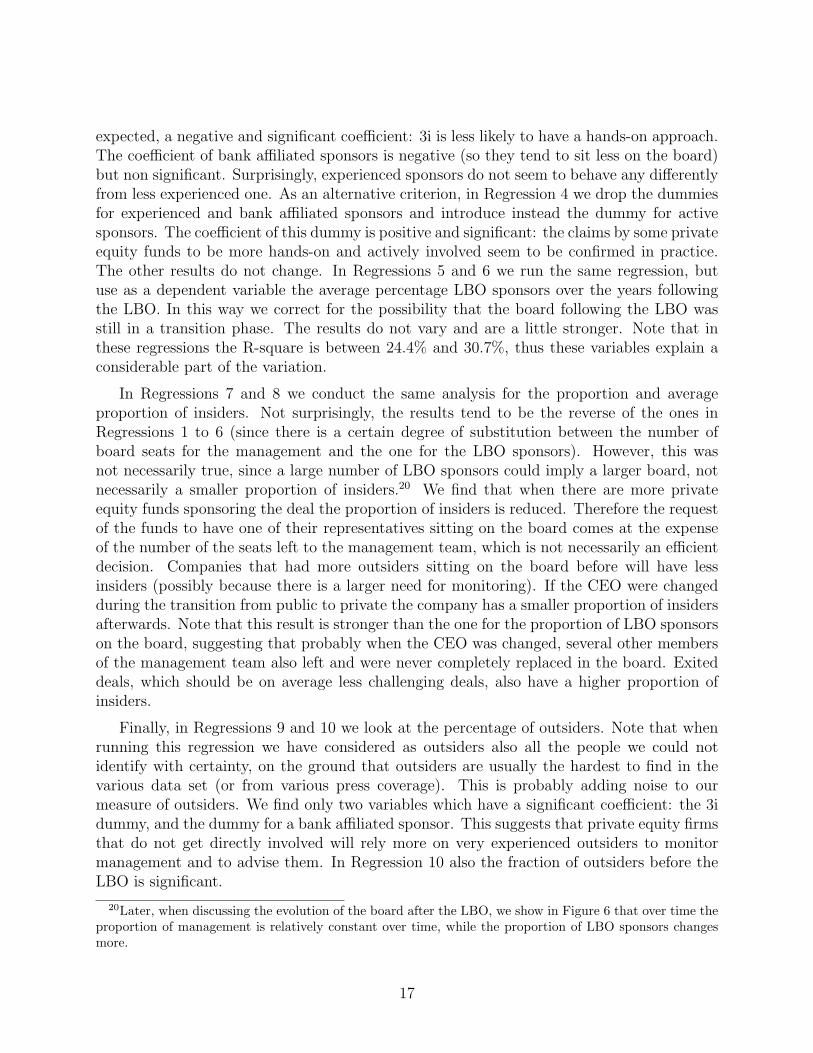
expected, a negative and significant coefficient: 3i is less likely to have a hands-on approach.The coefficient of bank affiliated sponsors is negative (so they tend to sit less on the board)but non significant. Surprisingly, experienced sponsors do not seem to behave any differentlyfrom less experienced one. As an alternative criterion, in Regression 4 we drop the dummiesfor experienced and bank affiliated sponsors and introduce instead the dummy for activesponsors. The coefficient of this dummy is positive and significant: the claims by some privateequity funds to be more hands-on and actively involved seem to be confirmed in practice.The other results do not change. In Regressions 5 and 6 we run the same regression, butuse as a dependent variable the average percentage LBO sponsors over the years followingthe LBO. In this way we correct for the possibility that the board following the LBO wasstill in a transition phase. The results do not vary and are a little stronger. Note that inthese regressions the R-square is between 24.4% and 30.7%, thus these variables explain aconsiderable part of the variation.
In Regressions 7 and 8 we conduct the same analysis for the proportion and averageproportion of insiders. Not surprisingly, the results tend to be the reverse of the ones inRegressions 1 to 6 (since there is a certain degree of substitution between the number ofboard seats for the management and the one for the LBO sponsors). However, this wasnot necessarily true, since a large number of LBO sponsors could imply a larger board, notnecessarily a smaller proportion of insiders.20 We find that when there are more privateequity funds sponsoring the deal the proportion of insiders is reduced. Therefore the requestof the funds to have one of their representatives sitting on the board comes at the expenseof the number of the seats left to the management team, which is not necessarily an efficientdecision. Companies that had more outsiders sitting on the board before will have lessinsiders (possibly because there is a larger need for monitoring). If the CEO were changedduring the transition from public to private the company has a smaller proportion of insidersafterwards. Note that this result is stronger than the one for the proportion of LBO sponsorson the board, suggesting that probably when the CEO was changed, several other membersof the management team also left and were never completely replaced in the board. Exiteddeals, which should be on average less challenging deals, also have a higher proportion ofinsiders.
Finally, in Regressions 9 and 10 we look at the percentage of outsiders. Note that whenrunning this regression we have considered as outsiders also all the people we could notidentify with certainty, on the ground that outsiders are usually the hardest to find in thevarious data set (or from various press coverage). This is probably adding noise to ourmeasure of outsiders. We find only two variables which have a significant coefficient: the 3idummy, and the dummy for a bank affiliated sponsor. This suggests that private equity firmsthat do not get directly involved will rely more on very experienced outsiders to monitormanagement and to advise them. In Regression 10 also the fraction of outsiders before theLBO is significant.
20Later, when discussing the evolution of the board after the LBO, we show in Figure 6 that over time theproportion of management is relatively constant over time, while the proportion of LBO sponsors changesmore.
17

5 Intervention of the board: CEO turnover
While a higher private equity involvement can be detected by looking at the presence ofprivate equity representatives on the board, ultimately this involvement should translate ina more hands-on approach, i.e. higher possibility of intervention.
In this section we therefore look at the CEO turnover in LBOs both before and afterthe company is taken private. Looking at the CEO turnover is very important in order toassess whether and how private equity groups improve a company performance. On onehand, tighter control on CEO and a less forgiving attitude to mistakes may lead to higherCEO turnover. On the other hand, it has often been argued that private equity firms areable to give their CEO a longer horizon to plan a company growth and therefore we shouldobserve that following an LBO, CEO turnover decreases. To control for any difference dueto the fact that the company is private, we compare the change in CEO turnover of LBOsto the one of MBOs. We compute the CEO turnover as the number of times the CEO waschanged divided by the number of years over which this was computed.21 When doing so,we do not take into account any change of CEO that takes place during the transition frompublic to private: we only want to look at changes in CEOs while there is no major changeof ownership. Since any change in turnover may be simply due to a change, for example,in the economic conditions, we do not simply compare turnover before and after an LBO.Instead, we construct a set of matching companies.
For each LBO, MBO and other deals we find a matching public company. We match thecompanies by industry and size, the year before the transition happened.22 The data usedfor matching are obtained from Datastream. We use all the UK companies (i.e., live anddead at year 2008) in the database. For the industry classification we use 2-digit SIC codeand for the size we use the market capitalization of companies. The matching algorithmselects the matching company with the closest absolute size within the 2-digit SIC code.The algorithm also makes sure that the absolute size deviation between the company in oursample and the possible matching company cannot be bigger than 30% and the matchingcompany has data at least as long as the company in our sample. After the matching, wego over the matched pairs one by one and confirm that their industry matchings makessense. For those which could not be matched with this algorithm and for the ones we didnot feel comfortable with the industry and/or size matching (15 companies out of 144) were-iterated the matching algorithm by relaxing the size restriction and picking the companiesthat matched best among the available ones.23 Note that the analysis is not sensitive to theexclusion of these 15 companies. We also tried different picking rules for these 15 matching
21As mentioned above, there are few cases in which after the LBO there is not any more a CEO, and suchrole is covered by one of the LBO sponsors. We have conducted the analysis both by recording a turnoverequal to zero for such cases or by dropping them completely from the analysis. The results are not verydifferent, therefore we do not report both cases.
22We have also done the matching using the first year in which we observed the company (usually two orthree years before the transition) with no substantial difference.
23The difficulty arises due to the limited number of existing public companies in the U.K. compared toU.S. to generate the pool to select the best matching company for our sample.
18

companies and the results are robust to these rules. After getting the matched companies,we collected their board information from Boardex and Manifest databases. For the missingdata, we used companies’ annual reports at Perfect Information to fill the relevant boardinformation.
Table 5 reports summary statistics of the CEO turnover for LBOs, MBOs and otherdeals, and compares it to the matching companies. Not surprisingly, since managers own amajority of the shares, the CEO turnover drops to almost zero following an MBO, and it issignificantly lower than the turnover of the matching companies. The turnover following anLBO is significantly smaller than before and it is significantly smaller than the turnover inmatching companies (while it was not significantly different before the LBO took place).24
The reduction in CEO turnover of LBOs is however much smaller than the one of MBOs.
To understand better what is driving the change in the CEO turnover, in Table 6 welook at LBOs only and we distinguish between deals where the CEO was changed and dealswhere the old CEOs remained in place during the transition period. When there is no CEOchange in transition, the CEO turnover is significantly lower also after the LBOs. Moreover,in these cases the CEO turnover after the LBO is significantly lower than the one of thematching companies (while it is not significantly different before the LBO).
This finding is consistent with both possible stories we put forward before for the fact thatwe observe a larger PE involvement in the board in the cases when the CEO was changedduring the transition. If the LBOs where the CEO was not changed are the least difficultones, then it is not surprising that we observe a lower turnover. In fact, when the privateequity company retains the previous manager, who has a lot of inside knowledge, it is alsounlikely to replace him afterwards and to give him a long term horizon. When the manageris new, then private equity companies do not seem to behave differently from similar publiccompanies. In these cases, the manager probably has still not earned the confidence of theLBO sponsor, and does not have an information advantage, therefore the private equity firmwill not give him a longer horizon. On the other hand, if we interpret the cases where theCEO was not changed as purely financial engineering deals, and only the cases where theCEO was changed as the cases where the private equity company really intends to restructureand improve the company, then it is not surprising if we observe a lower CEO turnover inthe first case.
We also distinguish between deals which were exited within 5 years and deals which werenot and we find that for the deals that were exited within 5 years the turnover followingan LBO is significantly lower than before. This may be due to the fact that when the dealis proceeding successfully the private equity company does not need to intervene, but whenproblems arise they do intervene and replace the management. Finally, small companieshave a lower turnover. However, due to the small sample size, significance of this resultdepends on the choice of a cutoff between small and large companies: in Table 6 we definea company small if the market capitalization is less than 50 million pounds (approximately
24As a robustness test, we dropped the cases in which a new CEO was brought in just before the deal wasexited and the results of Table 5 and 6 are even stronger.
19
the median). If the cut off is 20 or 100 million pounds, then the turnover of small companiesis significantly lower.
Given the results in Table 6, we want to study what affects the CEO turnover. Inparticular, looking at the difference in turnover between LBOs where the CEO was changedin transition and cases where the CEO was not changed in transition, one wonders whetherthis difference is driven by the PE company involvement. We argued in the previous sectionsthat LBOs where the CEO was changed are more difficult and when we found that the PEsponsors presence on the board is larger for this type of deals, we interpreted as evidenceof their involvement when there is more need for it. Now that we observe a larger CEOturnover in this cases we ask ourselves whether this larger turnover is due to the fact thatthese deals are more difficult (and thus the new CEO is more likely to fail) or is it due to thefact that the LBO sponsors are more involved. In other words, is a more involved privateequity group more likely to fire and substitute the CEO? The answer is not obvious: on theone hand, a more involved sponsor may monitor more and lead to a larger turnover; on theother hand, we just saw that LBOs seem to exhibit a lower turnover, therefore the fact thata private equity group is particularly involved may lead to a longer temporal horizon for theCEO. We therefore study what affects the CEO turnover.
However, deciding what affects the CEO turnover is not easy, because both CEO changeand PE involvement depend on the difficulty of the deal, which is unobservable. We thereforeproceed in the following way. First, we us as a dependent variable the change in CEO turnoverfrom before to after the deal. In so doing we control for any characteristic of the firm thatwould affect the CEO turnover.25 We argued before that the percentage of outsiders inthe board before the LBO captures the intrinsic complexity of the business of the companybrought private. Such complexity may affect the CEO turnover (since a firm which is morecomplex to manage may in principle more likely to have the CEO fired) but this effect shouldbe the same both before and after the company went private. Therefore, if the percentageof outsiders in the board before the transition affects the change in the CEO turnover, itshould be only through its effect on the PE group involvement (as documented in Table 4).Note that the same cannot be said about the dummy the captures a change in the CEOat transition: this variable also captures complexity, but only complexity in what happensafter the transition, and therefore could affect the change in CEO turnover directly.
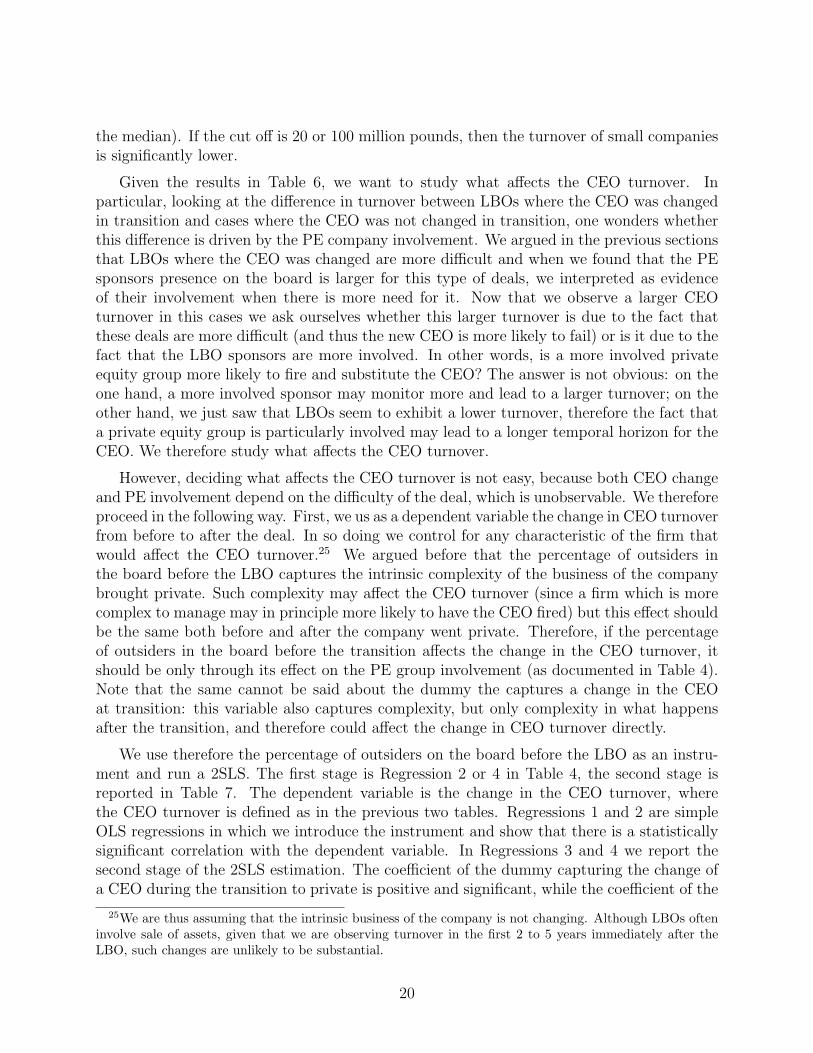
We use therefore the percentage of outsiders on the board before the LBO as an instru-ment and run a 2SLS. The first stage is Regression 2 or 4 in Table 4, the second stage isreported in Table 7. The dependent variable is the change in the CEO turnover, wherethe CEO turnover is defined as in the previous two tables. Regressions 1 and 2 are simpleOLS regressions in which we introduce the instrument and show that there is a statisticallysignificant correlation with the dependent variable. In Regressions 3 and 4 we report thesecond stage of the 2SLS estimation. The coefficient of the dummy capturing the change ofa CEO during the transition to private is positive and significant, while the coefficient of the
25We are thus assuming that the intrinsic business of the company is not changing. Although LBOs ofteninvolve sale of assets, given that we are observing turnover in the first 2 to 5 years immediately after theLBO, such changes are unlikely to be substantial.
20

percentage of LBO sponsors sitting on the board (instrumented) is negative and significant.This is consistent with the idea that when the deal is more difficult to turn around (CEOchange) the CEO turnover around, but when LBO sponsors are more involved this translatesin less intervention and longer horizons for the CEOs. This has also implication in general forthe corporate governance literature, when it uses the CEO turnover as an indication of howactive and independent the board is: this result indicates that a very active and informedboard may actually give more long-term confidence to the CEO, if it knows that he/sheis proceeding in the right direction. The more experienced or active LBO sponsors do notseem to have a higher CEO turnover. Another variable that is positive and significant is thenumber of LBO sponsors.
6 Operating performance
In the previous sections, we focused on the involvement of the private equity sponsors asa good thing, i.e. as a sign that they were actually putting effort in turning around thecompany. But one may wonder whether it really is a good thing. Therefore in this sectionwe look at the change in the operating performance of these companies after they are takenprivate. Another reason to look at the performance is that it allows us to distinguish whetherthe cases in which there was no change of CEO during the transition are the easy cases, wherethe PE sponsors know they can rely on an experienced CEO to turn around the company,or instead cases where the PE just wants to earn money by financial engineering, with nointention of restructuring the company.
We obtained the data about the financial performance for both the firms in our sampleand the matching firms from Fame, Perfect Information and Compustat. While creatingthe performance dataset, we encountered challenges similar to ones while creating the boarddataset: after going private firms have a complex ownership pyramidal structure whichcreates difficulties in reaching the relevant financial performance figures. Moreover as firms goto private, the performance figures become less reliable. To identify the reliable performancefigures, we went over each individual firm and cross-checked the figures reported from Fame,Perfect Information and Compustat. In a few cases, the data was available for a periodless/greater than 12 months periods. In those cases we extrapolated the figures to 12 monthperiod to make them comparable. When we felt we could not get reliable data, we droppedthe firm from the sample, which means the number of observations for this Section dropsto either 57 or 67 (depending on the measures used for operating performance). After allthese iterations, the performance measures that we felt reliably available for the firms were:operating profit over sales, operating profit over total assets and profit margin.
Recent evidence on public-to-private transactions shows that these companies do notseem on average to perform better than public companies. Weir, Jones and Wright (2008)study UK buy-out between 1998 and 2004 (thus in a period almost the same as the onecovered in this paper) and find some evidence that performance improves, but not strong.Moreover, when they focus on public-to-private transactions with a private equity backing
21
they find that these firms perform worse than the firms that remained public (althoughthis is due to the fact that these were larger deals and large deals performed worse in thatperiod). When we look at the summary statistics of our sample of 57 firms, we find mixedevidence, but in general not very good: the average change of operating profit over sales was-4.39% for all LBOs, while for all the matching firms was 0.46%, and the average change ofoperating profit over total assets was -2.83% for all LBOs, while for all the matching firmswas -3.70% (in both cases the differences are not statistically significant). Note that in ourcase we are matching with firms of the same size, so the size of the deal should not affectour conclusions, and we do not find significant differences in performance. We ask whetherthere is heterogeneity among the deals: after all we have been stressing the importance ofthe private equity sponsors involvement and therefore we would like to know whether it is inthese cases that we find improvement in operating performance. If we partition the samplebetween the deals with and without CEO change, we start finding some evidence of that:for the LBOs where the CEO was not changed the average change of operating profit oversales was -8.96%, while it was -0.19% for the matching firms, and the average change ofoperating profit over total assets was -5.74%, while for the matching firms it was -3.74%(thus these LBOs underperformed). Instead, for the LBOs where the CEO was changed theaverage change of operating profit over sales was 0.68%, while it was 1.18% for the matchingfirms, and the average change of operating profit over total assets was 0.39%, while for thematching firms it was -3.65%.
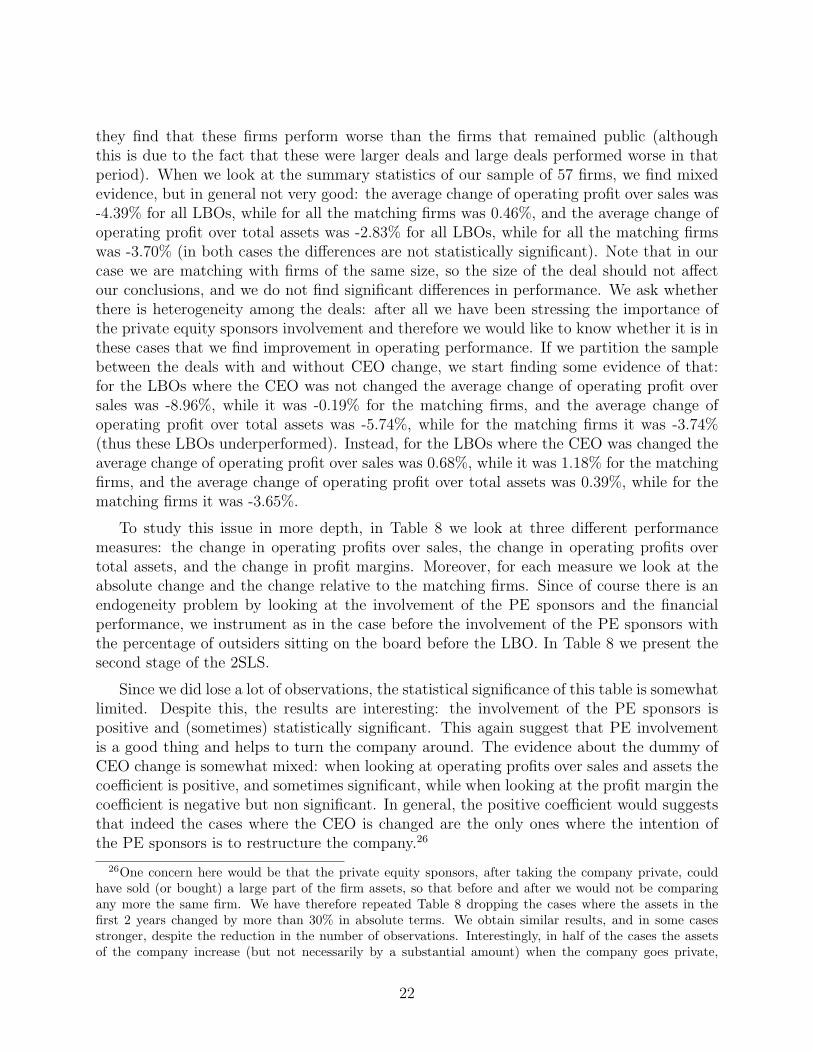
To study this issue in more depth, in Table 8 we look at three different performancemeasures: the change in operating profits over sales, the change in operating profits overtotal assets, and the change in profit margins. Moreover, for each measure we look at theabsolute change and the change relative to the matching firms. Since of course there is anendogeneity problem by looking at the involvement of the PE sponsors and the financialperformance, we instrument as in the case before the involvement of the PE sponsors withthe percentage of outsiders sitting on the board before the LBO. In Table 8 we present thesecond stage of the 2SLS.
Since we did lose a lot of observations, the statistical significance of this table is somewhatlimited. Despite this, the results are interesting: the involvement of the PE sponsors ispositive and (sometimes) statistically significant. This again suggest that PE involvementis a good thing and helps to turn the company around. The evidence about the dummy ofCEO change is somewhat mixed: when looking at operating profits over sales and assets thecoefficient is positive, and sometimes significant, while when looking at the profit margin thecoefficient is negative but non significant. In general, the positive coefficient would suggeststhat indeed the cases where the CEO is changed are the only ones where the intention ofthe PE sponsors is to restructure the company.26
26One concern here would be that the private equity sponsors, after taking the company private, couldhave sold (or bought) a large part of the firm assets, so that before and after we would not be comparingany more the same firm. We have therefore repeated Table 8 dropping the cases where the assets in thefirst 2 years changed by more than 30% in absolute terms. We obtain similar results, and in some casesstronger, despite the reduction in the number of observations. Interestingly, in half of the cases the assetsof the company increase (but not necessarily by a substantial amount) when the company goes private,
22
7 Board turnover
In Table 9 we look at the turnover of people in the board. We measure this turnover in twoways. First, in Panel A and B we look at the change in the size of the board from one yearto another, measured as the (absolute) change in the total number of people sitting on theboard, normalized by the board size in the previous year. We exclude the transition periodwhen the company goes from public to private and measure the average change in size beforethe LBO and after the LBO.27 The results are presented in Panel A and B of Table 9: inPanel A we include the change in size from the first to the second year after the LBO, whilein panel B we exclude this year, since any change may still be due to the transition phase.One can see that the size variation of LBOs, MBOs and others before was approximately10% and not significantly different from the matching companies. However, LBOs have asignificantly larger size variation afterwards: 21% or 16% depending on whether we consideror not the first year variation.
We also measure turnover as the number of people who changed in a board from one yearto the consecutive year, normalized by the size of the board.28 This measure of turnoverpicks up changes due to variation in the board size and changes due to turnover of people,even if the size of the board has not changed. Again, we find that LBO boards have a sig-nificantly higher turnover than matching companies after the transition, while MBOs havesignificantly lower turnover (the significance of this result depends however on the methodused). Companies that are taken private in an LBO already have a (significantly) higherturnover then MBO companies before going private, but their turnover even increases af-terwards. Therefore, while the CEO turnover after an LBO decreases, the board turnoverincreases. This result, however, is due, at least in part, to the turnover of the LBO spon-sors: sometimes a private equity company will put its best expert at the beginning of therestructuring process. When things start to look better and the crucial moment has passed,the best people may move to another deal and more junior people may take their place onthe board. If we redo the analysis in Panels C and D ignoring the changes of LBO sponsors,the board turnover of LBOs is still higher than before and than matching companies, but bya lower amount and the statistical significance is reduced (we do not report these numbers).This may point to the possibility that with private equity boards are a more active tools in
consistently with the results for France in Boucly, Sraer and Thesmar (2010).27Since we drop the first or first two years after the transition, in some cases in which the deal was exited
very fast it is not any more possible to measure turnover after the LBO. This is the reason why the numberof observation before and after is not the same. We have repeated the analysis, by dropping these LBOsfrom the sample and the analysis is qualitatively the same.
28We measure this in three possible ways. First, we compute the number of different people in the board asa percentage of the board size in the current year. This method biases the results if the company board sizedecreases (e.g. in MBOs). Second, we compute the number of different people in the board as a percentageof the board size in the previous year. This method biases the results if the company board size increases.Finally, we define the turnover as the number of times a CEO was changed, divided by the number of yearsover which this was measured, i.e. as [previous board size + current board size - 2 * number of peopleremaining in the board] / [previous board size + current board size]. The results are generally very similar,but we report the turnover computed using the last method, which we think is the best one.
23
running the company and therefore there are more changes of the people on the board.
8 Conclusions
We have found that the role of the board is crucial in private equity and that studyingthe boards is a good way to see how private equity general partners can be effective inrestructuring a company. Having private equity partners on the board of a company canbe very helpful for achieving success in restructuring a company. However, the opportunitycost of private equity firms being actively involved in the board of one deal is that theyhave less time to focus on other deals. We find evidence that they choose to use more oftheir resources in the deals they expect to require more time and attention. The successfulturn-around of companies is the result of time and effort that private equity firms put inthe process. Furthermore, we find that the LBOs with a larger presence of private equitypeople on the board have a lower CEO turnover but higher operating performance, whichis consistent with the view that CEOs in change of the restructuring process face a longerterm horizon, which allows them to focus on the restructuring process.
24
References
Acharya, V., M. Hahn and C. Kehoe , 2010, ”Corporate Governance and Value Cre-ation: Evidence from Private Equity,” mimeo, New York University.
Adams, R. , 1998, “The Dual Role of Corporate Boards as Advisors and Monitors of Man-agement,” mimeo, Stockholm School of Economics.
Adams, R. and D. Ferreira , 2007, “A Theory of Friendly Boards,” Journal of Finance,62, pp. 217-250.
Boone, A.L., L. Casares Field, J.M. Karpoff and C.G. Raheja , 2007, “The De-terminants of Corporate Board Size and Composition: An Empirical Analysis,” Journalof Financial Economics, 85, pp. 66-101.
Boucly , Q., D. Sraer and D. Thesmar , 2010, “Job Creating LBOs?, Evidence fromFrance” mimeo, HEC Paris.
Coles, J.L., N.D. Daniel and L. Naveen , 2007, “Boards: Does One Size Fit All?,”Journal of Financial Economics, forthcoming.
Guo, S., E.S. Hotchkiss and W. Song , 2010, “Do Buyouts (Still) Create Value?,”Journal of Finance, forthcoming.
Hellmann, T., L. Lindsey and M. Puri , 2007, “Building Relationship Early: Banksin Venture Capital”, Review of Financial Studies, forthcoming.
Hermalin, B. and M. Weisbach , 1988, “Endogenously Chosen Boards of Directors andTheir Monitoring of the CEO”, American Economic Review, 88, pp.96-118.
Jensen, M. , 1993, “The Modern Industrial Revolution, Exit, and the Failure of InternalControl Systems,” Journal of Finance, 48, pp. 831-880.
Kaplan, S. and R. Gertner , 1996, “The Value-Maximizing Board,” mimeo, Universityof Chicago.
Kester, W.C. and T.A. Luehrman , 1995, “Rehabilitating the Leveraged Buyout,” Har-vard Business Review, May-June.
Lerner, J. , 1995, “Venture Capitalists and the Oversight of Private Firms,” Journal ofFinance, 50, pp.301-318.
Lerner, J., F. Hardymon and A. Leamon , 2002, “Venture Capital and the PrivateEquity: A Casebook,” John Wiley.
Linck, J.S., J.M.Netter and T.Yang , 2007, “The Determinants of Board Structure,”Journal of Financial Economics, forthcoming.
25
Rogers, P., T. Holland and D. Haas , 2002, “Value Acceleration: Lessons from Private-Equity Masters,” Harvard Business Review, June, pp.94-103.
Walker, D. , 2007, “Disclosure and Transparency in Private Equity,” Consultation Docu-ment.
Weir, C., P. Jones and M. Wright , 2008, “Public to Private Transactions, PrivateEquity and Performance in the UK: an Empirical Analysis of the Impact of GoingPrivate,” mimeo, University of Nottingham.
Weisbach, M. , 1988, “Outside Directors and CEO Turnover,” Journal of Financial Eco-nomics, 20, pp. 431-460.
Yermack, D. , 1996, “Higher Market Valuation of Companies with a Small Board of Di-rectors,” Journal of Financial Economics, 40, pp. 185-212.
26

This figure shows the number of public to private transactions that took place in UK each year, from 1998 to 2003. We distinguish between LBOs, MBOsand other transactions. The year of each transaction is determined according to the announcement date.
Figure 1: Year Distribution of the Sample.
Year Distribution of the Sample
0
5
10
15
20
25
1998 1999 2000 2001 2002 2003
Year
Num
ber
of tr
ansa
ctio
nsLBO MBO Other
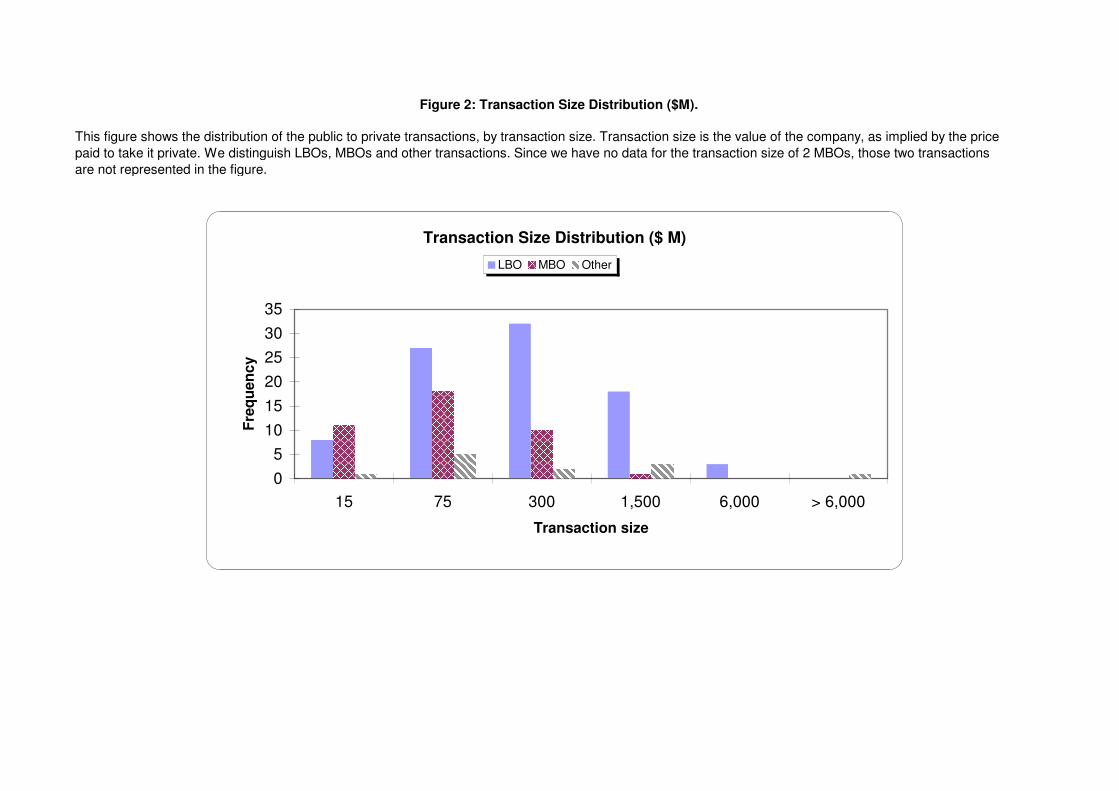
This figure shows the distribution of the public to private transactions, by transaction size. Transaction size is the value of the company, as implied by the price paid to take it private. We distinguish LBOs, MBOs and other transactions. Since we have no data for the transaction size of 2 MBOs, those two transactionsare not represented in the figure.
Figure 2: Transaction Size Distribution ($M).
Transaction Size Distribution ($ M)
05
101520253035
15 75 300 1,500 6,000 > 6,000
Transaction size
Freq
uenc
yLBO MBO Other

This figure represents the board composition of LBOs, MBOs and other transactions. We report the composition for the last board observed before the company went private and the second board observed after the company went private. The board composition shows the different types of directors. Otherinsiders refer to other non-management insiders (for example, previous CEOs). Outsiders are individuals for which no special relation to the company could be found. Unknown are individuals whose identity could not be determined with certainty. LBO group are partners or employees of one of the private equity firms backing the transaction. PE connection are outside directors, for whom a private equity connection could be identified (for example, they are employees or directors of a private equity firm).
Figure 3: Board Compositions for LBOs, MBOs and Other Transactions Before and After Transition.
LBO Board Composition Before Buyout
50%44%
1% 5%
CEO & Management OutsidersUnknown Other Insiders
LBO Board Composition After Buyout
53%
11%4%
2%
30%
CEO & Management Outsiders Unknown Other InsidersLBO Group
MBO Board Composition Before Buyout
57%
38%
5%0%
CEO & Management OutsidersUnknown Other Insiders
MBO Board Composition After Buyout
72%
10%
3%
14% 1%
CEO & Management Outsiders Unknown Other InsidersPE Connection
Other Board Composition Before Buyout
45%
52%
3%0%
CEO & Management OutsidersUnknown Other Insiders
Other Board Composition After Buyout
51%
6%
12%
24%
7%
CEO & Management Outsiders Unknown Other InsidersPE Connection

This figure shows the age distribution of the different types of directors.
Figure 4: Age Distribution for LBOs.
Age Distribution for LBOs
0
50
100
150
200
250
300
40 50 60 More
Age of Directors
Freq
uenc
y
CEO & Management Independent LBO Group

This figure shows how the size of the board changes over time, distinguishing between LBOs, MBOs and other transactions. Date 0 is the year in whichthe buyout takes place. The chart shows, for example, that in year 5 after the buyout LBOs had on average a board of 5 people. The average is taken over all the LBOs that have not been exited by year 6.
Figure 5: Average Board Size over Relative Time.
Average Board Size over Relative Time
2
3
4
5
6
7
8
-3 -2 -1 1 2 3 4 5 6 7 8 9
Year
Ave
rage
Boa
rd S
ize
LBO MBO Other
Buyout
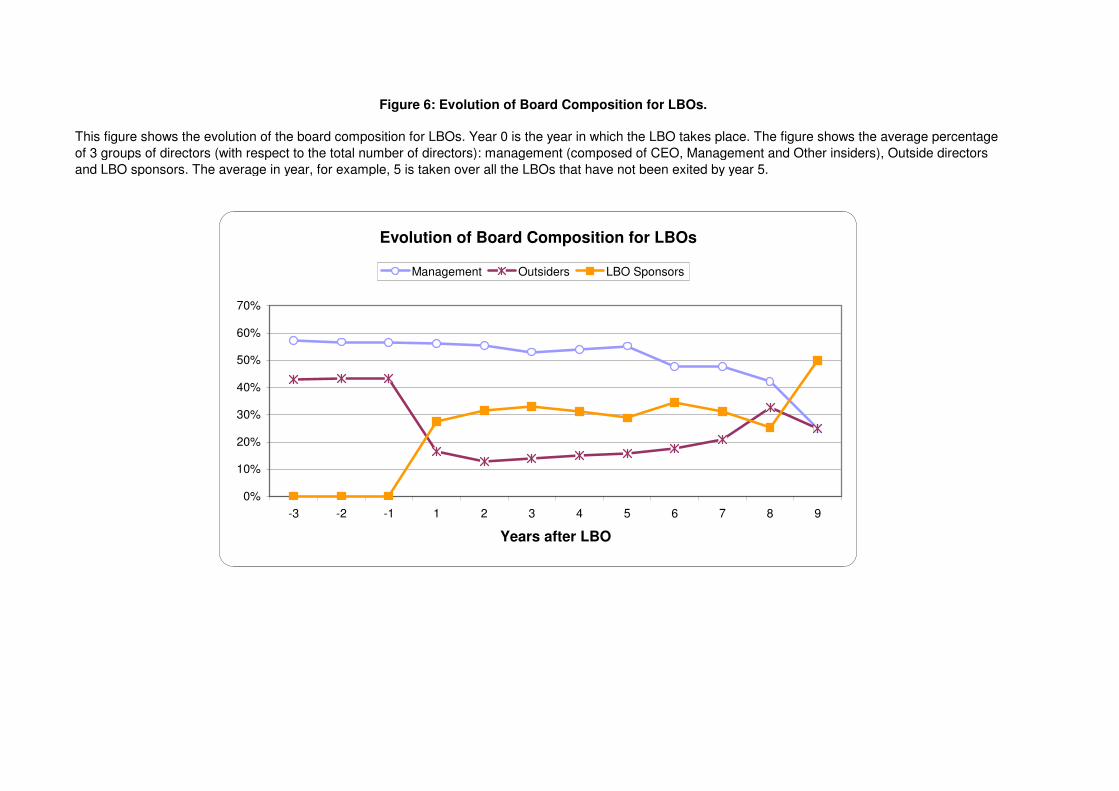
This figure shows the evolution of the board composition for LBOs. Year 0 is the year in which the LBO takes place. The figure shows the average percentageof 3 groups of directors (with respect to the total number of directors): management (composed of CEO, Management and Other insiders), Outside directorsand LBO sponsors. The average in year, for example, 5 is taken over all the LBOs that have not been exited by year 5.
Figure 6: Evolution of Board Composition for LBOs.
Evolution of Board Composition for LBOs
0%
10%
20%
30%
40%
50%
60%
70%
-3 -2 -1 1 2 3 4 5 6 7 8 9
Years after LBO
Management Outsiders LBO Sponsors
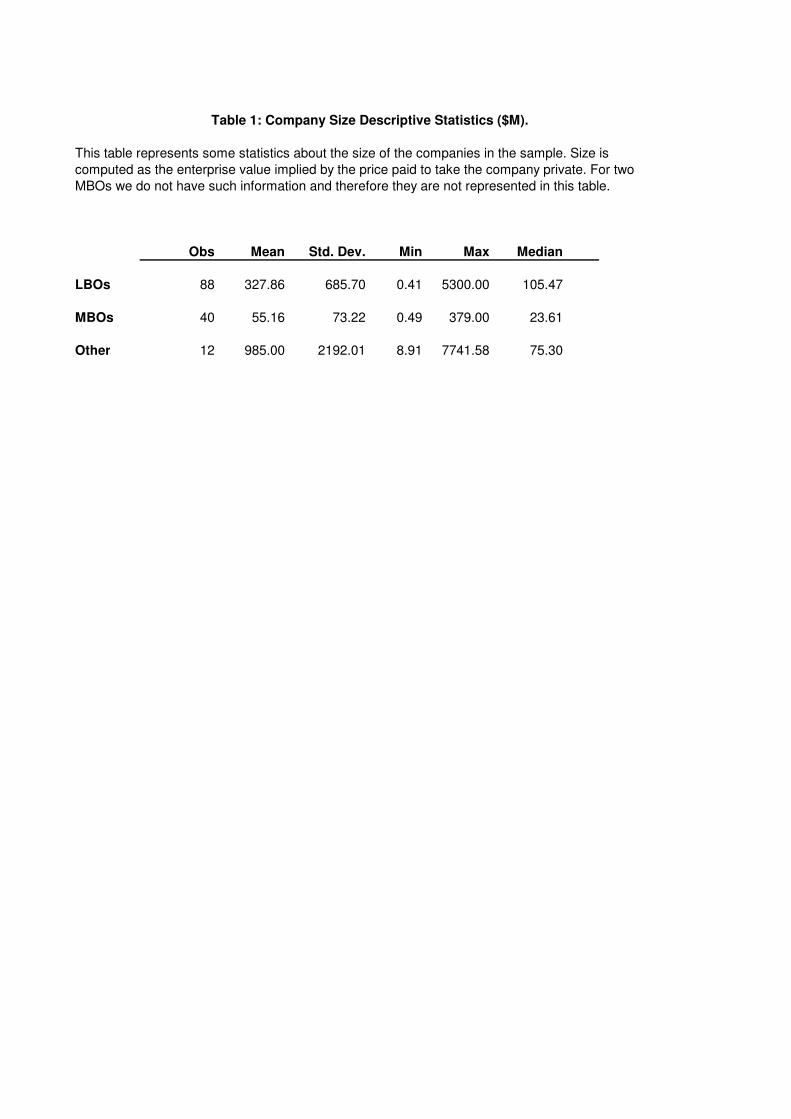
This table represents some statistics about the size of the companies in the sample. Size is computed as the enterprise value implied by the price paid to take the company private. For two MBOs we do not have such information and therefore they are not represented in this table.
Obs Mean Std. Dev. Min Max Median
LBOs 88 327.86 685.70 0.41 5300.00 105.47
MBOs 40 55.16 73.22 0.49 379.00 23.61
Other 12 985.00 2192.01 8.91 7741.58 75.30
Table 1: Company Size Descriptive Statistics ($M).

This table shows the change in the average board size when the firm is taken private. We measure theaverage board size of the last board before the company is taken private (before) and of the second boardobserved after the company is taken private (after). T-statistics of the difference between LBOs andMBOs and of the difference between the board before and after are provided. Panel A reports statisticsfor all MBOs and LBOs. For one LBO we do not observe the board after the company is taken private, therefore that LBO is not represented in this table. Panel B selects 39 MBOs and 39 LBOs, matched by size.
Panel A. MBO vs. LBO.
(m) (l) (m) - (l)MBO LBO t-statn=54 n=87
(b) Before 6.22 6.51 -0.91(a) After 4.26 5.44 -3.18
(b) - (a) t-stat 4.87 3.73
(m) (l) (m) - (l)Change in size MBO LBO t-statafter event 1.96 1.07 2.13
Panel B. MBOs vs. LBOs, matched sample.
(m) (l) (m) - (l)MBO LBO t-statn=39 n=39
(b) Before 6.59 6.10 1.21(a) After 4.41 4.92 -1.23
(b) - (a) t-stat 4.90 3.18
(m) (l) (m) - (l)Change in size MBO LBO t-statafter event 2.18 1.18 1.85
Table 2: Change in the Board Size.

This table reports regression coefficients (and T-statistics in parentheses) for various dependent variables and model specifications. The dependent variables are the board size change, defined as the difference in the number of people on the board before and after the LBO, and the percentage change in board size. Firm size is the logenterprise value (in billion $) implied by the LBO and number of LBO sponsors is the number of PE funds backingthe LBO. Change in CEO at LBO is a dummy that takes value one if there has been a CEO change from before toafter the LBO. Experienced sponsors and Bank affiliated sponsors are dummies that take value one if at least oneof the PE firms backing the LBO is an experienced firm or if the leading sponsor is a bank affiliated PE firm. We consider secondary sales as exits. Deals not exited within five years are considered as non-exits. Fraction of Outsiders before LBO with CEO experience measure the number of outsiders in the board before the LBO who wereor had been CEOs in other companies. Real Estate is a dummy that takes value one if the company is in the realestate sector. One, two or three asterix means that the coefficients are significant at, respectively, 10%, 5% and 1% level.
Dependent Board size % Board % Board variable change size change size change
Reg 1 Reg 2 Reg 3
Intercept 4.54*** 0.67*** -0.01(3.34) (3.70) (-0.02)
Firm Size -0.18 -0.02 -0.06***(-1.12) (-1.27) (-2.84)
Change in CEO -0.90* -0.13* -0.11*at LBO (-1.88) (-1.92) (-1.71)
Number of LBO -0.67* -0.12* -0.11**sponsors (-1.85) (-1.89) (-2.17)
Experienced sponsor -2.11*** -0.31*** -0.25***(-2.81) (-3.08) (-3.12)
Bank affiliated sponsor -0.68 -0.11 -0.09(-1.21) (-1.37) (-1.29)
Fraction of outsiders -2.08 -0.25 -0.15before the LBO (-1.28) (-1.04) (-0.66)
Fraction of outsiders before 1.82* 0.23 0.15the LBO with CEO exp. (1.86) (1.56) (1.13)
Average size of board 0.07***before LBO (3.41)
Real Estate -0.57 -0.05 0.03(-0.90) (-0.53) (0.28)
Exited Deal 0.01 0.01 -0.00(0.01) (0.13) (-0.08)
R-squared 18.8% 17.7% 28.4%
N 87 87 87
Table 3: Changes in the Board Size, Multivariate Analysis.

This table reports regression coefficients (and T-statistics in parentheses) for various dependent variables and model specifications. The dependent variablesare the percentage of LBO sponsors sitting on the board (measured in the second year following the LBO), the average percentage of LBO sponsors sittingon the board, over all years after the LBO, the percentage of insiders sitting on the board (in the second year or on average) and the percentage of outsiderson the board (in the second year or on average). Firm size is the log enterprise value (in billion $) implied by the LBO and number of LBO sponsors is thenumber of PE funds backing the LBO. Change in CEO at LBO is a dummy that takes value one if there has been a CEO change from before to after the LBO.Experienced sponsors and Bank affiliated sponsors are dummies that take value one if at least one of the PE firms backing the LBO is an experienced firmor if the leading sponsor is a bank affiliated PE firm. 3i dummy takes value 1 if the leading sponsor is 3i. Fraction of Outsiders before LBO with CEO experiencemeasure the number of outsiders in the board before the LBO who were or had been CEOs in other companies. Real Estate is a dummy that takes value oneif the company is in the real estate sector. We consider secondary sales as exits. Deals not exited within five years are considered as non-exits. We alsoinclude a second definition of exited deals where the secondary sales are taken as non-exits for robustness. One, two or three asterix means that the coefficients are significant at, respectively, 10%, 5% and 1% level.
Dependent %LBO %LBO %LBO %LBO Average% Average% %Insiders Average% % Outsiders Average% variable Sponsors Sponsors Sponsors Sponsors LBO Sponsors LBO Sponsors Insiders Outsiders
Reg 1 Reg 2 Reg 3 Reg 4 Reg 5 Reg 6 Reg 7 Reg 8 Reg 9 Reg 10
Intercept -0.03 -0.00 0.03 -0.10 0.07 -0.12 0.90*** 0.93*** 0.07 -0.00(-0.18) (-0.00) (0.18) (-0.82) (0.42) (-1.02) (4.98) (5.30) (0.75) (-0.02)
Firm Size 0.01 0.02 0.02 0.01 0.02 0.01 -0.01 -0.00 -0.01 -0.01(0.87) (1.22) (1.31) (0.86) (1.06) (0.44) (-0.70) (-0.33) (-0.92) (-1.35)
Change in CEO 0.11** 0.11** 0.11** 0.12*** 0.12*** 0.13*** -0.12** -0.12*** -0.00 -0.00at LBO (2.29) (2.38) (2.41) (2.62) (2.86) (3.24) (-2.50) (-2.76) (0.12) (-0.05)
Number of LBO 0.14*** 0.14*** 0.13** 0.13** 0.11** 0.11** -0.11* -0.09* -0.02 -0.02sponsors (2.63) (2.51) (2.33) (2.42) (2.28) (2.39) (-1.84) (-1.87) (-0.82) (-0.73)
Experienced sponsor 0.03 0.04 0.04 0.01 -0.05 -0.08 0.01 0.07(0.25) (0.32) (0.32) (0.10) (-0.43) (-0.71) (0.14) (1.29)
Bank affiliated sponsor -0.04 -0.04 -0.05 -0.09 -0.03 -0.02 0.08* 0.11***(-0.58) (-0.68) (-0.83) (-1.59) (-0.48) (-0.37) (1.66) (2.70)
Fraction of outsiders 0.30* 0.29* 0.26 0.29* 0.25* 0.28** -0.38** -0.41** 0.12 0.16**before the LBO (1.89) (1.92) (1.64) (1.95) (1.70) (2.03) (-2.13) (-2.50) (1.27) (1.98)
Active Sponsor 0.08* 0.09**(1.87) (2.21)
Real Estate 0.07 0.06 0.08 0.08 0.05 0.05 0.00 -0.02 -0.08** -0.03(0.77) (0.70) (0.88) (0.95) (0.57) (0.66) (0.04) (-0.17) (-2.16) (-0.63)
Exited Deal -0.08* -0.07 -0.09* -0.06 -0.07* 0.07 0.08* 0.00 -0.02(-1.74) (-1.57) (-1.87) (-1.41) (-1.73) (1.56) (1.85) (0.12) (-0.61)
Exited Deal (2nd definition) -0.07(secondary sales non-exits) (-1.34)
3i dummy -0.17** -0.19** 0.16*** 0.15***(-2.24) (-2.38) (3.74) (3.52)
R-squared 24.4% 25.2% 27.1% 27.9% 29.8% 30.7% 20.9% 23.1% 13.2% 17.9%
N 87 87 87 87 87 87 87 87 87 87
Table 4: Board Composition, Multivariate Analysis.

This table reports the average CEO Turnover for LBOs, MBOs and other deals and for thematching companies. The CEO Turnover is computed as the number of times a CEO waschanged, divided by the number of years over which this was measured. The Turnover has been computed separately for the years before and after a company was taken public. The year in which the transition from public to private occurs is not taken into account. One, twoor three dagger denote that the figures are significantly different between before&after at 10,5, 1% level, respectively. One, two or three asterix denote that the figures are significantlydifferent between sample&matching companies at 10, 5, 1% level, respectively.
Before After
*LBO 14.5% 9.2% †Matching Companies 16.5% 14.4%obs 86 83
***MBO 8.3% 0.5% ††Matching Companies 10.8% 10.6%obs 40 41
Others 20.8% 10.5%Matching Companies 18.1% 10.5%obs 12 11
Table 5: CEO Turnover, Summary Statistics.
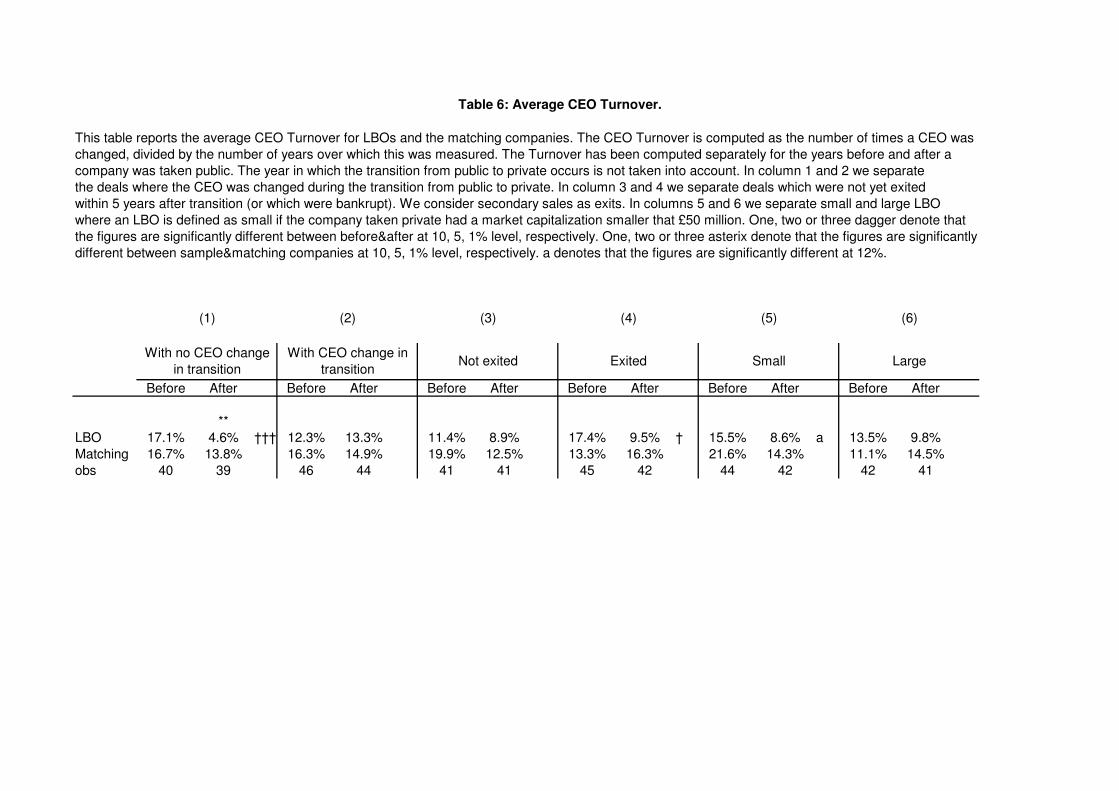
This table reports the average CEO Turnover for LBOs and the matching companies. The CEO Turnover is computed as the number of times a CEO was changed, divided by the number of years over which this was measured. The Turnover has been computed separately for the years before and after a company was taken public. The year in which the transition from public to private occurs is not taken into account. In column 1 and 2 we separate the deals where the CEO was changed during the transition from public to private. In column 3 and 4 we separate deals which were not yet exitedwithin 5 years after transition (or which were bankrupt). We consider secondary sales as exits. In columns 5 and 6 we separate small and large LBO where an LBO is defined as small if the company taken private had a market capitalization smaller that £50 million. One, two or three dagger denote that the figures are significantly different between before&after at 10, 5, 1% level, respectively. One, two or three asterix denote that the figures are significantly different between sample&matching companies at 10, 5, 1% level, respectively. a denotes that the figures are significantly different at 12%.
Before After Before After Before After Before After Before After Before After
**LBO 17.1% 4.6% ††† 12.3% 13.3% 11.4% 8.9% 17.4% 9.5% † 15.5% 8.6% a 13.5% 9.8%Matching 16.7% 13.8% 16.3% 14.9% 19.9% 12.5% 13.3% 16.3% 21.6% 14.3% 11.1% 14.5%obs 40 39 46 44 41 41 45 42 44 42 42 41
(3) (4) (5) (6)
Small Large
Table 6: Average CEO Turnover.
With no CEO change in transition
With CEO change in transition
Not exited Exited
(1) (2)
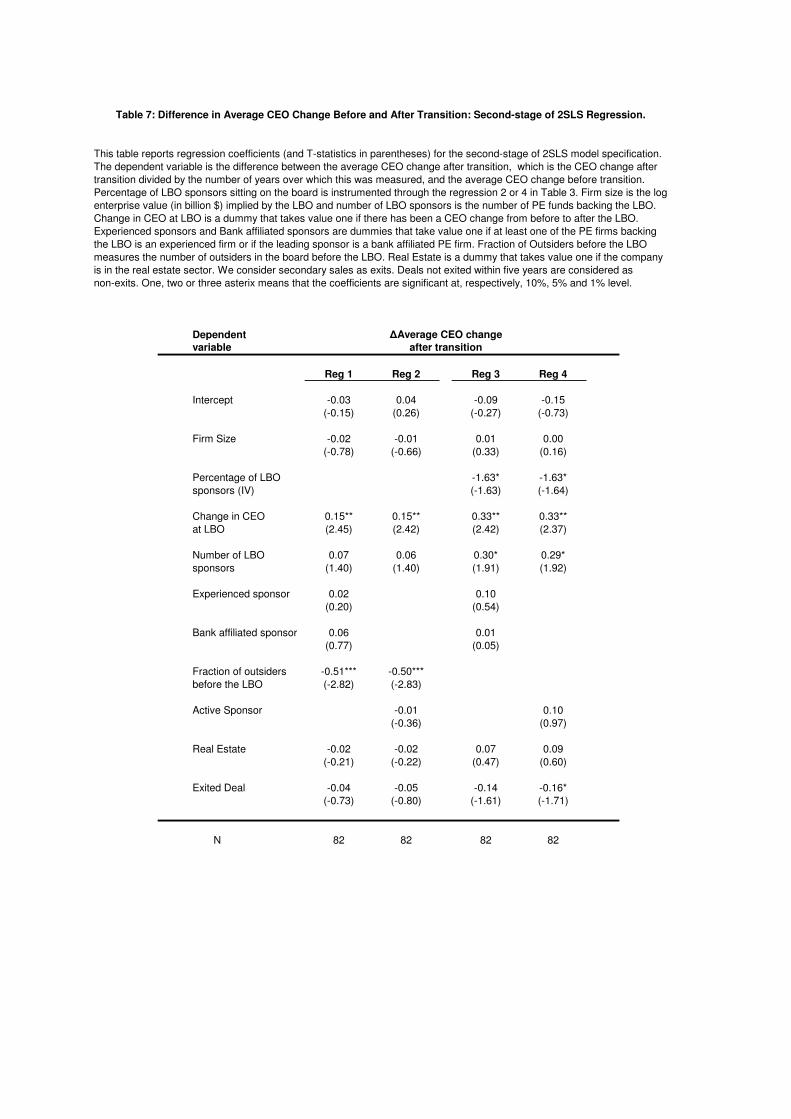
This table reports regression coefficients (and T-statistics in parentheses) for the second-stage of 2SLS model specification.The dependent variable is the difference between the average CEO change after transition, which is the CEO change after transition divided by the number of years over which this was measured, and the average CEO change before transition.Percentage of LBO sponsors sitting on the board is instrumented through the regression 2 or 4 in Table 3. Firm size is the logenterprise value (in billion $) implied by the LBO and number of LBO sponsors is the number of PE funds backing the LBO.Change in CEO at LBO is a dummy that takes value one if there has been a CEO change from before to after the LBO. Experienced sponsors and Bank affiliated sponsors are dummies that take value one if at least one of the PE firms backingthe LBO is an experienced firm or if the leading sponsor is a bank affiliated PE firm. Fraction of Outsiders before the LBOmeasures the number of outsiders in the board before the LBO. Real Estate is a dummy that takes value one if the companyis in the real estate sector. We consider secondary sales as exits. Deals not exited within five years are considered as non-exits. One, two or three asterix means that the coefficients are significant at, respectively, 10%, 5% and 1% level.
Dependent variable
Reg 1 Reg 2 Reg 3 Reg 4
Intercept -0.03 0.04 -0.09 -0.15(-0.15) (0.26) (-0.27) (-0.73)
Firm Size -0.02 -0.01 0.01 0.00(-0.78) (-0.66) (0.33) (0.16)
Percentage of LBO -1.63* -1.63*sponsors (IV) (-1.63) (-1.64)
Change in CEO 0.15** 0.15** 0.33** 0.33**at LBO (2.45) (2.42) (2.42) (2.37)
Number of LBO 0.07 0.06 0.30* 0.29*sponsors (1.40) (1.40) (1.91) (1.92)
Experienced sponsor 0.02 0.10(0.20) (0.54)
Bank affiliated sponsor 0.06 0.01(0.77) (0.05)
Fraction of outsiders -0.51*** -0.50***before the LBO (-2.82) (-2.83)
Active Sponsor -0.01 0.10(-0.36) (0.97)
Real Estate -0.02 -0.02 0.07 0.09(-0.21) (-0.22) (0.47) (0.60)
Exited Deal -0.04 -0.05 -0.14 -0.16*(-0.73) (-0.80) (-1.61) (-1.71)
N 82 82 82 82
�Average CEO changeafter transition
Table 7: Difference in Average CEO Change Before and After Transition: Second-stage of 2SLS Regression.
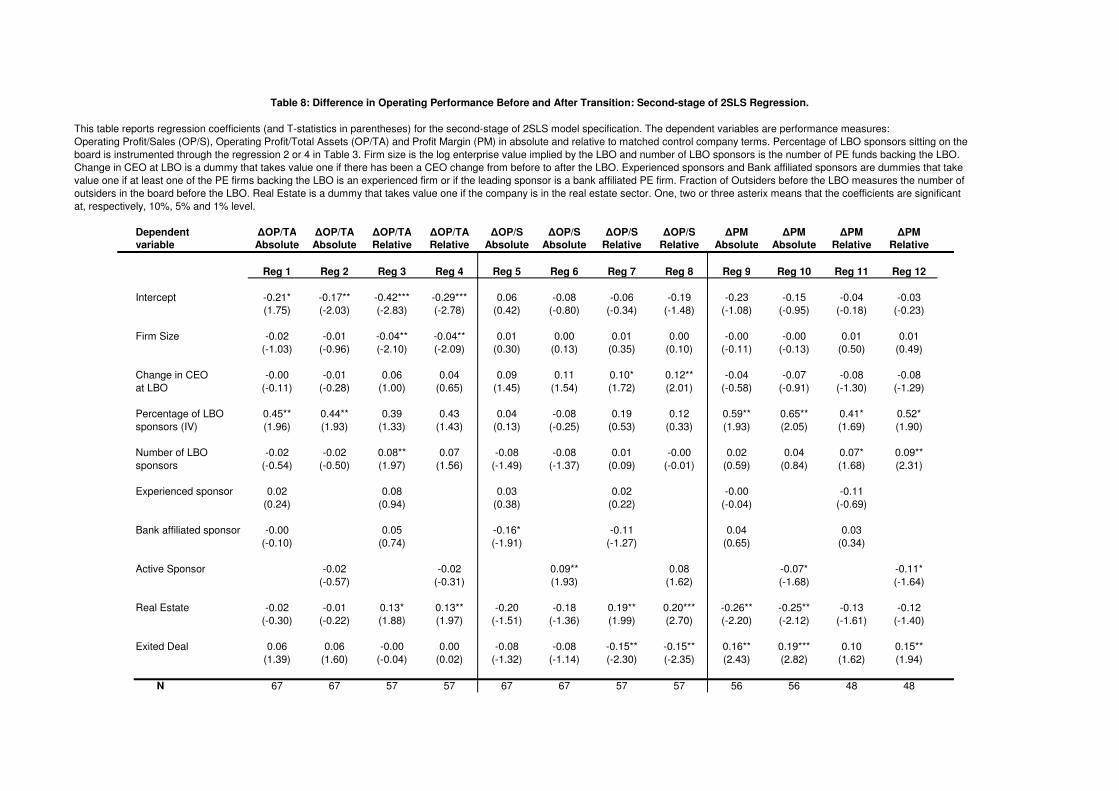
This table reports regression coefficients (and T-statistics in parentheses) for the second-stage of 2SLS model specification. The dependent variables are performance measures:Operating Profit/Sales (OP/S), Operating Profit/Total Assets (OP/TA) and Profit Margin (PM) in absolute and relative to matched control company terms. Percentage of LBO sponsors sitting on the board is instrumented through the regression 2 or 4 in Table 3. Firm size is the log enterprise value implied by the LBO and number of LBO sponsors is the number of PE funds backing the LBO. Change in CEO at LBO is a dummy that takes value one if there has been a CEO change from before to after the LBO. Experienced sponsors and Bank affiliated sponsors are dummies that take value one if at least one of the PE firms backing the LBO is an experienced firm or if the leading sponsor is a bank affiliated PE firm. Fraction of Outsiders before the LBO measures the number of outsiders in the board before the LBO. Real Estate is a dummy that takes value one if the company is in the real estate sector. One, two or three asterix means that the coefficients are significant at, respectively, 10%, 5% and 1% level.
Dependent �OP/TA �OP/TA �OP/TA �OP/TA �OP/S �OP/S �OP/S �OP/S �PM �PM �PM �PMvariable Absolute Absolute Relative Relative Absolute Absolute Relative Relative Absolute Absolute Relative Relative
Reg 1 Reg 2 Reg 3 Reg 4 Reg 5 Reg 6 Reg 7 Reg 8 Reg 9 Reg 10 Reg 11 Reg 12
Intercept -0.21* -0.17** -0.42*** -0.29*** 0.06 -0.08 -0.06 -0.19 -0.23 -0.15 -0.04 -0.03(1.75) (-2.03) (-2.83) (-2.78) (0.42) (-0.80) (-0.34) (-1.48) (-1.08) (-0.95) (-0.18) (-0.23)
Firm Size -0.02 -0.01 -0.04** -0.04** 0.01 0.00 0.01 0.00 -0.00 -0.00 0.01 0.01(-1.03) (-0.96) (-2.10) (-2.09) (0.30) (0.13) (0.35) (0.10) (-0.11) (-0.13) (0.50) (0.49)
Change in CEO -0.00 -0.01 0.06 0.04 0.09 0.11 0.10* 0.12** -0.04 -0.07 -0.08 -0.08at LBO (-0.11) (-0.28) (1.00) (0.65) (1.45) (1.54) (1.72) (2.01) (-0.58) (-0.91) (-1.30) (-1.29)
Percentage of LBO 0.45** 0.44** 0.39 0.43 0.04 -0.08 0.19 0.12 0.59** 0.65** 0.41* 0.52*sponsors (IV) (1.96) (1.93) (1.33) (1.43) (0.13) (-0.25) (0.53) (0.33) (1.93) (2.05) (1.69) (1.90)
Number of LBO -0.02 -0.02 0.08** 0.07 -0.08 -0.08 0.01 -0.00 0.02 0.04 0.07* 0.09**sponsors (-0.54) (-0.50) (1.97) (1.56) (-1.49) (-1.37) (0.09) (-0.01) (0.59) (0.84) (1.68) (2.31)
Experienced sponsor 0.02 0.08 0.03 0.02 -0.00 -0.11(0.24) (0.94) (0.38) (0.22) (-0.04) (-0.69)
Bank affiliated sponsor -0.00 0.05 -0.16* -0.11 0.04 0.03(-0.10) (0.74) (-1.91) (-1.27) (0.65) (0.34)
Active Sponsor -0.02 -0.02 0.09** 0.08 -0.07* -0.11*(-0.57) (-0.31) (1.93) (1.62) (-1.68) (-1.64)
Real Estate -0.02 -0.01 0.13* 0.13** -0.20 -0.18 0.19** 0.20*** -0.26** -0.25** -0.13 -0.12(-0.30) (-0.22) (1.88) (1.97) (-1.51) (-1.36) (1.99) (2.70) (-2.20) (-2.12) (-1.61) (-1.40)
Exited Deal 0.06 0.06 -0.00 0.00 -0.08 -0.08 -0.15** -0.15** 0.16** 0.19*** 0.10 0.15**(1.39) (1.60) (-0.04) (0.02) (-1.32) (-1.14) (-2.30) (-2.35) (2.43) (2.82) (1.62) (1.94)
N 67 67 57 57 67 67 57 57 56 56 48 48
Table 8: Difference in Operating Performance Before and After Transition: Second-stage of 2SLS Regression.
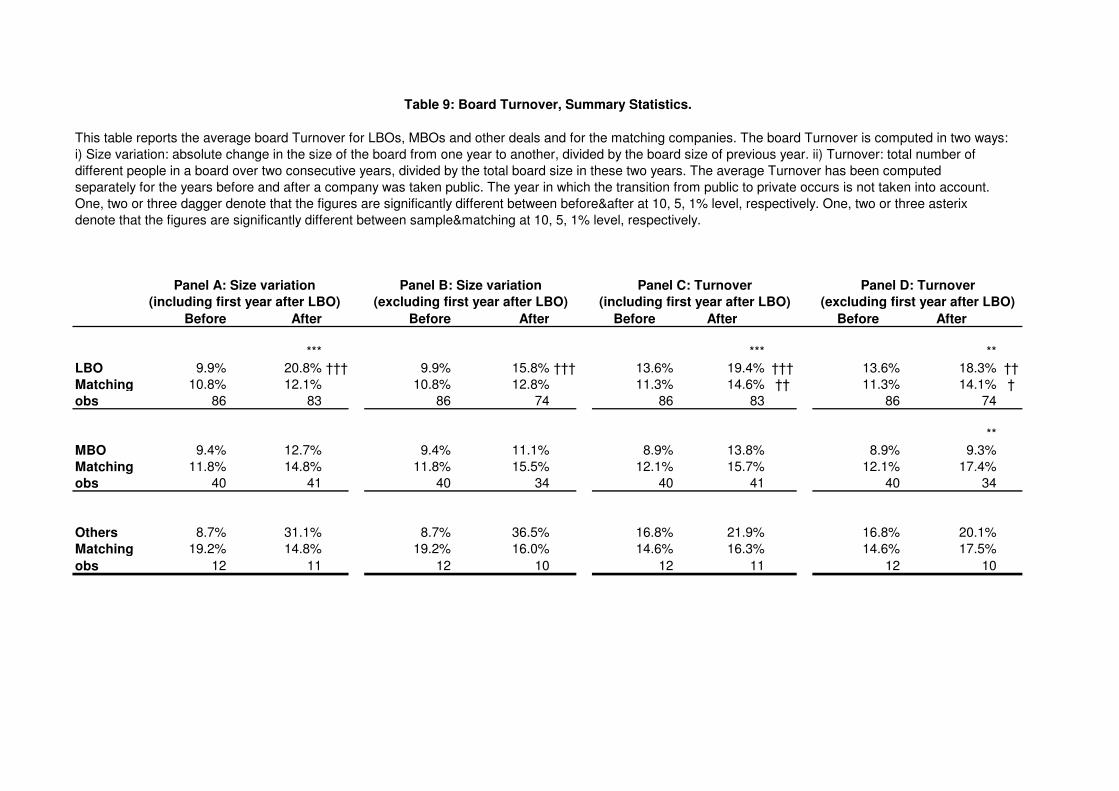
This table reports the average board Turnover for LBOs, MBOs and other deals and for the matching companies. The board Turnover is computed in two ways:i) Size variation: absolute change in the size of the board from one year to another, divided by the board size of previous year. ii) Turnover: total number of different people in a board over two consecutive years, divided by the total board size in these two years. The average Turnover has been computed separately for the years before and after a company was taken public. The year in which the transition from public to private occurs is not taken into account. One, two or three dagger denote that the figures are significantly different between before&after at 10, 5, 1% level, respectively. One, two or three asterixdenote that the figures are significantly different between sample&matching at 10, 5, 1% level, respectively.
Before After Before After Before After Before After
*** *** **LBO 9.9% 20.8% ††† 9.9% 15.8% ††† 13.6% 19.4% ††† 13.6% 18.3% ††Matching 10.8% 12.1% 10.8% 12.8% 11.3% 14.6% †† 11.3% 14.1% †obs 86 83 86 74 86 83 86 74
**MBO 9.4% 12.7% 9.4% 11.1% 8.9% 13.8% 8.9% 9.3%Matching 11.8% 14.8% 11.8% 15.5% 12.1% 15.7% 12.1% 17.4%obs 40 41 40 34 40 41 40 34
Others 8.7% 31.1% 8.7% 36.5% 16.8% 21.9% 16.8% 20.1%Matching 19.2% 14.8% 19.2% 16.0% 14.6% 16.3% 14.6% 17.5%obs 12 11 12 10 12 11 12 10
Panel D: Turnover(including first year after LBO) (excluding first year after LBO)
Table 9: Board Turnover, Summary Statistics.
Panel A: Size variation(including first year after LBO)
Panel B: Size variation(excluding first year after LBO)
Panel C: Turnover