IS SAARC REGION SUCCESSFUL IN PROMOTING...
29
* Department of Applied Economics, National Chung Hsing University, Taiwan ** Department of Finance, National Taichung University of Science and Technology Corresponding author E-mail: [email protected] IS SAARC REGION SUCCESSFUL IN PROMOTING INTRA-REGIONAL TRADE? EVIDENCE FROM BORDER EFFECT APPROACH Wei-Chig Chang * , Chung-Hsuan Wei ** and Kuo-I Chang * Abstract: This paper considers the South Asian Association for Regional Cooperation (SAARC) and gravity model is used to analyze the border effect of the SAARC regional trade bloc for the year, 1985 to 2009 and also panel analysis by pooling dataset into five-year interval and according to its integration to South Asian Preferential Trading Arrangement (SAPTA) in 1995 and then to South Asian Free Trade Agreement (SAFTA) in 2006. The results of the trade relationship between SAARC region and other regions shows that the coefficients are positively significant, indicating that the SAARC region trades with the above 5 regions are active. It was unexpected that the empirical result shows that SAARC region trade is more active with the European region and the Pacific region than with the Asian region countries. JEL classification codes: F1, R1 Keywords: SAARC; Border Effect 1. INTRODUCTION One of the significant recent trends in the international trade has been the gaining importance of the regional trade blocs (RTBs). Even after the launch of the World Trade Organization (WTO) multilateral trading system, the RTBs continue to spread. Under the RTBs, member countries have the advantage over non-member countries in facing less trade barriers. But still, national border remains a question as a barrier to trade. It was believed that national borders diminish the volumes of trade. This issue was suggested by McCallum (1995) who using the 1988 data of Canada provinces and states of United States (U.S.), shows that Canada intra- provincial trade is 22 times larger than its trade with the U.S. A number of factors that might act as barriers to trade and could cause the volume of domestic trade to exceed that of international trade, such as tariffs, non-tariff barriers, a high elasticity of substitution between imports and domestic goods, etc. are termed as the “border effect”. Since then, the border effect is given a great importance. I J A B E R, Vol. 14, No. 13, (2016): 9507-9535
Transcript of IS SAARC REGION SUCCESSFUL IN PROMOTING...
* Department of Applied Economics, National Chung Hsing University, Taiwan** Department of Finance, National Taichung University of Science and TechnologyCorresponding author E-mail: [email protected]
IS SAARC REGION SUCCESSFUL IN PROMOTINGINTRA-REGIONAL TRADE? EVIDENCE FROM
BORDER EFFECT APPROACH
Wei-Chig Chang*, Chung-Hsuan Wei** and Kuo-I Chang*
Abstract: This paper considers the South Asian Association for Regional Cooperation (SAARC)and gravity model is used to analyze the border effect of the SAARC regional trade bloc for theyear, 1985 to 2009 and also panel analysis by pooling dataset into five-year interval andaccording to its integration to South Asian Preferential Trading Arrangement (SAPTA) in1995 and then to South Asian Free Trade Agreement (SAFTA) in 2006. The results of thetrade relationship between SAARC region and other regions shows that the coefficients arepositively significant, indicating that the SAARC region trades with the above 5 regions areactive. It was unexpected that the empirical result shows that SAARC region trade is moreactive with the European region and the Pacific region than with the Asian region countries.
JEL classification codes: F1, R1
Keywords: SAARC; Border Effect
1. INTRODUCTION
One of the significant recent trends in the international trade has been the gainingimportance of the regional trade blocs (RTBs). Even after the launch of the WorldTrade Organization (WTO) multilateral trading system, the RTBs continue tospread. Under the RTBs, member countries have the advantage over non-membercountries in facing less trade barriers. But still, national border remains a questionas a barrier to trade. It was believed that national borders diminish the volumes oftrade. This issue was suggested by McCallum (1995) who using the 1988 data ofCanada provinces and states of United States (U.S.), shows that Canada intra-provincial trade is 22 times larger than its trade with the U.S. A number of factorsthat might act as barriers to trade and could cause the volume of domestic trade toexceed that of international trade, such as tariffs, non-tariff barriers, a high elasticityof substitution between imports and domestic goods, etc. are termed as the “bordereffect”. Since then, the border effect is given a great importance.
I J A B E R, Vol. 14, No. 13, (2016): 9507-9535
9508 � Wei-Chig Chang, Chung-Hsuan Wei and Kuo-I Chang
South Asian countries also formed the South Asian Association for RegionalCooperation (SAARC) in 1985 with 7 members, Bangladesh, Bhutan, India,Maldives, Nepal, Pakistan, and Sri Lanka, while Afghanistan joint in 2005 to becomethe 8th member. It was formed to accelerate the process of economic and socialdevelopment in Member States. The SAARC countries shares a lot of similaritiesin language, culture, and socio-economic conditions among themselves, whichare beneficial to members in terms of trade, but they are all poor, developingcountries and are less integrated among themselves, since there are political tension,conflicts and disputes among the SAARC members. SAARC region then formedthe Agreement on South Asian Preferential Trading Arrangement (SAPTA) on7th December, 1995, and later, the South Asian Free Trade Agreement (SAFTA)also came into being on 1st January, 2006. Thus, there is much dependency ontrade which would trigger large border effect in SAARC region. While accordingto Anderson and Wincoop (2003), small economies have large border effect. SAARCregion as a whole is a large economy. So, SAARC region must have a small bordereffect against rest of the world (RoW).
Thus, it isn’t sure about how large or small is the border effect of the SAARCregion against RoW and rest of regions, and the impact of SAPTA and SAFTA ontrade. So, this paper tries to figure out the resulting border effect in the SAARCregion.
There is no previous literature on border effect concerning the SAARC region,so this paper tries to investigate the border effect of the SAARC region and thedegree of integration between the SAARC member countries and its non-membercountries. The main purposes of this paper are: (1) To estimate the border effect ofthe SAARC region against RoW from 1985 to 2009, and then pooling the data into 5-year interval and also as according to the formation of SAPTA in 1995 and SAFTA in2006, in order to analyze the border effect pattern of SAARC region with the signingof SAPTA and SAFTA; (2) To estimate region-wise border effect of the SAARC regionseparately against African region, American region, Asian region, European region,and Pacific region, respectively; and (3) To analyze the trade relationship betweenthe SAARC region and other 5 regions, namely, 4 African Countries (Egypt, Kenya,South Africa, and Swaziland), 5 American Countries (Argentina, Brazil, Canada,United States, and Mexico), 9 Asian Countries (China, Indonesia, Iran, Japan, SouthKorea, Saudi Arabia, Singapore, Thailand, and United Arab Emirates), 8 EuropeanCountries (Belgium, France, Germany, Italy, Netherland, Spain, Switzerland, andUnited Kingdom), and 2 Pacific Countries (Australia and New Zealand), in order tofind empirical evidence whether such trade relationship is active or not. Active meansthere is dependency of trade between SAARC region and other regions trade, i.e.gradually increase of trades with each other.
To achieve these objectives, the other parts of this paper are structured asfollows: Section 2 introduces the literature reviews on relevant SAARC trade and
Is SAARC Region Successful in Promoting Intra-Regional Trade? � 9509
border effect studies. Section 3 discusses the empirical methodology on estimatingthe border effect of SAARC region and also its trade relationship with other regions.Section 4 discusses the empirical results. Lastly, concluding remarks in Section 5.
2. RESEARCH BACKGROUND
2.1. Reviews on SAARC using Gravity Model
Hassan (2001) was first to use gravity model in the study of SAARC trade using 27countries cross-section data for the year, 1996 and 1997. He finds low intra-SAARCtrade and SAARC countries as a whole trade less internationally and also suggeststhat SAARC region were neither trade creating nor trade diverting. Hirantha (2004)uses both panel data and cross sectional data for the period from 1996 to 2002 toevaluate how trade between SAARC countries has changed over time from SAPTAto SAFTA using gravity model. She also finds that intra-SAARC and internationaltrade has fallen. However, evidence show a significant trade creation effect underSAPTA and find no evidence of trade diversion effect with the rest of the world.Moktan (2009) instead uses the volume of export as gravity model dependentvariable to examine the effect of trade agreement among SAARC countries andalso examine whether intra-SAARC export trade had increased through theenforcement of SAPTA. He finds no indication of the effect of trade agreement onexport for the pre-SAARC periods but the post-SAARC periods has a significantand positive effect. He further find that this positive effect of trade agreement onexport resulted from the combined effect of the impact of SAPTA and also the lateimpact of the existing trade agreements.
2.2. Reviews of Border Effect Gravity Model
Ohmae (1990) made a statement about borderless world. In other words, nationalborders are less relevant than ever before because of the rise in growth ofPreferential Trade Agreement during the end of 20th century. Similar to Tinbergen(1962), Linneman (1966), and Frankel (1993), McCallum (1995) then first introducedborder effect of Canada and U.S. for the year 1988 and found Canada intra-provincial trade to be 22 times larger than trade between Canada and U.S. Sincethen, the issue of border effect had initiated many research works. Helliwell (1996)extended the estimated year from 1988 to 1996, and found little variations in theborder effect and internal trade linkages are far stronger than was previouslythought to be. Engel and Rogers (1996) instead use consumer price index (CPI)data of 14 U.S. and 9 Canadian cities for 14 categories of consumer goods to examinethe nature of the deviations from the law of one price. Both distance and the borderare found to be significant in explaining variation of price across locations. Hillberry(1998) uses a special tabulation of the Commodity Flow Survey (CFS) to estimatethe border effect from the U.S. side. It was surprising that he finds an estimate
9510 � Wei-Chig Chang, Chung-Hsuan Wei and Kuo-I Chang
quite similar to McCallum (1995) aggregate border effect of 20.9, as the data werequite different. Anderson and wincoop (2003) using 1993 data and allowing for‘multilateral resistance’ to vary significantly across regions, and found that theCanada and U.S. border effect is reduced to 10.5, while using the McCallum (1995)specification is 16.5. Feenstra (2002) also does the similar comparisons. Ceglowski(2000) uses the gravity model to investigate whether the impact of the Canada-USborder on Canada’s continental trading patterns from 1988 to 1996 has fallen sincethe Free Trade Area (FTA) and the North American Free Trade Area (NAFTA)went into effect in 1989 and 1994, respectively. It was found that Canadian provincestrade 21 times to 23 times more with one another than with US states. Rogers andSmith (2001) differs from Engel and Rogers (1996) with the addition of Mexico toestimate border effects on relative prices within the NAFTA countries. They foundthat over the sample period from 1980 to 1997, the border effect in U.S.-Mexicanprices is larger than in Canadian prices-U.S.
Trefler (1995) shows how home bias helps to explain why internal trade withina country is more than international trade with other countries. Evidence of homebias is found in Canada-U.S. by McCallum (1995), Helliwell (1996) and Wall (2000);U.S. by Wolf (2000); Organization for Economic Cooperation and Development(OECD) by Wei (1996) and Evans (2003). Obstfeld and Rogoff (2001) identify homebias as a “border puzzle,” one of the six major puzzles in international economics.Wolf (2000) finds that home bias is also present within U.S., and suggests thepresence of other causes of excessive home trade.
Coming to border effect in European Countries, following Wei (1996) andHelliwell (1996), Nitsch (2000) estimated the impact of national border on countrieswithin the European Union (EU) for a period from 1979 to 1990. He uses a differentmeasure for estimating the average intra-national distances and found that althoughthe EU is highly integrated, EU still trade about 7 to 10 times more internally thanto its partner country. Head and Mayer (2000) also find that even after the virtualelimination of tariff and quotas in 1968 and the attempt to reduce NTBs between1986 and 1992 through the Single Market Programme, borders still impacted tradewithin the EU.
Motivated by the likely causes of the border effect Chen (2004) uses the standardgravity equation model of 7 EU countries and 78 industries in the year 1996 andtakes into account Wei (1996) and Leamer (1997) distance measure and her ownweighted average measures using GDP weights. With her own method of distancemeasure; the border effect is found to be smaller than Wei (1996) and Leamer(1997) distance measure and EU country trades about 6 times more with itselfthan with foreign EU countries.
Olper and Raimondi (2008) use the gravity-border effect methodology toanalyze the process and the level of agricultural trade integration between 22 OECD
Is SAARC Region Successful in Promoting Intra-Regional Trade? � 9511
countries over 10 years, from 1994 to 2003. Their estimate of intra-national trade ismore than 13 times that of trade with other OECD countries.
For Asian countries, Okubo (2004) analyze Japan’s intra-regional trade for theperiod from 1960 to 1990, and find that the border effect in Japan to declinedremarkably between 1960 and 1990 due to trade liberalization, reduction of tariffrates and NTBs, and the increases in the outward foreign direct investment (FDI).Fukao and Okubo (2004) uses gravity equation to analyze the causes of the declinein Japan’s border effect from 1980 to 1995 for Japan’s international and intra-regionaltrade in 4 machinery industries. Results show that in 1990, in the case of generalmachinery, intra-regional trade in Japan is more than 2.79 times the Japan’sinternational trade; and in the case of transportation equipment, more than 4.60times. While, in the case of electrical machinery and precision machinery, theestimated border effects from 1990 to 1995 are negative.
3. METHODOLOGY
Similar to McCallum (1995), this paper assume SAARC region to represent acountry, where the 8 member countries bilateral trade among themselves are itsdomestic trade, while bilateral trade with the non-member countries are itsinternational trade. So country border line is drawn around the SAARC countries.Data Sample consist of both bilateral exports and imports Standard InternationalTrade Classification (SITC) Rev.1 data for the 8 SAARC countries bilateral pairobservations and also bilateral pair observations between SAARC countries and194 non-member countries over the period of 25 years, from 1985 to 2009. List ofcountries are shown in Appendix A. This paper used both the ordinary least squares(OLS) and random effect regression for empirical analysis.
In order to explore the impact of national borders of SAARC on trade flowsthrough estimating the border effect of SAARC from 1985 to 2009, this paper setup a conventional Gravity Model of international trade and thus the Gravity Modelused is the familiar log-linear-type function1:
Model I a : lnTradeij = �1 + �2 lnGdpi + �3 lnGdpj + �4 lnDistij + �5 Saarcij + �ij (1)
Where, i denotes exporting country while j is importing country, and the variablesare defined as: Tradeij denotes bilateral trade between two countries, i and j; Gdpiand Gdpj denotes GDP of country i and j, respectively; Distij denotes the distancebetween i and j; Saarcij is South Asian Association for Regional Cooperation borderdummy variable, which is 1 if i and j are member of this agreement, and 0 otherwise;and �ij denotes random error terms. The parameters to be estimated are denotedby �.
In order to allow for Panel regression, time-series and country and destinationspecific effects (�ij) are included to equation (1) to form Model I b:
9512 � Wei-Chig Chang, Chung-Hsuan Wei and Kuo-I Chang
Model I b : lnTradeijt = �1 + �2 lnGdpit + �3 lnGdpjt + �4 lnDistijt + �5 Saarcijt + µij + �ijt
(2)
Where, Tradeijt, Gdpit, Gdpjt, and Distijt variables only differ from the definition asdefined in equation (1) with the inclusion of time variable (t).
Above Model‘!is to analyze the border effect of SAARC region against RoW,that is, how much times is the intra-SAARC region trade over its trade with RoW.This paper also analyzes region-wise SAARC border effect by dividing the RoWinto 5 main regions, i.e. Africa, America, Asia, Europe, and Pacific2. Thus the region-wise SAARC border effect gravity model and adding common border and languagedummy variables, Model a! are as given below:
Model IIa : lnTradeijt = �1 + �2 lnGdpit + �3 lnGdpjt + �4 lnDistijt + �5 Contigijt+��6 Langijt + �7 Saarc_Afijt + µij + �ijt (3)
Model IIb : lnTradeijt = �1 + �2 lnGdpit + �3 lnGdpjt + �4 lnDistijt + �5 Contigijt + �6Langijt + �7 Saarc_Amijt + µij + �ijt (4)
Model IIc : lnTradeijt = �1 + �2 lnGdpit + �3 lnGdpjt + �4 lnDistijt + �5 Contigijt + �6Langijt + �7 Saarc_Asijt + µij + �ijt (5)
Model IId : lnTradeijt = �1 + �2 lnGdpit + �3 lnGdpjt + �4 lnDistijt + �5 Contigijt + �6Langijt + �7 Saarc_Euijt + µij + �ijt (6)
Model IIe : lnTradeijt = �1 + �2 lnGdpit + �3 lnGdpjt + �4 lnDistijt + �5 Contigijt + �6Langijt + �7 Saarc_Paijt + µij + �ijt (7)
Where, Where, Tradeijt, Gdpit, Gdpjt, and Distijt variables are similar to as defined inequation (2); Contigij is a dummy variable which is 1 if i and j share a commonborder, and 0 otherwise; Langij is a dummy variable which is 1 if i and j share acommon language, and 0 otherwise; Saarc_Afijt, Saarc_Amijt, Saarc_Asijt, Saarc_Euijt,and Saarc_Paijt are the border dummy variable, which is 1 if i and j belongs to theSAARC region, and 0, if i or j belongs to an African region, American region, Asianregion, European region, and Pacific region, respectively.
This paper also analyze the impact on trade relationship between SAARCcountries and 4 African Countries, 5 American Countries, 9 Asian Countries, 8European Countries, and 2 Pacific Countries3. Replacing the SAARC border dummyvariable of Modela!by dummy variables of African Countries, American Countries,Asian Countries, European Countries, and Pacific Countries, respectively; Modelb! is formed and is given below:
Model III: lnTradeijt = �1 + �2 lnGdpit + �3 lnGdpjt + �4 lnDistijt + �5 Contigijt + �6Langijt + �7 S_Africaijt + �8 S_Americaijt + �9 S_Asiaijt + �10 S_Europeijt + �11 S_Pacificijt+ �ij + �ijt (8)
Is SAARC Region Successful in Promoting Intra-Regional Trade? � 9513
Where, S_Africaij, S_Americaij, S_Asiaij, S_Europeij, and S_Pacificij are dummyvariables, which is 1 if i (j) is SAARC countries and j (i) are the 4 African countries,5 American countries, 9 Asian countries, 8 European countries, and 2 Pacificcountries, respectively; and 0 otherwise.
4. EMPIRICAL RESULTS
OLS regression are used in Model I a for cross-sectional analysis of the bordereffect, while in case of Model I b, Model II, and Model III, panel random effectregressions are used for five-year interval and also according to its integration4.
4.1. The Border Effect of SAARC Region
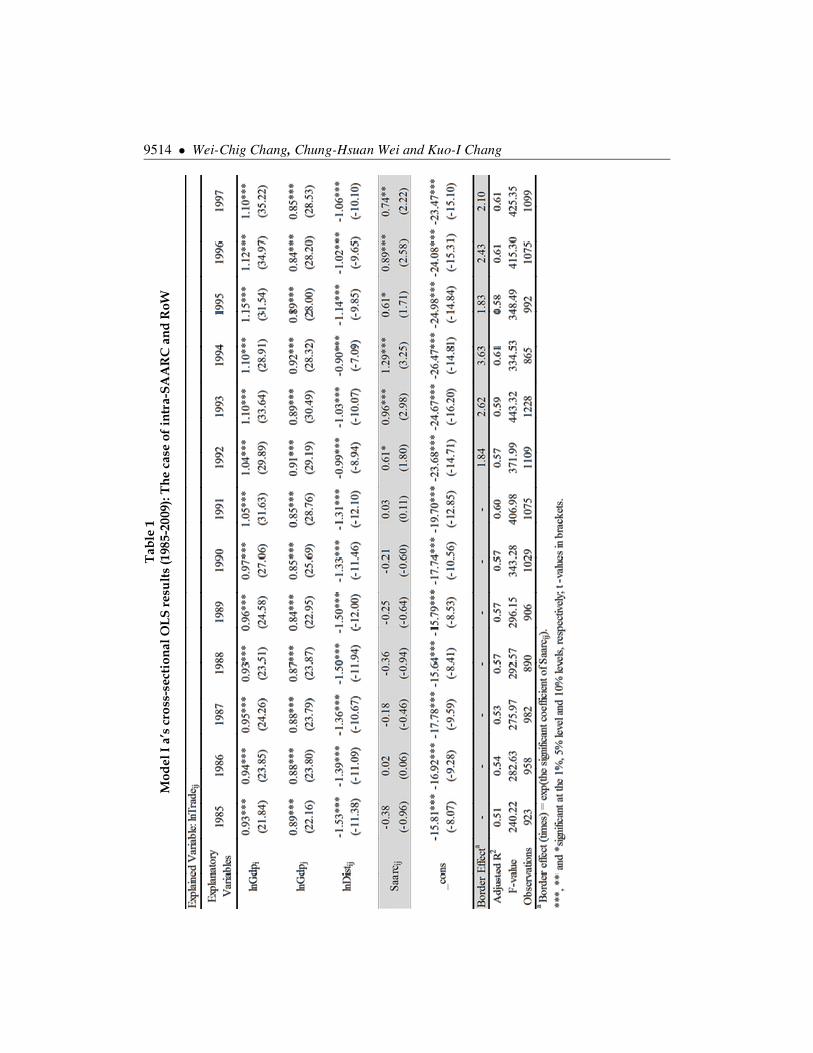
Firstly, Table 1. shows the empirical results of model I a using OLS regression ofthe year from 1985 to 2009. The result of the basic gravity model variables are allsignificant and have shown expected signs.
The SAARC border dummy variable is the main variable of interest in thispaper. Since the border effect of SAARC region is calculated using the coefficientof this border dummy variable, which will be discussed below. The coefficients ofSAARC dummy variable are positive except for the year: 1985, 1987, 1988, 1989,and 1990 which are negative and only significant for the year: 1992 to 1999, 2003,2006, 2008, and 2009. The significant SAARC border dummy coefficients are allpositive and tend to be of increasing trend5. But there are conflicting results, as forthe comparisons of the significant year SAARC border dummy’s coefficientbetween 1994 and 1995; The SAARC border dummy’s coefficient for the year 1994(1.29) is greater than the coefficient for the year 1995 (0.61), but testing the SAARCborder dummy’s coefficient using Wald test, indicate opposite relationship, i.e.the SAARC border dummy’s coefficient for the year 1994 is less than the coefficientfor the year 1995. Similarly, comparison between 1996 and 1997; 1998 and 1999;and 2003 and 2006, also has conflicting relationship.
According to many literatures such as McCallum (1995), Ceglowski (2000),Nitsch (2000), Okubo (2004), etc., the border effect is calculated through exponentialof the coefficient of the country or region dummy variable6. That is:
Border effect (times) = exp [significant coefficient of border variable]7
Where, border effect denotes how much times the bilateral trade within acountry or region greater than its international trade, which also indicate that withtrade agreement such as Free Trade Agreement, the countries or region within thetrade agreement has the privileges of lessening trade barriers among themselves,so there is more trade barriers for countries or region outside the trade agreement.
The border effects of the SAARC region is calculated according to the aboveformula and are as shown Table 1. The significant border effects of SAARC region
9514 � Wei-Chig Chang, Chung-Hsuan Wei and Kuo-I ChangT
able
1M
odel
I a
’s c
ross
-sec
tion
al O
LS
resu
lts
(198
5-20
09):
The
cas
e of
intr
a-SA
AR
C a
nd R
oW
Is SAARC Region Successful in Promoting Intra-Regional Trade? � 9515
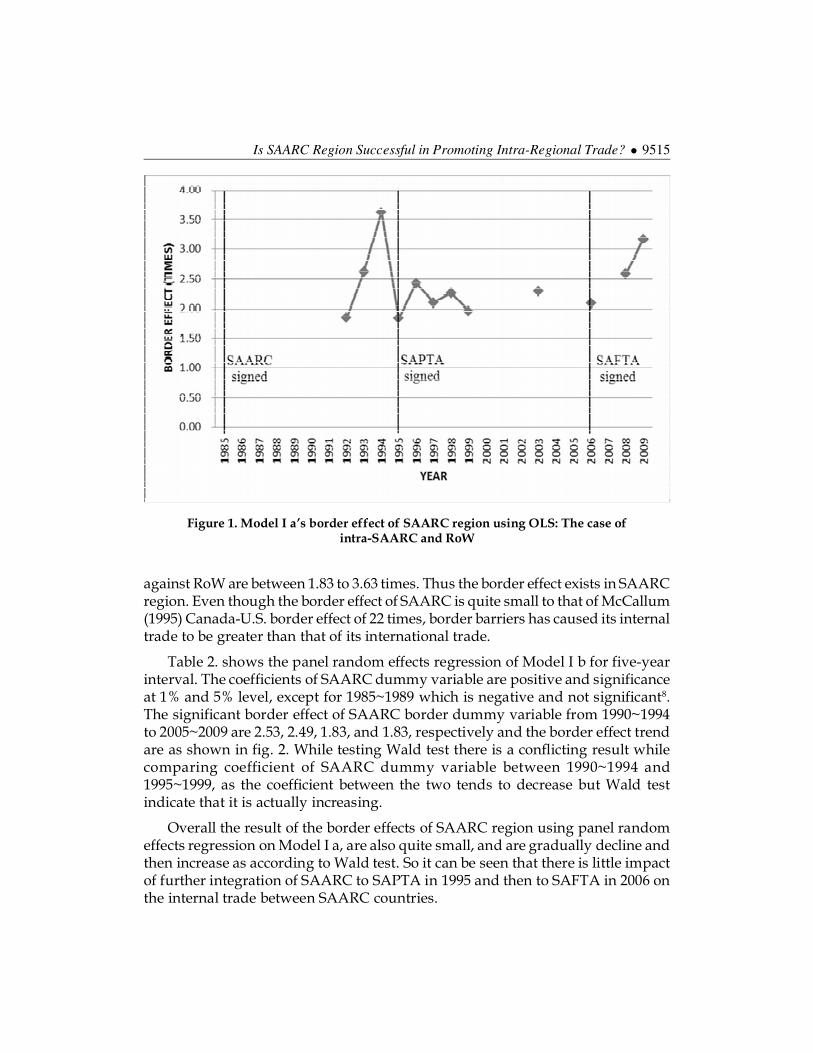
against RoW are between 1.83 to 3.63 times. Thus the border effect exists in SAARCregion. Even though the border effect of SAARC is quite small to that of McCallum(1995) Canada-U.S. border effect of 22 times, border barriers has caused its internaltrade to be greater than that of its international trade.
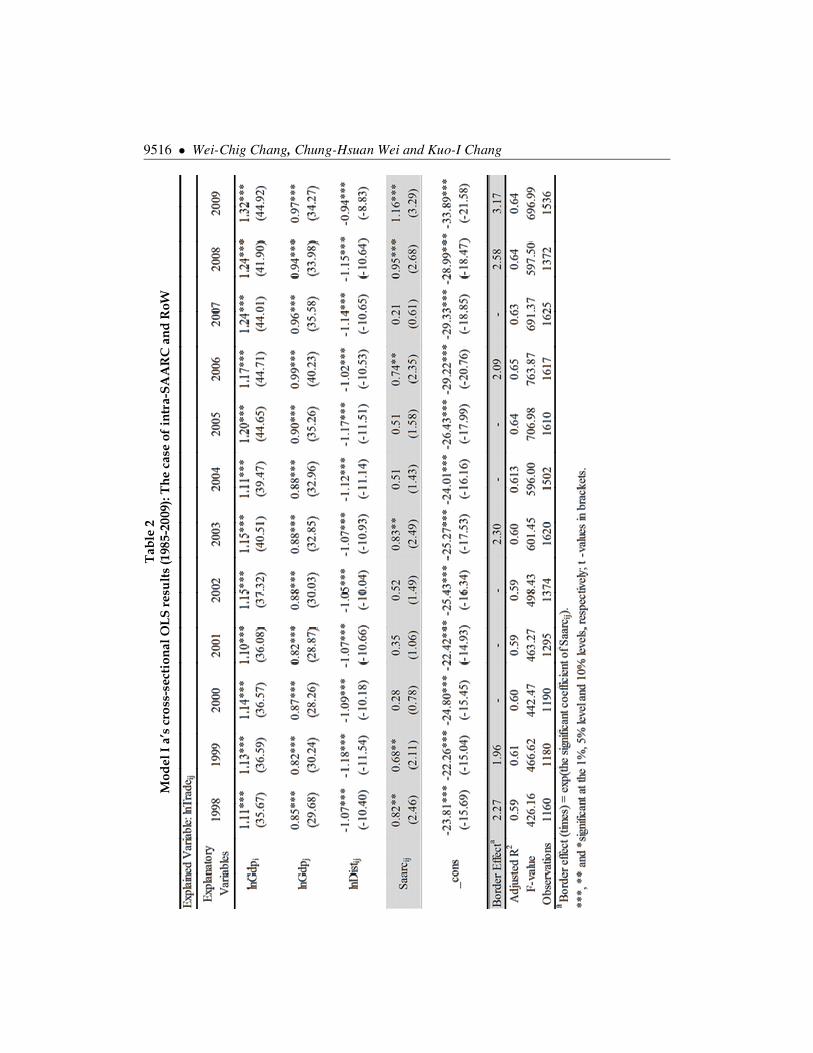
Table 2. shows the panel random effects regression of Model I b for five-yearinterval. The coefficients of SAARC dummy variable are positive and significanceat 1% and 5% level, except for 1985~1989 which is negative and not significant8.The significant border effect of SAARC border dummy variable from 1990~1994to 2005~2009 are 2.53, 2.49, 1.83, and 1.83, respectively and the border effect trendare as shown in fig. 2. While testing Wald test there is a conflicting result whilecomparing coefficient of SAARC dummy variable between 1990~1994 and1995~1999, as the coefficient between the two tends to decrease but Wald testindicate that it is actually increasing.
Overall the result of the border effects of SAARC region using panel randomeffects regression on Model I a, are also quite small, and are gradually decline andthen increase as according to Wald test. So it can be seen that there is little impactof further integration of SAARC to SAPTA in 1995 and then to SAFTA in 2006 onthe internal trade between SAARC countries.
Figure 1. Model I a’s border effect of SAARC region using OLS: The case ofintra-SAARC and RoW
9516 � Wei-Chig Chang, Chung-Hsuan Wei and Kuo-I ChangT
able
2M
odel
I a
’s c
ross
-sec
tion
al O
LS
resu
lts
(198
5-20
09):
The
cas
e of
intr
a-SA
AR
C a
nd R
oW
Is SAARC Region Successful in Promoting Intra-Regional Trade? � 9517
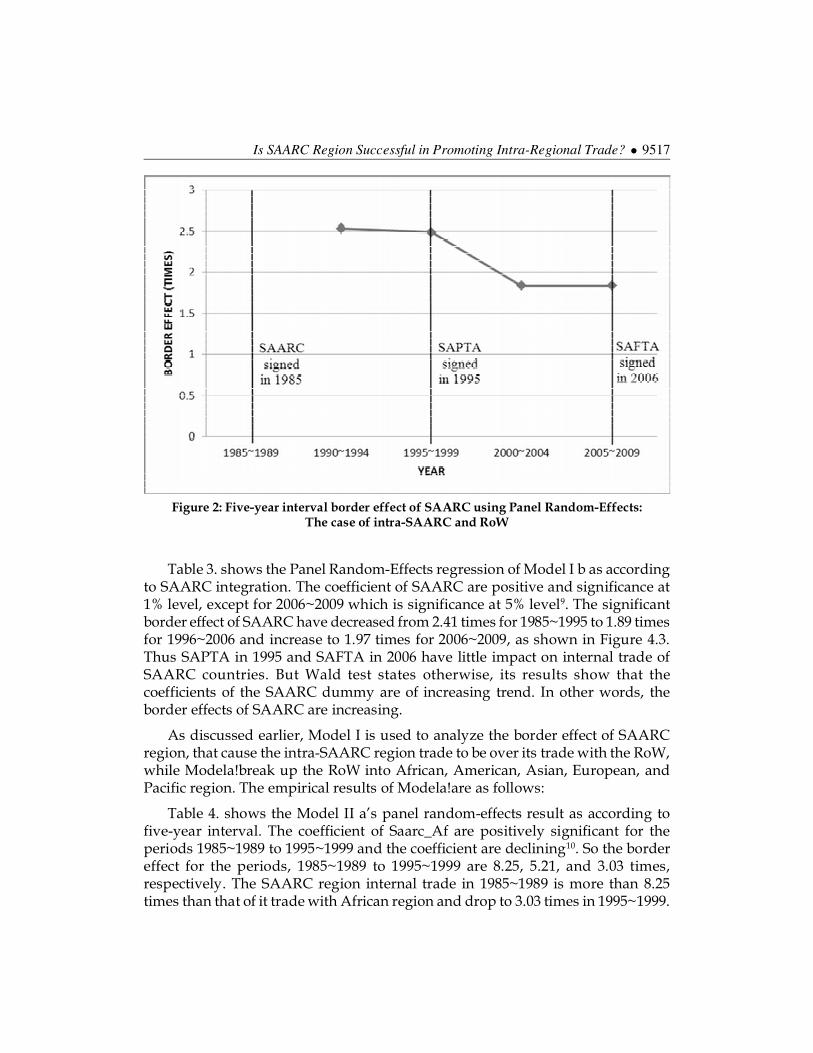
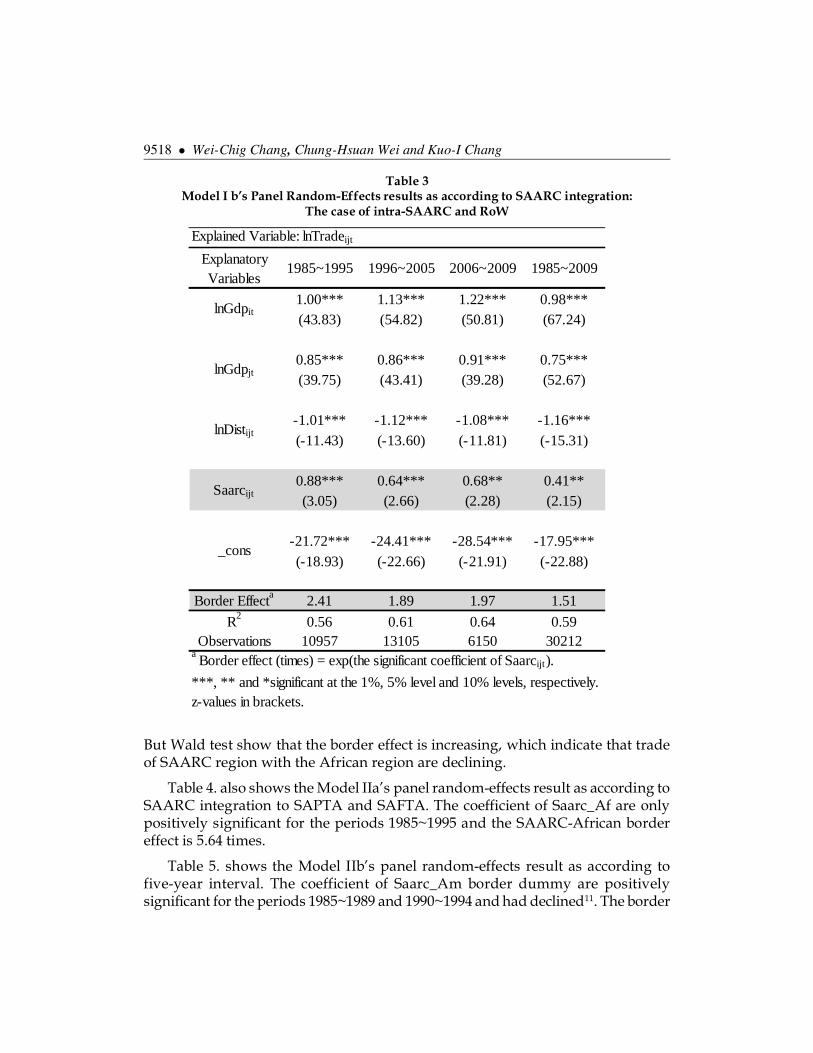
Table 3. shows the Panel Random-Effects regression of Model I b as accordingto SAARC integration. The coefficient of SAARC are positive and significance at1% level, except for 2006~2009 which is significance at 5% level9. The significantborder effect of SAARC have decreased from 2.41 times for 1985~1995 to 1.89 timesfor 1996~2006 and increase to 1.97 times for 2006~2009, as shown in Figure 4.3.Thus SAPTA in 1995 and SAFTA in 2006 have little impact on internal trade ofSAARC countries. But Wald test states otherwise, its results show that thecoefficients of the SAARC dummy are of increasing trend. In other words, theborder effects of SAARC are increasing.
As discussed earlier, Model I is used to analyze the border effect of SAARCregion, that cause the intra-SAARC region trade to be over its trade with the RoW,while Modela!break up the RoW into African, American, Asian, European, andPacific region. The empirical results of Modela!are as follows:
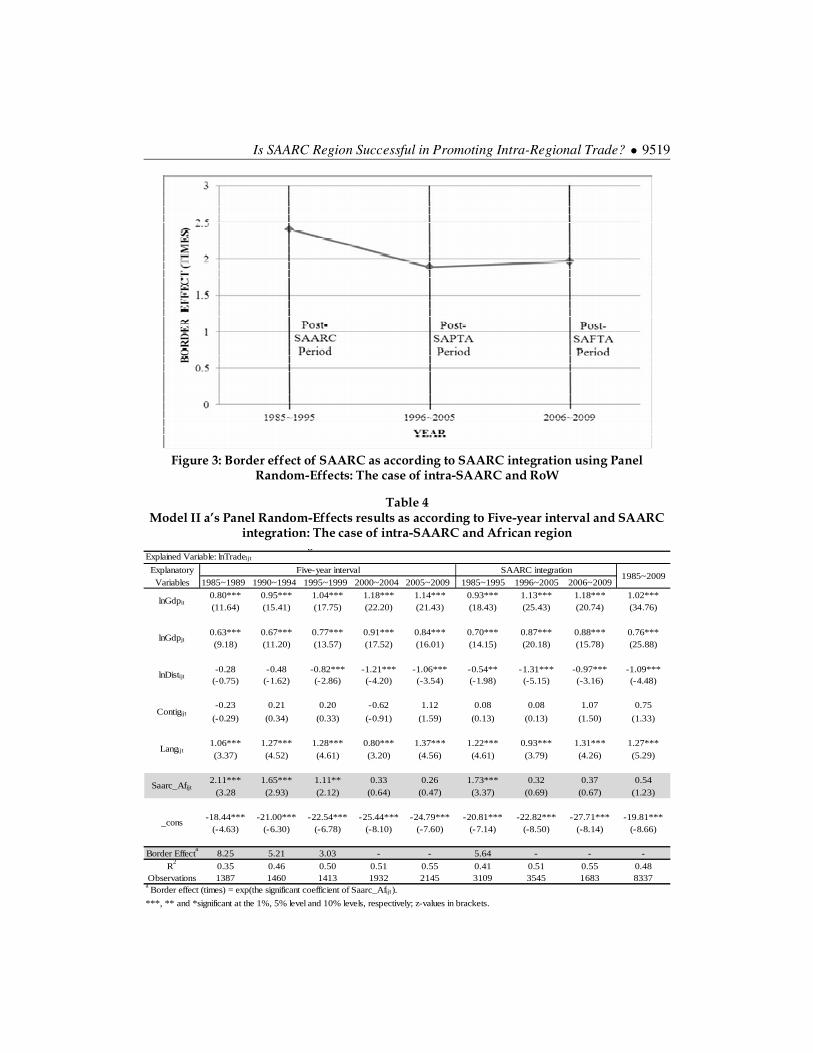
Table 4. shows the Model II a’s panel random-effects result as according tofive-year interval. The coefficient of Saarc_Af are positively significant for theperiods 1985~1989 to 1995~1999 and the coefficient are declining10. So the bordereffect for the periods, 1985~1989 to 1995~1999 are 8.25, 5.21, and 3.03 times,respectively. The SAARC region internal trade in 1985~1989 is more than 8.25times than that of it trade with African region and drop to 3.03 times in 1995~1999.
Figure 2: Five-year interval border effect of SAARC using Panel Random-Effects:The case of intra-SAARC and RoW
9518 � Wei-Chig Chang, Chung-Hsuan Wei and Kuo-I Chang
But Wald test show that the border effect is increasing, which indicate that tradeof SAARC region with the African region are declining.
Table 4. also shows the Model IIa’s panel random-effects result as according toSAARC integration to SAPTA and SAFTA. The coefficient of Saarc_Af are onlypositively significant for the periods 1985~1995 and the SAARC-African bordereffect is 5.64 times.
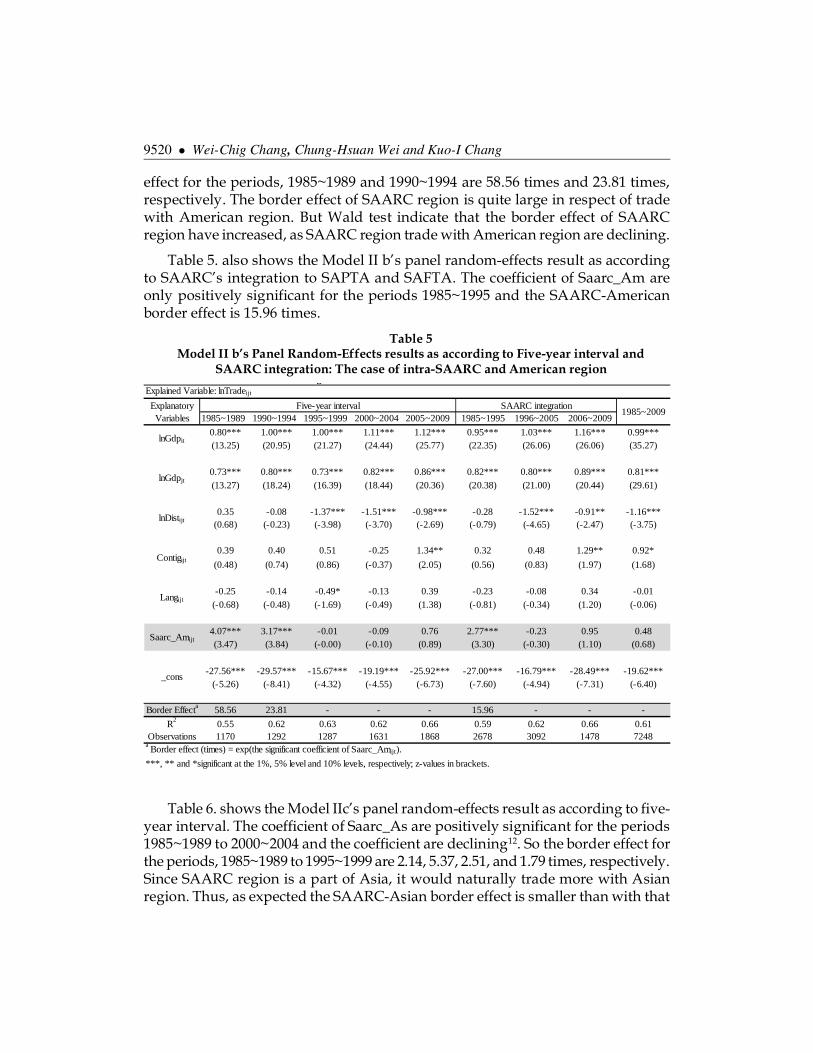
Table 5. shows the Model IIb’s panel random-effects result as according tofive-year interval. The coefficient of Saarc_Am border dummy are positivelysignificant for the periods 1985~1989 and 1990~1994 and had declined11. The border
Explained Variable: lnTradeijt
ExplanatoryVariables
1.00*** 1.13*** 1.22*** 0.98***(43.83) (54.82) (50.81) (67.24)
0.85*** 0.86*** 0.91*** 0.75***(39.75) (43.41) (39.28) (52.67)
-1.01*** -1.12*** -1.08*** -1.16***(-11.43) (-13.60) (-11.81) (-15.31)
0.88*** 0.64*** 0.68** 0.41**(3.05) (2.66) (2.28) (2.15)
-21.72*** -24.41*** -28.54*** -17.95***(-18.93) (-22.66) (-21.91) (-22.88)
Border Effecta 2.41 1.89 1.97 1.51
R2 0.56 0.61 0.64 0.59Observations 10957 13105 6150 30212
a Border effect (times) = exp(the significant coefficient of Saarcijt).
***, ** and *significant at the 1%, 5% level and 10% levels, respectively.z-values in brackets.
1985~1995 1996~2005
_cons
2006~2009 1985~2009
lnGdpit
lnGdpjt
lnDistijt
Saarcijt
Table 3Model I b’s Panel Random-Effects results as according to SAARC integration:
The case of intra-SAARC and RoW
Is SAARC Region Successful in Promoting Intra-Regional Trade? � 9519
Figure 3: Border effect of SAARC as according to SAARC integration using PanelRandom-Effects: The case of intra-SAARC and RoW
The case of intra-SAARC and African region Explained Variable: lnTradeijt
ExplanatoryVariables 1985~1989 1990~1994 1995~1999 2000~2004 2005~2009 1985~1995 1996~2005 2006~2009
0.80*** 0.95*** 1.04*** 1.18*** 1.14*** 0.93*** 1.13*** 1.18*** 1.02***(11.64) (15.41) (17.75) (22.20) (21.43) (18.43) (25.43) (20.74) (34.76)
0.63*** 0.67*** 0.77*** 0.91*** 0.84*** 0.70*** 0.87*** 0.88*** 0.76***(9.18) (11.20) (13.57) (17.52) (16.01) (14.15) (20.18) (15.78) (25.88)
-0.28 -0.48 -0.82*** -1.21*** -1.06*** -0.54** -1.31*** -0.97*** -1.09***(-0.75) (-1.62) (-2.86) (-4.20) (-3.54) (-1.98) (-5.15) (-3.16) (-4.48)
-0.23 0.21 0.20 -0.62 1.12 0.08 0.08 1.07 0.75
(-0.29) (0.34) (0.33) (-0.91) (1.59) (0.13) (0.13) (1.50) (1.33)
1.06*** 1.27*** 1.28*** 0.80*** 1.37*** 1.22*** 0.93*** 1.31*** 1.27***(3.37) (4.52) (4.61) (3.20) (4.56) (4.61) (3.79) (4.26) (5.29)
2.11*** 1.65*** 1.11** 0.33 0.26 1.73*** 0.32 0.37 0.54(3.28 (2.93) (2.12) (0.64) (0.47) (3.37) (0.69) (0.67) (1.23)
-18.44*** -21.00*** -22.54*** -25.44*** -24.79*** -20.81*** -22.82*** -27.71*** -19.81***(-4.63) (-6.30) (-6.78) (-8.10) (-7.60) (-7.14) (-8.50) (-8.14) (-8.66)
Border Effecta
8.25 5.21 3.03 - - 5.64 - - -
R2
0.35 0.46 0.50 0.51 0.55 0.41 0.51 0.55 0.48Observations 1387 1460 1413 1932 2145 3109 3545 1683 8337
a Border effect (times) = exp(the significant coefficient of Saarc_Afijt).
***, ** and *significant at the 1%, 5% level and 10% levels, respectively; z-values in brackets.
Langijt
1985~2009
lnGdpit
lnGdpjt
Saarc_Afijt
_cons
Five-year interval SAARC integration
lnDistijt
Contigijt
Table 4Model II a’s Panel Random-Effects results as according to Five-year interval and SAARC
integration: The case of intra-SAARC and African region
9520 � Wei-Chig Chang, Chung-Hsuan Wei and Kuo-I Chang
effect for the periods, 1985~1989 and 1990~1994 are 58.56 times and 23.81 times,respectively. The border effect of SAARC region is quite large in respect of tradewith American region. But Wald test indicate that the border effect of SAARCregion have increased, as SAARC region trade with American region are declining.
Table 5. also shows the Model II b’s panel random-effects result as accordingto SAARC’s integration to SAPTA and SAFTA. The coefficient of Saarc_Am areonly positively significant for the periods 1985~1995 and the SAARC-Americanborder effect is 15.96 times.
The case of intra-SAARC and American regionExplained Variable: lnTradeijt
ExplanatoryVariables 1985~1989 1990~1994 1995~1999 2000~2004 2005~2009 1985~1995 1996~2005 2006~2009
0.80*** 1.00*** 1.00*** 1.11*** 1.12*** 0.95*** 1.03*** 1.16*** 0.99***(13.25) (20.95) (21.27) (24.44) (25.77) (22.35) (26.06) (26.06) (35.27)
0.73*** 0.80*** 0.73*** 0.82*** 0.86*** 0.82*** 0.80*** 0.89*** 0.81***(13.27) (18.24) (16.39) (18.44) (20.36) (20.38) (21.00) (20.44) (29.61)
0.35 -0.08 -1.37*** -1.51*** -0.98*** -0.28 -1.52*** -0.91** -1.16***(0.68) (-0.23) (-3.98) (-3.70) (-2.69) (-0.79) (-4.65) (-2.47) (-3.75)
0.39 0.40 0.51 -0.25 1.34** 0.32 0.48 1.29** 0.92*
(0.48) (0.74) (0.86) (-0.37) (2.05) (0.56) (0.83) (1.97) (1.68)
-0.25 -0.14 -0.49* -0.13 0.39 -0.23 -0.08 0.34 -0.01(-0.68) (-0.48) (-1.69) (-0.49) (1.38) (-0.81) (-0.34) (1.20) (-0.06)
4.07*** 3.17*** -0.01 -0.09 0.76 2.77*** -0.23 0.95 0.48(3.47) (3.84) (-0.00) (-0.10) (0.89) (3.30) (-0.30) (1.10) (0.68)
-27.56*** -29.57*** -15.67*** -19.19*** -25.92*** -27.00*** -16.79*** -28.49*** -19.62***(-5.26) (-8.41) (-4.32) (-4.55) (-6.73) (-7.60) (-4.94) (-7.31) (-6.40)
Border Effecta 58.56 23.81 - - - 15.96 - - -
R2
0.55 0.62 0.63 0.62 0.66 0.59 0.62 0.66 0.61Observations 1170 1292 1287 1631 1868 2678 3092 1478 7248
a Border effect (times) = exp(the significant coefficient of Saarc_Amijt).
***, ** and *significant at the 1%, 5% level and 10% levels, respectively; z-values in brackets.
Langijt
1985~2009
lnGdpit
lnGdpjt
Saarc_Amijt
_cons
Five-year interval SAARC integration
lnDistijt
Contigijt
Table 5Model II b’s Panel Random-Effects results as according to Five-year interval and
SAARC integration: The case of intra-SAARC and American region
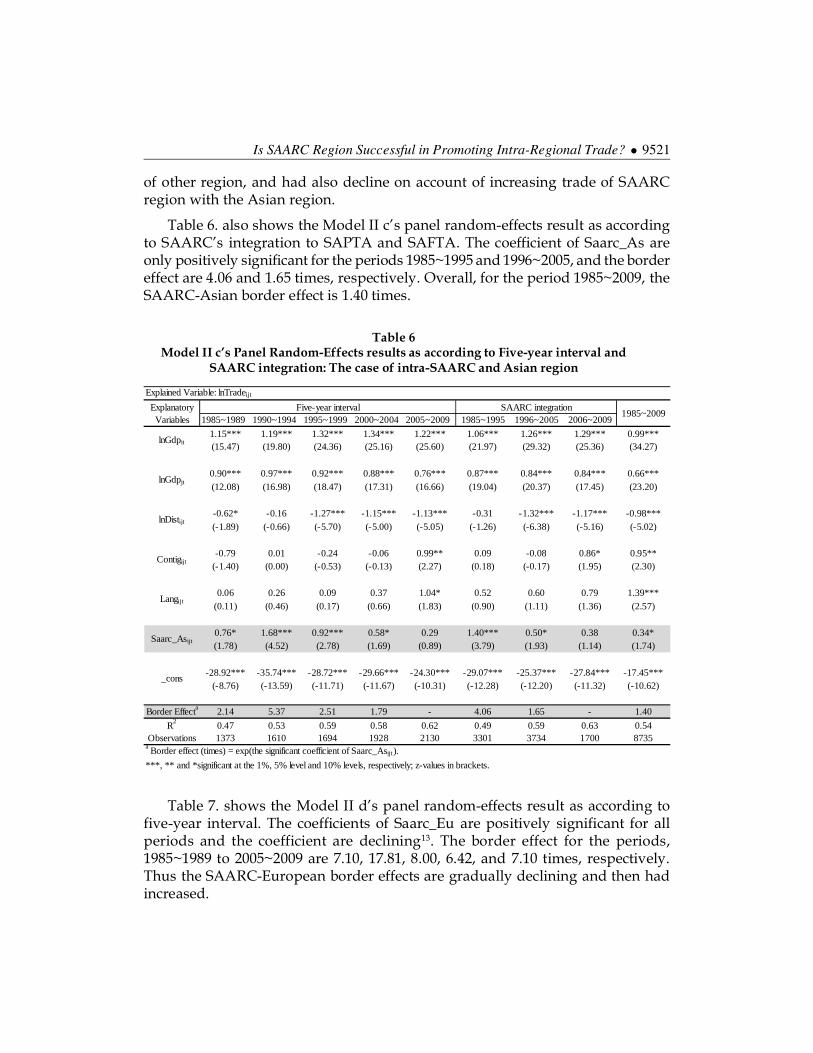
Table 6. shows the Model IIc’s panel random-effects result as according to five-year interval. The coefficient of Saarc_As are positively significant for the periods1985~1989 to 2000~2004 and the coefficient are declining12. So the border effect forthe periods, 1985~1989 to 1995~1999 are 2.14, 5.37, 2.51, and 1.79 times, respectively.Since SAARC region is a part of Asia, it would naturally trade more with Asianregion. Thus, as expected the SAARC-Asian border effect is smaller than with that
Is SAARC Region Successful in Promoting Intra-Regional Trade? � 9521
of other region, and had also decline on account of increasing trade of SAARCregion with the Asian region.
Table 6. also shows the Model II c’s panel random-effects result as accordingto SAARC’s integration to SAPTA and SAFTA. The coefficient of Saarc_As areonly positively significant for the periods 1985~1995 and 1996~2005, and the bordereffect are 4.06 and 1.65 times, respectively. Overall, for the period 1985~2009, theSAARC-Asian border effect is 1.40 times.
Explained Variable: lnTradeijt
ExplanatoryVariables 1985~1989 1990~1994 1995~1999 2000~2004 2005~2009 1985~1995 1996~2005 2006~2009
1.15*** 1.19*** 1.32*** 1.34*** 1.22*** 1.06*** 1.26*** 1.29*** 0.99***(15.47) (19.80) (24.36) (25.16) (25.60) (21.97) (29.32) (25.36) (34.27)
0.90*** 0.97*** 0.92*** 0.88*** 0.76*** 0.87*** 0.84*** 0.84*** 0.66***(12.08) (16.98) (18.47) (17.31) (16.66) (19.04) (20.37) (17.45) (23.20)
-0.62* -0.16 -1.27*** -1.15*** -1.13*** -0.31 -1.32*** -1.17*** -0.98***(-1.89) (-0.66) (-5.70) (-5.00) (-5.05) (-1.26) (-6.38) (-5.16) (-5.02)
-0.79 0.01 -0.24 -0.06 0.99** 0.09 -0.08 0.86* 0.95**(-1.40) (0.00) (-0.53) (-0.13) (2.27) (0.18) (-0.17) (1.95) (2.30)
0.06 0.26 0.09 0.37 1.04* 0.52 0.60 0.79 1.39***(0.11) (0.46) (0.17) (0.66) (1.83) (0.90) (1.11) (1.36) (2.57)
0.76* 1.68*** 0.92*** 0.58* 0.29 1.40*** 0.50* 0.38 0.34*(1.78) (4.52) (2.78) (1.69) (0.89) (3.79) (1.93) (1.14) (1.74)
-28.92*** -35.74*** -28.72*** -29.66*** -24.30*** -29.07*** -25.37*** -27.84*** -17.45***(-8.76) (-13.59) (-11.71) (-11.67) (-10.31) (-12.28) (-12.20) (-11.32) (-10.62)
Border Effecta 2.14 5.37 2.51 1.79 - 4.06 1.65 - 1.40
R2
0.47 0.53 0.59 0.58 0.62 0.49 0.59 0.63 0.54Observations 1373 1610 1694 1928 2130 3301 3734 1700 8735
a Border effect (times) = exp(the significant coefficient of Saarc_Asijt).
***, ** and *significant at the 1%, 5% level and 10% levels, respectively; z-values in brackets.
Langijt
1985~2009
lnGdpit
lnGdpjt
Saarc_Asijt
_cons
Five-year interval SAARC integration
lnDistijt
Contigijt
Table 6Model II c’s Panel Random-Effects results as according to Five-year interval and
SAARC integration: The case of intra-SAARC and Asian region
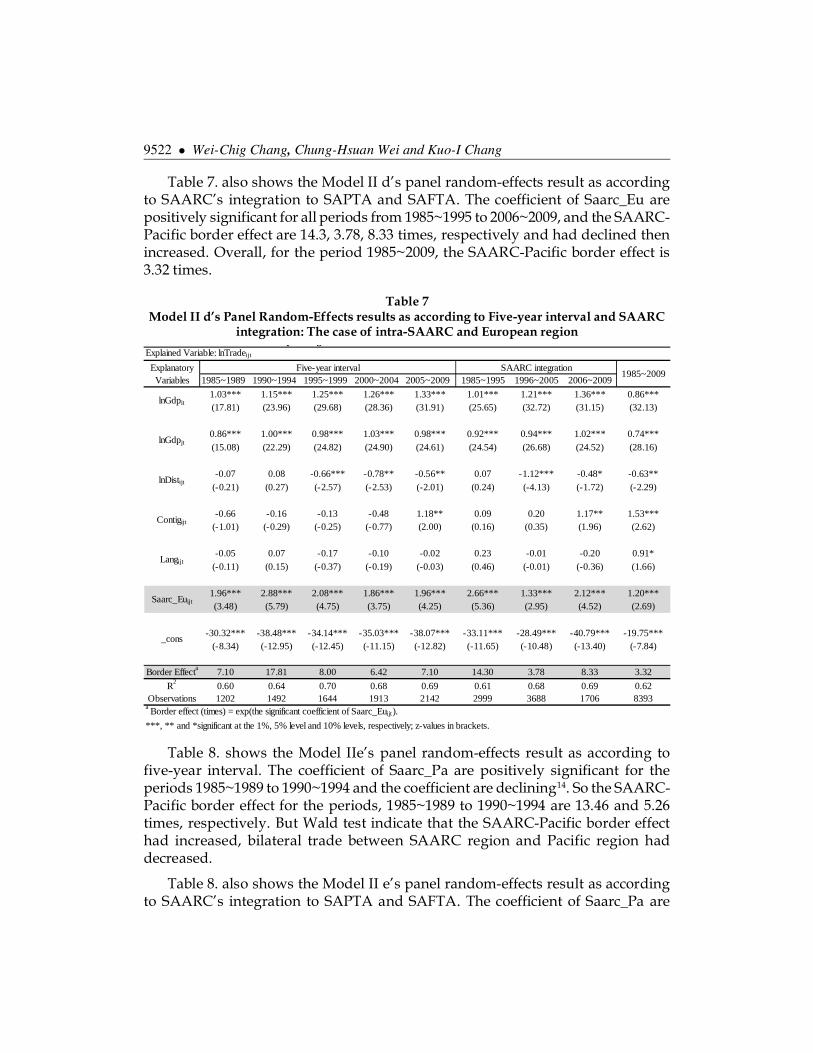
Table 7. shows the Model II d’s panel random-effects result as according tofive-year interval. The coefficients of Saarc_Eu are positively significant for allperiods and the coefficient are declining13. The border effect for the periods,1985~1989 to 2005~2009 are 7.10, 17.81, 8.00, 6.42, and 7.10 times, respectively.Thus the SAARC-European border effects are gradually declining and then hadincreased.
9522 � Wei-Chig Chang, Chung-Hsuan Wei and Kuo-I Chang
Table 7. also shows the Model II d’s panel random-effects result as accordingto SAARC’s integration to SAPTA and SAFTA. The coefficient of Saarc_Eu arepositively significant for all periods from 1985~1995 to 2006~2009, and the SAARC-Pacific border effect are 14.3, 3.78, 8.33 times, respectively and had declined thenincreased. Overall, for the period 1985~2009, the SAARC-Pacific border effect is3.32 times.
The case of intra-SAARC and European regionExplained Variable: lnTradeijt
ExplanatoryVariables 1985~1989 1990~1994 1995~1999 2000~2004 2005~2009 1985~1995 1996~2005 2006~2009
1.03*** 1.15*** 1.25*** 1.26*** 1.33*** 1.01*** 1.21*** 1.36*** 0.86***(17.81) (23.96) (29.68) (28.36) (31.91) (25.65) (32.72) (31.15) (32.13)
0.86*** 1.00*** 0.98*** 1.03*** 0.98*** 0.92*** 0.94*** 1.02*** 0.74***(15.08) (22.29) (24.82) (24.90) (24.61) (24.54) (26.68) (24.52) (28.16)
-0.07 0.08 -0.66*** -0.78** -0.56** 0.07 -1.12*** -0.48* -0.63**(-0.21) (0.27) (-2.57) (-2.53) (-2.01) (0.24) (-4.13) (-1.72) (-2.29)
-0.66 -0.16 -0.13 -0.48 1.18** 0.09 0.20 1.17** 1.53***(-1.01) (-0.29) (-0.25) (-0.77) (2.00) (0.16) (0.35) (1.96) (2.62)
-0.05 0.07 -0.17 -0.10 -0.02 0.23 -0.01 -0.20 0.91*(-0.11) (0.15) (-0.37) (-0.19) (-0.03) (0.46) (-0.01) (-0.36) (1.66)
1.96*** 2.88*** 2.08*** 1.86*** 1.96*** 2.66*** 1.33*** 2.12*** 1.20***(3.48) (5.79) (4.75) (3.75) (4.25) (5.36) (2.95) (4.52) (2.69)
-30.32*** -38.48*** -34.14*** -35.03*** -38.07*** -33.11*** -28.49*** -40.79*** -19.75***(-8.34) (-12.95) (-12.45) (-11.15) (-12.82) (-11.65) (-10.48) (-13.40) (-7.84)
Border Effecta 7.10 17.81 8.00 6.42 7.10 14.30 3.78 8.33 3.32
R2
0.60 0.64 0.70 0.68 0.69 0.61 0.68 0.69 0.62Observations 1202 1492 1644 1913 2142 2999 3688 1706 8393
a Border effect (times) = exp(the significant coefficient of Saarc_Euijt).
***, ** and *significant at the 1%, 5% level and 10% levels, respectively; z-values in brackets.
Langijt
1985~2009
lnGdpit
lnGdpjt
Saarc_Euijt
_cons
Five-year interval SAARC integration
lnDistijt
Contigijt
Table 7Model II d’s Panel Random-Effects results as according to Five-year interval and SAARC
integration: The case of intra-SAARC and European region
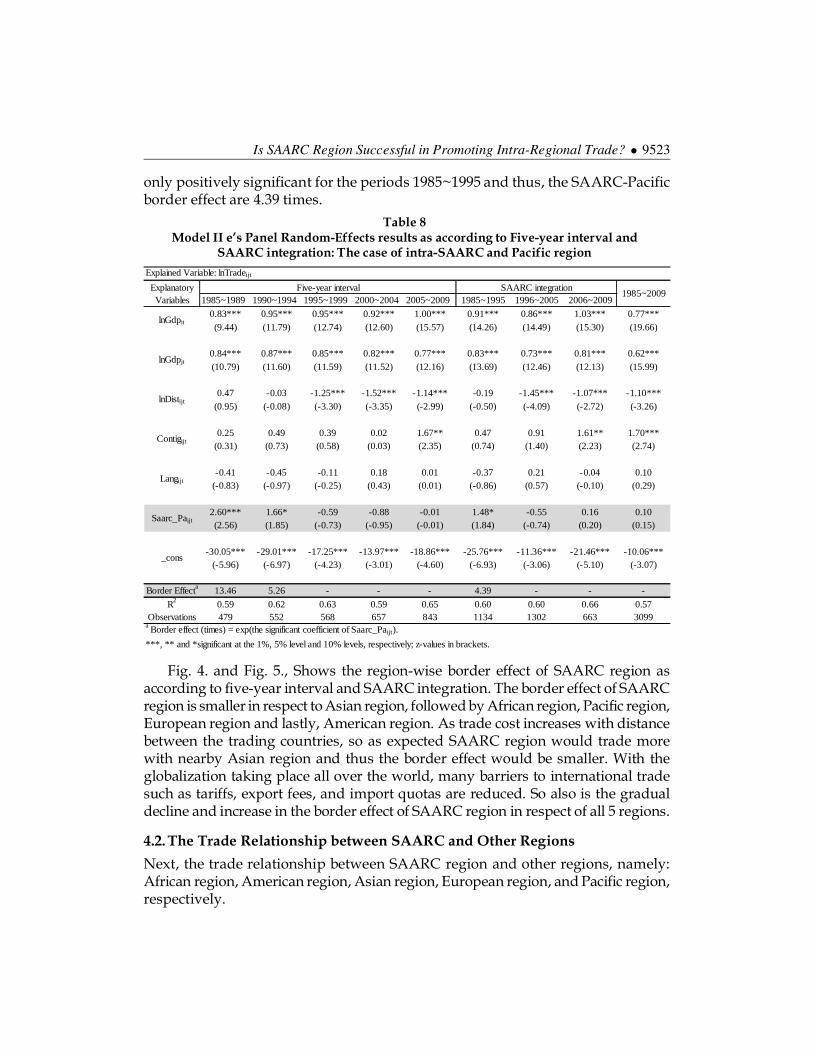
Table 8. shows the Model IIe’s panel random-effects result as according tofive-year interval. The coefficient of Saarc_Pa are positively significant for theperiods 1985~1989 to 1990~1994 and the coefficient are declining14. So the SAARC-Pacific border effect for the periods, 1985~1989 to 1990~1994 are 13.46 and 5.26times, respectively. But Wald test indicate that the SAARC-Pacific border effecthad increased, bilateral trade between SAARC region and Pacific region haddecreased.
Table 8. also shows the Model II e’s panel random-effects result as accordingto SAARC’s integration to SAPTA and SAFTA. The coefficient of Saarc_Pa are
Is SAARC Region Successful in Promoting Intra-Regional Trade? � 9523
only positively significant for the periods 1985~1995 and thus, the SAARC-Pacificborder effect are 4.39 times.
Explained Variable: lnTradeijt
ExplanatoryVariables 1985~1989 1990~1994 1995~1999 2000~2004 2005~2009 1985~1995 1996~2005 2006~2009
0.83*** 0.95*** 0.95*** 0.92*** 1.00*** 0.91*** 0.86*** 1.03*** 0.77***
(9.44) (11.79) (12.74) (12.60) (15.57) (14.26) (14.49) (15.30) (19.66)
0.84*** 0.87*** 0.85*** 0.82*** 0.77*** 0.83*** 0.73*** 0.81*** 0.62***
(10.79) (11.60) (11.59) (11.52) (12.16) (13.69) (12.46) (12.13) (15.99)
0.47 -0.03 -1.25*** -1.52*** -1.14*** -0.19 -1.45*** -1.07*** -1.10***
(0.95) (-0.08) (-3.30) (-3.35) (-2.99) (-0.50) (-4.09) (-2.72) (-3.26)
0.25 0.49 0.39 0.02 1.67** 0.47 0.91 1.61** 1.70***(0.31) (0.73) (0.58) (0.03) (2.35) (0.74) (1.40) (2.23) (2.74)
-0.41 -0.45 -0.11 0.18 0.01 -0.37 0.21 -0.04 0.10(-0.83) (-0.97) (-0.25) (0.43) (0.01) (-0.86) (0.57) (-0.10) (0.29)
2.60*** 1.66* -0.59 -0.88 -0.01 1.48* -0.55 0.16 0.10(2.56) (1.85) (-0.73) (-0.95) (-0.01) (1.84) (-0.74) (0.20) (0.15)
-30.05*** -29.01*** -17.25*** -13.97*** -18.86*** -25.76*** -11.36*** -21.46*** -10.06***(-5.96) (-6.97) (-4.23) (-3.01) (-4.60) (-6.93) (-3.06) (-5.10) (-3.07)
Border Effecta 13.46 5.26 - - - 4.39 - - -
R2 0.59 0.62 0.63 0.59 0.65 0.60 0.60 0.66 0.57Observations 479 552 568 657 843 1134 1302 663 3099
a Border effect (times) = exp(the significant coefficient of Saarc_Paijt).
***, ** and *significant at the 1%, 5% level and 10% levels, respectively; z-values in brackets.
Saarc_Paijt
_cons
Five-year interval SAARC integration
lnDistijt
Contigijt
Langijt
1985~2009
lnGdpit
lnGdpjt
Table 8Model II e’s Panel Random-Effects results as according to Five-year interval and
SAARC integration: The case of intra-SAARC and Pacific region
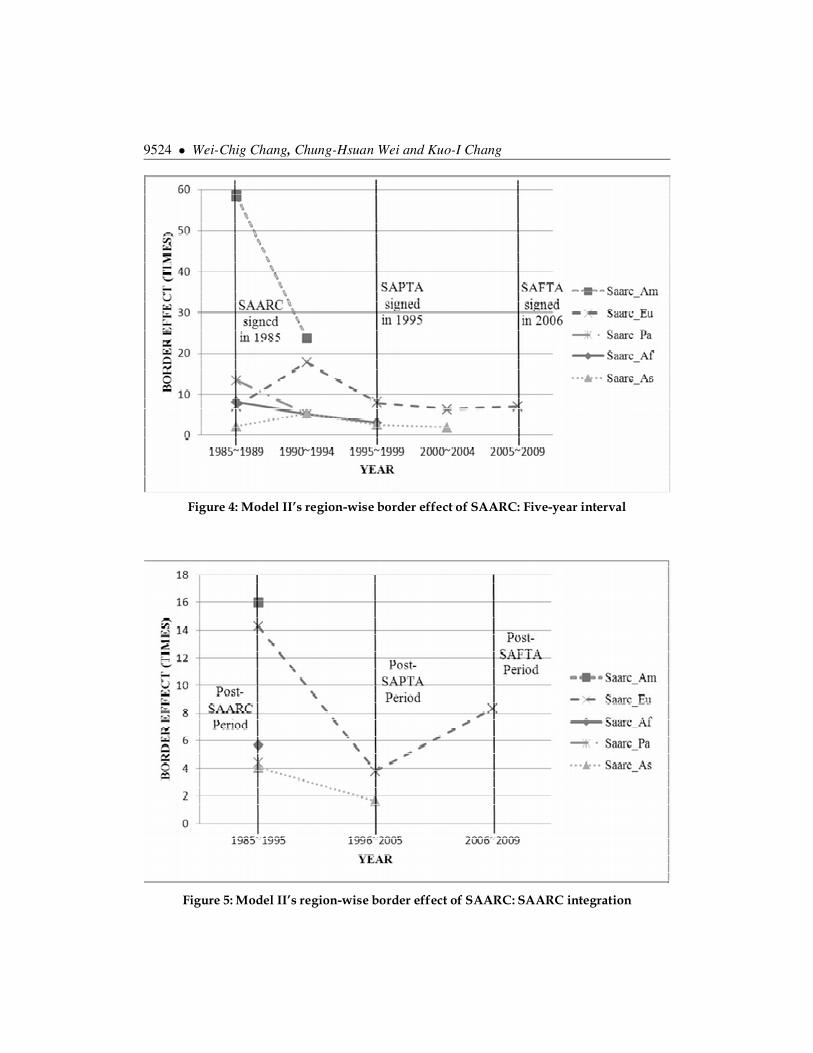
Fig. 4. and Fig. 5., Shows the region-wise border effect of SAARC region asaccording to five-year interval and SAARC integration. The border effect of SAARCregion is smaller in respect to Asian region, followed by African region, Pacific region,European region and lastly, American region. As trade cost increases with distancebetween the trading countries, so as expected SAARC region would trade morewith nearby Asian region and thus the border effect would be smaller. With theglobalization taking place all over the world, many barriers to international tradesuch as tariffs, export fees, and import quotas are reduced. So also is the gradualdecline and increase in the border effect of SAARC region in respect of all 5 regions.
4.2. The Trade Relationship between SAARC and Other Regions
Next, the trade relationship between SAARC region and other regions, namely:African region, American region, Asian region, European region, and Pacific region,respectively.
9524 � Wei-Chig Chang, Chung-Hsuan Wei and Kuo-I Chang
Figure 4: Model II’s region-wise border effect of SAARC: Five-year interval
Figure 5: Model II’s region-wise border effect of SAARC: SAARC integration
Is SAARC Region Successful in Promoting Intra-Regional Trade? � 9525
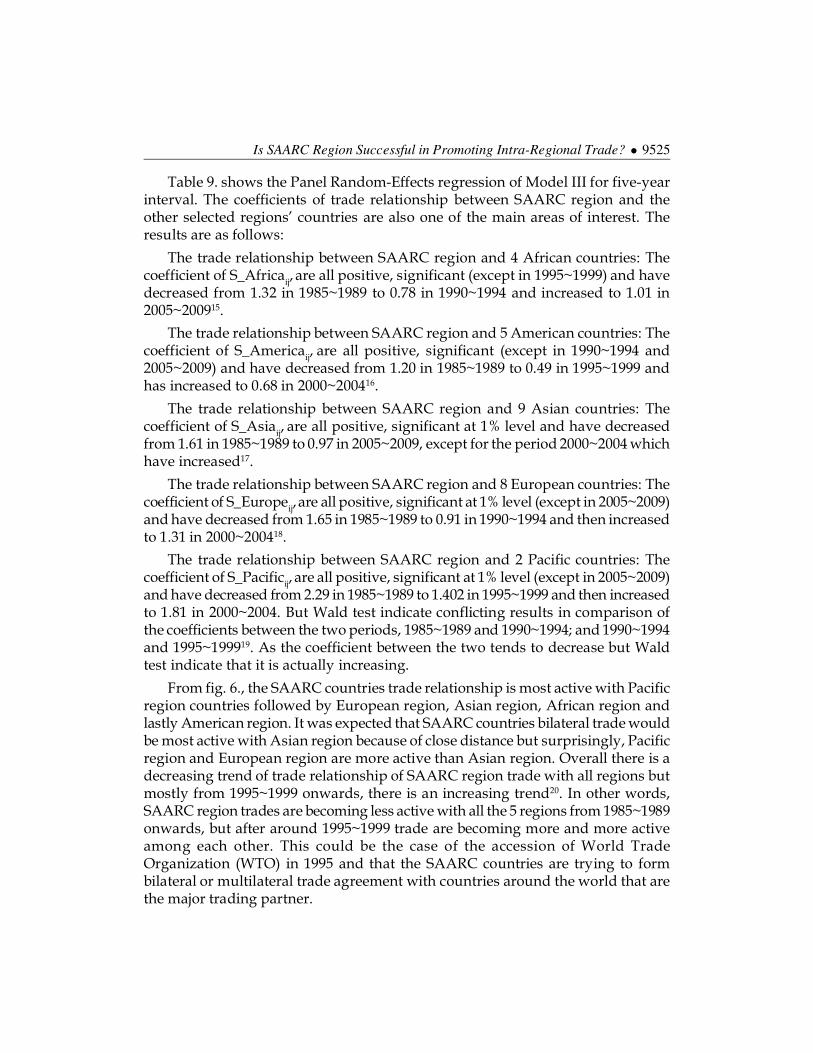
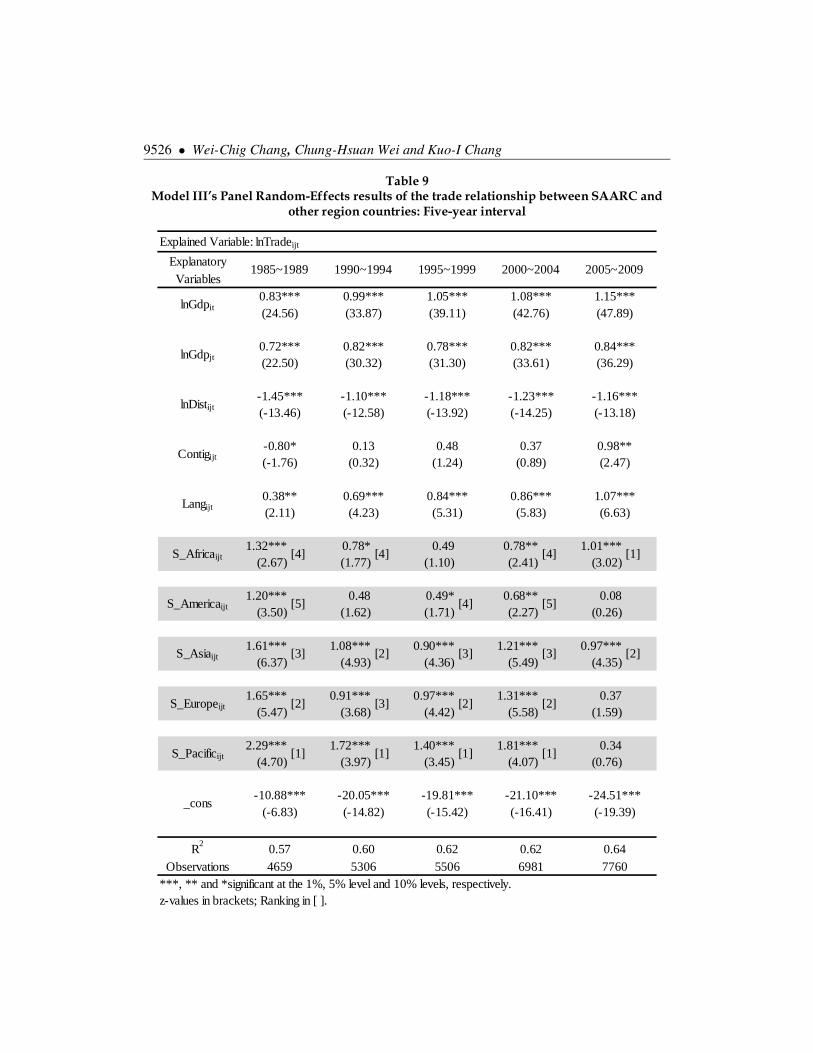
Table 9. shows the Panel Random-Effects regression of Model III for five-yearinterval. The coefficients of trade relationship between SAARC region and theother selected regions’ countries are also one of the main areas of interest. Theresults are as follows:
The trade relationship between SAARC region and 4 African countries: Thecoefficient of S_Africaij, are all positive, significant (except in 1995~1999) and havedecreased from 1.32 in 1985~1989 to 0.78 in 1990~1994 and increased to 1.01 in2005~200915.
The trade relationship between SAARC region and 5 American countries: Thecoefficient of S_Americaij, are all positive, significant (except in 1990~1994 and2005~2009) and have decreased from 1.20 in 1985~1989 to 0.49 in 1995~1999 andhas increased to 0.68 in 2000~200416.
The trade relationship between SAARC region and 9 Asian countries: Thecoefficient of S_Asiaij, are all positive, significant at 1% level and have decreasedfrom 1.61 in 1985~1989 to 0.97 in 2005~2009, except for the period 2000~2004 whichhave increased17.
The trade relationship between SAARC region and 8 European countries: Thecoefficient of S_Europeij, are all positive, significant at 1% level (except in 2005~2009)and have decreased from 1.65 in 1985~1989 to 0.91 in 1990~1994 and then increasedto 1.31 in 2000~200418.
The trade relationship between SAARC region and 2 Pacific countries: Thecoefficient of S_Pacificij, are all positive, significant at 1% level (except in 2005~2009)and have decreased from 2.29 in 1985~1989 to 1.402 in 1995~1999 and then increasedto 1.81 in 2000~2004. But Wald test indicate conflicting results in comparison ofthe coefficients between the two periods, 1985~1989 and 1990~1994; and 1990~1994and 1995~199919. As the coefficient between the two tends to decrease but Waldtest indicate that it is actually increasing.
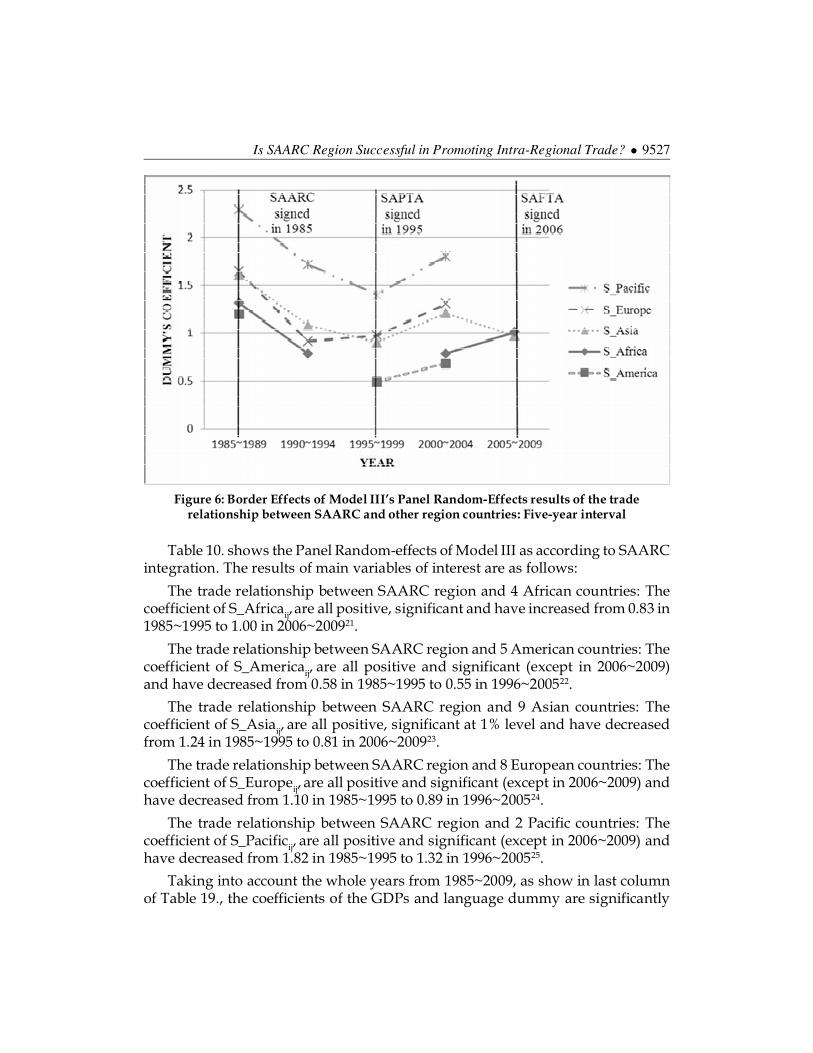
From fig. 6., the SAARC countries trade relationship is most active with Pacificregion countries followed by European region, Asian region, African region andlastly American region. It was expected that SAARC countries bilateral trade wouldbe most active with Asian region because of close distance but surprisingly, Pacificregion and European region are more active than Asian region. Overall there is adecreasing trend of trade relationship of SAARC region trade with all regions butmostly from 1995~1999 onwards, there is an increasing trend20. In other words,SAARC region trades are becoming less active with all the 5 regions from 1985~1989onwards, but after around 1995~1999 trade are becoming more and more activeamong each other. This could be the case of the accession of World TradeOrganization (WTO) in 1995 and that the SAARC countries are trying to formbilateral or multilateral trade agreement with countries around the world that arethe major trading partner.
9526 � Wei-Chig Chang, Chung-Hsuan Wei and Kuo-I Chang
Explained Variable: lnTradeijt
ExplanatoryVariables
1.32*** 0.78* 0.49 0.78** 1.01***(2.67) (1.77) (1.10) (2.41) (3.02)
1.20*** 0.48 0.49* 0.68** 0.08(3.50) (1.62) (1.71) (2.27) (0.26)
1.61*** 1.08*** 0.90*** 1.21*** 0.97***(6.37) (4.93) (4.36) (5.49) (4.35)
1.65*** 0.91*** 0.97*** 1.31*** 0.37(5.47) (3.68) (4.42) (5.58) (1.59)
2.29*** 1.72*** 1.40*** 1.81*** 0.34(4.70) (3.97) (3.45) (4.07) (0.76)
R2
Observations***, ** and *significant at the 1%, 5% level and 10% levels, respectively.z-values in brackets; Ranking in [ ].
0.625506
0.626981
0.647760
1.07***(6.63)
-10.88***(-6.83)
-20.05***(-14.82)
-19.81***(-15.42)
-21.10***(-16.41)
0.86***(5.83)
1.15***(47.89)
0.84***(36.29)
-1.16***(-13.18)
0.98**(2.47)
0.84***(5.31)
1.08***(42.76)
0.82***(33.61)
-1.23***(-14.25)
0.37(0.89)
0.69***(4.23)
1.05***(39.11)
0.78***(31.30)
-1.18***(-13.92)
0.48(1.24)
0.38**(2.11)
0.99***(33.87)
0.82***(30.32)
-1.10***(-12.58)
0.13(0.32)
0.72***(22.50)
-1.45***(-13.46)
-0.80*(-1.76)
[2]
-24.51***(-19.39)
1985~1989 1990~1994 1995~1999 2000~2004 2005~2009
[4] [4] [4] [1]
[5]
[3]
[2]
[1]
[2]
[3]
[1]
[4]
[3]
[2]
[1]
[5]
[3]
[2]
[1]
0.605306
S_Africaijt
S_Americaijt
S_Asiaijt
S_Europeijt
S_Pacificijt
_cons
0.574659
lnGdpit0.83***(24.56)
lnGdpjt
lnDistijt
Contigijt
Langijt
Table 9Model III’s Panel Random-Effects results of the trade relationship between SAARC and
other region countries: Five-year interval
Is SAARC Region Successful in Promoting Intra-Regional Trade? � 9527
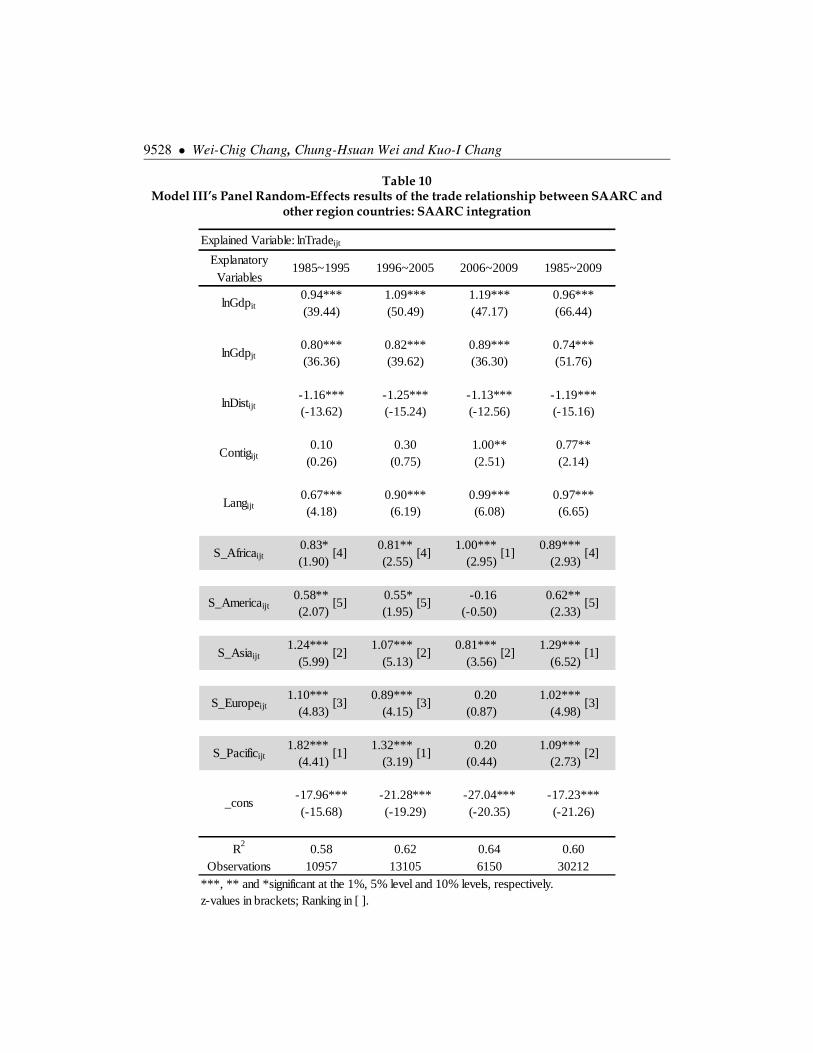
Table 10. shows the Panel Random-effects of Model III as according to SAARCintegration. The results of main variables of interest are as follows:
The trade relationship between SAARC region and 4 African countries: Thecoefficient of S_Africaij, are all positive, significant and have increased from 0.83 in1985~1995 to 1.00 in 2006~200921.
The trade relationship between SAARC region and 5 American countries: Thecoefficient of S_Americaij, are all positive and significant (except in 2006~2009)and have decreased from 0.58 in 1985~1995 to 0.55 in 1996~200522.
The trade relationship between SAARC region and 9 Asian countries: Thecoefficient of S_Asiaij, are all positive, significant at 1% level and have decreasedfrom 1.24 in 1985~1995 to 0.81 in 2006~200923.
The trade relationship between SAARC region and 8 European countries: Thecoefficient of S_Europeij, are all positive and significant (except in 2006~2009) andhave decreased from 1.10 in 1985~1995 to 0.89 in 1996~200524.
The trade relationship between SAARC region and 2 Pacific countries: Thecoefficient of S_Pacificij, are all positive and significant (except in 2006~2009) andhave decreased from 1.82 in 1985~1995 to 1.32 in 1996~200525.
Taking into account the whole years from 1985~2009, as show in last columnof Table 19., the coefficients of the GDPs and language dummy are significantly
Figure 6: Border Effects of Model III’s Panel Random-Effects results of the traderelationship between SAARC and other region countries: Five-year interval
9528 � Wei-Chig Chang, Chung-Hsuan Wei and Kuo-I Chang
Explained Variable: lnTradeijt
ExplanatoryVariables
0.83* 0.81** 1.00*** 0.89***(1.90) (2.55) (2.95) (2.93)
0.58** 0.55* -0.16 0.62**(2.07) (1.95) (-0.50) (2.33)
1.24*** 1.07*** 0.81*** 1.29***(5.99) (5.13) (3.56) (6.52)
1.10*** 0.89*** 0.20 1.02***(4.83) (4.15) (0.87) (4.98)
1.82*** 1.32*** 0.20 1.09***(4.41) (3.19) (0.44) (2.73)
R2
Observations***, ** and *significant at the 1%, 5% level and 10% levels, respectively.z-values in brackets; Ranking in [ ].
0.6030212
0.5810957
0.6213105
0.646150
(6.65)
-17.96***(-15.68)
-21.28***(-19.29)
-27.04***(-20.35)
-17.23***(-21.26)
(6.08)
0.96***(66.44)
0.74***(51.76)
-1.19***(-15.16)
0.77**(2.14)
0.97***(6.19)
1.19***(47.17)
0.89***(36.30)
-1.13***(-12.56)
1.00**(2.51)
0.99***(4.18)
1.09***(50.49)
0.82***(39.62)
-1.25***(-15.24)
0.90***
(36.36)
-1.16***(-13.62)
0.10(0.26)
0.67***
[2]
[4]
[5]
[1]
[3]
[2]
[2]
[3]
[1]
[4]
[5]
[2]
[3]
[1]
[4]
[5]
[1]
_cons
Langijt
S_Africaijt
S_Americaijt
S_Asiaijt
S_Europeijt
S_Pacificijt
lnGdpit
lnGdpjt
lnDistijt
Contigijt
1985~1995 1996~2005
0.30(0.75)
2006~2009 1985~2009
0.94***(39.44)
0.80***
Table 10Model III’s Panel Random-Effects results of the trade relationship between SAARC and
other region countries: SAARC integration
Is SAARC Region Successful in Promoting Intra-Regional Trade? � 9529
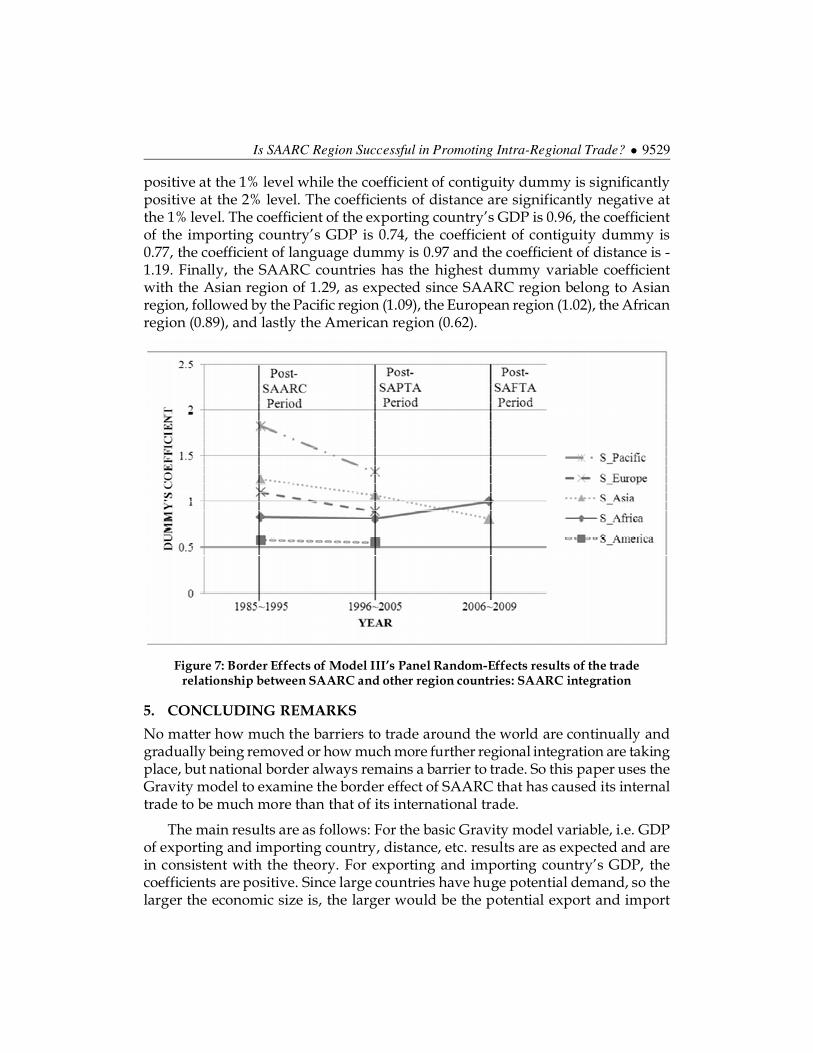
positive at the 1% level while the coefficient of contiguity dummy is significantlypositive at the 2% level. The coefficients of distance are significantly negative atthe 1% level. The coefficient of the exporting country’s GDP is 0.96, the coefficientof the importing country’s GDP is 0.74, the coefficient of contiguity dummy is0.77, the coefficient of language dummy is 0.97 and the coefficient of distance is -1.19. Finally, the SAARC countries has the highest dummy variable coefficientwith the Asian region of 1.29, as expected since SAARC region belong to Asianregion, followed by the Pacific region (1.09), the European region (1.02), the Africanregion (0.89), and lastly the American region (0.62).
Figure 7: Border Effects of Model III’s Panel Random-Effects results of the traderelationship between SAARC and other region countries: SAARC integration
5. CONCLUDING REMARKS
No matter how much the barriers to trade around the world are continually andgradually being removed or how much more further regional integration are takingplace, but national border always remains a barrier to trade. So this paper uses theGravity model to examine the border effect of SAARC that has caused its internaltrade to be much more than that of its international trade.
The main results are as follows: For the basic Gravity model variable, i.e. GDPof exporting and importing country, distance, etc. results are as expected and arein consistent with the theory. For exporting and importing country’s GDP, thecoefficients are positive. Since large countries have huge potential demand, so thelarger the economic size is, the larger would be the potential export and import
9530 � Wei-Chig Chang, Chung-Hsuan Wei and Kuo-I Chang
and as a result the bilateral trade flow would also be huge. While for distancecoefficient, it has negative relationship with trade, as the more the distance betweentwo countries, which indicates that the transportation cost and the trade cost willbe much more, so also the trade between the two countries will decline as thedistance between the two countries increases. But an empirical result shows thatthere is a gradual declining trend of trade cost. Finally, the two countries thatshare a common border and common language would naturally trade more.
The cross-sectional empirical result shows that the border effects of SAARCregion against RoW are between 1.83 and 3.63 times. In other word, with borderbarriers affecting trade, SAARC region trade among themselves much more thanaround 1.83 to 3.63 times than that of its trade with countries other than SAARCmember. The panel five-year interval random-effects results of the border effect ofSAARC region against RoW are between 1.83 to 2.53 times, and the panel randomeffects according to SAARC integration year shows results of the border effect ofSAARC region against RoW are between 1.89 to 2.41 times. Overall the empiricalresult from 1985 to 2009, record a low border effect of 1.51 times. Thus, the bordereffect of SAARC region is quite small as compared to Canada-U.S. border effect of22 times as in McCallum (1995), the European countries’ border effect is around 6times in Chen (2004), and Japan’s border effect of 3.41 times for the year 1990 inOkubo (2004), etc. These empirical results are in consistent with Anderson andWincoop (2003), who argues that small countries have larger border effect. AsSAARC is quite a big region and so it has small border effect. While results forregion-wise border effect of SAARC region are as expected, it is smaller in respectof the Asian region, followed by the African region, the Pacific region, the Europeanregion and lastly, the American region.
On the trade relationship between SAARC region and 4 African Countries, 5American Countries, 9 Asian Countries, 8 European Countries, and 2 PacificCountries, respectively, whether they are active or not. The results shows thecoefficients are positively significant, and thus indicate that the SAARC regiontrades with 5 regions are active due to globalization and economic integrationtaking place around the world. SAARC countries led by India are signing tradeagreement with trading partners to facilitate bilateral trade through loweringbarriers to trade such as tariff. It was surprising that empirical results shows SAARCregion trade is more active between Europe region and Pacific region than withthe Asian region countries. As normally a country would naturally trade withmore with nearby countries. But overall results shows that the SAARC countrieshas the highest dummy variable coefficient with Asian region of 1.29, followed byPacific region, European region, African region, and American region.
On the impact of SAPTA and SAFTA on regional internal trade, there is littleimpact, as there are still political conflicts between India and Pakistan; India andBangladesh; and Nepal and Bhutan. Such conflict weakens the internal trade and
Is SAARC Region Successful in Promoting Intra-Regional Trade? � 9531
also because of SAARC member has low trade shares among themselves, especiallyfor India, whose trade shares with SAARC member are below 1.6%.
AcknowledgementsThe authors wish to thank the anonymous reviewers for their valuable suggestions.
Notes1. See Timbergen (1962), and McCallum (1995).
2. See Appendix A.
3. These countries are chosen to represent the 5 main regions, since they are the most commoncountries that trade with the SAARC countries and are the top largest trading partner.
4. Zero bilateral trade are removed from the sample and the Breusch and Pagan Lagrangianmultiplier test indicates that random effect regression is much better over pool OLSregression in explaining the panel data.
5. Wald test have been carried out to compare the significant coefficient of SAARC borderdummy variable with that of the consecutive year’s significant coefficient, i.e. the result ofWald test between SAARC border dummy variable coefficient for the year 1992 and 1993,shows the F-value equals 0.57, the hypothesis of SAARC border dummy variable coefficientfor the year 1992 less than equal to that of 1993 is not rejected, thus indicating increasingtrend.
6. Since the coefficient of SAARC border dummy is the elasticity of SAARC region trade, andin order to return to the original trade flows, exponent is applied to the coefficient.
7. Only significant coefficients are used to calculate the border effect, since insignificantcoefficients have no power in explaining the variable.
8. Wald test have been carried out to compare the significant coefficient of SAARC borderdummy variable with that of the consecutive year’s significant coefficient. The F-value ofWald test between 1990~1994 and 1995~1999, 1995~1999 and 2000~2004, 2000~2004 and2005~2009 are 0.17, 5.80, 0.48, respectively. For the first and the last Wald test, the hypothesesare not rejected but rejected for the second Wald test.
9. Wald test have been carried out to compare the significant coefficient of SAARC borderdummy variable with that of the consecutive year’s significant coefficient. The F-value ofWald test between 1985~1995 and 1996~2005, and 1996~2005 and 2006~2009 are 0.00, 1.58,respectively. The hypotheses are both not rejected, indicating increasing trend. There is aconflicting result while testing coefficient of SAARC border dummy variable between1985~1995 and 1996~2005.
10. Wald test shows contradictory results, which indicate that, the coefficient of Saarc_Af forthe periods 1985~1989 to 1995~1999 are increasing instead.
11. Wald test shows contradictory results, which indicate that, the coefficient of Saarc_Am forthe periods 1985~1989 to 1990~1994 are increasing instead.
12. Consistent results of Wald test on Saarc_As’s coefficient.
13. Consistent results of Wald test on Saarc_Eu’s coefficient.
9532 � Wei-Chig Chang, Chung-Hsuan Wei and Kuo-I Chang
14. Wald test shows contradictory results, which indicate that, the coefficient of Saarc_Pa forthe periods 1985~1989 to 1990~1994 are increasing instead.
15. The Chi2 value of Wald test between 1985~1989 and 1990~1994, 1990~1994 and 2000~2004,2000~2004 and 2005~2009 are 4.58, 1.63, and 2.46, respectively. For the first Wald test, thehypotheses are not rejected but rejected for the second and third Wald test.
16. The Chi2 value of Wald test between 1985~1989 and 1995~1999, 1995~1999 and 2000~2004are 4.81, 0.50, respectively. For the second Wald test, the hypotheses are not rejected butrejected for the first Wald test.
17. The Chi2 value of Wald test between 1985~1989 and 1990~1994, 1990~1994 and 1995~1999,1995~1999 and 2000~2004, 2000~2004 and 2005~2009 are 6.51, 7.16, 0.44, and 5.59,respectively. For the third Wald test, the hypotheses are not rejected but rejected for therest of the Wald test.
18. The Chi2 value of Wald test between 1985~1989 and 1990~1994, 1990~1994 and 1995~1999,and 1995~1999 and 2000~2004 are 8.17, 1.29, and 1.21, respectively. For the second and thethird Wald test, the hypotheses are not rejected but rejected for the first Wald test.
19. The Chi2 value of Wald test between 1985~1989 and 1990~1994, 1990~1994 and 1995~1999,and 1995~1999 and 2000~2004 are 1.40, 1.71, and 1.33, respectively. The hypotheses arenot rejected for the entire Wald test.
20. Except for SAARC trade relationship with Pacific, which is actually increasing accordingto Wald test.
21. The Chi2 value of Wald test between 1985~1995 and 1996~2005, and 1996~2005 and2006~2009 are 4.46 and 3.38, respectively. The hypotheses are not rejected for the secondWald test, but rejected for the first Wald test, indicating an increasing then declining trend.
22. The Chi2 value of Wald test between 1985~1995 and 1996~2005 is 5.59 and the hypothesisis rejected, indicating an increasing trend.
23. The Chi2 value of Wald test between 1985~1995 and 1996~2005, and 1996~2005 and2006~2009 are 22.86 and 7.83, respectively. The hypotheses are not rejected for the firstWald test, but rejected for the latter Wald test, indicating a declining then increasing trend.
24. The Chi2 value of Wald test between 1985~1995 and 1996~2005 is 23.65 and the hypothesisis not rejected, indicating a declining trend.
25. The Chi2 value of Wald test between 1985~1995 and 1996~2005 is 14.14 and the hypothesisis not rejected, indicating a declining trend.
ReferencesAnderson, J.E. (1979), A Theoretical Foundation for the Gravity Equation, American Economic
Review, 69, 106-116.
Anderson, J.E. and E.V. Wincoop (2003), Gravity with Gravitas: A Solution to the Border Puzzle,American Economic Review, 93, 170-192.
Baldwin, R. (1994), Towards an Integrated Europe, Centre for Economic Policy Research, London.
Bergstrand, J.H. (1985), The Gravity Equation in International Trade: Some MicroeconomicFoundations and Empirical Evidence, The Review of Economics and Statistics, 67, 474-481.
Ceglowski, J. (2000), Has the Border Narrowed? North American Journal of Economics andFinance, 11, 61-75.
Is SAARC Region Successful in Promoting Intra-Regional Trade? � 9533
Chen, N. (2004), Intra-national Versus International Trade in the European Union: Why DoNational Border Matter? Journal of International Economics, 63, 93-118.
Deardoff, A.V. (1998), Determinants of Bilateral Trade: Does Gravity Work in a NeoclassicalWorld? The Regionalization of the World Economy, Chicago: University of Chicago Press.
Eaton, J. and A. Tamura (1994), Bilateralism and Regionalism in Japanese and US Trade andDirect Foreign Investment Patterns, Journal of the Japanese and International Economics,8, 478-510.
Eaton, J. and S. Kortum (1997), Technology and Bilateral Trade, National Bureau of EconomicsResearch Working Paper 6253.
Engel, C. and J. Rogers (1996), How Wide is the Border, The American Economic Review, 86,1112-1125.
Evans, C.L. (2003), The Economic Significance of National Border Effects, The AmericanEconomic Review, 93, 1291-1312.
Feenstra, R.C. (2002), Border Effects and the Gravity Equation: Consistent Methods forEstimation, Scottish Journal of Political Economy, 49, 491-506.
Frankel, J.A. (1992), Is Japan Creating a Yen Bloc in East Asia and the Pacific? National Bureauof Economics Research Working Paper 4050.
Fukao, K. and T. Okubo (2004), Why Has the Border Effect in the Japanese Market Declined?The Role of Business Networks in East Asia, The Research Institute of Economy, Trade andIndustry Discussion Paper 04-E-016.
Hassan, M.K. (2001), Is SAARC A Viable Economic Block? Evidence from Gravity Model, Journalof Asian Economics, 12, 263-290.
Head, K. and T. Mayer (2000), Non-Europe: the Magnitude and Causes of Market Fragmentationin the EU, Weltwirtschaftliches Archive, 136, 284-314.
Helliwell, J.F. (1996), Do National Borders Matter for Quebec’s Trade? Canadian Journal ofEconomics, 29, 507-522.
Hillberry, R. (1998), Regional Trade and the Medicine Line: The National Border Effect in U.S.Commodity Flow Data, Journal of Borderlands Studies, 8, 1-17.
Hirantha, S.W. (2004), From SAPTA to SAFTA: Gravity Analysis of South Asian Free Trade,Mimeo, Visiting Scholar, School of Economics, University of Nottingham, United Kingdom.
Leamer, E.E. (1997), Access to Western markets and Eastern effort levels, Lessons from theEconomic Transition, Central and Eastern Europe in the 1990s. Zecchini, S. (ed.), KluwerAcademic Publishers: Dordrecht, 503-526.
Linnemann, H. (1966), An Econometric Study of International Trade Flows, Amsterdam, North-Holland Pub. Co.
McCallum, J. (1995), National Borders Matter: Canada-U.S. Regional Trade Patterns, AmericanEconomic Review, 85, 615-623.
Moktan, S. (2009), The Impact of Trade Agreements on Intraregional Exports: Evidence fromSAARC Countries, Journal of International Economic Studies, 23, 23-42.
Nitsch, V. (2000), National Borders and International Trade: Evidence from the European Union,Canadian Journal of Economics, 33, 1091–1105.
9534 � Wei-Chig Chang, Chung-Hsuan Wei and Kuo-I Chang
Obsfeld, M. and Rogoff, K. (2001), The Six Major Puzzles in International Macroeconomics: IsThere a Common Cause? National Bureau of Economics Research Macroeconomics Annual2001, 15, 339-412.
Ohmae, K. (1990), The Borderless World: Power and Strategy in the Interlinked Economy, NewYork: Harper Business.
Okubo, T. (2004), The Border Effect in the Japanese Market: A Gravity Model Analysis, Journalof the Japanese and International Economies, 18, 1-11.
Olper, A. and V. Raimondi (2008), Agriculture Market Integration in the OECD: A Gravity-Border Effect Approach, Food Policy, 33, 165-175.
Poyhonen, P. (1963), Toward a General Theory of International Trade, Ekonomiska SamfundetsTidskrift, 16, 69-77.
Rogers, H.J. and P.H. Smith (2001), Border Effects Within the NAFTA Countries, InternationalFinance Discussion Papers 698.
Tinbergen, J. (1962), Shaping the World Economy: Suggestions for an International EconomicPolicy, The Twentieth Century Fund, New York.
Trefler, D. (1995), The Case of the Missing Trade and Other Mysteries, American EconomicReview, 85, 1029-1046.
Wang, Z.K. and A. Winter (1991), The Trading Potential of Eastern Europe, Centre for EconomicPolicy Research Discussion paper 610.
Wei, S.J. (1996), Intra-national Versus International Trade: How Stubborn are Nations in GlobalIntegration? National Bureau of Economics Research Working Paper 531.
Wolf, H. (2000), Intranational Home Bias in Trade, The Review of Economics and Statistics, 82,555-563.
Is SAARC Region Successful in Promoting Intra-Regional Trade? � 9535
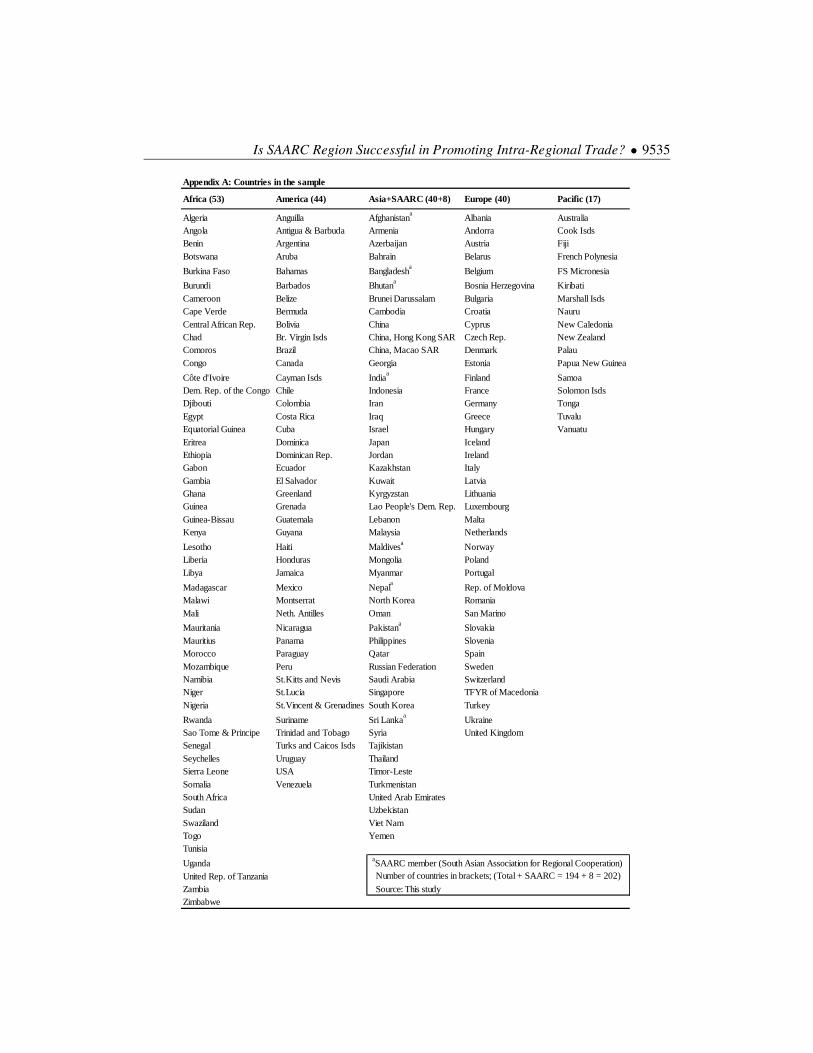
Appendix A: Countries in the sample
Africa (53) America (44) Asia+SAARC (40+8) Europe (40) Pacific (17)
Algeria Anguilla Afghanistana
Albania AustraliaAngola Antigua & Barbuda Armenia Andorra Cook IsdsBenin Argentina Azerbaijan Austria Fiji
Botswana Aruba Bahrain Belarus French Polynesia
Burkina Faso Bahamas Bangladesha
Belgium FS Micronesia
Burundi Barbados Bhutana Bosnia Herzegovina Kiribati
Cameroon Belize Brunei Darussalam Bulgaria Marshall IsdsCape Verde Bermuda Cambodia Croatia Nauru
Central African Rep. Bolivia China Cyprus New CaledoniaChad Br. Virgin Isds China, Hong Kong SAR Czech Rep. New ZealandComoros Brazil China, Macao SAR Denmark Palau
Congo Canada Georgia Estonia Papua New Guinea
Côte d'Ivoire Cayman Isds Indiaa
Finland SamoaDem. Rep. of the Congo Chile Indonesia France Solomon IsdsDjibouti Colombia Iran Germany Tonga
Egypt Costa Rica Iraq Greece TuvaluEquatorial Guinea Cuba Israel Hungary Vanuatu
Eritrea Dominica Japan IcelandEthiopia Dominican Rep. Jordan IrelandGabon Ecuador Kazakhstan Italy
Gambia El Salvador Kuwait LatviaGhana Greenland Kyrgyzstan LithuaniaGuinea Grenada Lao People's Dem. Rep. Luxembourg
Guinea-Bissau Guatemala Lebanon MaltaKenya Guyana Malaysia Netherlands
Lesotho Haiti Maldivesa NorwayLiberia Honduras Mongolia Poland
Libya Jamaica Myanmar Portugal
Madagascar Mexico Nepala
Rep. of MoldovaMalawi Montserrat North Korea Romania
Mali Neth. Antilles Oman San Marino
Mauritania Nicaragua Pakistana Slovakia
Mauritius Panama Philippines SloveniaMorocco Paraguay Qatar Spain
Mozambique Peru Russian Federation SwedenNamibia St.Kitts and Nevis Saudi Arabia SwitzerlandNiger St.Lucia Singapore TFYR of Macedonia
Nigeria St.Vincent & Grenadines South Korea Turkey
Rwanda Suriname Sri Lankaa
UkraineSao Tome & Principe Trinidad and Tobago Syria United KingdomSenegal Turks and Caicos Isds Tajikistan
Seychelles Uruguay ThailandSierra Leone USA Timor-Leste
Somalia Venezuela TurkmenistanSouth Africa United Arab EmiratesSudan Uzbekistan
Swaziland Viet NamTogo YemenTunisia
Uganda aSAARC member (South Asian Association for Regional Cooperation)
United Rep. of Tanzania Number of countries in brackets; (Total + SAARC = 194 + 8 = 202)
Zambia Source: This studyZimbabwe