
Is Really NOT the Problem - Bentley · 2017. 10. 5. · Prior to his current position, Smith led...
6
aug/sept 16 uptimemagazine.com for maintenance reliability and asset management professionals ® Maintenance Is Really NOT the Problem
Transcript of Is Really NOT the Problem - Bentley · 2017. 10. 5. · Prior to his current position, Smith led...
aug/
sept
16
uptimemagazine.com
for maintenance reliability and asset management professionals
®
UPTIM
E MAG
AZIN
E AU
GU
ST/SEPTEMBER 2016
MaintenanceIs Really
NOT the Problem

40 aug/sept 16
AMAsset Management
by Andrew Smith
How Rail Analysis and Forecasting Is Ensuring Steady-State Performance
WARNING:Intelligent
Infrastructure Ahead
S eldom do railways have the resources to maintain their infrastructure at a level that ensures steady-state performance. Rather, they are faced with prioritizing maintenance actions to optimize safety and reliability under the burden of constrained resources. Given this reality, railway operations are finding the solution to work more efficiently lies in using informa-tion technology. By harnessing the vast amount of existing rail corridor data in a prioritized plan and then assigning the work and monitoring the execution and results with software,
many railways are doing more with less resources. This strategy is called linear asset decision support (LADS) and it not only results in steady-state asset performance under constrained resources, it also can improve the asset condition and provide a positive return on investment.
The ChallengeManaging a reliable and safe rail corridor is typically performed with insufficient information and
limited resources. Having simple to use and readily available asset location and condition information to prioritize the use of limited resources (e.g., people, materials, equipment and work windows) can dramatically affect the rail corridor’s reliability, safety and profitability.
Typical Rail Asset DataA lack of data relating to a rail asset is rarely an issue for rail operators. Around the world, vehicles
measuring multiple aspects of the network routinely collect gigabytes of data. The issue is not, “Do we have the data?” but “What do we do with it now that we have it?” Rail data is often stored in multiple, disparate silos, with little or no ability to view these data sets together.
Data IssuesRail measurements are also prone to errors of various types:
• Location errors that occur when a feature recorded against the track is in the wrong location;• Flat lines and spikes;• Calibration errors that occur when the data recorded is incorrect because calibration settings used
to convert raw measurements into usable data are incorrect;• Filter warm-up errors occur when the first piece of data in a recording or after a gap within a record-
ing is not valid because filters used to derive it take time to generate valid data;• Environmental issues (e.g., sunlight can blind optical systems) and many measurement devices are
sensitive to temperature, moisture, or vibration;• Low speed issues (e.g., accelerometers are less accurate at lower speeds) and some instrumentation
(e.g., laser scanners) might need to be set to disable automatically at lower speeds for safety reasons;• Deterioration of instrumentation: the instruments used are measuring in a harsh environment and
are prone to knocks and dirt.
Typical Recordings
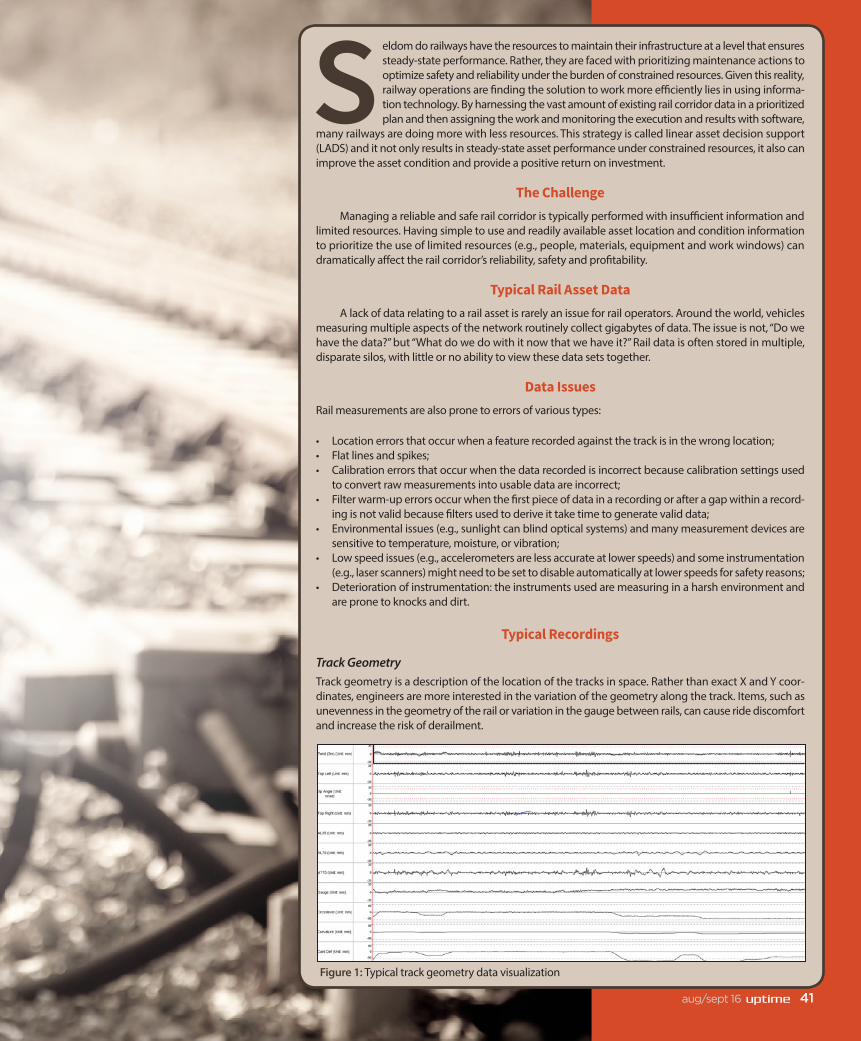
Track GeometryTrack geometry is a description of the location of the tracks in space. Rather than exact X and Y coor-dinates, engineers are more interested in the variation of the geometry along the track. Items, such as unevenness in the geometry of the rail or variation in the gauge between rails, can cause ride discomfort and increase the risk of derailment.
Figure 1: Typical track geometry data visualization
41aug/sept 16

42 aug/sept 16
AMAsset Management
Rail ProfileRail profile is a measure of the wear on the top and side of the rail. Trending this data helps determine where the rail is approaching the end of its lifecy-cle and whether it needs replacing.
Traction Power: Overhead Line and Conductor RailTraction power comes in two variants: overhead line and conductor rail. Overhead line is generally a high-voltage alternating current (AC) system sus-pended above the track. Conductor rail is usually a low-voltage direct current (DC) system with more current.
Asset Location and AttributesData relating to asset locations and asset attri-butes is recorded for information, such as the location and age of the rails, as well as for relat-ed assets, such as bridges, stations and switches. This data set should provide all the information required to define the linear referencing system for the railway. Any asset that may influence main-tenance or renewal decisions should be included.
Maintenance Records: Historic and PlannedHistoric maintenance records should be included for several reasons:
• To allow assessment of the effectiveness of historic maintenance actions;
• To ensure trends in deterioration take into ac-count maintenance that has taken place;
• As a record to allow best practices to be un-derstood and communicated throughout the workforce.
Planned maintenance activities should be in-cluded to compare them to the predicted future state of the network.
UltrasonicUltrasonic data allows engineers to look inside rails in a nondestructive manner.
VideoWhen video is synchronized against all other data sets, it provides context as to what is happening around the assets.
Typical Forms of AnalysisThere are a number of standard forms of
analysis. While the details may vary according to vehicle types, line speeds and units used, the prin-ciples are constant for most rail networks.
AlignmentAs mentioned previously, measurement data suffers from a number of issues that can prevent optimal decision-making. One of the key issues is
the accuracy and reproducibility of the location system used with the measurement system.
For rail measurement data, accuracy and repro-ducibility are defined as:
• Accuracy: How well can the location be identi-fied in the real world?
• Reproducibility: If the same feature is record-ed multiple times, how close together are they reported?
This distinction is important, as a systemat-ic location error would make data reproducible, but not accurate. For example, if there is always a 20-meter error in the reported location of a fault, but the data is highly reproducible, then a fault will be reported repeatedly at exactly the same location. However, the reported location is 20 meters away from where the fault lies in the real world.
Data Cleansing and ValidationAs noted previously, data can suffer from numer-ous issues. The most common of these are spikes and flat lines. Each can be relatively easy to han-dle provided that care is taken not to remove valid data.
SegmentationSegmentation is the logical “cutting up” of the track network into lengths of track that can be
Figure 2: Track geometry data before and after validation and alignment
43aug/sept 16
analyzed separately. This is done for a number of reasons:
• To group together similar lengths of track;• Some channels require a calculation of the
variance of the channel over a length to derive a track quality index;
• To visualize track condition more easily;• To report maintenance requirements in man-
ageable lengths of track.
Segments are normally chosen based on what they need to represent and how they are going to be calculated.
Quality Index GenerationOnce data has been aligned and cleansed, and an appropriate segmentation has been defined to apply quality indexes, quality indexes can be generated.
A quality index is a function applied to mea-surement data over a segment that represents the quality of the asset within that segment.
The value of a quality index should be capa-ble of being affected by certain classes of mainte-nance. The index should be used as a measure for what the state of the asset is and how effective maintenance has been.
Thresholding
As well as defining track quality indexes, net-work maintainers need to know if there are any localized issues in the network that require at-tention. This is determined by taking track ge-ometry measurements and applying thresholds to them.
Trending
Trends are mathematical functions that can be used to estimate future values of track quality indexes.
There are two basic mechanisms for trending future values of data:
• Extrapolation from observations – Where multiple measures of a track quality index have been derived, a best fit line can be drawn through the data and then extended into the future.
• Applying a mathematical prediction to the most recent observation – Where insufficient data exists to produce a best fit based on ob-servations, it becomes necessary to predict values based on a theoretical model.
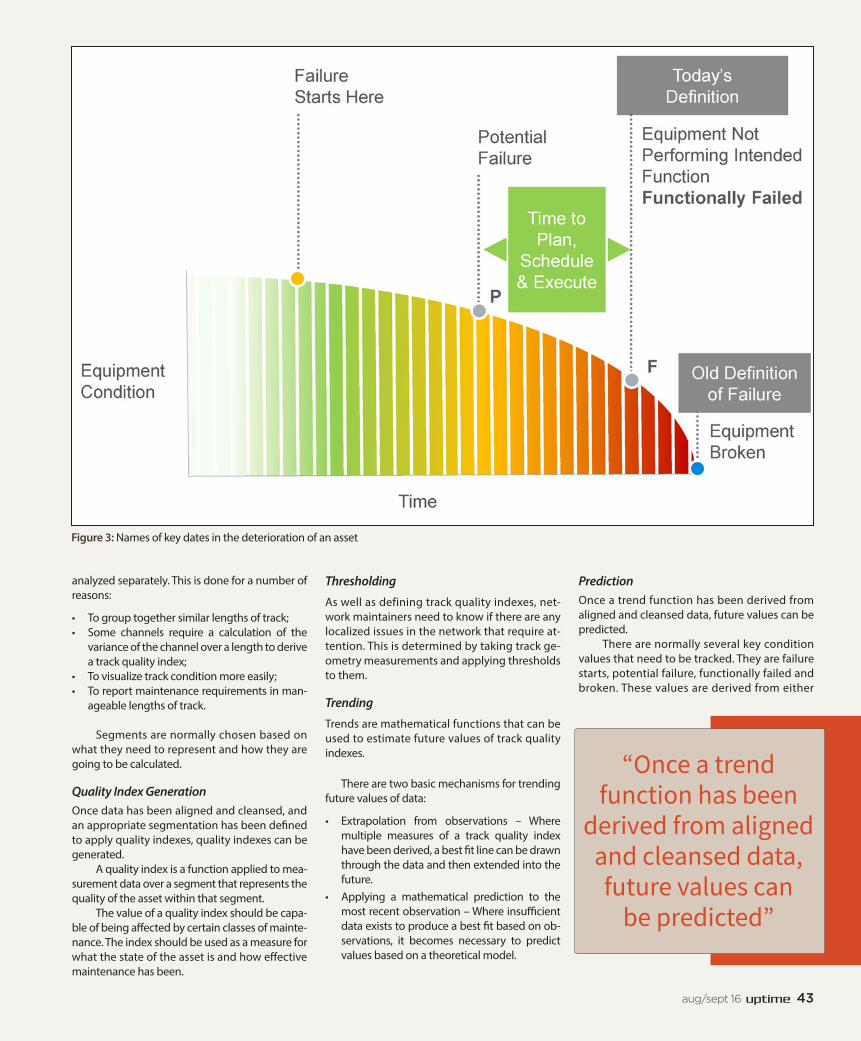
PredictionOnce a trend function has been derived from aligned and cleansed data, future values can be predicted.
There are normally several key condition values that need to be tracked. They are failure starts, potential failure, functionally failed and broken. These values are derived from either
Figure 3: Names of key dates in the deterioration of an asset
“Once a trend function has been
derived from aligned and cleansed data, future values can
be predicted”

44 aug/sept 16
AMAsset Management
thresholding measurements or deriving quality indexes.
Other Uses for Data Measurement
Validation of Maintenance EffectivenessAnalysis of asset condition before and after main-tenance can be used to derive the effectiveness of maintenance.
Asset deterioration typically looks like a saw-tooth diagram, where the asset condition (Y-axis,
where higher values equals worse condition) de-teriorates over time (X-axis, most recent date to the right).
Track Recording CoverageMost rail operators have required monitoring intervals for tracks. These intervals are usually based on line speed or track criticality, with the fastest and most critical tracks monitored more frequently. The actual interval can be derived from the measurement data and then compared to the schedule to ensure inspections adhere to the re-quired standards.
ConclusionWhile track measurement data needs to be
treated carefully to understand its limitations, it contains a wealth of information that can bene-fit maintenance and renewal maintenance en-gineers. Using software applications that place the focus on the analysis and forecasting of data trends, engineers are able to make better in-formed decisions about maintenance, renewals and life extensions. From detecting errors in im-ported data, deriving statistics and exceedances from measurement data, and predicting deteriora-
tion, these predictive analytical tools will be critical for success as the rail industry continues to expand at an increasing rate.
Rail asset managers should take note. Pre-pare for the challenges that lie ahead and turn them into competitive advantages. Include LADS in your rail infrastructure asset management strategy. The result will be steady-state asset per-formance, even under constrained resources, reli-ability and safety, at the lowest possible cost and a positive return on investment.
Andrew Smith is a solutions executive, rail and transit, with Bentley Systems. He has more than 25 years of civil engineering software experience, with 20 years focused on rail and transit solutions globally.
Prior to his current position, Smith led Bentley’s professional services team for rail for 6 years and provided technical leadership and rail operations and maintenance to Network Rail during the roll out of a linear asset decision support system. www.bentley.com
Figure 4: Asset deterioration including a maintenance event
“Engineers are able to make better
informed decisions about maintenance,
renewals and life extensions”