Is Parabolic Trough Solar Power Plant Technology …infohouse.p2ric.org/ref/46/45489.pdf · Kramer...
21
IS PARABOLIC TROUGH SOLAR POWER PLANT TECHNOLOGY READY FOR ITS NEXT GROWTH SURGE? David Kearney, K&A Henry Price, NREL WREC Denver, Colorado 31 August 2004
Transcript of Is Parabolic Trough Solar Power Plant Technology …infohouse.p2ric.org/ref/46/45489.pdf · Kramer...

IS PARABOLIC TROUGH SOLAR POWER PLANT TECHNOLOGY
READY FOR ITS NEXT GROWTH SURGE?
David Kearney, K&A
Henry Price, NREL
WRECDenver, Colorado
31 August 2004

YES
but why?
Excellent operating experience Technology advances Stronger supplier base
Large plants in developmentOpportunities for significant new deployments
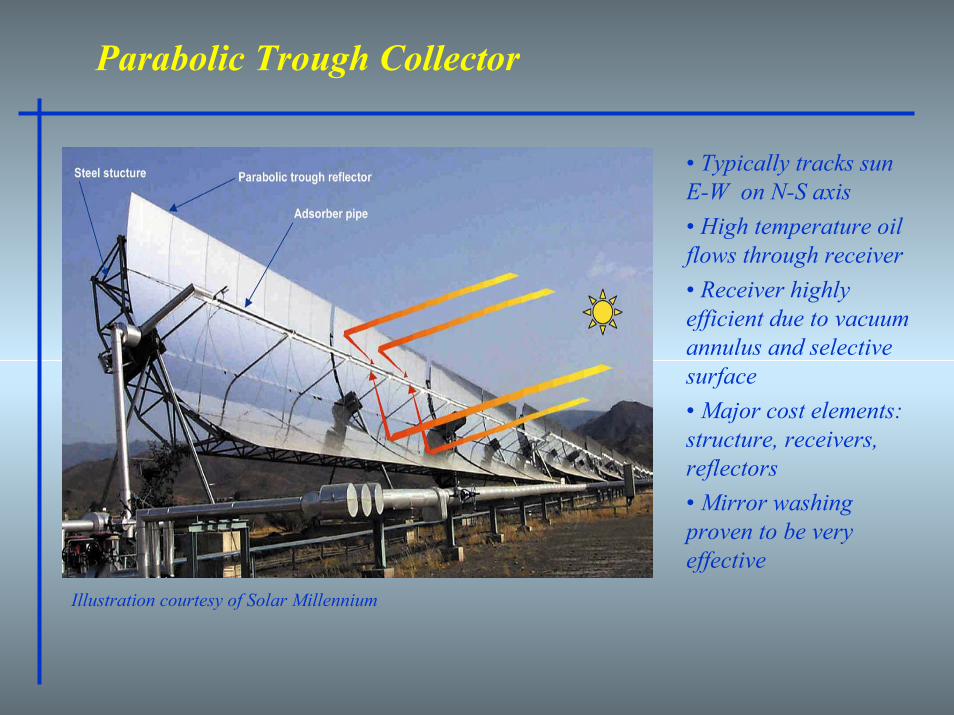
Parabolic Trough Collector
• Typically tracks sun E-W on N-S axis• High temperature oil flows through receiver• Receiver highly efficient due to vacuum annulus and selective surface• Major cost elements: structure, receivers, reflectors• Mirror washing proven to be very effective
Illustration courtesy of Solar Millennium

● Parabolic trough collectors concentratedirect beam radiation onto receiver, heating circulating high temperature fluid at 400C
● Via shell-and-tube heat exchangers, solar field heat used to generate high temperature, high pressure steam
● Larger power systems can be either steam Rankine cycles or combined cycles, from 30MWe to over 300 MWe
● Systems can use fossil fuel or thermal storage to raise capacity factor or shift time of electrical production
Key Technical Characteristics

Key Technical Characteristics (continued)
● Dispatchability achieved with thermal storage or hybrid operation (with fossil) => approaches firm power
● Proven long-term operation in California● Technology development path to competitive electricity
cost levels identified ● Ready for rapid manufacturing scale-up to GW level
deployment

Solar Electric Generating SystemRankine Cycle
ConventionalSteam Plant
Solar Field

EdwardsAF Base
CA 58
US 395
KJ SEGSPlants
• 354 MWe installed• 7000 GWH operations• 110% peak availability• $1.25 Billion invested• Matured O&M procedures• Technical advances lowered costs
Kramer Junction, Calif.Five 30-MWe Trough Plants

Kramer Junction Operational ExperienceElectrical Output
0
200
400
600
800
1,000
1985 1987 1989 1991 1993 1995 1997 1999 2001 2003
Year of Operation
Ann
ual G
ross
Sol
ar G
ener
atio
n (G
Wh)
0
2
4
6
8
10
Cum
ulat
ive
Gro
ss S
olar
G
ener
atio
n (T
Wh)
Cumulative Generation
Annual Generation

Cost Reduction OpportunitiesParabolic Trough Technology
● Plant Size● Concentrator Design● Advanced Receiver Technology● Thermal Energy Storage● O&M● Design Optimization/Standardization● Power Park● Competition● Financial

Trough Development ScenarioBreakdown of Cost Reduction (Sargent & Lundy)
0.00
0.05
0.10
0.15
0.20
0.25
0.30
0 1000 2000 3000 4000 5000
Cumulative Installed Capacity (MWe)
LC
OE
200
2 $/
kWh
Factors Contributing to Cost Reduction- Scale-up 37%- Volume Production 27%- Technology Dev. 42%
1988 30-MW SEGS
Current Potential 2004 Technology, 50-MWe Size, Optimum Location
1984 14-MW SEGS
Future Cost Potential2004-2012
1989 80-MW SEGS

Current State-of-the-Art50 MWe Trough Plant
● Current State-of-the-Art (Plant built today)◗ 50 MWe (~100 bar, 700F, 37.5% gross)◗ LS-2 Collectors (391 C)◗ Receiver – Solel UVAC◗ Solar only or hybrid ◗ Solar multiple 1.5◗ No thermal storage◗ DNI 8.0 kWh/m2-day
Site: Kramer Junction Solar Only
Hybrid (25%)
Plant size, net electric [MWe] 50 50 Collector Aperture Area [km2] 0.312 0.312 Thermal Storage [hours] 0 0 Solar-to-electric Efficiency. [%] 13.9% 14.1% Plant Capacity Factor [%] 29.2% 39.6% Capital Cost [$/kWe] 2745 2939 O&M Cost [$/kWh] 0.024 0.018 Fuel Cost [$/kWh] 0.000 0.010 Levelized Cost of Energy [2002$/kWh]
0.110 0.096
Current Cost11¢/kWh

Plant SizeImpact on Cost of Energy
0.204
0.1370.110
0.094 0.084 0.076
0.00
0.05
0.10
0.15
0.20
0.25
10 25 50 100 200 400
Plant Size MWe
LCO
E 20
02$/
kWh
Near-Term Trough Plant
Reference Case

0.100
0.105
0.110
0.115
0.120
0.125
0.130
0.135
0.140
0.91 0.92 0.93 0.94 0.95 0.96 0.97 0.98 0.99
Absorptance
LCO
E ($
/kW
h)
SEGS VICermetUVACUVAC2Adv Adv Rel
E = 0.15
E = 0.10
E = 0.05
Near-Term ReceiverTechnology Assumption
Field Tested
Near-Term 50 MWe Trough Plant
Trough Receiver TechnologyImpact on the Cost of Energy

Thermal Storage TechnologyImpact on Cost of Energy
0 .110
0 .10 1
0 .0 9 6
0 .0 9 1 0 .0 9 0
0 .10 5
0.085
0.090
0.095
0.100
0.105
0.110
0.115
0.120
NoStorage
2-TankIndirect
TCIndirect
2-TankDirect450C
TC Direct450C
TC Direct500C
LCO
E 2
002$
/kW
h
0
5
10
15
20
25
30
35
Sto
rage
Cos
t $/k
Wht
LCOEStorage Cost
Near-Term 50 MWe Trough Plant

Cost of CapitalImpact on Cost of Energy
0.110
0.098
0.081
0.116
0.1100.107
0.097
0.080
0.085
0.090
0.095
0.100
0.105
0.110
0.115
0.120
8.5% 6% 2% 18% 14% 12% 8%
LCO
E 2
002$
/kW
h
Debt rate, IRR=14% IRR, debt 8.5%
Near-Term 50 MWe Trough Plant

Tax IncentivesImpact on Cost of Energy
0.110
0.119
0.109
0.093
0.115
0.078
0.070
0.080
0.090
0.100
0.110
0.120
0.130
Bas e 10%ITC
No ITC 1.7c P TC 30% ITC NoP rop erty
Tax
All
LCO
E 2
002$
/kW
h
Near-Term 50 MWe Trough Plant

Future Development ScenarioParabolic Trough Technology
0.00570.01030.02330.0462O&M Cost $/kWh
20%5%Cost Reduction
56%56%30%22%Capacity Factor
2225341628652954Capital Cost $/kWe
17.2%16.2%13.4%10.6%Solar to Electric η
12 hrsTC Dir
12 hrsTC Dir
NANATES
Salt500 C
Salt450 C
VP-1390 C
VP-1390 C
HTF
Adv Adv
LS-3+Adv
LS-2UVAC2
LS-2 Luz
CollectorReceiver
4002.5
1002.5
501.5
301.2
Plant Size: MWeSolar Multiple
Long-Term
Mid-Term
Near-Term
SEGS VI 1989

Trough Power Plant Scenarios with Different Financing Assumptions
0.00
0.02
0.04
0.06
0.08
0.10
0.12
Near-Term Mid-Term Long-Term
LCO
E 20
02$/
kWh
IP P w/10% ITCIP P w/1.8c P TC30% ITC + 1.8c P TCMuni F inanc ing
Region ofInterest

CountryMW Capacity
2010Algeria 130
Australia 100Brazil 100Egypt 130
Greece 50India 130Iran 130
Israel 200Italy 100
Jordan 130Mexico 300
Morocco 150Namibia 100
South Africa 100Spain 200
United States 200
TOTAL 2250
CSP Market Areasand
Lead Near-Term Opportunities

Market Pull Required for Success
● Market aggregation● Incentives● Favorable financing● Policy changes● Electricity production must be high to
seriously impact reduction of green house gases
● Ultimate price goals tied to GW-scale deployment in 10-100 GW range

Summary
● Huge domestic resource potential● Trough technology has significant opportunities
for cost reduction● Trough technology could directly compete with
fossil power technologies in the long-term● Market or financial incentives needed for early
plants