Is orthorexia a security motivated eating behaviour? An ...
178
Lakehead University Knowledge Commons,http://knowledgecommons.lakeheadu.ca Electronic Theses and Dissertations Electronic Theses and Dissertations from 2009 2017 Is orthorexia a security motivated eating behaviour? An examination through cognitive bias and cardiac reactivity to food Mascioli, Brittany A. https://knowledgecommons.lakeheadu.ca/handle/2453/4129 Downloaded from Lakehead University, KnowledgeCommons
Transcript of Is orthorexia a security motivated eating behaviour? An ...
Lakehead University
Knowledge Commons,http://knowledgecommons.lakeheadu.ca
Electronic Theses and Dissertations Electronic Theses and Dissertations from 2009
2017
Is orthorexia a security motivated eating
behaviour? An examination through
cognitive bias and cardiac reactivity to food
Mascioli, Brittany A.
https://knowledgecommons.lakeheadu.ca/handle/2453/4129
Downloaded from Lakehead University, KnowledgeCommons
Is Orthorexia a Security Motivated Eating Behaviour? An Examination through Cognitive Bias
and Cardiac Reactivity to Food
By
Brittany A. Mascioli
A thesis submitted to the Department of Psychology in partial fulfillment of the requirements for
the degree of Master of Arts
in Clinical Psychology
Department of Psychology
Lakehead University
Thunder Bay, Ontario
July 25, 2017
ii
Abstract
Orthorexia is a rigid style of eating that aims to prevent illness that is characterized by a
preference for natural foods was investigated as a biologically driven trait with evolutionary
roots in a precautionary system of threat avoidance. Research has shown that a precautionary
state of this nature is responsive to subtle indicators of potential threat and is detectable through
cardiac monitoring. Cardiac monitoring was used to infer activation of this precautionary system
in response to experimentally manipulated, food-related threat. In addition to this physiological
investigation of orthorexia, cognitive and behavioural aspects were also evaluated. One hundred
university students were exposed to natural and nonnatural food stimuli before ranking the
stimuli in order of preference. They participated in a taste test in which food preferences were of
interest. They completed an implicit association test assessing the relative attitudes toward
natural and nonnatural food. Finally, they completed a simulated grocery shopping task assessing
food preferences and behavioural intentions. A notable result was the predictive ability of
orthorexia concerning the total volume of food consumed during the taste test. Conclusions were
unable to be drawn with respect to precautionary system activation due to the failure of the threat
manipulation. Performance on a novel task of orthorexia-related behavioural intention was
significantly predicted by orthorexic tendency. It was also demonstrated that this relationship is
contingent upon a third variable, BMI. Further, it was demonstrated that the predictive
relationship between orthorexic tendency and performance on this behavioural task is moderated
by food preference, operationally defined in terms of both (a) the rank-ordering of the food
stimuli; and (b) the relative volume of natural and nonnatural food consumed during the taste
test. The obtained results can be understood in the context of the theory of planned behaviour.
iii
Table of Contents
Introduction………………………………………………………………………………………..1
Orthorexia…………………………………………………………………………………2 Prevalence………………………………………………………………………....4
Classification………………………………………………………………………7 Healthy Eating in the General Population……………………………………….10 Measurement...…………………………………………………………………...13 Relevance……...…………………………………………………………………17
Security Motivation……………………………………………………………………...19 Relevance………………………………………………………………………...27
Vagal Tone…….……………………………….………………………………………...27 Vagal Tone and Security Motivation………...……………………………..……30 Relevance………………………………………………………………………...31
Cognitive Bias…………………………………………………………………………....31 Attentional Bias………………………………………………………………….32 Implicit Cognition…………..……………………………………………………32 Relevance………………………………………………………………………...33 The Present Study………………………………………………………………………..35 Method…………………………………………………………………………………………...39
Participants………………………………………………………………………….……39 Materials…………………………………………………………………………………40
Demographic Questionnaire……………………………………………………..40 Eating Attitudes Test……………………………………………………….…….40
Body Image States Scale…………………………………………………….…...41 Short Health Anxiety Inventory………………………………………………….42 ORTO-15……………………………………………………………...................43 Balanced Inventory of Desirable Responding…………………………………...43 Taste Test Stimuli………………………………………………….…………….44 Procedure………………………………………………………………………………...45
Food Preference Task and Taste Test..…………………………………………..45 Implicit Association Test………………………………………………………...47
Shopping Task…………………………………………………………………...50 Recording of the Electrocardiogram ……………………………………….........50 Results …………………………………………………………………………………………...51
HRV Variables…………………………………………………………………….……..52 Composite scores…………………………………………...……………………53
Data Analytic Approach……………………………………….………………………...53 Parametric Assumptions…………………………………………………………………54 Data Preparation……………………………………………………………………….…55
ECG recordings…………………………………………………………………..56 Psychometric variables……………………………………………......................56
iv
Food exposure task variables…………………………………………………….58 HRV variables…………………………………………….……………………...60
Threat Manipulation……………………………………………………………………...60 Test of Hypotheses……………………………………………………………………….61 Hypothesis 1……………………………………………………………………...61 Hypothesis 2……………………………………………………………………...63 Hypothesis 3……………………………………………………………………...64 Hypothesis 4……………………………………………………………………...66 Summary…………………………………………………………...…………….66 Exploratory Analyses…………………………………………………………………….67 Summary of exploratory analyses………………………………………………..69
Discussion………………………………………………………………………………………..70 Threat Manipulation……………………………………………………………………...70 Behavioural Intention and Realization…………………………………………………...73 Ajzen’s theory of planned behaviour…………………………………………….74 Hypotheses and Exploratory Analyses…………………………………………………..76 Hypothesis 1……………………………………………………………………...76 Hypothesis 2……………………………………………………………………...79 Hypothesis 3……………………………………………………………………...79 Hypothesis 4……………………………………………………………………...83 Exploratory analyses……………………………………………………………..84 Clinical Implications……………………………………………………………………..87 Limitations and Future Directions……………………………………………………….90 Conclusions………………………………………………………………………………91 References ……………………………………………………………………………………….93
Appendices …………………………………………………………………………………..…134
v
List of Tables
Table 1. The HRV Recording Blocks, Task Names, and Descriptive Information.……………108
Table 2. Descriptive Statistics and Reliability Coefficients for Psychometric Variables………109
Table 3. Intercorrelations Among Psychometric Variables…………………………………….110
Table 4. Descriptive Statistics for Food Exposure Task Variables………………………….....111
Table 5. Intercorrelations Among Food Exposure Task Variables…………………………......112
Table 6. Descriptive Statistics of Original and Log Transformed RMSSD, HF, and SD1 by
Recording Block……………………………………………………………………......113
Table 7. Descriptive Statistics of Baseline and Exposure Composite Scores of Original and Log
Transformed RMSSD, HF and SD1……………………………………………………114
Table 8. Descriptive Statistics and Reliability Coefficients for Affective Psychometric
Variables……………………………………………………………………………......115
Table 9. Unstandardized Regression Coefficients (SE) for Hypothesis 1 Predicting Food
Preference According to Sample Ranking and Consumption and Total Food
Consumed…………………………………………………………………………......116
Table 10. Unstandardized Moderated Regression Coefficients (SE) for Moderated Regression
Investigating Hypothesis 2, where HRV Recording Block 3 is Criterion Variable and
Block 1 is Covariate ….……………………………………………………………….117
Table 11. Unstandardized Moderated Regression Coefficients (SE) for Moderated Regression
Investigating Hypothesis 2, where HRV Recording Block 4 is Criterion Variable and
Block 2 is Covariate…………………………………………………….…………………..118
Table 12. Unstandardized Moderated Regression Coefficients (SE) for Moderated Regression
Investigating Hypothesis 2, where HRV Exposure Composite Score is Criterion Variable
vi
and Baseline Composite score is Covariate….………………………………………...118
Table 13. Unstandardized Regression Coefficients (SE) for Hypothesis 3 Predicting Cognitive
Bias According to Natural and Caloric Value of Foods………………………………..120
Table 14. Unstandardized Regression Coefficients (SE) for Hypothesis 4 Predicting Food
Preference According to Shopping Task Score……………………………….………..121
Table 15. Unstandardized Regression Coefficients (SE) for Exploratory Regression Analysis
Investigating Moderation of Orthorexia by BMI in the Prediction of Shopping Task
Performance……………………………………………………………………………122
vii
List of Figures
Figure 1. Hypothetical model of the moderating effect of experimentally induced threat level on
the relationship between trait orthorexia and security motivation……………………...124
Figure 2. Timeline of experimental procedure for laboratory visit ……………………………125
Figure 3. Conceptual diagram of PROCESS Model 1 (Hayes, 2013)………………………….126
Figure 4. Shopping task score plotted as a function of Polish 9-item version of ORTO-15 Test
(reciprocal; ORTO-P9r) by natural log transformed-body mass index (BMI(ln))
controlling for gender, EAT-26(ln), SHAI(ln), and BISS. …………………………….127
Figure 5. Shopping task score plotted as a function of Polish 9-item version of ORTO-15 Test
(reciprocal; ORTO-P9r) by sample ranking controlling for gender, EAT-26(ln),
SHAI(ln), and BISS. …………………………………………………………..……….128
Figure 6. Shopping task score plotted as a function of Polish 9-item version of ORTO-15 Test
(reciprocal; ORTO-P9r) by sample consumption controlling for gender, EAT-26(ln),
SHAI(ln), and BISS. …………………………………………………………………...129
Figure 7. Conceptual diagram of theory of reasoned action (Madden, Ellen, & Ajzec,
1992)……………………………………………………………………………………130
Figure 8. Conceptual diagram of theory of reasoned action applied to the present study...........131
Figure 9. Conceptual diagram of theory of planned behaviour (Madden, Ellen, & Ajzec,
1992)……………………………………………………………………………..……..132
Figure 10. Conceptual diagram of theory of planned behaviour applied to the present
study…………………………………………………………………………………….133
viii
List of Appendices
Appendix A: Bratman Orthorexia Test (BOT)……………………………………...……….…134
Appendix B: ORTO-15 Test and Scoring Chart……………………………………...……...…135
Appendix C: Participant Information Letter……………………………………….…...………138
Appendix D: Participant Consent Form…………………………………………………...……140
Appendix E: Eating Attitudes Test-26 (EAT-26)……………………………………………....141
Appendix F: Body Image States Scale (BISS)……………………………………………........147
Appendix G: Short Health Anxiety Inventory (SHAI)………………………………………...149
Appendix H: Balanced Inventory of Desirable Responding (BIDR)…………………………..153
Appendix I: Heart Rate Electrode Placement………………………………………….………163
Appendix J: IAT Target Concept Images………………………………………………...….....165
Appendix K: Selected Screenshots of the Shopping Task…………………………..…………169
1
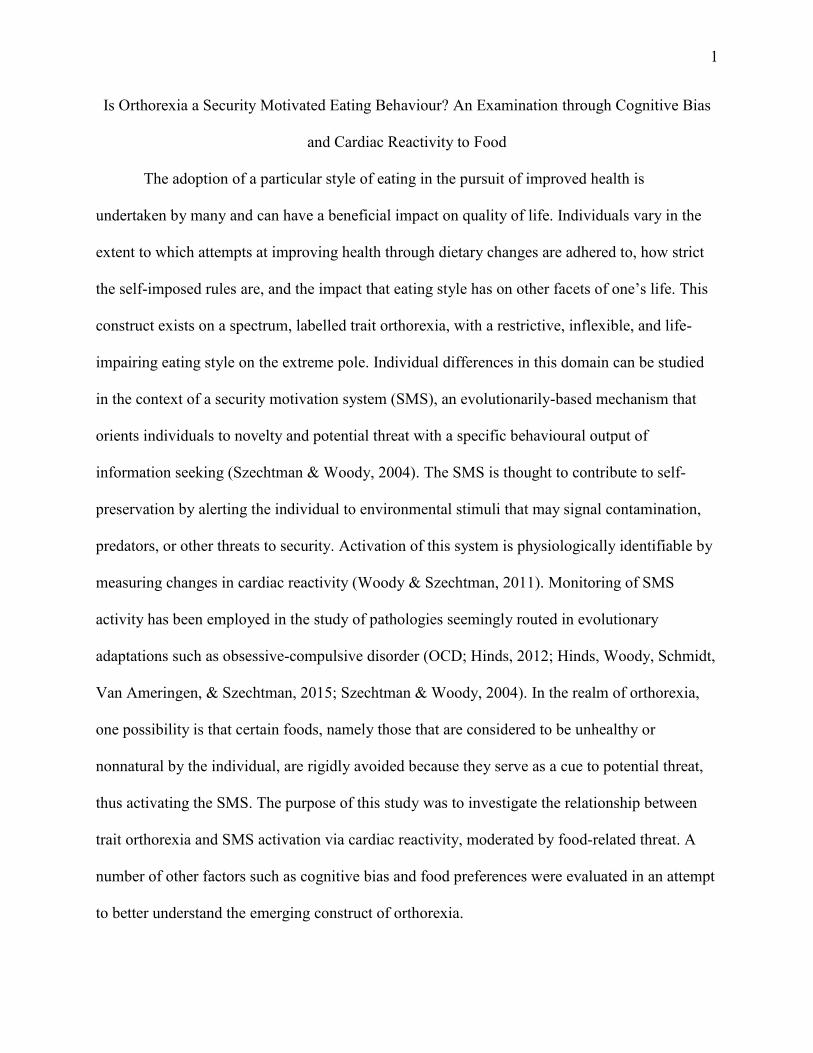
Is Orthorexia a Security Motivated Eating Behaviour? An Examination through Cognitive Bias
and Cardiac Reactivity to Food
The adoption of a particular style of eating in the pursuit of improved health is
undertaken by many and can have a beneficial impact on quality of life. Individuals vary in the
extent to which attempts at improving health through dietary changes are adhered to, how strict
the self-imposed rules are, and the impact that eating style has on other facets of one’s life. This
construct exists on a spectrum, labelled trait orthorexia, with a restrictive, inflexible, and life-
impairing eating style on the extreme pole. Individual differences in this domain can be studied
in the context of a security motivation system (SMS), an evolutionarily-based mechanism that
orients individuals to novelty and potential threat with a specific behavioural output of
information seeking (Szechtman & Woody, 2004). The SMS is thought to contribute to self-
preservation by alerting the individual to environmental stimuli that may signal contamination,
predators, or other threats to security. Activation of this system is physiologically identifiable by
measuring changes in cardiac reactivity (Woody & Szechtman, 2011). Monitoring of SMS
activity has been employed in the study of pathologies seemingly routed in evolutionary
adaptations such as obsessive-compulsive disorder (OCD; Hinds, 2012; Hinds, Woody, Schmidt,
Van Ameringen, & Szechtman, 2015; Szechtman & Woody, 2004). In the realm of orthorexia,
one possibility is that certain foods, namely those that are considered to be unhealthy or
nonnatural by the individual, are rigidly avoided because they serve as a cue to potential threat,
thus activating the SMS. The purpose of this study was to investigate the relationship between
trait orthorexia and SMS activation via cardiac reactivity, moderated by food-related threat. A
number of other factors such as cognitive bias and food preferences were evaluated in an attempt
to better understand the emerging construct of orthorexia.
2
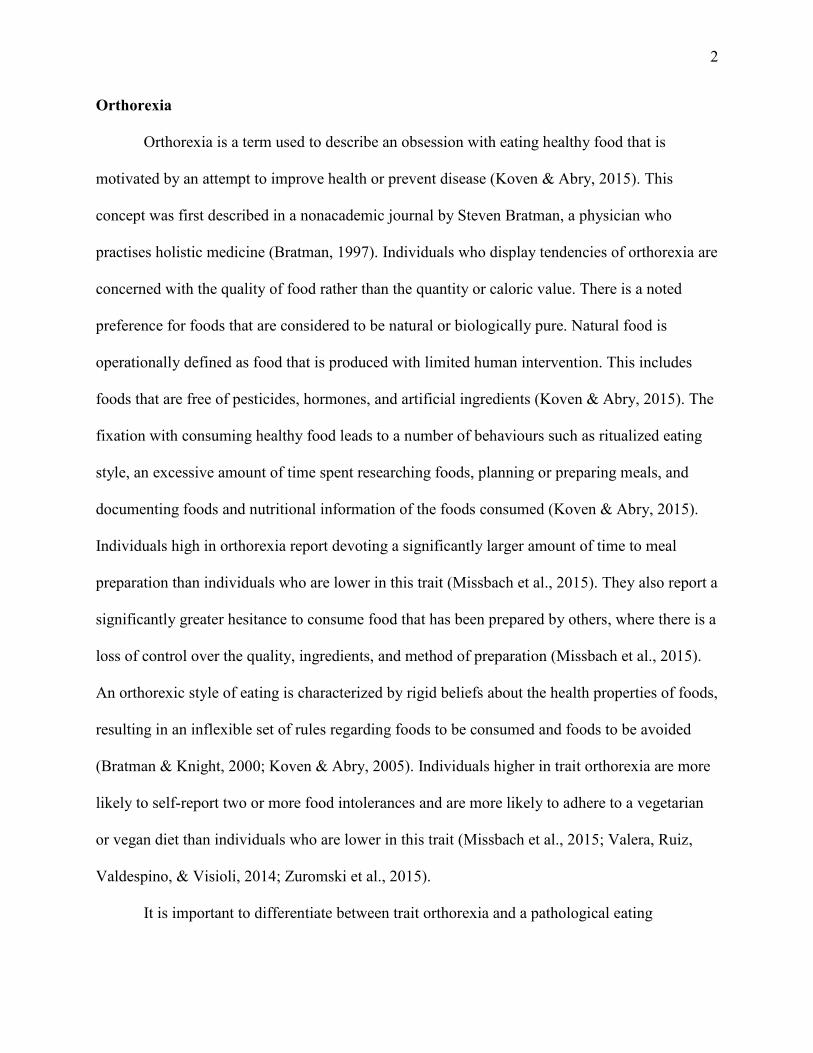
Orthorexia
Orthorexia is a term used to describe an obsession with eating healthy food that is
motivated by an attempt to improve health or prevent disease (Koven & Abry, 2015). This
concept was first described in a nonacademic journal by Steven Bratman, a physician who
practises holistic medicine (Bratman, 1997). Individuals who display tendencies of orthorexia are
concerned with the quality of food rather than the quantity or caloric value. There is a noted
preference for foods that are considered to be natural or biologically pure. Natural food is
operationally defined as food that is produced with limited human intervention. This includes
foods that are free of pesticides, hormones, and artificial ingredients (Koven & Abry, 2015). The
fixation with consuming healthy food leads to a number of behaviours such as ritualized eating
style, an excessive amount of time spent researching foods, planning or preparing meals, and
documenting foods and nutritional information of the foods consumed (Koven & Abry, 2015).
Individuals high in orthorexia report devoting a significantly larger amount of time to meal
preparation than individuals who are lower in this trait (Missbach et al., 2015). They also report a
significantly greater hesitance to consume food that has been prepared by others, where there is a
loss of control over the quality, ingredients, and method of preparation (Missbach et al., 2015).
An orthorexic style of eating is characterized by rigid beliefs about the health properties of foods,
resulting in an inflexible set of rules regarding foods to be consumed and foods to be avoided
(Bratman & Knight, 2000; Koven & Abry, 2005). Individuals higher in trait orthorexia are more
likely to self-report two or more food intolerances and are more likely to adhere to a vegetarian
or vegan diet than individuals who are lower in this trait (Missbach et al., 2015; Valera, Ruiz,
Valdespino, & Visioli, 2014; Zuromski et al., 2015).
It is important to differentiate between trait orthorexia and a pathological eating
3
behaviour which has been labelled orthorexia nervosa (Bratman & Knight, 2000). Many studies
have attempted to assess the prevalence of orthorexia nervosa using measures such as the
Bratman Orthorexia Test (BOT; Bratman & Knight, 2000) or the ORTO-15 Test (Donini,
Marsili, Graziani, Imbriale, & Cannella, 2004), which has resulted in gross overestimations of
prevalence whereby over 50% of the sample, in some studies, are classified as orthorexic. These
measures should be considered indices of trait orthorexia since, as articulated by Dunn and
Bratman (2016), no information is obtained regarding functional or social impairment or state of
physical health through the use of these measures. Trait orthorexia can be conceptualized as a
collection of behaviours and cognitions related to healthful eating, existing on a bipolar
continuum. At the most severe end of this spectrum is a pathological collection of symptoms
associated with marked impairment and distress within the individual.
In extreme cases, the list of foods considered healthy by the individual becomes severely
restricted, leading to nutritional deficiencies and making the individual at risk for a variety of
health complications including osteopenia, anemia, hyponatremia, hypokalemia, metabolic
acidosis, pancytopenia, testosterone deficiency, subcutaneous emphysema, mediastinal
emphysema, pneumothoraxes, rhabdomyolysis, bradycardia and potentially refeeding syndrome
(Koven & Abry, 2015; Moroze, Dunn, Holland, Yager, & Weintraub, 2015; Park et al., 2011).
These health issues result from food restriction and are also observed in individuals with
anorexia nervosa.
Individuals high in trait orthorexia have deficits in set-shifting, self-monitoring, and
working memory (Koven & Senbonmatsu, 2013). The difficulty with set-shifting may account
for the rigid set of guidelines about food that is typical in orthorexia (Koven & Abry, 2015). The
attention of individuals high in trait orthorexia is very self-focused. In a correlational study by
4
Koven and Senbonmatsu (2013), trait orthorexia was positively associated with self-monitoring,
assessed through a self-report measure of deficits in executive functioning. This finding may
account for the impairment in attention to external cues that is also observed in trait orthorexia
(Koven & Abry, 2015). Since there is a finite amount of information that can be stored in
working memory, the observed deficit in individuals high in trait orthorexia is hypothesized to be
the result of working memory being occupied by food-centered thoughts (Koven &
Senbonmatsu, 2013).
Despite the relatively limited amount of attention that orthorexia has received in the
scientific literature, it is not unheard of nor is it unrecognizable in the clinical domain. In a
survey of mental health professionals mainly comprised of psychologists, 66.7% reported having
observed a case of orthorexia within their practice, and 68.5% indicated that orthorexia is
deserving of more attention (Vandereycken, 2011). Information from a small number of case
studies has been published pertaining to relatively serious presentations of orthorexia. Some
recurrent observations extracted from these case studies include reporting bizarre beliefs about
food, a strong conviction of the benefit of consuming only biologically pure foods in their most
natural state, onset following an initial attempt to improve some aspect of health, engaging in
compulsive food rituals, purposeful isolation from others with different beliefs about food and
health, and a lack of concern about weight change or body image (Catalina-Zamora, Bote-
Bonaechea, García-Sánchez, & Ríos-Rial, 2005; Moroze et al., 2015; Park et al., 2011;
Saddichha, Babu, & Chandra, 2012).
Prevalence. The prevalence of orthorexia is distributed relatively equally with respect to
gender. Although two studies using the ORTO-15 (Aksoydan & Camci, 2009; Donini et al.,
2004), and one study using the Turkish version of the ORTO-15 (Fidan, Ertekin, Işikay, &
5
Kırpınar, 2010) have found higher point prevalence of orthorexia in males, other studies have
found no gender differences using the ORTO-15 (Bağcı Bosi, Çamur, & Güler, 2007; Bo et al.,
2014; Segura-García et al., 2012) the Polish version of the ORTO-15 (Brytek-Matera, Donini,
Krupa, Poggiogalle, & Hay, 2015; Brytek-Matera, Krupa, Poggiogalle, & Donini, 2014), and the
BOT (Bundros, Clifford, Silliman, & Neyman Morris, 2016). One study using the ORTO-15
found a higher prevalence in females (Ramacciotti et al., 2011).
There are a number of studies that report prevalence rates of orthorexia within a variety
of populations. Before reporting on those rates, a number of limitations are first noted. The
obtained rates are heterogeneous and often higher than would be expected of nonclinical
samples. There are a few possible explanations for the variable and inflated estimates of
prevalence that are reported in the published literature. First, there are a number of different
scales, variations of individual scales, as well as more or less conservative cutoff scores used to
indicate the presence of orthorexia. Second, a categorical approach is typically undertaken
whereby orthorexia is treated as a discrete syndrome that is either present or absent within an
individual. In other words, there is no effort made to tease apart individuals who fall at different
points along the spectrum of trait orthorexia. Near the low end of the spectrum, individuals may
display some mild tendencies characteristic of orthorexia whereas the more severe pole of the
spectrum may include individuals who meet the Diagnostic and Statistical Manual of Mental
Disorders (5th ed.; DSM-5; American Psychiatric Association, 2013) criteria of
Avoidant/Restrictive Food Intake Disorder (ARFID). Another limitation is that the published
studies that report point prevalence have been conducted in a number of different countries,
using a variety of different samples for which there may in fact be true differences in prevalence.
Finally, the existing measures of orthorexia do not determine degree of impairment, distress, or
6
health impact and thus do not provide an estimate of the number of individuals dealing with an
impairing or distressing collection of symptoms (Dunn & Bratman 2016). As such, the reported
rates should be interpreted as the proportion of sample individuals who displayed tendencies of
orthorexia, or some degree of trait orthorexia.
Prevalence estimates from samples in the general population have been inconsistent.
Donini et al. (2004) found a prevalence of 6.9% using a sample from the general population in
Italy while Ramacciotti et al. (2011) found a prevalence of 56.7% nearly 10 years later. Using
the German version of the ORTO-15, a prevalence of 69.1% was found using a sample from the
general population in Germany (Missbach et al., 2015).
High trait orthorexia is observed more frequently in particular occupations where there is
an emphasis on health, nutrition, or physical performance. A study in Italy demonstrated that
athletes were more likely to display tendencies of orthorexia than nonathletes (Segura-García et
al., 2012). Prevalence rates of 86% in yoga instructors (Valera et al., 2014), 82% in opera
singers, 36% in symphony orchestra musicians, and 32% in ballet dancers (Aksoydan & Camci,
2009) have been reported. Within health-related occupations, rates of 44% among medical
students (Fidan et al., 2010), 46% among medical residents (Bağcı Bosi et al., 2007), and 13%
among female dieticians (Kinzl, Hauer, Traweger, & Kiefer, 2006), have been observed.
There are no reported differences across programs of study in postsecondary education
using the BOT (Bundros et al., 2016; Korinth, Schiess, & Westenhoefer, 2010) or the ORTO-15
(Bo et al., 2014; Missbach et al., 2015). A positive correlation between age and trait orthorexia
has been observed using the ORTO-15 (Aksoydan & Camci, 2009) although this effect was not
replicated using the BOT (Bundros et al., 2016).
A key feature of the eating disorders that have been established and are recognized by the
7
American Psychiatric Association is a concern with body image and a desire to lose weight or to
avoid weight gain (American Psychiatric Association, 2013). The relationship between body
image and orthorexia is less clear, although it has been argued that weight concern is not an issue
nor is it a motivating factor behind food choices in orthorexia (Brytek-Matera, 2012; Catalina-
Zamora et al., 2005; Moroze et al., 2015; Varga, Dukay-Szabó, Túry, & van Furth, 2013). A
negative association has been observed between trait orthorexia and a preoccupation with weight
as well as a focus on dieting (Brytek-Matera, Donini, et al., 2015; Brytek-Matera, Rogoza,
Gramaglia, & Zeppegno, 2015). Individuals with high trait orthorexia also perceived their
physical appearance as being less important, but demonstrated higher levels of satisfaction with
most areas of their bodies (Brytek-Matera, Donini, et al., 2015). Higher scores on the BOT were
associated with the extent to which western ideals of physical appearance, slimness for women
and muscularity for men, were accepted (Eriksson, Baigi, Marklund, & Lindgren, 2008). This
latter finding is not, in itself, indicative of body image issues and could be explained as an
acceptance of body types that are considered representative of optimal health.
The relationship between orthorexia and body mass index (BMI) remains unclear. Trait
orthorexia was found to be positively correlated with BMI using the ORTO-15 (Aksoydan &
Camci, 2009), the Turkish version of the ORTO-15 (Fidan et al., 2010), and the BOT (Bundros
et al., 2016). Bağcı Bosi et al. (2007) found no relationship between trait orthorexia and BMI
using the ORTO-15.
Classification. There is considerable debate in the literature regarding the nature of
orthorexia, particularly with respect to the boundaries with eating disorders as well as with OCD
(Brytek-Matera, 2012). There are a number of similarities between the recognized eating
disorders and orthorexia. A study found high trait orthorexia, as measured by the BOT, to be
8
associated with eating pathology or eating disorder risk, as measured by the Eating Attitudes
Test-26 (EAT-26; Bundros et al., 2016). This association was also found using the ORTO-15 to
measure trait orthorexia (Segura-García et al., 2012). It has been speculated that trait orthorexia
observed over the course of an eating disorder may serve as a socially acceptable manifestation
of the underlying eating pathology, as healthy eating is typically idealized as a virtue (Brytek-
Matera, Rogoza, et al., 2015). Musolino, Warin, Wade and Gilchrist (2015) describe how
tendencies of orthorexia are used by some eating disorder patients in order to rationalize their
illness or to maintain their pathological style of eating under the guise of a health-focused
recovery. Additionally, trait orthorexia was found to be positively correlated with the number of
diets undertaken in an individual’s history (Missbach et al., 2015; Segura-García et al., 2012).
Some personality aspects that are common to both orthorexia and anorexia include
perfectionism, high trait anxiety, and a high need for control (Koven & Abry, 2015). Trait
orthorexia is positively associated with restraint and cognitive control of eating behaviour (Kinzl
et al., 2006). Impaired set-shifting, self-monitoring, and working memory are found in
individuals with anorexia as well as in individuals high in trait orthorexia (Koven &
Senbonmatsu, 2013). In addition, weight loss is an expected outcome of both orthorexia and
anorexia, making low BMI a common aspect of presentation (Koven & Abry, 2015). Finally,
both groups tend to perceive adherence to their eating style as a form of self-control that is
highly valued (Koven & Abry, 2015).
Despite the aforementioned commonalities, there are also a number of differences
between orthorexia and anorexia. There is a drive for thinness motivating the food restriction in
anorexia, whereas the pursuit of health is motivating the restriction of certain types of food in
orthorexia. Additionally, individuals high in trait orthorexia are more likely to advertise their
9
eating behaviours, which may be perceived as virtuous, while individuals with anorexia are more
secretive (Koven & Abry, 2015). Individuals high in trait orthorexia are more likely to talk about
their dietary regime and even encourage others to adopt their style of eating (Saddichha et al.,
2012; Varga, Thege, Dukay-Szabó, Túry, & van Furth, 2014). It has been argued that orthorexia,
in comparison with anorexia nervosa, is not driven by external social pressures (Babicz-
Zielińska, Wądołowska, & Tomaszewski, 2013). A study of orthorexia in a sample of eating
disorder outpatients diagnosed with anorexia or bulimia nervosa demonstrated that trait
orthorexia was higher in those not preoccupied with weight gain (Brytek-Matera, Rogoza, et al.,
2015). Further, adherence to a healthy lifestyle, importance placed on personal appearance,
eating pathology, and concern over personal weight were all shown to negatively predict trait
orthorexia (Brytek-Matera, Rogoza, et al., 2015). One study showed that 66.7% of dieters with
an eating disorder indicated a hypocaloric diet compared to 45.5% of dieters that were high in
trait orthorexia (Bo et al., 2014). Eating disorders were shown to be more likely in university
students majoring in dietetics while high trait orthorexia was not (Bo et al., 2014).
Eating disorders also share a degree of overlap with OCD. Cognitions and behaviours
typical of the eating disorders anorexia and bulimia nervosa are more common in the obsessive-
compulsive population than in healthy controls (Grabe, Thiel, & Freyberger, 2000; Pigott et al.,
1991). Obsessive-compulsive symptoms are also found in individuals with eating disorders
(Halmi et al., 2005; Speranza, 2001). It has been argued that the observed overlap between OCD
and eating disorders can be explained in part by a shared etiological background including facets
of personality, the most notable being perfectionism (Altman & Shankman, 2009; Halmi et al.,
2005). In addition, a number of symptoms are common to both orthorexia and OCD, including
intrusive thoughts, deficient attention to the external environment, and excessive concern about
10
contamination and purity (Koven & Abry, 2015). The neuropsychological profile of OCD is
similar to that of orthorexia in that they share deficits in executive functioning (Koven &
Senbonmatsu, 2013). Trait orthorexia was found to be positively correlated with a measure of
obsessive-compulsive traits (Bundros et al., 2016). In individuals diagnosed with OCD,
obsessions and compulsions related to washing and cleaning were negatively correlated with a
drive for thinness (Grabe et al., 2000). This is a characteristic also observed in orthorexia where
there is a preoccupation with avoiding contamination in the absence of a pursuit of low body
weight. OCD differs from orthorexia predominantly on the basis of the target of fixation; the
obsessions and compulsions observed in orthorexia are related to food and health (Koven &
Abry, 2015).
The food choices made by an individual high in trait orthorexia are fundamentally based
on what the individual believes will help them to achieve optimal health or to prevent illness
(Bratman & Knight, 2000). While diet can play an important role in the maintenance of health,
individuals high in trait orthorexia subscribe to health-related beliefs about specific foods that are
extreme, bizarre, and unsupported by science, a tendency referred to by Bratman and Knight
(2000) as “kitchen spirituality”.
Healthy eating in the general population. The pursuit of health through proper nutrition
is not exclusive to individuals with disordered styles of eating. There is an abundance of dietary
information available advocating for the health properties of different types of foods or diets.
There is not, however, anything approaching consensus regarding the ideal human diet. In the
absence of clear guidance concerning proper diet for optimal health, confusion in this domain
exists beyond the boundaries of orthorexia. Rangel, Dukeshire, and MacDonald (2012) discuss
how the responsibility for evaluating the health-promoting or diminishing properties of foods
11
belongs to the individual, and not to healthcare professionals or governing bodies. Information
about the right foods to eat in order to optimize health is abundant, yet contradictory, resulting in
a plethora of differing opinions concerning healthy food choices (Rangel et al., 2012). Rozin,
Ashmore, and Markwith (1996) found a number of cognitive heuristics about food and health in
the general population that resemble the maladaptive beliefs that govern the behaviour of
individuals high in trait orthorexia. Two such heuristics observed in the general population are
dichotomous thinking in the form of categorization of foods as either good or bad, and “dose
insensitivity”, which refers to the false belief that if a food item is harmful at high levels,
complete abstinence is the healthiest choice (Rozin et al., 1996). Both of these cognitive
heuristics could contribute to beliefs about food that are rigidly held by individuals high in trait
orthorexia.
Skepticism about consuming food that has been genetically modified, a food category
avoided by many high in trait orthorexia, is not uncommon in the general population (Rozin et
al., 2004; Sparks, Shepherd, & Frewer, 1994). Genetically modified food products are more
likely to be purchased by consumers if they are perceived as natural (Frewer, Howard, &
Shepherd, 1995). This suggests that it is the nonnaturalness of genetically modified foods that is
the deterring factor. As a result of the limited understanding of biological technology held by the
average consumer as well as the variation in what can be considered natural, the perceptions
driving food selection are subjective and heterogeneous. According to the results of a qualitative
study in Europe assessing attitudes toward genetically modified beer and yogurt, respondents
associated the consumption of genetically modified food products with negative health outcomes
(Bredahl, 1999). The respondents indicated a preference for alternatives with less desirable
properties (consistency, fat content, cost) rather than the genetically modified products (Bredahl,
12
1999).
Many consumers are aware of the same food-related health information, whether
legitimate or not, that guides the food choices made by individuals high in trait orthorexia. In a
review of a number of popular diets, Sellin (2014) highlights two predominant trends: consuming
foods that are considered to make up the proper human diet in terms of ancestral history, and the
avoidance of nonnatural or processed foods. Members of the general population are more likely
to indicate a preference for natural foods: foods that have been produced without human
intervention (Rozin et al., 2004). Rozin (2005) found that the perception of the naturalness of a
food is largely affected by chemical changes and relatively unaffected by physical changes,
meaning that the method of processing plays a large role in whether foods are considered natural.
Natural foods tended to be perceived as healthier and purer (Rozin et al., 2004). Foods that are
considered natural are viewed as morally superior to processed foods, even when participants are
informed of chemical equivalency between both options (Rozin, 2005). An awareness of or
interest in foods that are considered healthier or more natural does not, however, predict food
choice or frequency of consumption of that food (Roininen & Tuorila, 1999). This suggests that
individuals who are high in trait orthorexia are not simply more health conscious or educated
about healthy nutrition.
Food preferences for individuals with high levels of trait orthorexia vary across
individuals and even within a single individual over time (see Bratman & Knight, 2000 for a
review of diets common to orthorexia). In general, the preferred foods of these individuals are
described as “pure”, “clean”, “natural”, and “as nature intended” (Musolino et al., 2015).
Preferred foods tend to be unprocessed, free from additives, and produced with limited human
intervention (Musolino et al., 2015).
13
Håman, Barker-Ruchti, Patriksson, and Lindgren (2015) discuss orthorexia in
combination with “healthism”, a perspective that health is the responsibility and moral obligation
of the individual, and can be obtained through self-discipline pertaining to diet and exercise. In
one study, however, trait orthorexia was negatively correlated with behaviour congruent with
physical health (Brytek-Matera, Donini, et al., 2015). In addition, individuals with high trait
orthorexia were less likely to endorse their own bodies as being physically fit (Brytek-Matera,
Donini, et al., 2015). The authors speculate that the time, effort, and self-discipline required to
maintain an eating style typical of orthorexia may lead to neglect in other facets of health
(Brytek-Matera, Donini, et al., 2015). Contrary to these findings, another study demonstrated that
trait orthorexia was inversely related to cigarette smoking and alcohol consumption (Aksoydan
& Camci, 2009). In terms of other health-pursuant behaviours, individuals high in trait orthorexia
are more likely to be using nutritional supplements (Bo et al., 2014). Trait orthorexia was also
associated with more frequent physical exercise in female fitness center participants (Eriksson et
al., 2008). The relationship between orthorexia and healthy behaviours that are unrelated to food
is unclear. It seems as though individuals that are high in trait orthorexia make food choices that
they believe will promote their personal health but may or may not adhere to health-related
practices in other domains.
Measurement. A variety of instruments are used in the assessment of orthorexia with the
BOT first among them (Bratman & Knight, 2000). It is a 10-item dichotomous questionnaire
(Appendix A). This measure was not designed for clinical use nor research purposes, but as an
informal tool for self-assessment (Dunn & Bratman, 2016). As such, there is no accompanying
information regarding the psychometric properties, scoring, or interpretation of responses (Dunn
& Bratman, 2016). The author did, however, provide some information directed at the individual
14
seeking help for impairing orthorexia by indicating that the endorsement of four or more of the
items signifies the existence of a problem (Bratman & Knight, 2000).
The ORTO-15 (Donini et al., 2004; Appendix B) was developed, using the BOT as a
model, to identify an obsessional preoccupation with consuming healthy food. Six of the items
from the BOT were retained for the ORTO-15. This questionnaire comprises 15 items that are
answered on a 4-point Likert-type scale with the response options of “always,” “often,”
“sometimes,” and “never”. This is the most widely used measure of orthorexia in the extant
research literature. A cutoff score of 40 is recommended, with lower scores indicating a greater
degree of trait orthorexia. Some studies have used a more conservative cutoff score of 35 (Bo et
al., 2014; Segura-García et al., 2012; Stochel et al., 2015) There are a number of concerns
regarding the psychometric properties of the ORTO-15. The approach to test construction that
was used in the development of this measure is lacking in clarity, information regarding its
reliability is absent, and information regarding its validity is insufficient (Dunn & Bratman,
2016). Although some studies have found the reliability to be acceptable with Cronbach’s α = .78
- .79 (Segura-García et al., 2012; Stochel et al., 2015; Varga et al., 2014), others have found it to
be unacceptably low, ranging from .30 to .44 (Arusoğlu, Kabakci, Köksal, & Merdol, 2008;
Missbach et al., 2015). The construct validity of the ORTO-15 was evaluated through
comparison with a measure of health-oriented eating habits and a measure of obsessive-
compulsive qualities (Donini, Marsili, Graziani, Imbriale, & Cannella, 2005).
The scale was validated using a sample of 110 Italian individuals from the general
population, divided into four groups on the basis of the presence/absence of “health fanatic”
eating habits and obsessive-compulsive traits (Donini et al., 2005). Participants were described
as having health fanatic eating habits if their scores fell below the 25th percentile using a
15
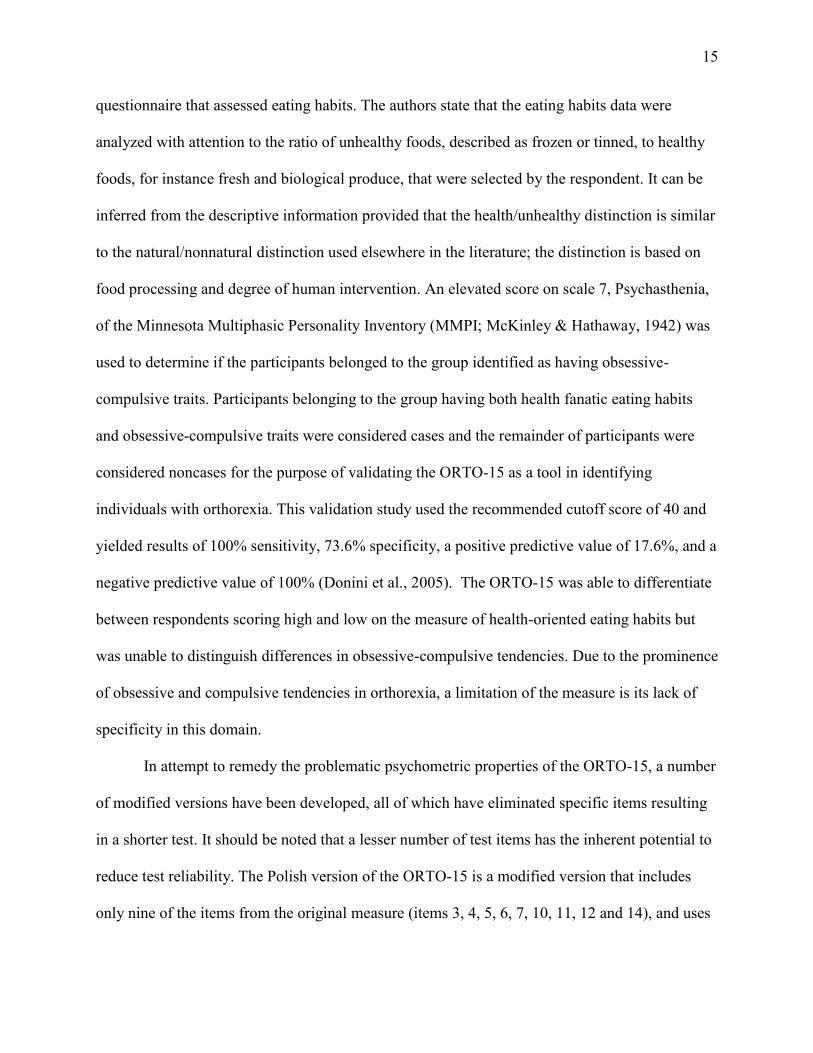
questionnaire that assessed eating habits. The authors state that the eating habits data were
analyzed with attention to the ratio of unhealthy foods, described as frozen or tinned, to healthy
foods, for instance fresh and biological produce, that were selected by the respondent. It can be
inferred from the descriptive information provided that the health/unhealthy distinction is similar
to the natural/nonnatural distinction used elsewhere in the literature; the distinction is based on
food processing and degree of human intervention. An elevated score on scale 7, Psychasthenia,
of the Minnesota Multiphasic Personality Inventory (MMPI; McKinley & Hathaway, 1942) was
used to determine if the participants belonged to the group identified as having obsessive-
compulsive traits. Participants belonging to the group having both health fanatic eating habits
and obsessive-compulsive traits were considered cases and the remainder of participants were
considered noncases for the purpose of validating the ORTO-15 as a tool in identifying
individuals with orthorexia. This validation study used the recommended cutoff score of 40 and
yielded results of 100% sensitivity, 73.6% specificity, a positive predictive value of 17.6%, and a
negative predictive value of 100% (Donini et al., 2005). The ORTO-15 was able to differentiate
between respondents scoring high and low on the measure of health-oriented eating habits but
was unable to distinguish differences in obsessive-compulsive tendencies. Due to the prominence
of obsessive and compulsive tendencies in orthorexia, a limitation of the measure is its lack of
specificity in this domain.
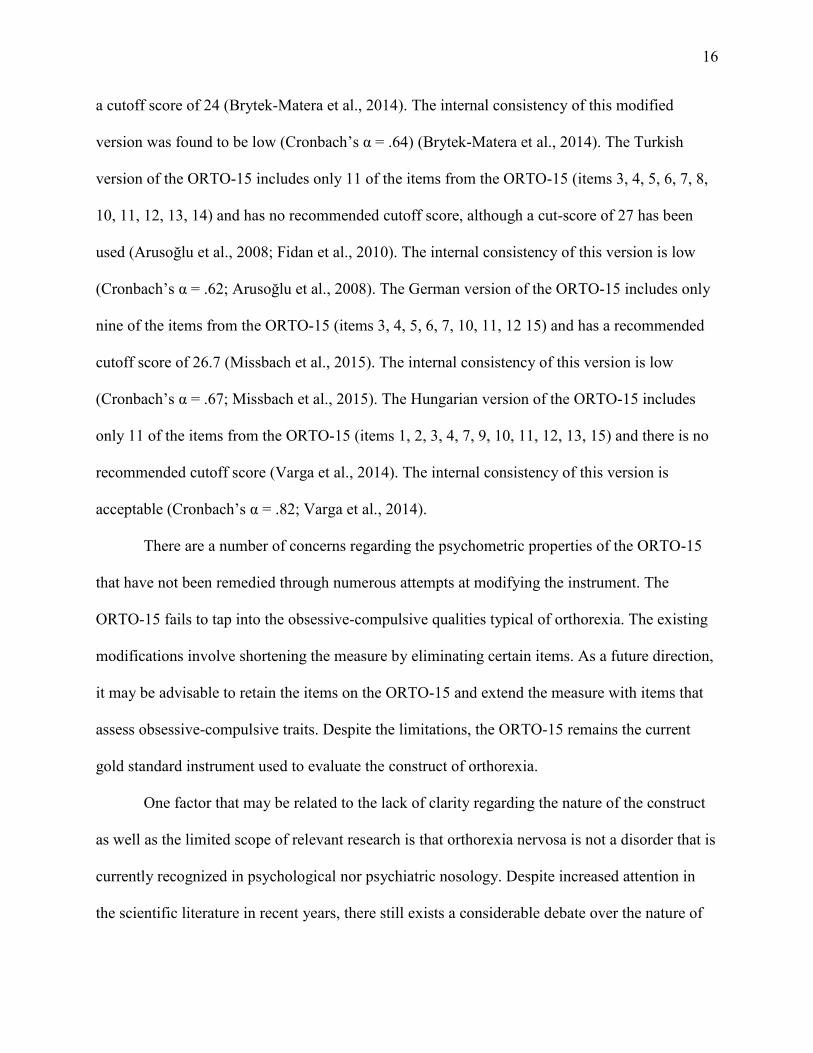
In attempt to remedy the problematic psychometric properties of the ORTO-15, a number
of modified versions have been developed, all of which have eliminated specific items resulting
in a shorter test. It should be noted that a lesser number of test items has the inherent potential to
reduce test reliability. The Polish version of the ORTO-15 is a modified version that includes
only nine of the items from the original measure (items 3, 4, 5, 6, 7, 10, 11, 12 and 14), and uses
16
a cutoff score of 24 (Brytek-Matera et al., 2014). The internal consistency of this modified
version was found to be low (Cronbach’s α = .64) (Brytek-Matera et al., 2014). The Turkish
version of the ORTO-15 includes only 11 of the items from the ORTO-15 (items 3, 4, 5, 6, 7, 8,
10, 11, 12, 13, 14) and has no recommended cutoff score, although a cut-score of 27 has been
used (Arusoğlu et al., 2008; Fidan et al., 2010). The internal consistency of this version is low
(Cronbach’s α = .62; Arusoğlu et al., 2008). The German version of the ORTO-15 includes only
nine of the items from the ORTO-15 (items 3, 4, 5, 6, 7, 10, 11, 12 15) and has a recommended
cutoff score of 26.7 (Missbach et al., 2015). The internal consistency of this version is low
(Cronbach’s α = .67; Missbach et al., 2015). The Hungarian version of the ORTO-15 includes
only 11 of the items from the ORTO-15 (items 1, 2, 3, 4, 7, 9, 10, 11, 12, 13, 15) and there is no
recommended cutoff score (Varga et al., 2014). The internal consistency of this version is
acceptable (Cronbach’s α = .82; Varga et al., 2014).
There are a number of concerns regarding the psychometric properties of the ORTO-15
that have not been remedied through numerous attempts at modifying the instrument. The
ORTO-15 fails to tap into the obsessive-compulsive qualities typical of orthorexia. The existing
modifications involve shortening the measure by eliminating certain items. As a future direction,
it may be advisable to retain the items on the ORTO-15 and extend the measure with items that
assess obsessive-compulsive traits. Despite the limitations, the ORTO-15 remains the current
gold standard instrument used to evaluate the construct of orthorexia.
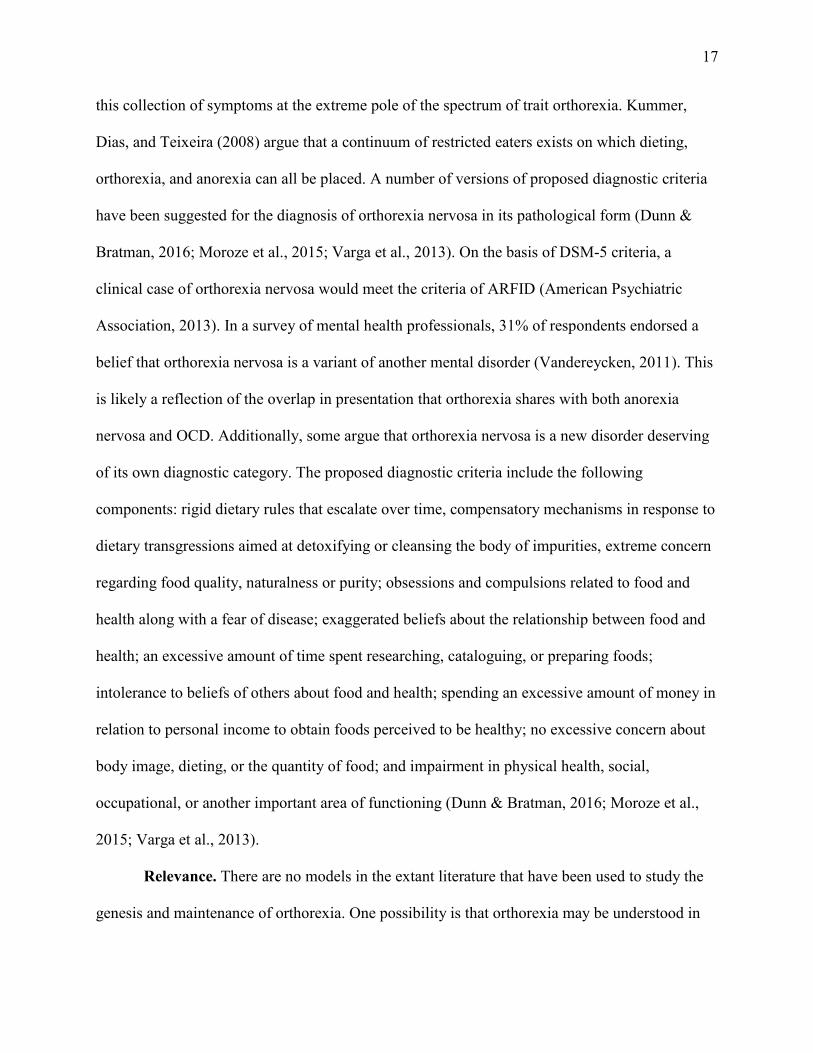
One factor that may be related to the lack of clarity regarding the nature of the construct
as well as the limited scope of relevant research is that orthorexia nervosa is not a disorder that is
currently recognized in psychological nor psychiatric nosology. Despite increased attention in
the scientific literature in recent years, there still exists a considerable debate over the nature of
17
this collection of symptoms at the extreme pole of the spectrum of trait orthorexia. Kummer,
Dias, and Teixeira (2008) argue that a continuum of restricted eaters exists on which dieting,
orthorexia, and anorexia can all be placed. A number of versions of proposed diagnostic criteria
have been suggested for the diagnosis of orthorexia nervosa in its pathological form (Dunn &
Bratman, 2016; Moroze et al., 2015; Varga et al., 2013). On the basis of DSM-5 criteria, a
clinical case of orthorexia nervosa would meet the criteria of ARFID (American Psychiatric
Association, 2013). In a survey of mental health professionals, 31% of respondents endorsed a
belief that orthorexia nervosa is a variant of another mental disorder (Vandereycken, 2011). This
is likely a reflection of the overlap in presentation that orthorexia shares with both anorexia
nervosa and OCD. Additionally, some argue that orthorexia nervosa is a new disorder deserving
of its own diagnostic category. The proposed diagnostic criteria include the following
components: rigid dietary rules that escalate over time, compensatory mechanisms in response to
dietary transgressions aimed at detoxifying or cleansing the body of impurities, extreme concern
regarding food quality, naturalness or purity; obsessions and compulsions related to food and
health along with a fear of disease; exaggerated beliefs about the relationship between food and
health; an excessive amount of time spent researching, cataloguing, or preparing foods;
intolerance to beliefs of others about food and health; spending an excessive amount of money in
relation to personal income to obtain foods perceived to be healthy; no excessive concern about
body image, dieting, or the quantity of food; and impairment in physical health, social,
occupational, or another important area of functioning (Dunn & Bratman, 2016; Moroze et al.,
2015; Varga et al., 2013).
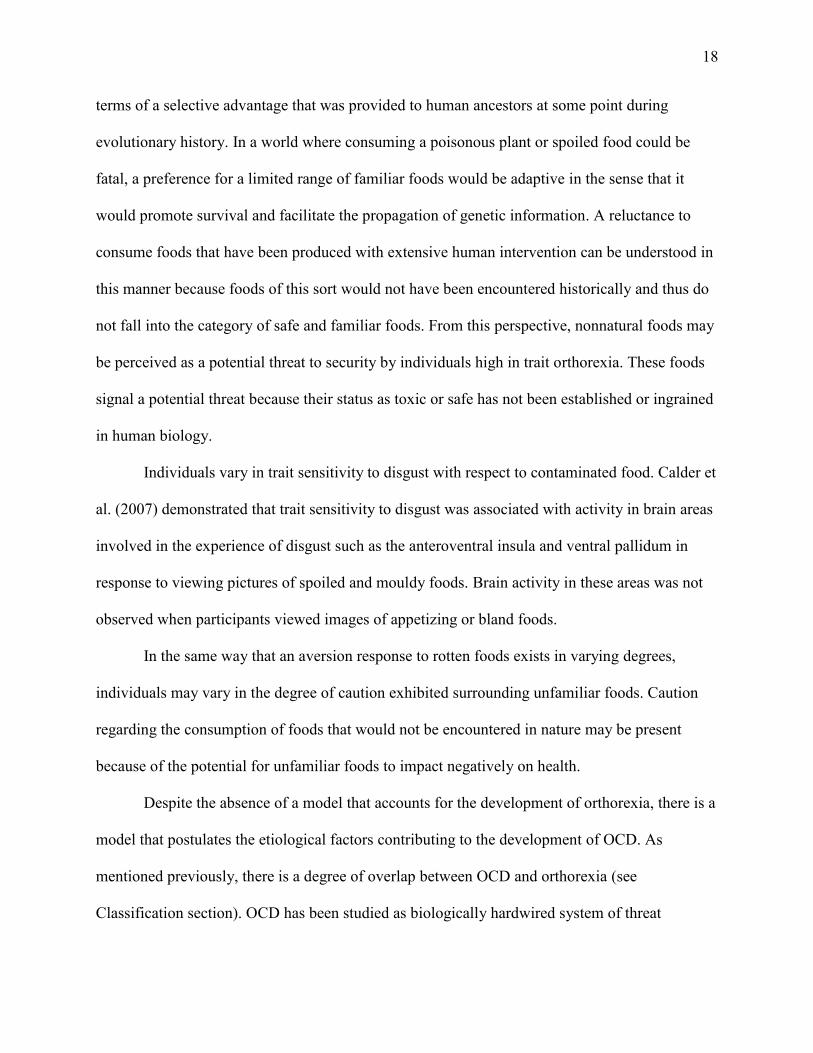
Relevance. There are no models in the extant literature that have been used to study the
genesis and maintenance of orthorexia. One possibility is that orthorexia may be understood in
18
terms of a selective advantage that was provided to human ancestors at some point during
evolutionary history. In a world where consuming a poisonous plant or spoiled food could be
fatal, a preference for a limited range of familiar foods would be adaptive in the sense that it
would promote survival and facilitate the propagation of genetic information. A reluctance to
consume foods that have been produced with extensive human intervention can be understood in
this manner because foods of this sort would not have been encountered historically and thus do
not fall into the category of safe and familiar foods. From this perspective, nonnatural foods may
be perceived as a potential threat to security by individuals high in trait orthorexia. These foods
signal a potential threat because their status as toxic or safe has not been established or ingrained
in human biology.
Individuals vary in trait sensitivity to disgust with respect to contaminated food. Calder et
al. (2007) demonstrated that trait sensitivity to disgust was associated with activity in brain areas
involved in the experience of disgust such as the anteroventral insula and ventral pallidum in
response to viewing pictures of spoiled and mouldy foods. Brain activity in these areas was not
observed when participants viewed images of appetizing or bland foods.
In the same way that an aversion response to rotten foods exists in varying degrees,
individuals may vary in the degree of caution exhibited surrounding unfamiliar foods. Caution
regarding the consumption of foods that would not be encountered in nature may be present
because of the potential for unfamiliar foods to impact negatively on health.
Despite the absence of a model that accounts for the development of orthorexia, there is a
model that postulates the etiological factors contributing to the development of OCD. As
mentioned previously, there is a degree of overlap between OCD and orthorexia (see
Classification section). OCD has been studied as biologically hardwired system of threat
19
detection that triggers a specific behavioural output when activated. This system, variously
labelled as the hazard-precaution system, defense system, or security motivation system (SMS),
may also be suited to the study of the construct of orthorexia.
Security Motivation
From an evolutionary perspective, virtually all aspects of human functioning exist today
because of some selective advantage they historically subserved in terms of reproductive fitness
(Darwin, 1859). Many behaviours that are currently observed may not be adaptive in modern
society, but can be understood in terms of a selective advantage that was provided at some point
during human evolution. One such behaviour may be an avoidance of foods that are unfamiliar
or that seem to deviate from their natural state, as observed in orthorexia. The selective
advantage provided by this avoidance is that it prevents the consumption of foods that may cause
illness or spread disease.
Szechtman and Woody (2004) argue for the existence of an adaptive system controlling
the activation of a biologically hardwired behavioural set that promotes self-preservation. This
system, which Szechtman and Woody have termed the SMS, drives an individual to detect and
remediate threats to personal security. The SMS is highly sensitive and responds to vague,
indirect indications of possible danger (Woody & Szechtman, 2011). The utility of this
precautionary approach is that there is minimal cost to the individual for a false positive (i.e.,
SMS activation in the absence of an actual threat), while a failure to respond could be lethal
(Woody & Szechtman, 2011). SMS activation is not energy-costly, the triggered behaviours are
predominantly associated with probing the environment for more information, and the threats
that this system is equipped to detect are potentially catastrophic; for instance, disease epidemics
and predator attacks (Woody & Szechtman, 2011). The SMS, when activated by subtle
20
environmental cues, elicits behaviours that promote the survival of the individual. For humans,
such behaviours approximate behaviours frequently observed in OCD, including checking and
washing as well as obsessional thoughts related to the target that is a threat to security
(Szechtman & Woody, 2004). The security motivated behaviours also function as part of a
negative feedback loop whereby the performance of the behaviours terminates the SMS (Hinds
et al., 2010; Woody et al., 2005). These behaviours differ from classic danger-avoidance or
escape behaviours which are adaptive in situations where danger is imminent. Security motivated
behaviours are performed with the intent of gathering information to confirm the presence of
danger in response to a potential threat (Szechtman & Woody, 2004; Woody & Szechtman,
2011). As such, the SMS enables a preventative strategy to avoid imminent danger through
preparedness (Szechtman & Woody, 2004). The affective state associated with SMS activation is
not the state of fear that is experienced in response to imminent danger. Woody et al. (2005)
demonstrated that disgust, anxiety, and elevated heart rate resulted in healthy participants who
were blocked from obtaining the full effect of the performance of security motivated behaviours
after the SMS was activated via contamination imagery. The participants in this study were
categorized based on their susceptibility to hypnosis. The participants were asked to imagine the
emotional experience of either interacting with an object contaminated with germs and bacteria
or to imagine the experience of being calm and relaxed. Next, half of the participants in each
condition were told that they would not experience a sense of satisfaction during subsequent
handwashing, whereas the other half of participants were told they would experience the typical
level of satisfaction achieved during handwashing. The participants who were highly
hypnotizable, who were instructed to imagine touching a contaminated object, and who were told
that subsequent handwashing would not bring the usual level of satisfaction, washed their hands
21
for a significantly longer duration than the other groups. The participants who were asked to
imagine interacting with a contaminated object reported higher levels of disgust and anxiety than
the other groups. This group also demonstrated an increase in heart rate following the
contamination imagery that returned to baseline after the participants washed their hands. The
findings of this study support the idea that potential threat activates a distinct system whose
behavioural output serves the dual purpose of avoiding danger and terminating the activation.
There is a degree of uncertainty that is an inherent by-product of SMS activation. The
SMS is activated in response to potential threat and therefore has no definite indication of goal
attainment; it is impossible to be certain that danger is no longer imminent when there was never
any certainty that the danger existed in the first place (Woody & Szechtman, 2007; 2011).
Woody and Szechtman (2011) argue that it is the uncertainty that incites the SMS, and that
repeated encounters with a potential threat may extinguish the response. This also highlights the
importance of engaging in security motivated behaviours in order to terminate the activation of
the system (Hinds et al., 2010; Woody & Szechtman, 2007). The actual engagement in security
motivated behaviours, such as surveillance, checking, and washing, gives the individual a feeling
of certainty regarding security that cannot be obtained through alternative means. For example, a
study by Hinds et al. (2010) showed that when participants were uncertain about whether they
had been exposed to urinary contamination when handling baby diapers, they demonstrated
changes in cardiac reactivity suggestive of SMS activation. This activation was not terminated by
informing the participants that the diapers they had been exposed to were, in fact, not
contaminated. It was only when the participants were allowed to engage in the security
motivated behaviour of handwashing that the SMS activation dissipated. When the negating
information about contamination was provided prior to contact, it prevented SMS activation
22
altogether.
The SMS has been proposed to underlie psychopathology in the form of OCD
(Szechtman & Woody, 2004). The observation that compulsions often take the form of
preventing harm or avoiding danger has also been discussed within the context of a “hazard-
precaution system” which is synonymous with the SMS (Liénard & Boyer, 2006). This system is
described as being separate from systems responding to imminent danger, activated by
ambiguous and potentially threatening cues, and aimed at promoting safety and security (Liénard
& Boyer, 2006). SMS activation is terminated by engaging in security motivated behaviours that
are triggered by the system (Hinds et al., 2010). It has been argued that OCD is the cognitive and
behavioural manifestation of a deficiency in turning off the SMS (Hinds, 2012; Hinds et al.,
2015; Szechtman & Woody, 2004).
The SMS may be additionally suited to account for the cognitive and behavioural
phenomena that are observed in individuals high in trait orthorexia. First, the species-specific
nature of the SMS may account for the high prevalence of trait orthorexia that has been
observed. It is logical that this trait would be detectable in most individuals if it is influenced by
a system presumed to be universally present within humans. Second, in a number of case studies
of severe presentations of orthorexia, the individuals report their initial dietary modifications
were enacted in an attempt to remedy some aspect of perceived ill-health (Catalina-Zamora et al.,
2005; Moroze et al., 2015; Park et al., 2011). In a discussion of various subtypes of self-
protection systems, Neuberg, Kenrick, and Schaller (2011) suggest that domain-specific
precautionary systems, such as the SMS, would be more frequently activated in individuals who
perceive themselves to be especially vulnerable to a particular sort of threat. In addition, as
Woody and Szechtman (2005) explain, the SMS model is most applicable to subtypes of OCD
23
involving checking and contamination. Contamination-related obsessions certainly resemble the
fixation on pure, natural foods that is observed in orthorexia, further supporting the applicability
of this model to account for the observed phenomena in orthorexia. Neuberg et al. (2011)
differentiate between subtypes of a precautionary system, the most relevant to trait orthorexia
being the disease-avoidance system. This system, it is argued, was designed by natural selection
as protection from contamination in the form of pathogens carried by humans, animals, insects,
or foods (Neuberg et al., 2011). The affective state that is associated with an ambiguous cue
signalling potential exposure to a contaminant is disgust, and the security motivated behaviours
would include washing (Neuberg et al., 2011). This process may prove similar to the attempts at
“detoxification” that are practised by many individuals high in trait orthorexia after transgressing
a self-imposed dietary rule.
There are no studies in the literature that investigate orthorexia as a security motivated
behaviour. There are, however, a number of studies that have used cardiac reactivity to infer
SMS activation in response to potential threat both in OCD and in healthy controls. A study by
Hinds et al. (2012) involved participants with a diagnosis of OCD as well as healthy controls.
Respiratory sinus arrhythmia (RSA) is an index of cardiac reactivity that was measured
throughout the experiment using an electrocardiogram (ECG). A deviation from baseline in RSA
was used to infer activation of the SMS. In this experiment, participants were told that they
would eventually be asked to touch an object that may or may not be contaminated. The
participants were instructed to sit quietly with their hands in their laps for 2 minutes during
which a baseline measure of RSA was obtained. The participants were then asked to place their
hands in bin filled with either Styrofoam beads, dry baby diapers, or baby diapers that had been
wet. The three different stimuli represent different degrees of contamination threat, with the
24
beads presenting the lowest level of threat and wet diapers the highest. The participants were
instructed to interact with the stimuli for 2 minutes. Next they were asked to sit quietly for 2
minutes. The participants then engaged in 30 seconds of handwashing, followed by another 2
minutes of sitting quietly. The participants were then allowed to wash their hands for as long as
they desired, followed by 2 final minutes of sitting quietly. The purpose of having the
participants sit quietly after each activity is to facilitate ECG recording that was compared to the
baseline measure in order to infer the effect of each activity on cardiac reactivity. Both OCD and
healthy controls displayed a change from baseline in RSA after interacting with the dry or wet
diapers. After 30 seconds of handwashing, the RSA of the control group returned to baseline. In
the OCD group however, the RSA only returned to baseline after they were able to wash their
hands for an unlimited amount of time. In the context of the SMS, the diapers are the potential
threat because the participant was unaware whether or not they are being exposed to urinary
contamination. The handwashing is the security motivated behaviour. In the healthy controls,
activation of the SMS can be inferred using RSA change after they are exposed to the potential
threat. The SMS activation is terminated after they engaged in 30 seconds of handwashing. In the
OCD group, the activation of the SMS occurs in response to the potential threat but it was not
terminated by the 30 seconds of handwashing. In participants with OCD, an extended
performance of the security motivated behaviour was required in order to terminate SMS
activation. In addition, when participants were allowed to wash their hands for an unlimited
duration, the OCD group washed for a longer duration than the control group. This supports the
conclusion that OCD may be the manifestation of a deficit in terminating the SMS.
The course of SMS activation described above is also observed when the security
motivated behaviour is checking as opposed to washing. In a study by Hinds et al. (2015),
25
participants were assigned to a candy group or a medication group. Participants in the medication
group were asked to sort pills into appropriate dosages for specific times of day and different
days of the week. They were told that they were testing a new pill-sorting strategy to help reduce
the likelihood of patients consuming incorrect doses. The candy group sorted coloured candy.
Next, the participants sat quietly for 2 minutes while their RSA was recorded using an ECG. The
medication group was then given a speech about the importance of ensuring correct dosages and
the consequences of dosing errors. They were also told that pill-sorting is difficult to do correctly
and that people usually make a large number of mistakes that they do not realize. The candy
group was not given this speech. All participants were then instructed to reflect on their
performance on the task while their RSA was recorded. Half of the participants in each condition
were then permitted to check over their performance on the previous sorting task for 90 seconds
and then RSA was recorded again for 2 minutes. Finally, all participants were allowed to check
over their performance for an unlimited period of time. In this study, the potential threat was the
possibility of having made a mistake in sorting that could have serious health-related
consequences for another person. The security motivated behaviour was the checking of one’s
own performance. The findings of the previous study by Hinds et al. (2012) involving
handwashing as a security motivated behaviour were replicated in the present study on checking
behaviour. The candy group showed no deviations from baseline in RSA over the course of the
study because they were never exposed to a potential threat and, thus, never experienced SMS
activation. By contrast, participants in the medication group demonstrated an RSA change from
baseline after they were given a speech about the importance of accuracy and the high error rate
before being asked to reflect on their own performance. This RSA change is indicative of SMS
activation. RSA returned to baseline by the next ECG recording in the participants who were
26
allowed to check their performance for 90 seconds. The RSA of the group that was not allowed
this 90 seconds of checking remained suppressed until they were allowed an unlimited duration
of performance checking. Hinds et al. (2015) concluded that checking is another security
motivated behaviour that is triggered by the SMS and serves as part of a negative feedback loop
to terminate once activated. A second experiment was conducted as part of the same study to
identify the course of SMS activation in individuals with OCD. The participants included
individuals with OCD who were classified as “washers” or “checkers” according to their
symptom presentation. All participants in the second experiment were asked to sort pills, given a
speech about the importance of accuracy, and allowed to check their performance for 90 seconds,
followed by an unlimited period of performance checking, as outlined previously. The results of
the OCD group were compared to the results of the nonOCD individuals in the first experiment
who were subject to the same procedure. The 90-second checking period did not terminate the
SMS in OCD checkers, providing further support for the hypothesis that OCD is a manifestation
of a deficit in SMS termination.
A study by Hinds et al. (2010) demonstrated that the performance of security motivated
behaviour is required in order for SMS activation to be terminated in individuals without OCD.
The participants were asked to interact with a stimulus bearing the potential threat of
contamination and then performed a security motivated behaviour. The potential threat was wet
baby diapers in a bin marked “Pediatrics” and the security motivated behaviour was
handwashing. RSA was recorded via ECG at baseline and after each step of the experiment in
order to infer SMS activity. Participants were assigned to one of three groups: information before
contact, information after contact, or no information. The participants in the first group were
given information that negated the threat before they were exposed to the stimulus. They were
27
told that the diapers had been wet with water but were not, in fact, contaminated with urine. This
group demonstrated no SMS activation because they were never exposed to a potential threat.
The second group interacted with the wet diapers prior to being provided with the negating
information. This group demonstrated SMS activation in response to handling the wet diapers
and activation was not terminated by the information that the diapers were not contaminated. The
SMS activation ceased only when participants engaged in the security motivated behaviour of
handwashing. The third group was not given any negating information but was allowed to wash
their hands at the time interval when the second group was given the negating information. The
third group demonstrated termination of the SMS at this time interval. The results of this study
support the role of the performance of security motivated behaviour in terminating the SMS.
Relevance. The above three Hinds et al. studies provide an elegant research paradigm for
the study of the maintenance of orthorexia. Specifically, they uniformly produce, in normal and
OCD participants, security motivated behaviours—checking, washing—in response to perceived
threat of contamination. The present study drew upon these observations to analyze security
motivated behaviours among people with differing orthorexic tendencies with respect to food
acquisition and ingestion. Specifically, different security motivated behaviours will be delineated
in sections to follow with respect to how people responded to food exposure paradigms. Among
these, cardiac reactivity is key to investigating activation of the SMS.
Vagal Tone
The SMS is an evolutionarily primitive system that operates outside of conscious control.
The behavioural manifestations of SMS activation are managed by the autonomic branch of the
peripheral nervous system. SMS activation, therefore, can be inferred through physiological
monitoring of the activity of organs that are regulated by the autonomic nervous system.
28
Reactivity of the cardiovascular system, in concert with the respiratory system, occur in
response to novelty, psychological stressors, and physical stressors, through action of the
nervous system via the vagus and sympathetic nerves (Porges & Byrne, 1992). The vagus nerve
is the 10th cranial nerve and belongs to the parasympathetic branch of the autonomic nervous
system. According to polyvagal theory, the vagus nerve differs markedly between mammals and
other classes, owing to significant deviations during mammalian evolution (Porges, 1995; 2001).
The ancestral vagus nerve present in the reptilian class, among others, originates in the dorsal
motor nucleus, which is located in the brainstem. It consists of unmyelinated fibers that innervate
visceral organs. A novel development in mammalian phylogeny is the presence of a vagal
branch, in addition to the ancestral branch, that originates in the nucleus ambiguus and sends
myelinated projections to innervate the heart.
The rate of a beating heart oscillates in response to numerous factors, through feedback
mechanisms via the central and peripheral branches of the nervous system. The greater the range
spanned by these fluctuations is referred to as greater heart rate variability (HRV). Aspects of
HRV, such as vagal tone, can be used as means of assessing the state of the central nervous
system via measurement of cardiac electrical activity using an ECG (Porges & Byrne, 1992).
Vagal tone refers to the medullary, respiratory center-modulated electrical outputs of the vagus
nerve arriving at the sinoatrial node (the heart’s natural pacemaker), which subsequently
influences the rate of its beats as measured by the distance between two adjacent R-wave peaks
of successive heartbeats (R-R interval; Porges & Byrne, 1992).
Measurement of RSA, that changes HRV in concert with spontaneous respiratory
activity, provides an index of the vagal nerve output to the cardiac pacemaker (Porges & Byrne,
1992). Fluctuations in vagal tone occur in response to the energy demands of an individual.
29
Greater output from the vagal nerve to the heart produces a slowing of heart rate and can
therefore be referred to as activation of the “vagal brake.” Increased vagal tone, or activation of
the vagal brake, is associated with lower energy demands, whereas removal of this vagal brake is
associated with higher energy demands.
Porges (2001) outlines three neural systems, with distinct effects on the autonomic
nervous system, that arose during different stages of evolutionary development. Each of these
three systems can be anatomically, physiologically, and behaviourally distinguished from each
other. The most primitive of the three systems is under the control of the ancestral unmyelinated
vagus nerve that originates in the dorsal motor nucleus. In response to imminent danger, entry
into an autonomic state dominated by the ancestral unmyelinated vagus nerve occurs resulting in
a decrease in energy output. The behavioural manifestation of this autonomic state involves a
freezing or feigning death response. The second stage in phylogenetic development is associated
with the emergence of an autonomic state under the dominance of the sympathetic nervous
system. In response to threat, the sympathetic branch of the autonomic nervous system is
predominately in control and facilitates the high energy output required for fight-or-flight
behaviours. During this state, activity of the ancestral unmyelinated vagus nerve is inhibited. The
most recent stage of phylogenetic development with respect to nervous control of autonomic
state is associated with the appearance of a second vagal branch, originating in the nucleus
ambiguus and extending to the sinoatrial node of the heart where it plays a regulatory function in
cardiac activity. This phylogenetically recent branch of the vagal nerve is myelinated, enabling
quick changes in cardiac regulation. Increased activity of the myelinated vagal branch, also
referred to as activation of the vagal brake, is associated with a suppression of metabolic activity.
The behavioural manifestation of this autonomic state involves social communication and
30
relaxation. Woody and Szechtman (2011) discuss SMS activation as a distinct autonomic state,
the “novelty/potential threat” autonomic state, that lies intermediary between the second and
third autonomic states outlined by Porges (2001). SMS activation is characterized by a removal
of the vagal brake, or a decrease in cardiac output from the inhibitory myelinated vagal branch.
The novelty/potential threat autonomic state is distinguishable from the second stage of
phylogenetic development by the limited activity of the sympathetic branch of the autonomic
nervous system. The behavioural manifestations of the novelty/potential threat autonomic state
include hypervigilance to the environment and orientation to novelty. These behaviours are also
the behavioural manifestations expected during SMS activation.
Vagal tone and security motivation. In addition to observable behaviours that indicate
SMS activation, engagement of this system can also be monitored physiologically through
cardiac reactivity (Woody & Szechtman, 2011). The security motivated behaviours triggered by
SMS activation, which involve probing the environment for information, are not energy costly.
Because the individual is probing for indicators of danger, there is always the chance that the
initial suspicions will prove correct, and that high energy outputs will be required through
activation of the fight-or-flight system (Woody & Szechtman, 2011). Thus, the most adaptive
state would be one that is low in energy demands and that also allows for quick activation of a
more energy-costly state if such a state is indicated (Woody & Szechtman, 2011). A specific
balance of parasympathetic-sympathetic activity, as described by Woody and Szechtman (2011),
encompasses the requirements that would enable this type of state. This state has been labelled
the “novelty/potential threat” autonomic state (Woody & Szechtman, 2011). In addition, the
response of orienting or attending to novelty, a hallmark of the security motivated state, is
regulated by vagal innervation of the sinoatrial node of the heart (Porges, 1995). By measuring
31
cardiac reactivity, SMS activation can be inferred when entry into the novelty/potential threat
autonomic state occurs.
Relevance. Activation of the SMS leads to security motivated behaviours which, in turn,
terminate the activation. Suppression of RSA is associated with SMS activation and engagement
in security motivated behaviours facilitates a return to baseline with respect to RSA. The
research studies by Hinds et al. (2010; 2012; 2015) and by Woody et al. (2005) that have been
discussed previously have drawn attention to two security motivated behaviours in particular:
washing and checking. The present study aimed to illuminate other possible security motivated
behaviours that may occur in individuals with orthorexic tendencies in response to food
exposure. One potential security motivated behaviour of this nature is a cognitive bias in favour
of natural foods. This hypothetical cognitive bias, whereby natural foods are perceived more
positively than nonnatural foods as the result of an automatic judgment, may serve as a security
motivated behaviour in that it contributes to the avoidance of foods that carry the potential threat
of contamination.
Cognitive Bias
Cognitive bias refers to a judgement that is not made on the basis of objective
information. There are many types of cognitive biases that are universally present and are
adaptive for decision-making purposes. Cognitive heuristics, for example, are mental algorithms
that are employed because they are efficient means that typically guide adaptive choices or
behaviour, though they may not always prove correct. In the context of food choices, cognitive
heuristics such as dichotomous thinking about good and bad foods or dose insensitivity with
respect to potential for harm are two examples of cognitive biases that are widespread in the
healthy population (Rozin et al., 1996).
32
Attentional bias. Attentional bias is a form of cognitive bias in which an individual’s
attention is disproportionately allocated such that more or less attention is paid to a given
stimulus type. Attentional biases are notable in certain mental disorders. For example, reduced
attention to external cues accompanied by an inward attentional bias has been observed in OCD
and anorexia nervosa, as well as in individuals with high trait orthorexia (Koven & Abry, 2015).
To the contrary, after a subtle cue triggers the SMS, an external attentional bias is demonstrated,
where the individuals directs attention to the environment to gather information and search for
threats to security (Woody & Szechtman, 2011).
Attentional bias can also affect food choices, as was demonstrated in a study in which
individuals were trained using a modified dot-probe task to attend either to healthy or unhealthy
food cues (Kakoschke, Kemps, & Tiggemann, 2014). The participants who were trained to
attend to healthy food cues consumed more of healthy snacks in comparison to their own
consumption pretraining and when compared to the group trained to attend to unhealthy food
cues (Kakoschke et al., 2014). Another study showed that individuals high in trait food craving
showed reduced approach and increased avoidance behaviours for palatable foods following
training using a modified dot-probe task (Brockmeyer, Hahn, Reetz, Schmidt, & Friederich,
2015). In addition, there was a change in attentional bias that shifted from an attending bias to an
avoidance bias for the palatable foods (Brockmeyer et al., 2015).
Implicit cognition. Implicit cognition is another form of cognitive bias in which an
individual’s previous experiences have an impact on their beliefs, attitudes, or judgements in a
way that they cannot overtly identify (Greenwald & Banaji, 1995). Food choices tend to be
largely governed by implicit attitudes rather than through conscious and effortful decision-
making (Ellis, Kiviniemi, & Cook-Cottone, 2014). In contrast, a disconnect between implicit
33
attitudes and behavioural choices has been observed in eating disorders such as anorexia,
possibly owing to the fact that an externally-constructed, thin ideal is dictating food choices
(Ellis et al, 2014). It is unclear whether implicit attitudes about food held by individuals high in
trait orthorexia would be aligned with observable behaviours in terms of food choices. External
factors may be primarily responsible for influencing food choices. Information about healthy
food choices, advertising, eating trends, for example, may have an influence. An alternative
explanation, however, is that an internally generated motivation, the SMS, has a strong influence
on food choice.
Explicit attitudes and beliefs can be assessed using direct questioning since individuals
are aware of, and can articulate, these cognitions. Implicit attitudes are automatic judgements
that often take place without conscious awareness and thus are more difficult to ascertain via
direct probing. One method that has been used to investigate implicit cognitions is the Implicit
Association Test (IAT; Greenwald, McGhee, & Schwartz, 1998). The IAT involves
computerized presentation of target concepts (for example African-American and European-
American faces) and attributes (for example positive and negative words) that are sorted by
participants into appropriate categories according to presented instructions. The response times
and error rates for different pairings (for example African-American faces paired with positive
words compared to African-American faces paired with negative words) are used to infer the
presence of implicit cognitions with respect to the target concepts.
Relevance. Modified IATs have been used in a number of studies in order to evaluate
implicit attitudes about food choices and eating behaviour (Haynes, Kemps, Moffitt, & Mohr,
2015; Prestwich, Hurling, & Baker, 2011; Richetin, Perugini, Prestwich, & O’Gorman, 2007;
Werle, Trendel, & Ardito, 2013). A modified IAT was employed in the present study in an effort
34
to delineate the association between trait orthorexia and one hypothetical security motivated
behaviour of cognitive bias in favour of natural foods. The IAT constituted one of four different,
experimentally contrived food exposures to participants, occurring third in the experimental
sequence employed in the present study. Performance on this IAT, operationally defined in terms
of response times and error rates, was used as an index of this cognitive bias. It was predicted
that individuals higher in trait orthorexia would demonstrate quicker response times and make
fewer errors when categorizing natural foods with positive words than when categorizing natural
foods with negative words. Additionally, quicker response times and fewer errors were expected
by individuals higher in trait orthorexia when categorizing nonnatural foods with negative words
than when categorizing nonnatural foods with positive words. This prediction is in accordance
with the core belief system regarding food that is held by individuals with high levels of trait
orthorexia. Specifically, a dichotomy of healthy and unhealthy foods is created that dictates the
types of foods that are approached and avoided. The modified IAT was used to assess the extent
of the automatic associations of certain categories of food as positive and others as negative. This
hypothetical bias constitutes a security motivated behaviour because it promotes the avoidance of
food types that are considered a threat in terms of the potentially adverse health-related
consequences of consumption.
In addition to the modified IAT, participants of the present study engaged in three other
food exposure tasks, each of which was expected to illuminate a particular expression of security
motivated behaviour. Security motivated food preference was expected to manifest in the first of
the four food exposures called the food preference task. Given the choice of different foods from
which to eventually consume in the laboratory (see taste test below), it was predicted that trait
orthorexia would be associated with a preference for natural over nonnatural food offerings.
35
Within the context of the second food exposure—specifically, a taste test where food-related
threat level was manipulated—it was expected that trait orthorexia in addition to threat level
would predict security motivated behaviours that manifest as a preference for the natural food
choices, operationally defined as the volume of natural versus nonnatural food consumed. The
third experimentally contrived food exposure consisted of the modified IAT as outlined above.
An additional IAT measure was completed by participants in which the target concepts
comprised high- and low-calorie foods. This was included as a measure that would be able to
offer data regarding discriminant validity for the first IAT in the assessment of orthorexia-related
bias. Caloric value is not conceptualized as an important factor in the determination of food
choice among those high in orthorexia.
Security motivated behaviour in the form of natural food preference and nonnatural food
avoidance was expected to manifest during the fourth and final food exposure consisting of a
simulated shopping task. Here participants were instructed to select food items from a grocery
flyer and to shop within a given a nominal monetary limit. Participants’ food preference elicited
during the shopping task would constitute a security motivated behaviour because it promotes
the avoidance of foods perceived as threatening which, in turn, reduces the perceived threat. The
food preference in this task was operationally defined in terms of the proportion of selected items
that are considered natural foods. It was expected that food preference in this task would be
predicted by trait orthorexia.
The Present Study
There currently are no models that account for the genesis and maintenance of orthorexia.
From an evolutionary perspective, the existence of orthorexia as a trait may be understood in
terms of a selective advantage that it provided at some point during evolutionary history. The
36
advantage of restricting certain types of food with uncertain health-related impact would have
been the minimization of the likelihood of consuming contaminated food, thereby reducing the
chances of becoming ill. Consequently, the maintenance of this behaviour can be studied in the
context of a biologically hardwired system that served an adaptive purpose throughout evolution
by contributing to the probability of survival. The SMS is particularly relevant to the study of
trait orthorexia. This system is activated in response to potential threat, such as that of
contamination, and motivates the individual to perform behaviours in the interest of personal
security. Security motivated behaviours that are elicited by the SMS also serve to terminate its
activation. Although no security motivated behaviours specific to orthorexia have been
investigated, a number of experiments have been conducted pursuant to the study of security
motivated behaviour in response to the threat of contamination (Hinds et al., 2010; 2012; Woody
et al., 2005). It is possible that threat of contamination underlies the avoidance of nonnatural
foods in orthorexia, thus providing the bridge between this trait and the SMS.
An aim of the current study was to delineate a number of security motivated behaviours
associated with exposure to food. SMS activation can be inferred through cardiac monitoring
because of the suppression in RSA that occurs in conjunction with SMS activation. Several
indices of HRV were recorded in the present study as means of assessing the activity of the SMS.
Security motivated behaviours such as washing and checking have been investigated previously
in studies involving the SMS (Hinds et al., 2010; 2012; 2015; Woody et al., 2005). The present
study represents an investigation of the SMS and its potential involvement in the maintenance of
orthorexia. The security motivated behaviours of interest included cognitive bias and food
preference with respect to natural foods. SMS activation was also assessed as a function of trait
orthorexia in response to exposure to nonnatural foods, thus bearing the threat of potential
37
contamination.
The purpose of the present study was to determine the extent to which orthorexia is
associated with manifestations of security motivated behaviour when people were faced with
four different forms of food exposure in a laboratory setting as follows:
1. Food preference task. A food preference task involving the rank ordering of six food
items, half of which are considered natural food items, was used to investigate the
security motivated behaviour of food preference. The independent variable, trait
orthorexia, was expected to predict performance on the food preference task, sample
ranking, operationally defined as the number of natural items ranked in the top three
positions. Specifically, it was predicted that higher trait orthorexia would be
associated with more natural than nonnatural items ranked in the top three positions.
2. Taste test. A taste test involving the same six food items from the food preference
task, half of which are natural food items, was used to investigate activation of the
SMS in response to threat level. Threat level was experimentally manipulated across
two conditions such that participants were exposed either to a high or low level of
threat. The threat was the uncertainty regarding the number of food samples the
participant was instructed to taste. It was predicted that this feeling of uncertainty
would not be experienced as equally threatening to all participants. As such, trait
orthorexia was included as an individual differences variable that was expected to
interact with experimentally-induced threat level (low vs. high) to predict SMS
activation. It was predicted that the uncertainty regarding the number of food samples
the participant was instructed to taste would be experienced as threatening only by
individuals high in trait orthorexia. This is because three of the food choices include
38
nonnatural ingredients that are, presumably, avoided by individuals high in trait
orthorexia. The uncertainty would be threatening because participants were unaware
if they would be asked to taste the foods they might usually avoid. It was predicted
that this potential threat would activate the SMS only in individuals high in trait
orthorexia who were randomized to the high threat condition. SMS activation is a
change in ANS functioning that occurs in response to potential threat in order to
facilitate a state of preparedness in the individual in case the potential threat proves
veridical. The expected change in ANS functioning was assessed through monitoring
of changes in HRV over the course of the experiment. It was predicted that the
individuals higher in trait orthorexia who were randomized to the high threat
condition would demonstrate a change from baseline HRV during the period in which
they would be uncertain about the number of food samples they would be instructed
by the experimenter to taste. Specifically, it was predicted that the experimentally
induced threat level would moderate the relationship between predictor variable—
trait orthorexia—and criterion variable SMS activation, defined as deviation from
resting baseline HRV; specifically, a reduction in HRV under threat condition relative
to resting baseline (see Figure 1). Trait orthorexia was hypothesized to predict SMS
activation only in individuals subjected to the experimentally induced high level of
threat.
3. Implicit Association Test (IAT). An Implicit Association Test was used to ascertain
security motivated behaviour manifested as cognitive bias in the form of implicit
attitudes about food categories. The automatic association of natural or nonnatural
foods with positive or negative words was evaluated in order to determine the
39
existence of a cognitive bias whereby natural foods are perceived more positively
than nonnatural foods. The independent variable trait orthorexia was expected to
predict performance on the IAT, operationally defined in terms of response times and
error rates. Specifically, it was predicted that higher trait orthorexia would be
associated with quicker response times and fewer errors when associating images of
natural foods with positive words and images of nonnatural foods with negative
words, than when associating natural foods with negative words and nonnatural foods
with positive words.
4. Shopping task. A simulated grocery shopping task was used to establish security
motivated behaviour manifested as food preference. Food preference was evaluated
given a choice between less expensive and nonnatural or more expensive and natural
versions of a number of food items. A simulated grocery shopping list was
constructed by participants who were instructed to adhere to a financial limit. The
independent variable, trait orthorexia was expected to predict performance on the
shopping task, operationally defined as the proportion of selected items that are
considered nonnnatural. Specifically, it was predicted that higher orthorexia would be
associated with fewer nonnnatural items selected.
Method
Participants
The present study recruited male and female students as the literature suggests no gender
differences in orthorexia. Of the 100 total participants whose data were included in the present
analyses, 77 were female. Regarding BMI, the mean was 24.38 (SD = 4.88). The participants
BMI ranged from 18.21 to 40.94. Participants were recruited from Psychology undergraduate
40
courses at Lakehead University. Students were directed to the online Sona Experiment Manager
System where they could view a description of the study, the inclusion criteria, and could sign up
to complete the online questionnaire battery via SurveyMonkey that comprised the first part of
the study. Upon visiting the SurveyMonkey website, the participant first viewed an information
letter (Appendix C) and participant consent form (Appendix D). A total of 374 participants
completed the online questionnaire battery, 103 of whom volunteered to complete the laboratory
session as well. Participants received half of one (0.5) bonus point for completing the online
questionnaire battery and two (2) bonus points for completing the laboratory visit. Bonus points
were applied to participants’ final grade in an undergraduate Psychology course eligible for
bonus points.
Materials
Eating Attitudes Test-26. (EAT-26; Garner, Olmsted, Bohr, & Garfinkel, 1982;
Appendix E). This measure is a shortened version of the original Eating Attitudes Test (Garner &
Garfinkel, 1979), and was created through factor analysis. Three factors were identified, namely
“dieting”, “bulimia and food preoccupation”, and “oral control,” (Garner et al., 1982). The EAT-
26 is intended to assess abnormal concern over food and weight (Garner et al., 1982). The EAT-
26 is composed of 26 items, each with six response options (always, usually, often, sometimes,
rarely, never; Garner et al., 1982). The EAT-26 has shown high internal consistency with
Cronbach’s α values of .90 and .83 for females with anorexia and controls, respectively (Garner
et al., 1982). Another study found slightly higher internal consistency (Cronbach’s α = .92;
Rudiger, Cash, Roehrig, & Thompson, 2007). The corrected item-total correlations are within the
acceptable range (.44 - .71; Garner et al., 1982). The concurrent validity of this measure was
assessed through a comparison between a group of females with anorexia and a control group
41
consisting of female university students, revealing significantly different scores between the two
groups (Garner et al., 1982). This instrument was used in the present study to measure disordered
eating and was included in the analyses as a covariate. Disordered eating, as measured by this
scale, is not characteristic of orthorexia per se; the underlying motivation for the restriction of
food is not driven by weight or shape concerns. However, due to the significant degree of
overlap between anorexia and orthorexia in presentation, a notable degree of shared variance
observed with respect to these two constructs was expected in the context of the present study.
Body Image States Scale. (BISS; Cash, Fleming, Alindogan, Steadman, & Whitehead,
2002; Appendix F). This scale is intended to measure states of appraisal, satisfaction, and
emotional reactions to one’s own body. The domains assessed include satisfaction regarding
physical appearance, body size and shape, and weight; feelings of attractiveness, and feelings
about appearance compared to usual feelings and compared to others. There are six items on the
scale, each with nine response options on a bipolar continuum. Higher scores on the BISS
indicate more positive body image. The internal consistency of the measure was found to be
acceptable by the authors for women (Cronbach’s α = .77) and for men (Cronbach’s α = .72;
Cash et al., 2002). Another study in which participants completed the BISS once daily over a
period of 10 days found higher internal consistency (Cronbach’s α = .81 - .92; Rudiger et al.,
2007). The test-retest reliability over a two to three-week test interval was r = .69 for women and
r = .68 for men (Cash et al., 2002). Construct validity of the scale was demonstrated by Cash et
al. (2002) in a study where two groups, either showing a dysfunctional investment in personal
appearance or not, differed significantly in their responses. The BISS was used in the present
study to measure the construct of body image. This construct was included in the analysis as a
covariate; it was expected that the predicted relationship between threat level, trait orthorexia,
42
and SMS activation would persist after controlling for body image. This prediction was guided
by the fact that orthorexic eating behaviour is not driven by concerns of shape or weight. The
motivation for the observed restriction of food is the pursuit of health, not weight loss.
Short Health Anxiety Inventory. (SHAI; Salkovskis, Rimes, Warwick, & Clark, 2002;
Appendix G). This measure is a shortened version of the original Health Anxiety Inventory
(Salkovskis et al., 2002) and was created using an empirical approach by selecting the items
from the original measure that had the greatest item-total correlations in a study involving
participants with hypochondriasis (Alberts, Hadjistavropoulos, Jones, & Sharpe, 2013). The
SHAI is intended to assess the construct of hypochondriasis, described as an unfounded fixation
with the idea of being or becoming ill, which manifests as hypervigilance to body and bodily
functions, engagement in safety behaviours, and the experience of health-related anxiety
(Abramowitz, Deacon, & Valentiner, 2007). The SHAI is composed of 18 items, each with four
possible response options. One study in which the SHAI was administered four times over a 3-
week period demonstrated high internal consistency of the measure (Cronbach’s α = .84 - .89)
and test-retest reliability (r = .87; Olatunji, Etzel, Tomarken, Ciesielski, & Deacon, 2011).
Another study also showed high internal consistency (Cronbach’s α = .86; Abramowitz et al.,
2007). The construct validity of this measure was assessed by a study that looked at SHAI scores
in relation to utilization of medical services and engagement in safety behaviours (Abramowitz
et al., 2007). The SHAI was used in the present study to measure the construct of health anxiety.
This construct was included in the analysis as a covariate; it was expected that the construct of
health anxiety will covary with the construct of orthorexia. This prediction was made on the
basis of health concern being the motivating factor behind the eating style observed in
orthorexia.
43
ORTO-15. The ORTO-15 (Appendix B; Donini et al., 2004) is the most widely used
instrument for the detection of orthorexia. Despite the psychometric limitations outlined
previously (see pp. 15-16), it is the current gold standard test for this purpose and was therefore
the first choice in terms of instrument with which to measure the construct of orthorexia. Another
option for the assessment of orthorexia in the present study was the Polish version of the ORTO-
15 (ORTO-P9), comprising only nine of the original items. Given the inconsistent findings
regarding the reliability of the ORTO-15, it was decided that the scale used to measure the
predictor variable would be contingent upon observed psychometric performance. The construct
of orthorexia was included in the analysis as a predictor variable in all four hypotheses.
Balanced Inventory of Desirable Responding. (BIDR; Paulhus, 1988; Appendix H).
The BIDR is intended to measure positive exaggerations in response style. Specifically, two
constructs are assessed: self-deceptive positivity and impression management. The former refers
to the endorsement of positively biased statements that are believed by the respondent and the
latter refers to a deliberate attempt to present oneself in a positively exaggerated regard. Each of
the two constructs may be assessed independently. Alternatively, all of the items may be
summed to produce an overall index of desirable responding, as was done in the present study.
The scale comprises 40 statements for which the respondent must indicate the degree to
which they agree, on a continuum from 1 to 7. Participants are given 1 point for extreme
responses, defined as endorsing a rating of 1 or 2 (6 or 7 for reverse-scored items) and 0 points
for nonextreme responses. After summing these values, higher scores are indicative of a greater
extent of desirable responding. The internal consistency of the measure was found to be
acceptable by the author (Cronbach’s α = .83; Ciarrochi & Bilich, 2006). In addition, a
metaanalysis by Li and Bagger (2007) demonstrated that the average internal consistency of the
44
overall index of desirable responding was acceptable, taking 18 studies into consideration
(Cronbach’s α = .80). The range of reliability coefficients reported in this article span from
Cronbach’s α =.68 to .86. The BIDR was used in the present study to measure the construct of
social desirability. Participants with extreme scores on this measure were excluded from
analyses. Extreme scores were defined as statistical outliers and comprised values with standard
deviations greater than 3.29 times the mean.
Taste test stimuli. The participants were asked to sample a variety of energy bars during
the taste test, as described in the Procedure section. Three of the food samples are considered to
be natural foods and include: mixed berry granola bars of the brand “Made GoodTM” peanut
butter chocolate protein bars from the brand “Simply ProteinTM,” and berry green superfood bars
from the brand “Amazing GrassTM”. These foods are labelled as natural on the packaging
information that was available to the participant during the food preference task and taste test.
The nutritional information and ingredients lists were viewed by the participants during the food
preference task. The remaining three samples are not considered to be natural foods and include:
mixed berry cereal bars from the brand “Great ValueTM,” peanut butter chocolate protein bars
from the brand “Special KTM,” and berry burst energy bars from the brand “VectorTM”. These
brands and flavours were chosen in an effort to match for different preferences that could affect
choice. The natural and nonnatural groups contain one bar marketed as a diet food (Simply
ProteinTM, Special KTM), one bar with a greater caloric value (Amazing GrassTM, VectorTM), and
one bar that is a cereal or granola bar rather than a protein or energy bar (Made GoodTM, Great
ValueTM). Within each of these three categories, an attempt was made to choose flavours that
were similar.
Procedure
45
A questionnaire battery was completed online via SurveyMonkey, including the EAT-26
(Appendix E), the BISS (Appendix F), the SHAI (Appendix G), and the ORTO-15 (Appendix
B). The participants were then able to sign up through the online Sona Experiment Manager
System to schedule a laboratory session to occur in the days or weeks ahead. The participants
were advised not to consume any food or caffeine in the 2 hours prior to their scheduled
laboratory session and not to consume any alcohol in the 12-hour period before their visit
because these factors are known to affect HRV.
Upon arrival to the scheduled laboratory visit, the experimental procedure was explained
to the participant. A timeline of this procedure is provided in Figure 2. The participant was asked
to read and sign the consent form that was previously signed prior to the online completion of the
questionnaire battery (Appendix D). The participant was then instructed to clean their skin with
an alcohol solution and to attach three electrodes in a lead-II ECG configuration, below the right
clavicle (positive), below the left rib (negative), and below the left clavicle (ground). Refer to
Appendix I for electrode placement instructions. The placement of the electrodes was verified by
the experimenter. The participant was then instructed to be seated and to remain as still as
possible, with the exception of movements required to engage in tasks throughout the
experiment. Seven ECG recording blocks occurred: the first four pertaining to the food
preference task and the last three for the taste test, IAT, and Shopping Task, respectively. The
first two recording blocks occurred in order to obtain a baseline ECG recording.
Food preference task and taste test. The participants were randomly assigned to either
the high or low threat group. This randomization was conducted using a randomization option
via SurveyMonkey. The participants were seated at a table facing a computer screen with a
computer mouse in front of them and told that they were participating in a taste test in order to
46
examine heart activity that occurs when people interact with food. The food preference task
consisted of four recording blocks. First, the participants viewed a series of household objects
(recording block 1) and were asked to rate the items in order of preference. The duration of this
slideshow was 3 minutes. The participants were then asked to sit quietly with their eyes closed
for a period of 3 minutes, instructed to think about how they would use each of the household
items viewed, one after the other (recording block 2). This instruction was provided in order to
cognitively engage the participant in a way that approximated the food exposure portion of the
task (description to follow) in an effort to minimize the differences between baseline and
experimental blocks. Next, participants were told that the series of photos they were about to
view was comprised of the six food samples that would be presented in the upcoming taste test.
Those in the low threat condition were told they would soon be asked to “sample three or more
items in a taste test”. Those in the high threat condition were told they would be asked to
“sample the items in a taste test”, bearing the implication that all six of the samples would need
to be tasted. All participants proceeded to view the series of images consisting of the packaging,
nutritional label, and ingredients list of each of the food samples (recording block 3) for a
duration of 3 minutes. The participants then rated the samples in order of preference and then
were asked to engage in a second eyes-closed recording, instructed to think about the samples
that would be tasted (recording block 4). It is only at this time that all participants were informed
that they would be asked to taste three or more of the samples. Thus, for the duration of
recording blocks 3 and 4, those in the high threat condition were presumably under the
impression that they would be instructed to taste all six of the samples, three of which are
nonnatural foods. This condition is considered high threat because three of the food items are not
natural and therefore have the potential to be perceived as threatening to an individual high in
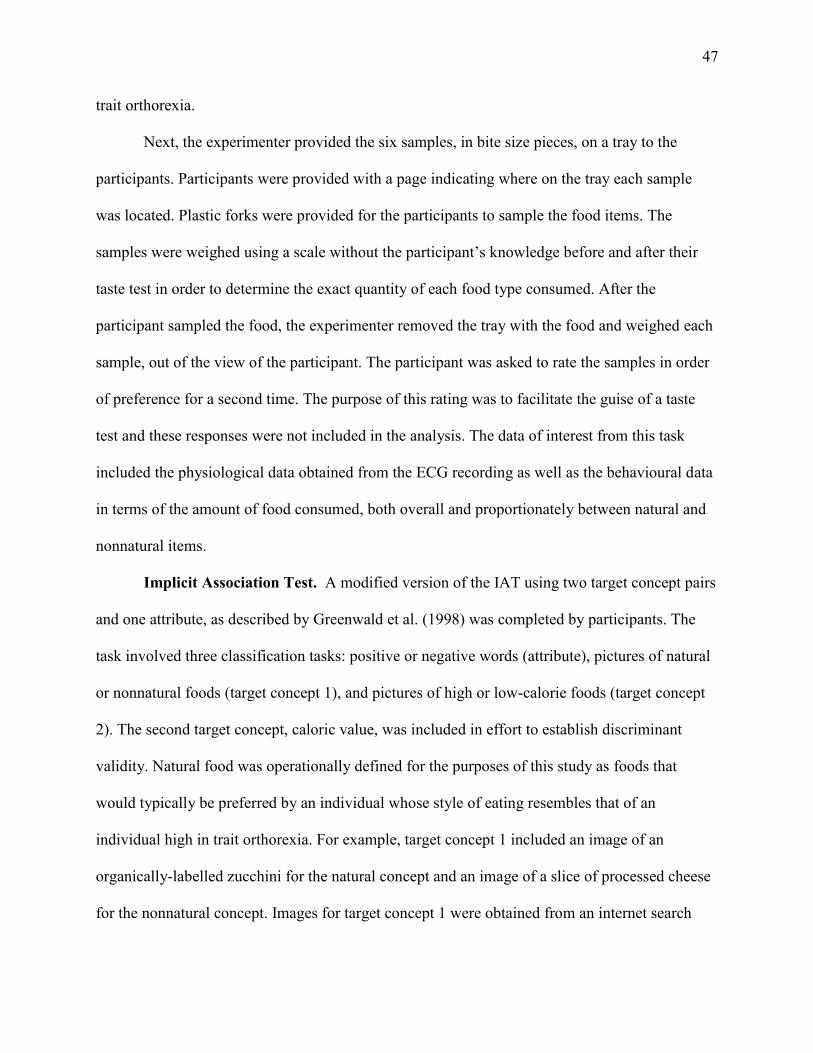
47
trait orthorexia.
Next, the experimenter provided the six samples, in bite size pieces, on a tray to the
participants. Participants were provided with a page indicating where on the tray each sample
was located. Plastic forks were provided for the participants to sample the food items. The
samples were weighed using a scale without the participant’s knowledge before and after their
taste test in order to determine the exact quantity of each food type consumed. After the
participant sampled the food, the experimenter removed the tray with the food and weighed each
sample, out of the view of the participant. The participant was asked to rate the samples in order
of preference for a second time. The purpose of this rating was to facilitate the guise of a taste
test and these responses were not included in the analysis. The data of interest from this task
included the physiological data obtained from the ECG recording as well as the behavioural data
in terms of the amount of food consumed, both overall and proportionately between natural and
nonnatural items.
Implicit Association Test. A modified version of the IAT using two target concept pairs
and one attribute, as described by Greenwald et al. (1998) was completed by participants. The
task involved three classification tasks: positive or negative words (attribute), pictures of natural
or nonnatural foods (target concept 1), and pictures of high or low-calorie foods (target concept
2). The second target concept, caloric value, was included in effort to establish discriminant
validity. Natural food was operationally defined for the purposes of this study as foods that
would typically be preferred by an individual whose style of eating resembles that of an
individual high in trait orthorexia. For example, target concept 1 included an image of an
organically-labelled zucchini for the natural concept and an image of a slice of processed cheese
for the nonnatural concept. Images for target concept 1 were obtained from an internet search
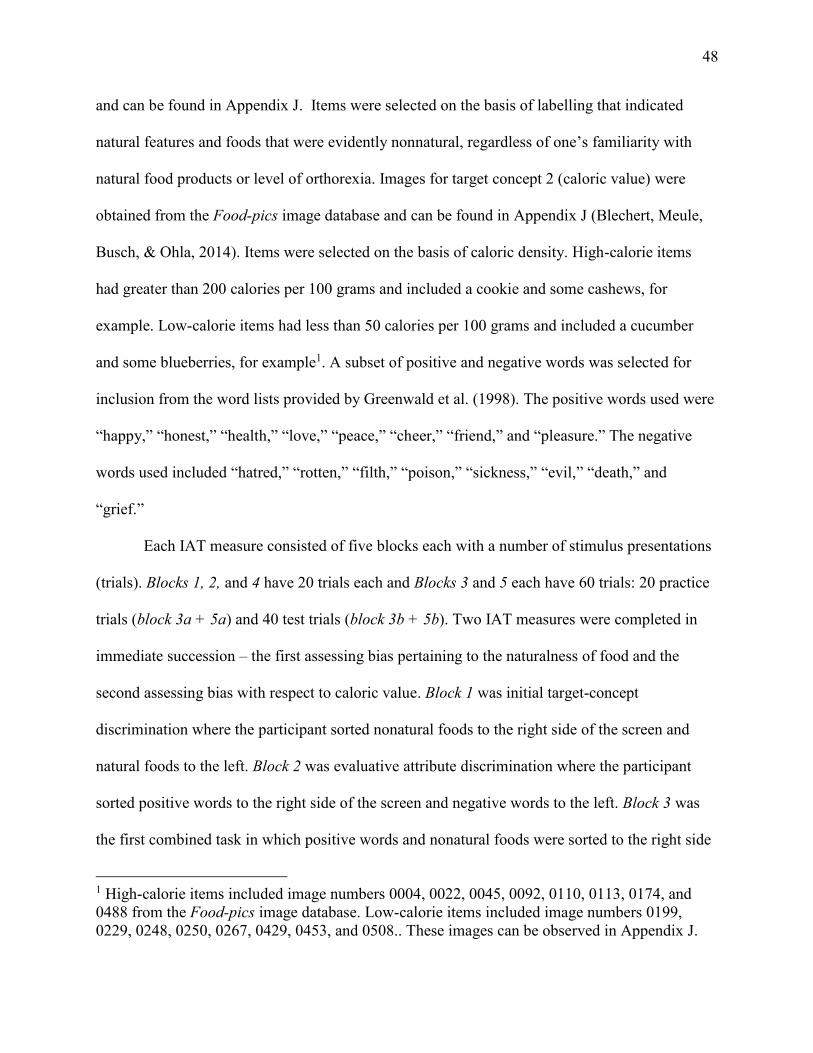
48
and can be found in Appendix J. Items were selected on the basis of labelling that indicated
natural features and foods that were evidently nonnatural, regardless of one’s familiarity with
natural food products or level of orthorexia. Images for target concept 2 (caloric value) were
obtained from the Food-pics image database and can be found in Appendix J (Blechert, Meule,
Busch, & Ohla, 2014). Items were selected on the basis of caloric density. High-calorie items
had greater than 200 calories per 100 grams and included a cookie and some cashews, for
example. Low-calorie items had less than 50 calories per 100 grams and included a cucumber
and some blueberries, for example1. A subset of positive and negative words was selected for
inclusion from the word lists provided by Greenwald et al. (1998). The positive words used were
“happy,” “honest,” “health,” “love,” “peace,” “cheer,” “friend,” and “pleasure.” The negative
words used included “hatred,” “rotten,” “filth,” “poison,” “sickness,” “evil,” “death,” and
“grief.”
Each IAT measure consisted of five blocks each with a number of stimulus presentations
(trials). Blocks 1, 2, and 4 have 20 trials each and Blocks 3 and 5 each have 60 trials: 20 practice
trials (block 3a + 5a) and 40 test trials (block 3b + 5b). Two IAT measures were completed in
immediate succession – the first assessing bias pertaining to the naturalness of food and the
second assessing bias with respect to caloric value. Block 1 was initial target-concept
discrimination where the participant sorted nonatural foods to the right side of the screen and
natural foods to the left. Block 2 was evaluative attribute discrimination where the participant
sorted positive words to the right side of the screen and negative words to the left. Block 3 was
the first combined task in which positive words and nonatural foods were sorted to the right side
1 High-calorie items included image numbers 0004, 0022, 0045, 0092, 0110, 0113, 0174, and 0488 from the Food-pics image database. Low-calorie items included image numbers 0199, 0229, 0248, 0250, 0267, 0429, 0453, and 0508.. These images can be observed in Appendix J.
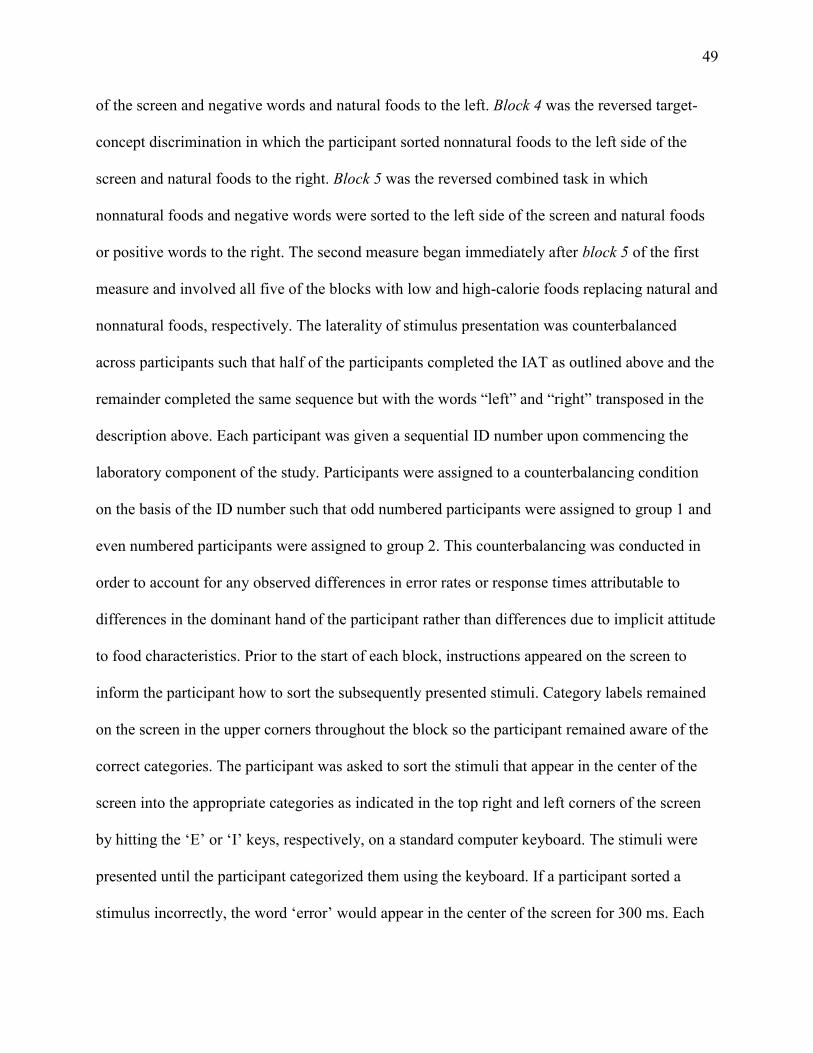
49
of the screen and negative words and natural foods to the left. Block 4 was the reversed target-
concept discrimination in which the participant sorted nonnatural foods to the left side of the
screen and natural foods to the right. Block 5 was the reversed combined task in which
nonnatural foods and negative words were sorted to the left side of the screen and natural foods
or positive words to the right. The second measure began immediately after block 5 of the first
measure and involved all five of the blocks with low and high-calorie foods replacing natural and
nonnatural foods, respectively. The laterality of stimulus presentation was counterbalanced
across participants such that half of the participants completed the IAT as outlined above and the
remainder completed the same sequence but with the words “left” and “right” transposed in the
description above. Each participant was given a sequential ID number upon commencing the
laboratory component of the study. Participants were assigned to a counterbalancing condition
on the basis of the ID number such that odd numbered participants were assigned to group 1 and
even numbered participants were assigned to group 2. This counterbalancing was conducted in
order to account for any observed differences in error rates or response times attributable to
differences in the dominant hand of the participant rather than differences due to implicit attitude
to food characteristics. Prior to the start of each block, instructions appeared on the screen to
inform the participant how to sort the subsequently presented stimuli. Category labels remained
on the screen in the upper corners throughout the block so the participant remained aware of the
correct categories. The participant was asked to sort the stimuli that appear in the center of the
screen into the appropriate categories as indicated in the top right and left corners of the screen
by hitting the ‘E’ or ‘I’ keys, respectively, on a standard computer keyboard. The stimuli were
presented until the participant categorized them using the keyboard. If a participant sorted a
stimulus incorrectly, the word ‘error’ would appear in the center of the screen for 300 ms. Each
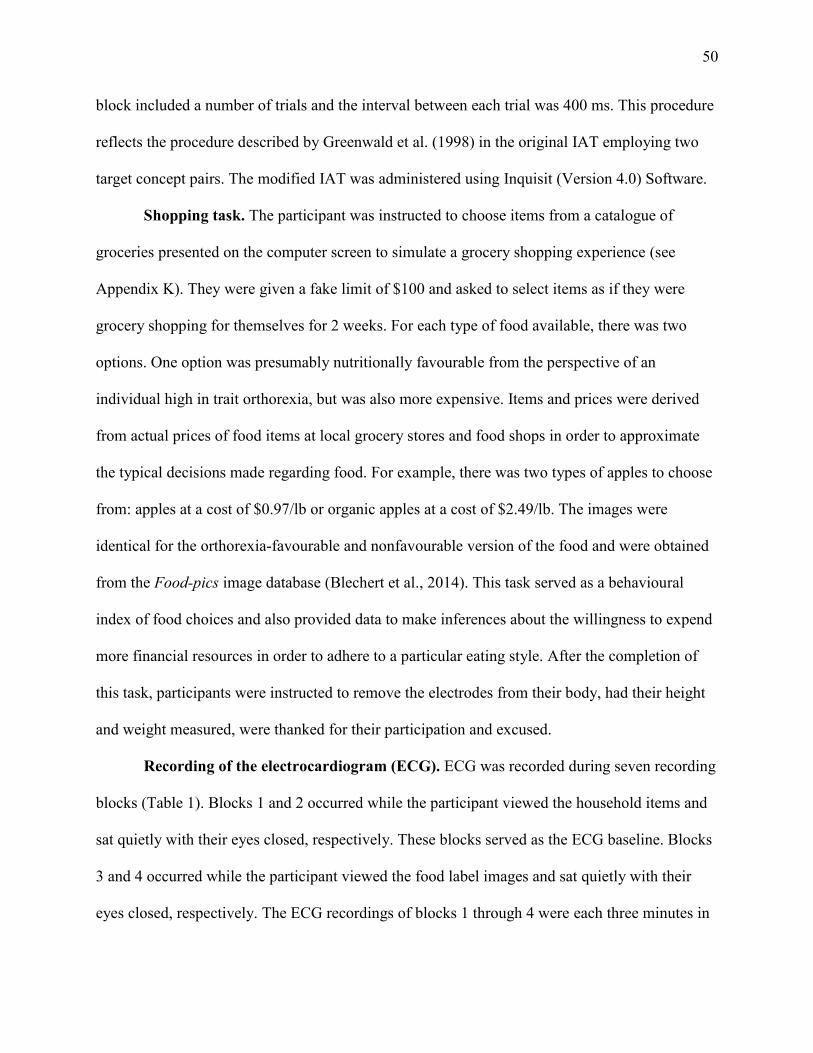
50
block included a number of trials and the interval between each trial was 400 ms. This procedure
reflects the procedure described by Greenwald et al. (1998) in the original IAT employing two
target concept pairs. The modified IAT was administered using Inquisit (Version 4.0) Software.
Shopping task. The participant was instructed to choose items from a catalogue of
groceries presented on the computer screen to simulate a grocery shopping experience (see
Appendix K). They were given a fake limit of $100 and asked to select items as if they were
grocery shopping for themselves for 2 weeks. For each type of food available, there was two
options. One option was presumably nutritionally favourable from the perspective of an
individual high in trait orthorexia, but was also more expensive. Items and prices were derived
from actual prices of food items at local grocery stores and food shops in order to approximate
the typical decisions made regarding food. For example, there was two types of apples to choose
from: apples at a cost of $0.97/lb or organic apples at a cost of $2.49/lb. The images were
identical for the orthorexia-favourable and nonfavourable version of the food and were obtained
from the Food-pics image database (Blechert et al., 2014). This task served as a behavioural
index of food choices and also provided data to make inferences about the willingness to expend
more financial resources in order to adhere to a particular eating style. After the completion of
this task, participants were instructed to remove the electrodes from their body, had their height
and weight measured, were thanked for their participation and excused.
Recording of the electrocardiogram (ECG). ECG was recorded during seven recording
blocks (Table 1). Blocks 1 and 2 occurred while the participant viewed the household items and
sat quietly with their eyes closed, respectively. These blocks served as the ECG baseline. Blocks
3 and 4 occurred while the participant viewed the food label images and sat quietly with their
eyes closed, respectively. The ECG recordings of blocks 1 through 4 were each three minutes in
51
length. These blocks served as the first food exposure. Blocks 5, 6, and 7 occurred while the
participant engaged in the taste test, the IAT, and the shopping task, respectively. These
recording blocks were included for the purposes of future exploratory analysis unrelated to the
purposes of the present study. A 72-channel amplifier (Advanced Neuro Technology, Enschede,
Netherlands) was used to record ECG activity at a sampling frequency of 1024 Hz.
Results
HRV Variables
HRV reactivity is defined as the deviation from baseline in response to an event or
stressor. A commonly used research practice for the determination of HRV reactivity is to
calculate a difference score by subtracting the baseline variable (block 1 and 2 household item
exposure) from the HRV variable pertaining to the period of interest (block 3 and 4 food
exposure). Difference scores, however, can be artificially augmented by regression to the mean
or other artefactual processes. As such, it is recommended that, rather than calculate difference
scores, the final state variable be included in the analysis as an outcome variable and the baseline
variable included as a covariate (Hayes & Rockwood, 2016). The present study abided by the
aforementioned recommendation and did not employ difference scores. The variables included
for evaluating HRV reactivity depended upon the recording period of interest. HRV recording
block 1 was included as a covariate when HRV recording block 3 was the final state as both
recordings were obtained while the participants viewed a series of stimuli (control or food
exposure). HRV recording block 2 was included as a covariate when HRV recording block 4 was
the final state as both recordings were obtained while the participants sat with their eyes closed
and were instructed to think about the previously viewed stimuli (control or food exposure). A
composite baseline score obtained by averaging blocks 1 and 2 was used as a covariate when the
52
final state was a composite food exposure score obtained by averaging blocks 3 and 4 (see
Composite scores section below).
The HRV indices of interest were as follows: the square root of the mean squared
successive differences (RMSSD) in the cardiac inter-beat interval; the absolute power of the high
frequency band (HF); the standard deviation of data points perpendicular to the line of identity
on a Poincaré plot (SD1). The RMSSD variable is derived from a time-domain method of
analysis. It is calculated using the distance between successive R-wave peaks (R-R intervals) in
the cardiac rhythm and is a measure of short term variability suited to short recording durations
employed in the present study. RMSSD is expressed in units of milliseconds (ms; Tarvainen,
2014). The HF variable is derived from a frequency-domain method of analysis which involves
the calculation of a power spectrum density for the inter-beat intervals. HF falls within the band
of 0.15-0.4 Hz, and is expressed in absolute power and units of milliseconds squared (m2;
Tarvainen, 2014). By contrast to these linear measures of HRV, the SD1 variable is derived from
a non-linear method of calculation. A Poincaré plot is constructed in which each R-R interval is
plotted against the subsequent R-R interval to display the successive correlations (i.e., the
correlation between the first and second R-R interval, the correlation between the second and
third R-R interval, etc.) A line of identity is then constructed that fits best through the cloud of
points. The standard deviation of the points measured perpendicular to the line of identity is a
measure of the breadth of the cloud of data points (Piskorski, 2007). This standard deviation
comprises the HRV variable SD1 which is a measure of short term variability that is
predominantly attributed to respiratory sinus arrhythmia. SD1 is expressed in units of
milliseconds (ms; Tarvainen, 2014).
Composite scores. In addition to the HRV variables for individual blocks, two composite
53
HRV variables were calculated. These variables were created to facilitate data reduction. The
baseline composite score, indicated by the subscript B, was calculated by averaging blocks 1 and
2. The exposure composite score, indicated by the subscript E, was calculated by averaging
blocks 3 and 4. Prior to the calculation of these composite scores, two paired t-tests were
performed to detect any significant differences that would contraindicate the amalgamation of
the scores. With respect to the baseline composite, no significant differences were found in the
comparison of blocks 1 and 2 for RMSSD, t(99) = 1.59, p = .115; for HF, t(99) = 0.41, p = .683;
or for SD1, t(99) = 1.60, p = .115. With respect to the exposure composite score, no significant
differences were found in the comparison of blocks 3 and 4 for RMSSD, t(99) = -1.17, p = .245;
for HF, t(99) = -1.09, p = .280; or for SD1, t(99) = -1.17, p = .245. Thus, no contraindications to
the formation of composite scores for baseline (blocks 1 and 2) and food exposure (blocks 3 and
4) were observed.
Data Analytic Approach
This study relied upon ordinary least squares simple linear regression, multiple
regression, and moderated regression analyses as techniques for data analysis. Hypotheses 1, 3,
and 4 comprised attempts to explain variation in the criterion variable, given an individual
differences predictor and a number of covariates. Multiple linear regression was thus used to
analyze hypotheses 1, 3, and 4. Hypothesis 2 was tested using simple moderation analysis.
Simple moderation describes a relationship such that the effect of variable X (predictor) on
variable Y (criterion) is contingent upon the size, strength, or sign of a third variable M
(moderator; Hayes, 2013; Figure 3). Moderation analyses are used to identify the boundary
conditions of an effect. Moderation analyses provide information about when an effect can be
observed or for whom a relationship between two variables exists.
54
Parametric Assumptions
Data included in the present analyses were evaluated for violation of parametric
assumptions in order to ensure the accuracy of obtained results and facilitate the validity of
subsequent interpretations and inferences. Linear models, and their variations, are based on a
number of assumptions including additivity and linearity, normality, homoscedasticity, and
independence. The assumption of linearity assumes that the true relationship between predictor
and criterion variables is in fact, linear. Additivity means that, given several predictors, the
criterion would be best accounted for by summing the predictor effects. To check for violations
of linearity, residual scatterplots were visually inspected for curvature in the standardized
residuals (Field, 2013). No observed curves in the data points were noted, indicating that the
assumption of linearity was not violated.
The assumption of normality concerns the shape of the distribution of data. Variables
were assessed for normality by calculating Zskewness defined as skewness / SE. An obtained
Zskewness statistic with an absolute value greater than 1.96 would be considered a significant
departure from normality at the p < .05 level in need of transformation (Field, 2013). When the
transformation remedied or largely attenuated the skew, the transformed variable was used in
subsequent analyses. Prior to any transformation, outliers were dealt with using a variation of
winzorizing. Standardized scores were calculated for the variables of interest. Outliers, or values
that had absolute standardized scores of 3.29 or greater, were manually changed to values equal
to the mean plus 3.29 times the standard deviation (Field, 2013). In other words, they were
modified to fit within the boundary of what would be considered an outlier, given the original
nonwinzorized data.
The assumption of homoscedasticity of variance assumes that the variance of one
55
variable does not differ with changes in the level of another variable. Visual inspection of
residual scatterplots revealed evidence of a systematic relationship. Specifically, the residual
scatterplots revealed less variability in the standardized residuals for lower predicted HRV
values. Heteroscedasticity is a problem because it leads to biased standard errors which in turn
affect the validity and power of statistical tests and confidence intervals. In accordance with the
recommendation of Hayes and Cai (2007), heteroscedasticity consistent standard errors
estimators were used in the analysis of hypothesis 2, which involves the HRV recording
variables.
The assumption of independence assumes that the errors in estimation are statistically
unrelated (Hayes, 2013). This assumption was tested by checking for serial correlations between
errors using the Durbin-Watson test (Field, 2013). This analysis revealed no evidence of serial
correlations between errors among psychometric and task variables with Durbin-Watson test
statistics ranging from 1.93-2.44.
Data Preparation
All psychometric, HRV recording, and food exposure task data were entered in IBM
SPSS Statistics v.24. Among ECG data, three individuals had incomplete recordings for block 1
because of technical errors. A paired t-test revealed no significant difference between ECG
recording blocks 1 and 2 in the remainder of the sample. The block 1 recording for these three
participants was replaced with the ECG recording from block 2.
Three participants were dropped from all analyses. One participant was excluded due to
lack of adherence to the procedure in the laboratory component of the experiment. One
additional participant was excluded from the analysis due to acute illness that prevented the
completion of the entire laboratory component. The third participant was excluded due to an
56
extreme response bias in the online questionnaire battery detected as a statistical outlier value on
the BIDR (Paulhus, 1988). This resulted in 100 participants who completed both the online and
laboratory components of the study who were included in the present analysis. One participant
did not complete the STAI measures at baseline or exposure and so his data was excluded from
analyses involving the STAI variable. Technical malfunctions resulted in missing ECG data for
one participant during the IAT (HRV recording block 6).
There were some missing data from the online questionnaire battery. These missing
values were replaced using a prorating strategy based on the available responses given by the
participant on the measure of interest. A cutoff of 20% of missing values was utilized; if more
than 20% of a participant’s responses were missing for a given measure, the missing values
would not be replaced. No participants included in the present analysis were missing more than
20% of response on any measure. As such, no psychometric data was excluded from the present
analysis.
ECG recordings. Artifacts in ECG data resulting from movements or muscle activity
were visually inspected using ASA-LAB software (Version 16; Advanced Neura Technology,
Enschede, Netherlands). Analysis of ECG data used a high-pass filter with a low cut-off
frequency of 1 Hz and a high cut-off frequency of 100 Hz. The ECG recordings were then
visually inspected, remaining artifacts corrected for, and ECG recordings analyzed using Kubios
HRV specialized analysis software (Biosignal Analysis and Medical Imaging Group; http://
kubios.uef.fi/; version 2.2).
Psychometric variables. Descriptive information and reliability coefficients of
psychometric variables are presented in Table 2. These variables represent either a predictor or a
covariate in the subsequent analyses. The psychometric data that were found to be significantly
57
positively skewed were subjected to the natural logarithmic transformation (Field, 2013). Zskewness
was used to determine the skew of each psychometric variable. A Z score of +/- 1.96 was
indicative of a significant degree of skew. A significant and positive skew was observed for
EAT-26 which was subjected to the natural logarithmic transformation producing a Zskewness
statistic of -0.34, thus remedying the skew. The transformed variable EAT-26(ln) was retained
for subsequent analyses. A significant and positive skew was observed for SHAI which was
subjected to the natural logarithmic transformation producing a Zskewness statistic of -1.59, thus
remedying the skew. The transformed variable SHAI(ln) was retained for subsequent analyses.
The two variables under consideration for the index of orthorexia in the present study
were ORTO-15 and ORTO-P9. Of primary concern was the internal consistency of these
measures which has been demonstrably inadequate in the literature. The internal consistency of
the ORTO-15 was found in the present study to be inadequate (Cronbach’s α = .26). Recall that
the ORTO-P9 is comprised of nine of the original 15 items of the ORTO-15 (Brytek-Matera, et
al., 2014). The internal consistency of the ORTO-P9 (Cronbach’s α = .69) was found to be
higher yet still below the standard of .7 that is recommended for group comparison (Bland &
Altman, 1997). The ORTO-P9, however, demonstrated clear superiority over the ORTO-15 in
terms of internal reliability and was therefore retained for subsequent analyses involving the
construct of orthorexia. No significant skew was observed for ORTO-P9.
Both ORTO-15 and ORTO-P9 were designed such that lower scores indicate greater
orthorexic tendency. However, to facilitate interpretation of findings in the present study, these
variables were subjected to a reciprocal transformation by subtracting all values from the highest
obtained score such that high scores now indicate greater orthorexic tendency. The resulting
reciprocals are denoted hereafter by ORTO-15r and ORTO-P9r.
58
An intercorrelation matrix of the five psychometric variables is displayed in Table 3.
Also included is the original ORTO-15r for comparative purposes. Significant correlations were
obtained among all variables. Orthorexia was associated with greater disordered eating, health
anxiety, and low body image satisfaction. ORTO-P9r is the predictor variable. The other
psychometric variables comprise covariates that were included in subsequent analyses.
Food exposure task variables. This section explores the statistical properties of six
dependent variables obtained over the four food exposure tasks completed by participants during
the laboratory component of the study (see Tables 4 & 5). Regarding the first task–the food
preference task–participants were instructed to rank order the six food bars using untied ranks
according to preference. Scoring was accomplished by assigning each bar a value of 1 if it was
ranked in one of the top three ranks 1-3 by a given participant. Otherwise, the bar was given a
value of 0 if it was in rank 4-6. These dichotomous scores were then summed to produce two
indices of food preference; a natural score which was the sum total of the natural bars ranked 1-
3, and a nonnatural score which was the sum total of the nonnatural bars ranked 1-3. These two
preference indices were then entered into the following food preference equation, 𝐹𝑃 =
𝑛𝑎𝑡𝑢𝑟𝑎𝑙 𝑠𝑐𝑜𝑟𝑒−𝑛𝑜𝑛𝑛𝑎𝑡𝑢𝑟𝑎𝑙 𝑠𝑐𝑜𝑟𝑒
𝑛𝑎𝑡𝑢𝑟𝑎𝑙 𝑠𝑐𝑜𝑟𝑒+𝑛𝑜𝑛𝑛𝑎𝑡𝑢𝑟𝑎𝑙 𝑠𝑐𝑜𝑟𝑒∗ 100, to obtain a single score ranging from -100 to 100. This score
constituted the sample ranking variable. Positive scores denote a preference for natural food such
that ranking the three natural bars in the top three positions would yield a score of 100, and
ranking the three nonnatural bars in the top three positions would yield a score of -100.
With respect to the second food exposure–the taste test–the data was obtained by
measuring the weight of the food samples before and after they were presented to the participant.
This produced an index of the weight in grams (g) of each bar that was consumed by the
participant. The weight of the three natural bars and the three nonnatural bars were then summed
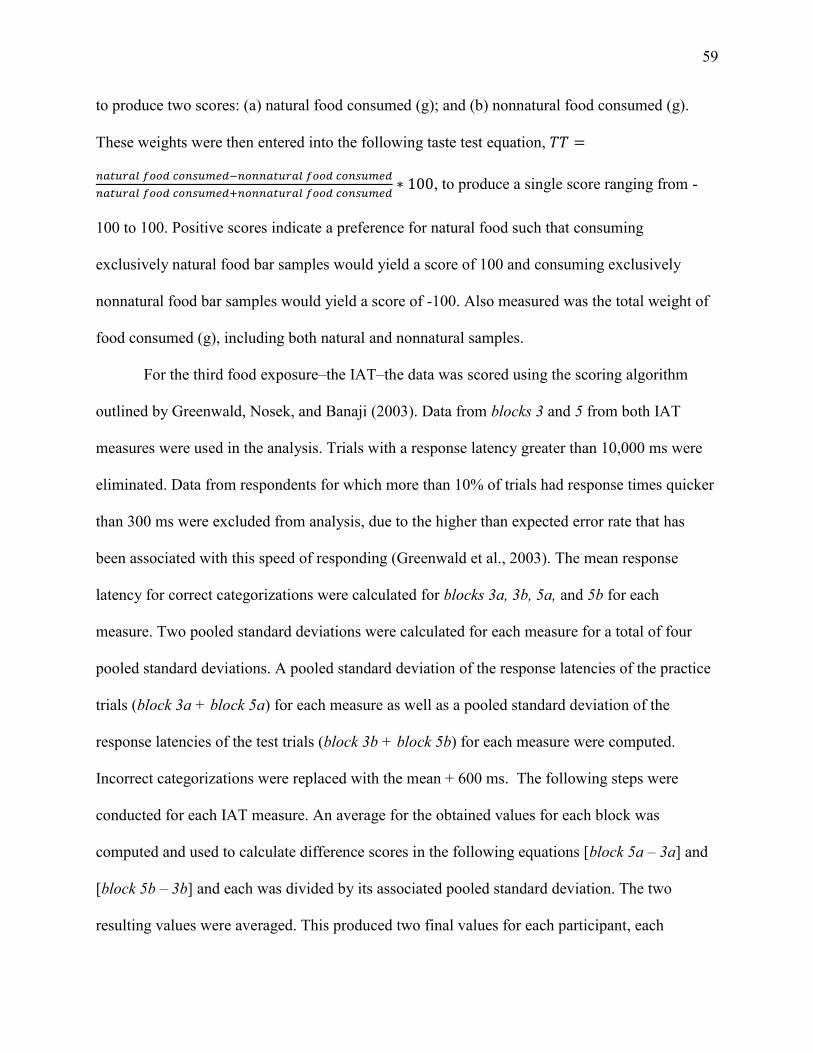
59
to produce two scores: (a) natural food consumed (g); and (b) nonnatural food consumed (g).
These weights were then entered into the following taste test equation, 𝑇𝑇 =
𝑛𝑎𝑡𝑢𝑟𝑎𝑙 𝑓𝑜𝑜𝑑 𝑐𝑜𝑛𝑠𝑢𝑚𝑒𝑑−𝑛𝑜𝑛𝑛𝑎𝑡𝑢𝑟𝑎𝑙 𝑓𝑜𝑜𝑑 𝑐𝑜𝑛𝑠𝑢𝑚𝑒𝑑
𝑛𝑎𝑡𝑢𝑟𝑎𝑙 𝑓𝑜𝑜𝑑 𝑐𝑜𝑛𝑠𝑢𝑚𝑒𝑑+𝑛𝑜𝑛𝑛𝑎𝑡𝑢𝑟𝑎𝑙 𝑓𝑜𝑜𝑑 𝑐𝑜𝑛𝑠𝑢𝑚𝑒𝑑∗ 100, to produce a single score ranging from -
100 to 100. Positive scores indicate a preference for natural food such that consuming
exclusively natural food bar samples would yield a score of 100 and consuming exclusively
nonnatural food bar samples would yield a score of -100. Also measured was the total weight of
food consumed (g), including both natural and nonnatural samples.
For the third food exposure–the IAT–the data was scored using the scoring algorithm
outlined by Greenwald, Nosek, and Banaji (2003). Data from blocks 3 and 5 from both IAT
measures were used in the analysis. Trials with a response latency greater than 10,000 ms were
eliminated. Data from respondents for which more than 10% of trials had response times quicker
than 300 ms were excluded from analysis, due to the higher than expected error rate that has
been associated with this speed of responding (Greenwald et al., 2003). The mean response
latency for correct categorizations were calculated for blocks 3a, 3b, 5a, and 5b for each
measure. Two pooled standard deviations were calculated for each measure for a total of four
pooled standard deviations. A pooled standard deviation of the response latencies of the practice
trials (block 3a + block 5a) for each measure as well as a pooled standard deviation of the
response latencies of the test trials (block 3b + block 5b) for each measure were computed.
Incorrect categorizations were replaced with the mean + 600 ms. The following steps were
conducted for each IAT measure. An average for the obtained values for each block was
computed and used to calculate difference scores in the following equations [block 5a – 3a] and
[block 5b – 3b] and each was divided by its associated pooled standard deviation. The two
resulting values were averaged. This produced two final values for each participant, each
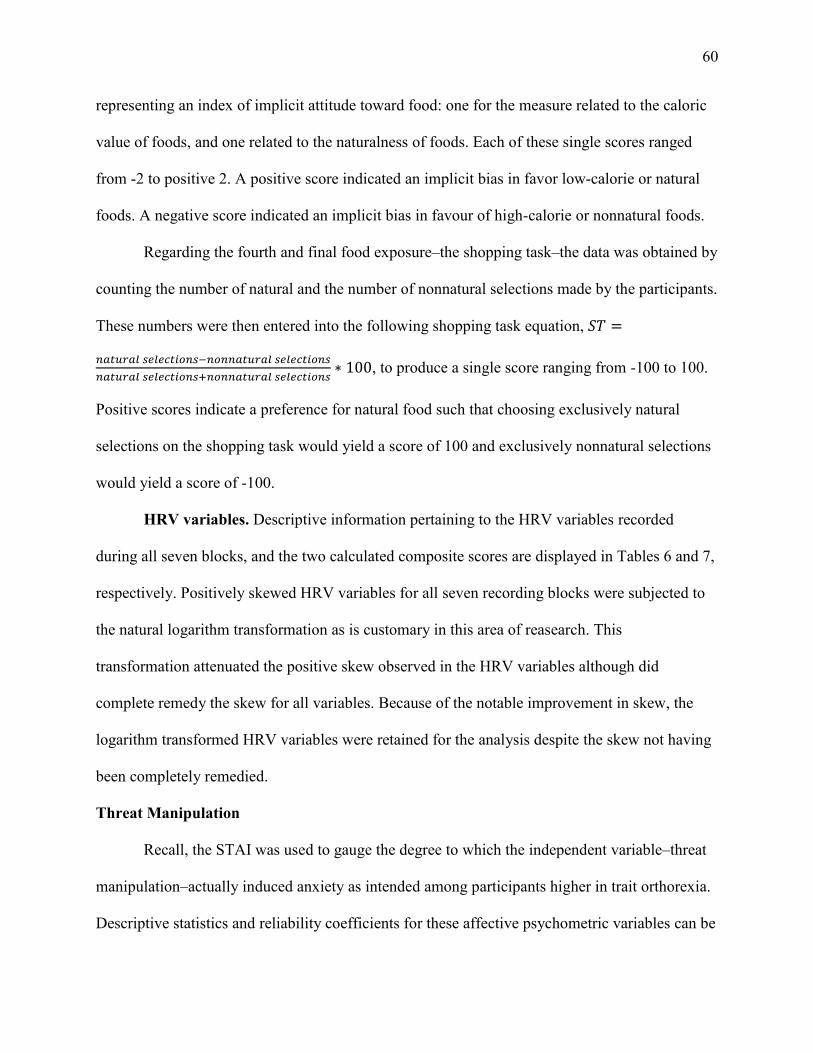
60
representing an index of implicit attitude toward food: one for the measure related to the caloric
value of foods, and one related to the naturalness of foods. Each of these single scores ranged
from -2 to positive 2. A positive score indicated an implicit bias in favor low-calorie or natural
foods. A negative score indicated an implicit bias in favour of high-calorie or nonnatural foods.
Regarding the fourth and final food exposure–the shopping task–the data was obtained by
counting the number of natural and the number of nonnatural selections made by the participants.
These numbers were then entered into the following shopping task equation, 𝑆𝑇 =
𝑛𝑎𝑡𝑢𝑟𝑎𝑙 𝑠𝑒𝑙𝑒𝑐𝑡𝑖𝑜𝑛𝑠−𝑛𝑜𝑛𝑛𝑎𝑡𝑢𝑟𝑎𝑙 𝑠𝑒𝑙𝑒𝑐𝑡𝑖𝑜𝑛𝑠
𝑛𝑎𝑡𝑢𝑟𝑎𝑙 𝑠𝑒𝑙𝑒𝑐𝑡𝑖𝑜𝑛𝑠+𝑛𝑜𝑛𝑛𝑎𝑡𝑢𝑟𝑎𝑙 𝑠𝑒𝑙𝑒𝑐𝑡𝑖𝑜𝑛𝑠∗ 100, to produce a single score ranging from -100 to 100.
Positive scores indicate a preference for natural food such that choosing exclusively natural
selections on the shopping task would yield a score of 100 and exclusively nonnatural selections
would yield a score of -100.
HRV variables. Descriptive information pertaining to the HRV variables recorded
during all seven blocks, and the two calculated composite scores are displayed in Tables 6 and 7,
respectively. Positively skewed HRV variables for all seven recording blocks were subjected to
the natural logarithm transformation as is customary in this area of reasearch. This
transformation attenuated the positive skew observed in the HRV variables although did
complete remedy the skew for all variables. Because of the notable improvement in skew, the
logarithm transformed HRV variables were retained for the analysis despite the skew not having
been completely remedied.
Threat Manipulation
Recall, the STAI was used to gauge the degree to which the independent variable–threat
manipulation–actually induced anxiety as intended among participants higher in trait orthorexia.
Descriptive statistics and reliability coefficients for these affective psychometric variables can be
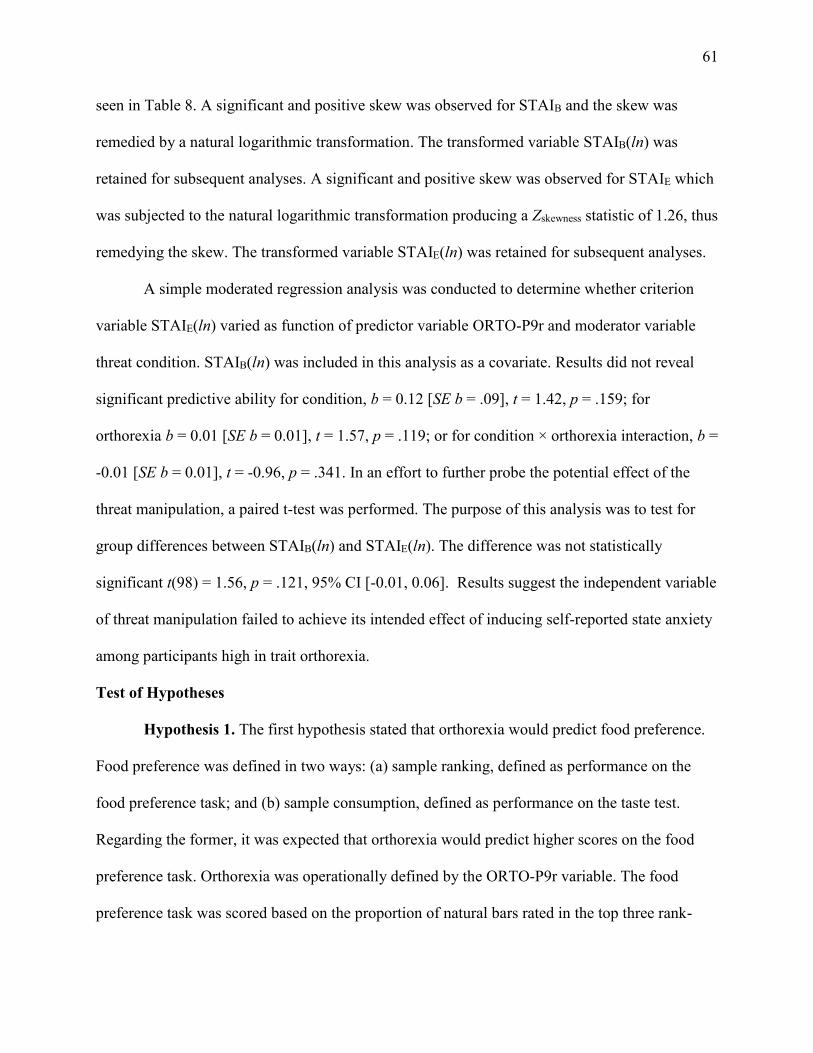
61
seen in Table 8. A significant and positive skew was observed for STAIB and the skew was
remedied by a natural logarithmic transformation. The transformed variable STAIB(ln) was
retained for subsequent analyses. A significant and positive skew was observed for STAIE which
was subjected to the natural logarithmic transformation producing a Zskewness statistic of 1.26, thus
remedying the skew. The transformed variable STAIE(ln) was retained for subsequent analyses.
A simple moderated regression analysis was conducted to determine whether criterion
variable STAIE(ln) varied as function of predictor variable ORTO-P9r and moderator variable
threat condition. STAIB(ln) was included in this analysis as a covariate. Results did not reveal
significant predictive ability for condition, b = 0.12 [SE b = .09], t = 1.42, p = .159; for
orthorexia b = 0.01 [SE b = 0.01], t = 1.57, p = .119; or for condition × orthorexia interaction, b =
-0.01 [SE b = 0.01], t = -0.96, p = .341. In an effort to further probe the potential effect of the
threat manipulation, a paired t-test was performed. The purpose of this analysis was to test for
group differences between STAIB(ln) and STAIE(ln). The difference was not statistically
significant t(98) = 1.56, p = .121, 95% CI [-0.01, 0.06]. Results suggest the independent variable
of threat manipulation failed to achieve its intended effect of inducing self-reported state anxiety
among participants high in trait orthorexia.
Test of Hypotheses
Hypothesis 1. The first hypothesis stated that orthorexia would predict food preference.
Food preference was defined in two ways: (a) sample ranking, defined as performance on the
food preference task; and (b) sample consumption, defined as performance on the taste test.
Regarding the former, it was expected that orthorexia would predict higher scores on the food
preference task. Orthorexia was operationally defined by the ORTO-P9r variable. The food
preference task was scored based on the proportion of natural bars rated in the top three rank-
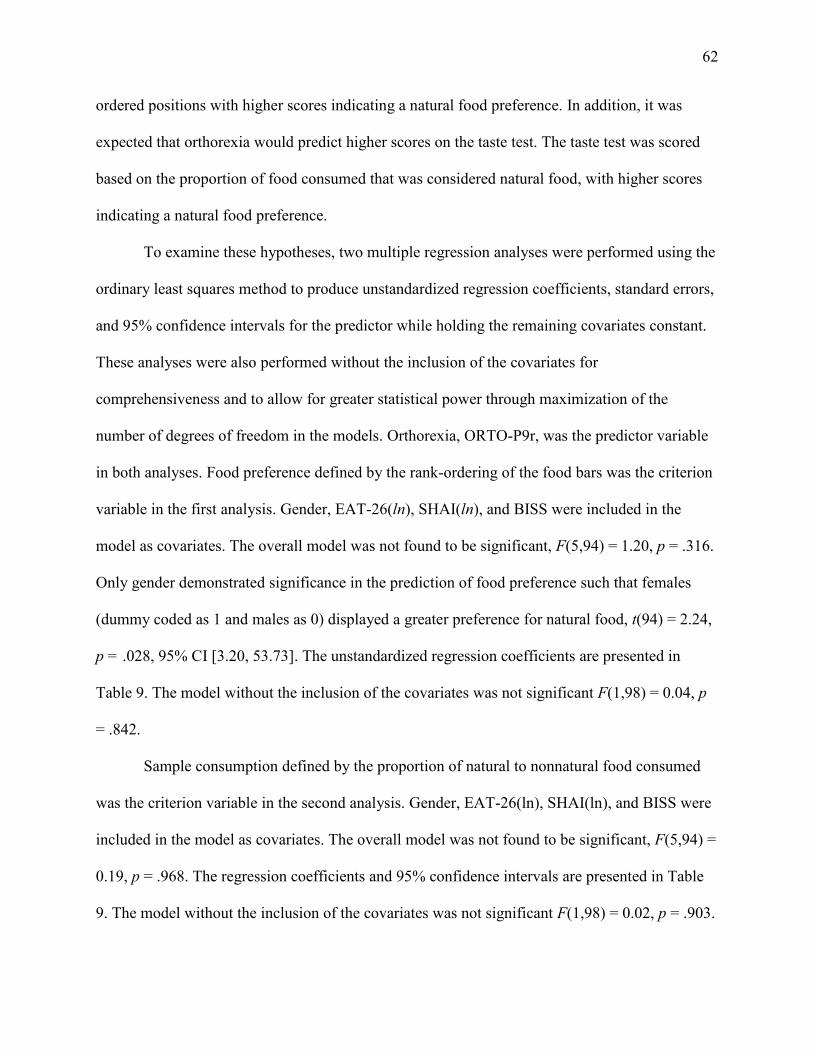
62
ordered positions with higher scores indicating a natural food preference. In addition, it was
expected that orthorexia would predict higher scores on the taste test. The taste test was scored
based on the proportion of food consumed that was considered natural food, with higher scores
indicating a natural food preference.
To examine these hypotheses, two multiple regression analyses were performed using the
ordinary least squares method to produce unstandardized regression coefficients, standard errors,
and 95% confidence intervals for the predictor while holding the remaining covariates constant.
These analyses were also performed without the inclusion of the covariates for
comprehensiveness and to allow for greater statistical power through maximization of the
number of degrees of freedom in the models. Orthorexia, ORTO-P9r, was the predictor variable
in both analyses. Food preference defined by the rank-ordering of the food bars was the criterion
variable in the first analysis. Gender, EAT-26(ln), SHAI(ln), and BISS were included in the
model as covariates. The overall model was not found to be significant, F(5,94) = 1.20, p = .316.
Only gender demonstrated significance in the prediction of food preference such that females
(dummy coded as 1 and males as 0) displayed a greater preference for natural food, t(94) = 2.24,
p = .028, 95% CI [3.20, 53.73]. The unstandardized regression coefficients are presented in
Table 9. The model without the inclusion of the covariates was not significant F(1,98) = 0.04, p
= .842.
Sample consumption defined by the proportion of natural to nonnatural food consumed
was the criterion variable in the second analysis. Gender, EAT-26(ln), SHAI(ln), and BISS were
included in the model as covariates. The overall model was not found to be significant, F(5,94) =
0.19, p = .968. The regression coefficients and 95% confidence intervals are presented in Table
9. The model without the inclusion of the covariates was not significant F(1,98) = 0.02, p = .903.
63
A third criterion variable, total food consumption, operationally defined as the total
amount of food (g), including natural and nonnatural samples, that was consumed during the
taste test was also analyzed. Gender, EAT-26(ln), SHAI(ln), and BISS were included in the
model as covariates. The overall model was found to be significant, F(5,94) = 2.81, p = .021.
Orthorexia predicted total food consumption, and males consumed more food than females. This
model accounts for a minimal degree of variance, however, with an R2 = 0.13. The regression
coefficients and 95% confidence intervals are presented in Table 9. The model remained
significant without the inclusion of the covariates F(1,98) = 3.97, p = .049. This model
accounted for an even smaller degree of variance with an R2 = 0.04.
Hypothesis 2. The second hypothesis stated that threat level would moderate the
relationship between predictor orthorexia, and criterion HRV change. HRV change was
operationally defined in terms of three different comparisons: (a) HRV recording block 4 and 2;
(b) HRV recording block 3 and 1; and (c) HRV composite exposure and baseline. It was
expected that orthorexia would predict greater HRV change in each of these comparisons, when
threat level was high. HRV was operationally defined in three different ways: RMSSD, HF, and,
SD1. The comparisons were facilitated by including the HRV exposure recording (block 4, 3, or
exposure composite) as the criterion variable and including the HRV baseline recording (block 2,
1, or baseline composite) as a covariate.
To examine these predictions, nine moderated regression analyses were performed using
the SPSS PROCESS macro for model 1 (Hayes, 2013). In all analyses, orthorexia was the
predictor and threat level was the moderator. The criterion variables were RMSSD, HF, or SD1
for block 3, 4, or exposure composite. Due to the inclusion of the baseline measure as a covariate
(blocks 1, 2, or baseline composite), significance of the overall model was expected regardless of
64
the predictive power for HRV change by ORTO-P9r and threat level. As such, the test statistics
for the R2 increase due to interaction are presented.
Regarding the comparison of blocks 3 and 1, the R2 increase due to interaction was not
found to be significant in the models predicting RMSSD, p = .444, HF, p = .201, and SD1, p =
.294. The regression coefficients and 95% confidence intervals for the comparison of HRV
recording blocks 3 and 1 are presented in Table 10.
The R2 increase due to interaction were not found to be significant regarding the
comparison of blocks 4 and 2 in the model predicting RMSSD, p = .236, HF, p = .575, and SD1,
p = .236. The regression coefficients and 95% confidence intervals for the comparison of HRV
recording blocks 4 and 2 are presented in Table 11.
Finally, no significant R2 increases due to interaction were obtained regarding the
comparison of exposure and baseline composite scores in the model predicting RMSSD, p =
.377, HF, p = .944, or SD1, p = .438. The regression coefficients and 95% confidence intervals
for the comparison of HRV baseline composite and exposure composite are presented in Table
12.2
Hypothesis 3. The third hypothesis stated that orthorexia would predict cognitive bias.
Specifically, it was expected that orthorexia would predict higher scores on the two successive
components of the IAT. The score on the first IAT component was indicative of an implicit
association between the valence of words and the natural value of food. Recall that the possible
scores on the IAT ranged from -2 to 2 with higher scores indicating an implicitly positive view
of natural foods and lower scores indicating an implicitly positive view of nonnatural foods. A
2 The nine models predicting (a) RMSSD3; (b) HF3; (c) SD13; (d) RMSSD4; (e) HF4: (f) SD14; (g) RMSSDE; (h) HFE; and (i) SD1E were also run with the inclusion of gender, EAT-26(ln), SHAI(ln), and BISS as covariates. The results did not appreciably differ and thus are not reported here.
65
score of 0 indicated no bias with the respect to the natural value of food. An overall bias in
favour of natural food was observed; 99% of respondents obtaining a positive score on this IAT
measure.
The score on the second IAT component was indicative of an implicit association
between the valence of words and the caloric value of foods. Specifically, it was expected that
orthorexia would predict higher scores on the IAT. Recall that the possible scores on the IAT
ranged from -2 to 2 with higher scores indicating an implicitly positive view of low-calorie foods
and lower scores indicating an implicitly positive view of high-calorie foods. A score of 0
indicated no bias with the respect to the caloric value of food. An overall bias in favour of low-
calorie food was observed; 94% of respondents obtaining a positive score on this IAT measure.
Interestingly, a correlation was observed between performance on the IAT pertaining to the
caloric value of food and the BIDR which assessed impression management, r = .213, p = .034.
No significant association was observed between the BIDR and the IAT related to the natural
value of food, r = .162, p = .108.
Two multiple regression analyses were used to examine these predictions. ORTO-P9r
was the predictor variable and IAT score was the criterion variable. Gender, EAT(ln), SHAI(ln),
and BISS were included in the model as covariates. The first model, predicting implicit
associations on the basis of the natural value of food, was not found to be significant, F(5, 94) =
0.79, p = .562. The regression coefficients and 95% confidence intervals are presented in Table
13. This model was not found to be significant without the inclusion of the covariates F(1,98) =
0.18, p =.669.
The second model, predicting implicit associations on the basis of the caloric value of
food was not found to be significant, F(5, 94) = 1.95, p = .093. Only BISS was found to
66
significantly predict implicit association such that those with higher body image satisfaction
demonstrated a stronger positive bias for low-calorie foods, t(94) = 2.62 p = .009, 95% CI [0.02,
0.12]. The regression coefficients and 95% confidence intervals are presented in Table 13. This
model was not found to be significant without the inclusion of the covariates F(1,98) = 1.27, p =
.262.
Hypothesis 4. The fourth hypothesis stated that orthorexia would predict performance on
the shopping task. Specifically, it was expected that orthorexia would predict higher scores on
the shopping task. Orthorexia was operationally defined by the ORTO-P9r variable. The
shopping task was scored based on the proportion of selections that were considered natural
food, with higher scores indicating a natural food preference.
A multiple regression analysis was used to examine this prediction with ORTO-P9r as
the predictor variable and shopping task score as the criterion variable. Gender, EAT(ln),
SHAI(ln), and BISS were included in the model as covariates. The model was found to be
significant, F(5, 94) = 4.23, p = .002. Orthorexia predicted a higher shopping task score,
indicative of a higher number of natural choices made during the shopping task, t(94) = 3.22, p =
.002, 95% CI [1.84, 7.77]. In addition, BISS demonstrated significant predictive ability, t(94) =
2.58, p = .011, 95% CI [2.18, 16.61], such that higher body image satisfaction predicted more
natural choices. The regression coefficients are presented in Table 14. This model was also found
to be significant without the inclusion of the covariates, F(1,98) = 11.63, p =.001.
Summary. Contrary to hypothesis one, orthorexia was not found to be predictive of food
preference defined by either (a) food sample ranking; or (b) food sample consumption. It was
demonstrated, however, that gender is involved in food preference with females indicating a
greater preference for the natural food samples via sample ranking. Additionally, orthorexia
67
demonstrated predictive ability with respect to the total amount of food consumed; those higher
in trait orthorexia consumed more food overall. Males also consumed more total food than
females. Support was not obtained for hypothesis two which is unsurprising given the failure of
the threat manipulation. Both components of hypothesis three were unsupported; orthorexia did
not predict cognitive bias with respect the natural or caloric value of food. Nonetheless, an
overall bias in favour of both natural food and low-calorie food was observed. In addition, the
IAT pertaining to the caloric value of food was found to be correlated with desirable responding
and body image satisfaction. In accordance with hypothesis four, the results indicate evidence for
the predictive ability of orthorexia concerning performance on the shopping task. Interestingly,
performance on the shopping task is also predicted by body image satisfaction.
Exploratory Analyses
Exploratory analyses aimed to further probe the significant relationship between
orthorexia and performance on the shopping task. Specifically, the question of whether the
inclusion of a moderating variable would interact with orthorexia in the prediction of shopping
task performance was addressed. A number of contenders for inclusion in this model were
available including BMI and the food exposure task variables: (a) sample ranking; (b) sample
consumption; (c) total food consumption; (d) IAT (natural value); and (e) IAT (caloric value).
Each of these variables were tested in turn using moderated regression analyses and the SPSS
PROCESS macro for model 1 (Hayes, 2013). Variables gender, EAT-26(ln), SHAI(ln), and BISS
were included in all subsequent analyses as covariates.
BMI is a factor that may be both predictive, and consequential, of food preference. BMI
was correlated with both total food consumption, r = .24, p = .017, and BISS, r = -.32, p = .001.
Higher BMI is associated with a greater volume of food samples consumed and with lower body
68
image satisfaction. BMI was thus investigated in relation to orthorexia and food preference,
operationally defined as performance on the shopping task. A significant and positive skew was
observed for BMI which demonstrated a Zskewness statistic of 5.61. BMI was subjected to the
natural logarithmic transformation producing a Zskewness statistic of 3.55. Although this
transformation did not remedy the skew, it did produce an improved Zskewness statistic and, thus,
was retained for subsequent analysis.
This exploratory analysis investigated whether the regression of shopping task
performance (Y) on ORTO-P9r (X) was moderated by BMI (M). The significant interaction
between BMI and ORTO-P9r is displayed in Table 15. The relationship between orthorexia and
performance on the shopping task is contingent upon BMI. Decomposing the interaction into
simple slopes revealed that individuals with low BMI (- 1 SD) evidenced the strongest
association between ORTO-P9r and natural food preference indicated by the shopping task, b =
7.78, t(92) = 3.92, p < .001, 95% CI [3.84, 11.73]; among those with high BMI (+ 1 SD), the
association did not prove significant, b = 0.42, t(92) = 0.17, p = .866, 95% CI [-4.48, 5.31] (see
Figure 4).
Next, it was tested whether the regression of shopping task performance (Y) on ORTO-
P9r (X) was moderated by sample ranking (M). The significant interaction is revealed in Table
15. The relationship between orthorexia and shopping task performance is moderated by sample
ranking. Probing the interaction showed the conditional effect of ORTO-P9r on shopping task
performance to be significant for those participants whose sample ranking score was average,
t(92) = 3.19, p = .002, 95% CI [1.71, 7.34] and also for those whose score demonstrated a
preference in favour of the natural choices (+ 1 SD), t(92) = 3.55, p < .001, 95% CI [3.14, 11.10].
ORTO-P9r did not significantly predict shopping task performance for those participants whose
69
sample ranking score demonstrated a preference for the nonnatural choices (- 1 SD), t(92) = 1.11,
p = .268, 95% CI [-1.51, 5.37] (see Figure 5).
The potential moderator sample consumption was investigated in relation to the
prediction of shopping task performance (Y) by ORTO-P9r (X). The significant interaction can
be seen in Table 15. Sample consumption was demonstrated to moderate the relationship
between orthorexia and shopping task performance. Analyzing the conditional effect of X and Y
at values of the moderator revealed that ORTO-P9r predicts shopping task performance for those
participants whose sample consumption was average, t(92) = 3.79, p < .001, 95% CI [2.38, 7.63],
or in favour of the natural choices (+ 1 SD), t(92) = 3.87, p < .001, 95% CI [4.12, 12.79], but not
for those whose sample consumption favoured the nonnatural choices (- 1 SD), t(92) = 1.23, p =
.221, 95% CI [-0.95, 4.07] (see Figure 6).
It was then investigated whether the regression of shopping task performance (Y) on
ORTO-P9r (X) was moderated by total food consumption (M). This interaction was not found to
be significant, t(92) = 0.34, p = .738
The moderation of the regression of shopping task performance (Y) on ORTO-P9r (X) by
both IAT measures (M) were each tested in turn. Regarding the IAT – natural value, the
interaction was not significant, t(92) = 0.32, p = .753. The interaction with respect to the IAT –
caloric value also did not achieve significance, t(92) = 0.15, p = .884. The unstandardized
regression coefficients can be seen in Table 15.
Summary of exploratory analyses. The exploratory moderated regression models
revealed that the significant relationship between orthorexia and performance on the shopping
task is moderated by BMI, and food preference variables sample ranking and sample
consumption. Alternatively, total food consumption and cognitive bias related to the natural and
70
caloric value of food were not found to exert a moderating role in the predictive relationship
between orthorexia and shopping task performance.
Discussion
The discussion begins with an examination of the effectiveness of the threat manipulation
that was employed in the present study. Next, a social theory of behavioural intention and
realization is presented that may help to reconcile the obtained findings. The results of each of
the hypotheses are then discussed, followed by an investigation of the results obtained through
exploratory analysis. Potential clinical implications of the knowledge gained from this study are
presented. A commentary of the study’s limitations as well as a number of recommendations for
future research consideration are provided. The discussion concludes with final remarks.
Threat Manipulation
Threat was manipulated with the intention of creating a state of uncertainty only in those
participants randomized to the high threat condition. It was intended that a state of uncertainty
regarding the nature and quantity of what would be eaten during the taste test, would arise. Those
participants randomized to the low threat condition were provided with the information about the
nature and quantity of what they would be asked to taste, prior to the presentation of the food
stimuli. In contrast, those participants randomized to the high threat condition were simply
informed that they would be asked to “taste the samples” in the upcoming taste test, prior to the
presentation of the food stimuli. The ambiguity of the instruction provided to those participants
randomized to the high threat condition was intended to create a state of uncertainty. This state
of uncertainty was hypothesized to be threatening only to those high in orthorexia. SMS
activation was expected to occur in response to this hypothesized perception of threat. It was
expected that the uncertainty regarding the nature and quantity of food to be consumed would be
71
perceived as threatening in this population because only half of the food stimuli to conformed to
the food-related rules presumed to epitomize orthorexia. These three food stimuli, the nonnatural
stimuli, were not organic nor free from genetically modified ingredients. They contained a large
number of ingredients, many of which could be considered as artificial. They were heavily
processed, typical “snack foods” that should—in theory—be avoided by individuals high in
orthorexia. Although an effort was made to select three such food stimuli, the appropriateness of
the selected bars may have impacted on the validity of the threat manipulation. The natural food
stimuli may not have met the standards of some individuals high in orthorexia. There may be
characteristics of greater importance used in the appraisal of food quality by these individuals
that were not attended to in the present study. As such, instructions to the effect of tasting any
number of the samples might not have differed in terms of perceived threat and physiological
arousal.
The STAI, a short affective index administered via self-report, was completed by
participants after the food preference task baseline and again after the food preference task
exposure. This measure was included as a check of the internal validity of the study to assess
whether the threat manipulation had the intended effect. The results of the moderated regression
suggest that the threat manipulation did not, in fact, function as intended. No interaction between
trait orthorexia and threat condition was observed in the prediction of STAI score at exposure,
with STAI score at baseline included as a covariate. Further, no predictive ability was observed
for trait orthorexia alone, nor for threat condition alone, with respect to STAI score.
The failure of the manipulation of threat to induce anxiety or stress in the target group is
a major limitation of the current study and has implications, particularly for hypothesis 2 which
includes threat condition as a moderator. There are a couple of possibilities as to why the threat
72
manipulation did not demonstrate the intended effect. First, the food stimuli for the natural and
nonnatural categories were selected based on a number of qualities that are thought to be
important to individuals high in orthorexia in terms of food selection. Although a concerted
effort was made to be comprehensive with respect to the food qualities taken into consideration,
the possibility of the natural food samples not being considered “healthy” or “natural” by some
participants cannot be discounted. Individuals high in trait orthorexia are unified on the basis of
a diet driven by the pursuit of health that emphasizes the quality of food (Dunn & Bratman,
2016). The idiosyncratic nature of what types of food are considered healthy and what
characteristics are given priority in the assessment of food quality may have affected the validity
of the threat manipulation. The natural food bars utilized were organic, free from artificial
ingredients, and subjected to minimal processing. Notwithstanding, the food samples were in fact
prepackaged bars which may not conform to the dietary rules espoused by some individuals high
in orthorexia.
Another component of orthorexia is the desire to have control over the contents and
preparation of food. Although participants had access to the nutritional information and
ingredients list for each food sample, the lack of personal control over the ingredients may have
affected the validity of the threat manipulation regarding the food stimuli. In addition, these
resources were available to the participants for the limited duration of 30 seconds per food
sample. It is possible that more time with the nutritional information would have been required in
order for those high in trait orthorexia to establish the appropriateness of the food samples to
their diet.
The second possibility as to why the threat manipulation failed to demonstrate the
intended effect is related to the recruitment strategy of the study. The study was advertised as a
73
“clean eating study” that involved a taste test. Individuals displaying extreme particularities
regarding food preference, and for whom the prospect of consuming nonnatural food might be
especially threatening, may have been dissuaded from participation in the laboratory component
of the study. This possibility, however, is unlikely for the following reason. Using the original
ORTO-15, 80% of the laboratory sample fell into the category of “orthorexia” using the original
cutoff score of 40, and 29% fall into this category using the more recently suggested cutoff score
of 35. Considering that reported prevalence estimates range from 6.9% (Donini et al., 2004) to
86% (Valera et al., 2014) using the ORTO-15 and a cutoff score of 40, the present sample seems
to be on the high end of the spectrum regarding orthorexic tendency (See review article by Dunn
& Bratman (2016), for a summary of point prevalence reports).
The failure of the threat manipulation to induce the intended effect undermines the
internal validity of the study. The hypothesized security motivated behaviours were unable to be
investigated as such because of the absence of the physiological data that would indicate
activation of the SMS. Nonetheless, the obtained findings do not provide evidence against the
hypothesized role of the SMS in the maintenance of orthorexia. Alternatively, interesting
findings were obtained. A novel measure of behavioural intention surrounding orthorexic food
preferences was developed which will be discussed (see Hypothesis 4). In addition, despite the
absence of expected findings concerning a number of the stated hypotheses, the results can be
reconciled and understood with reference to social psychological theory of planned behaviour.
Behavioural Intention and Realization
Physiologically speaking, no data was obtained to support the role of the security
motivation system in the maintenance of orthorexia. In terms of the cognitive component,
however, the sample as a whole expressed a relatively more positive implicit attitude toward
74
natural as opposed to nonnatural food (Table 5). This suggests an overwhelmingly favourable
attitude toward natural food on an implicit level. Surprisingly, the strength of this positive
attitude was unrelated to self-reported orthorexic tendency, suggesting the involvement of other
factors that may serve to intercept the progression from attitude to behavioural intention.
The shopping task was a behavioural measure intended to gather information concerning
typical grocery shopping patterns and food preferences. As expected, performance on the
shopping task was predicted by orthorexia such that individuals higher in orthorexia selected
proportionately more natural items relative to their counterparts lower in orthorexia. The
question then remains why implicit attitude does not translate into behaviour with regards to
orthorexic food preference.
Ajzen’s theory of planned behaviour. The shopping task can be conceptualized as a
measure of behavioural intention rather than actual behaviour, because it was in fact a simulation
task designed to provide inferential data regarding actual behavioural tendencies. Behavioural
intention refers to one’s perceived probability of engaging in a certain behaviour (Hensel,
Leshner, Logan, 2013). Behavioural intention can be explained in the context of the theory of
reasoned action, originally posited in 1975 by Fishbein and Ajzen, which stipulates that
behavioural intention is influenced by two factors: attitude toward the behaviour, and subjective
norms regarding the behaviour (Madden, Ellen, & Ajzen, 1992). Attitude toward the behaviour
develops in response to behavioural beliefs regarding the likely consequences of engaging in the
behaviour (Azjen, 2002). Subjective norms develop in response to normative beliefs or one’s
perception of how others regard the behaviour. A favourable attitude toward a behaviour, paired
with the perception that others also regard the behaviour in favourable terms, should increase the
likelihood of the development of behavioural intention by an individual. Behavioural intention is
75
the immediate antecedent to realization of the behaviour (Madden et al., 1992; Figure 7).
With respect to the present study, performance on the IAT is representative of the attitude
of the participant toward the preferential consumption of natural food and avoidance of
nonnatural food. The shopping task is a measure of behavioural intention, regarding these same
orthorexia-related tendencies. Natural food-related norms, as discussed previously (see section
Healthy eating in the general population), tend to dictate that natural foods are perceived as
healthier and more desirable than nonnatural foods which have a tendency to be viewed with
skepticism (Rozin et al., 2004). From this, it can be assumed that subjective norms, for most
people, tend to regard the consumption of natural foods in a favourable way.
The theory of reasoned action stipulates that favourable personal attitudes and favourable
subjective norms would lead to the development of behavioural intention. This model applied to
the present study, which can be visualized in Figure 8, is not supported given the obtained data.
Assuming that subjective norms are favourable toward natural food consumption, the theory of
reasoned action would predict a correlation between performance on the IAT regarding the
natural value of food and performance on the shopping task, which was not observed (see Table
6). Other factors must be involved in this pathway that stipulate the boundary conditions under
which a favourable attitude toward the behaviour, paired with positive subjective norms
regarding the behaviour, is predictive of behavioural intention.
The theory of reasoned action has since been extended to include a fifth variable:
perceived behavioural control. Perceived behavioural control refers to factors that are
subjectively beyond the control of the individual and that may exert effects at the level of
behavioural intention or at the level of behavioural realization (Ajzen, 2002). Perceived
behavioural control develops in response to one’s beliefs regarding the degree of control that is
76
held regarding behavioural outcome or the degree of control that is held in ensuring the
translation of behavioural intention into behavioural realization (Ajzen, 2002). Perceived
behavioural control takes into consideration all the aspects that the individual believes will help
or hinder their behavioural performance. This revised theory, put forth by Ajzen in 1985, can be
visualized in Figure 9.
Ajzen’s theory of planned behaviour adds a moderating component to the model,
stipulating that behaviours and behavioural intentions are also under the influence of factors
beyond the perceived control of the individual. Applied to the present topic (see Figure 10), a
number of factors might affect the perceived control held by the individual regarding adherence
to the eating style characteristic of orthorexia. Financial considerations, for example, may play
an important role. Currently, natural foods are considerably more expensive than analogous food
products that are unable to boast organic certification or other characteristics that are presumably
valued by those high in orthorexia. One may hold a favourable attitude toward natural food as
well as the subjective perception that others hold this view as well, but without the willingness to
expend a considerably greater amount of financial resources to obtain this type of food, these
attitudes and beliefs may not translate into measurable behavioural intention. It is only when all
conditions are met and perceived control is maximized that the behaviour may be realized. The
theory of planned behaviour is applied here to the topics of the present study in an attempt to
reconcile the seemingly contradictory nature of the obtained results.
Hypotheses and Exploratory Analyses
Hypothesis 1. Hypothesis 1 explored the predicted security motivated behaviour of food
preference in relation to orthorexic tendency. Food preference was measured first by instructing
participants to rank order the food stimuli in order of preference and second by covertly
77
measuring the amount (g) of natural and nonnatural food consumed by the participant during the
taste test. The two food preference indices were regressed on predictor variable orthorexia, in an
effort to delineate this relationship. Contrary to what was expected, orthorexia did not predict
food preference according to rank ordering of the food stimuli. The inclusion of covariates
gender, EAT-26(ln), SHAI(ln), and BISS did not render the model significant. Gender, however,
did demonstrate predictive ability within this model regarding food preference such that females
demonstrated a greater tendency to rank the natural food stimuli higher. This gender disparity
may be explained by gender differences in beliefs concerning the importance of healthy eating,
since natural food has a tendency to be perceived as healthy (Bredahl, 1999; Sellin, 2014). The
natural food stimuli utilized in the present study bore characteristics of foods typically perceived
as being “healthy.” Wardle et al. (2004) demonstrated that females, in general, have a stronger
belief in the importance of healthy eating and that this belief accounts for a portion of the
variation in food preferences observed by gender. In addition, it has been shown that women
endorse greater concern regarding the consequences of their eating habits in terms of their health
(Adriaanse, Evers, Verhoeven, & de Ridder, 2015). Taken together, these cognitive factors
paired with the common perception of natural food as “healthy” could account for the natural
food preference demonstrated by females regarding sample ranking.
Contrary to what was expected, orthorexia did not predict food preference according to
volume of the food stimuli consumed during the taste test. The inclusion of covariates gender,
EAT-26(ln), SHAI(ln), and BISS did not render the model significant. Both portions of
hypothesis 1 were dependent upon the food stimuli. As described previously (see section Threat
Manipulation), the food stimuli may not have been perceived as intended by all participants due
to the idiosyncratic nature of what types of food are considered healthy/natural by those high in
78
orthorexia and what characteristics are given priority in the assessment of food quality.
The total volume of food consumed (g) including both natural and nonnatural stimuli was
also calculated. This was undertaken with the intent of uncovering further information from the
taste test, without consideration for the nature of the selected food stimuli. Orthorexia
significantly predicted total volume of food consumed, with and without the inclusion of
covariates gender, EAT-26(ln), SHAI(ln), and BISS, such that those higher in orthorexic
tendency consumed a greater amount of food during the taste test. This finding is surprising
given the restrictive nature of orthorexia and the tendency to avoid nonnatural foods because
three of the food stimuli employed in the taste test could be described as nonnatural.
It has been demonstrated that both psychological and physiological restriction of food can
lead to uncontrolled overeating once the availability, or permissibility, of food is restored
(Polivy, 1996). Among restrained eaters, dietary rule-breaking often precipitates the onset of an
uncontrolled eating event. Studies have shown that restrained eaters behave differently in the
context of food studies where they are asked to taste and rate different high energy foods. When
participants are given a high-energy milkshake “preload” before a taste and rate task, they
typically consume less of the samples than they would otherwise, presumably as a result of their
energy needs having been met by the preload. Restrained eaters, by contrast, consume more of
the samples after being given the preload (Polivy, 1996). This effect is not observed if the
preload does not violate a dietary rule held by the restrained eater (Knight & Boland, 1989).
The observed effect of a greater amount of food consumed by those with greater
orthorexic tendency may be explained in the context of rule-breaking and psychological restraint.
If the natural food stimuli did not conform to the health rules of those high in orthorexia, as
postulated, then food rules would have to be broken by these individuals during the taste test.
79
The participants high in orthorexia may have eaten more during the taste test due to a temporary
relaxing of their food rules in response to a perceived rule violation. These results should be
interpreted with caution, however, due to the miniscule amount of variance in the total volume of
food consumed accounted for by orthorexic tendency; that is, 3.9%.
An additional finding was that males consumed more total food than females during the
taste test. Previous research suggests that some gender differences do exist in terms of the
psychological determinants of food intake. For example, greater restrained and emotional eating
have been observed among females (Adriaanse et al., 2015). It is unclear, however, if these
previous findings, obtained through the completion of self-report measures and the submission of
a food diary, would translate to observable behaviour in a contrived laboratory setting such as the
one employed in the present study. In addition, the present study was unable to recruit a balanced
sample in terms of gender: 77% of the sample was female. As such, this finding may simply be
an artefact of a gender imbalance in the sample and not reflective of any true gender differences.
Hypothesis 2. The second hypothesis stated that threat level would moderate the
relationship between orthorexia and SMS activation, inferred through HRV change.
Unfortunately, this hypothesis could not be empirically tested due to the failure of the selected
stimuli to elicit the intended threat response (see section Threat Manipulation). Based on the
obtained results, there is insufficient evidence to support the stated hypothesis. This can be
attributed, however, to a methodological failure, and does not serve as evidence against the
potential moderating role of food-related threat in the activation of the SMS in those individuals
high in orthorexia.
Hypothesis 3. The third hypothesis stated that orthorexia would predict cognitive bias in
the form of implicit preference for certain types of food. Specifically, it was expected that
80
orthorexia would predict an implicitly more positive attitude toward natural foods in relation to
nonnatural foods as evidenced by IAT performance. This prediction was not supported by the
evidence obtained from this portion of the study.
The IAT is a relative measure of implicit attitudes toward a dichotomous concept (i.e.,
the natural value of food: natural or nonnatural). Although it was hypothesized that the strength
and direction of this attitude could be predicted by orthorexia, no relationship was observed.
Additionally, as can be seen in Table 5, performance on the IAT pertaining to the natural value
of food and performance on the shopping task are uncorrelated. Given the present findings, it
seems that one’s attitude toward a behaviour, in this case the favourable view of the preferential
consumption of natural food, is unrelated to one’s intentions regarding the behaviour, in this case
performance on the shopping task. This finding is supported by previous research which
demonstrated that interest in healthier or more natural foods is not necessarily predictive of
actual food choice (Roininen & Tuorila, 1999). These seemingly contradictory observations can
be reconciled with reference to Ajzen’s theory of planned behaviour. One’s attitude toward a
behaviour, whether the behaviour is regarded as favourable or unfavourable, is only one factor in
the determination of whether an intention to engage in the behaviour will develop (Hansen,
Jensen, & Solgaard, 2004). Further, behavioural intention does not equate realization of the
behaviour. There are multiple components that contribute to the likelihood of a behaviour being
performed. With regards to the present study, the IAT is simply a measure of one single
component, that is, one’s attitude toward natural food. Additionally, there was virtually no
variation in the direction of preference (i.e., natural versus nonnatural) and minimal variation in
the strength of positive attitude toward natural food. Attitude is not the sole determinant of
whether one intends to preferentially approach natural food, nor would this intention equate
81
acting on the intention to preferentially approach natural food.
An overwhelming majority of the individuals who participated in this study demonstrated
a relatively more positive implicit attitude toward natural food compared to nonnatural food.
Recall that possible scores obtained on the IAT ranged from -2 to 2 where an obtained score of -
2 would indicate the strongest positive implicit attitude toward nonnatural food and an obtained
score of 2 would indicate the strongest positive implicit attitude toward natural food. As revealed
in Table 4, the obtained scores on the IAT pertaining to the natural value of food ranged from -
0.02 to 1.51. Only one out of 100 participants obtained a negative score and this score is close is
enough to zero to be considered indicative of no preference in either direction (natural or
nonnatural). This finding is consistent with the literature concerning attitudes toward natural
food which are viewed more favourably and being perceived as healthier than nonnatural foods
(Bredahl, 1999; Frewer et al., 1995; Rozin, 2005; Rozin et al., 2004; Sellin, 2014; Sparks et al.,
1994). Nonetheless, it is surprising that a positive attitude toward natural food would be a
universal phenomenon in a university population, especially given the high palatability of the
nonnatural stimuli used for the IAT.
The magnitude of the IAT score has been used infer strength of implicit attitude.
Absolute values greater than 0.2, 0.5, and 0.8 have been suggested to indicate small, medium,
and large effect sizes of preference (Greenwald et al., 1998). Application of these interpretive
guidelines to the IAT regarding the natural value of food would yield the following percentages:
3% of participants displayed no preference; 7% displayed a small implicit preference for natural
food; 14% displayed a medium implicit preference for natural food; and 76% displayed a large
82
implicit preference for natural food.3 Given the proportion of those participants having obtained
a score indicating a strong preference for natural foods, it is unlikely that the direction of
preference was artificially induced. The magnitude of the preference, however, may have been
inflated.
As such, the Hawthorne effect, defined as an experimentally-induced change in
participant attitude or behaviour unrelated to the experimentally-manipulated variables, cannot
be ruled out. Some aspect of this study leading up the third food exposure task, the IAT, may
have inadvertently induced a bias in favour of natural food which artificially inflated the IAT
score. This effect could also have impacted the high proportion of participants who demonstrated
a preference for low-calorie foods given the tendency for both natural and low-calorie foods to
be associated with health. In fact, impression management was demonstrated to be associated
with performance on the IAT pertaining to the caloric value of food. Participants who
demonstrated greater social desirability in response style on the BIDR also obtained higher
scores on this IAT measure, indicative of a stronger preference for low-calorie food. A few
different factors may have influenced the participants to endorse a more favourable view of
natural and/or low-calorie food. First, the recruitment strategy of the present study may have
played a role. The study was, in fact, advertised as “The Clean Eating Study,” language which is
known in common parlance to connote a biologically pure, unprocessed, and natural style of
eating. With an awareness of the title of the study, participants may have been influenced toward
a preference for natural and low-calorie foods.
3 By contrast, concerning the caloric-value IAT, the same guidelines would yield the
following percentages: 3% of participants displayed a small preference for high-calorie food; 8% displayed no preference; 19% displayed a small preference for low-calorie food; 38% displayed a medium preference for low-calorie food; and 32% displayed a large preference for low-calorie food.
83
Second, the participants were exposed to the food preference task and the taste test prior
to engaging in the IAT. The influence of participation in these tasks which involved exposure to
the natural food stimuli as well as their packaging and nutritional labels, cannot be ruled out as
having a primed the participants in terms of their performance on the IAT. Despite these
potentially confounding factors, the IAT is a measure of implicit preference which, by definition,
is beyond the explicit control of the individual. These factors may have activated some health-
focused cognitions in favour of natural and low-calorie foods but it is unlikely that a conscious
effort to exhibit a preference for these foods would manifest as a positive score on the IAT.
Instead, it is likely that the participants held biases in favour of natural and low-calorie foods,
and these biases were amplified in strength in response to aspects of the study that called out
existing thoughts and beliefs surrounding healthy eating and natural food.
Hypothesis 4. The fourth and final hypothesis stated that orthorexia would predict
performance on the shopping task, a novel behavioural measure of food preference that is
indicative of natural vs. nonnatural food selections purportedly chosen by the participant for
themselves on a typical grocery shopping excursion. More specifically, the shopping task is an
index of behavioural intention, defined as the subjective likelihood of engagement in a specified
behaviour (Hensel et al., 2013). This prediction was supported; orthorexia demonstrated
significant predictive ability regarding a natural food preference on the shopping task.
Conclusions regarding the conceptualization of this behaviourally indicated preference as an
expression of security motivated behaviour cannot be formulated due to the absence of
corroborative HRV data. Nonetheless, the obtained findings provide interesting information
regarding attitudes and behaviours purported to be characteristic of orthorexia that can be
understood with reference to Ajzen’s theory of planned behaviour.
84
The support gained for this hypothesis was expected. This was surprising, however, in the
context of the inability of orthorexia to predict cognitive bias. The obtained findings suggest that
behavioural intention to act in a way that is consistent with the orthorexia presentation, is
predicted by orthorexia. By contrast, one’s attitude toward behaviour consistent with the
presentation of orthorexia, is not predicted by orthorexia. This may seem counterintuitive since
perceptions of a behaviour as favourable or unfavourable generally account for a portion of the
variance in the realization of such behaviour (Hansen et al., 2004). The findings suggest that
additional factors that are beyond the perceived behavioural control of the individual may play a
more prominent role than attitudes in the execution of behaviours in the domain of orthorexia.
Another noteworthy finding was the inability of EAT-26(ln) to predict performance on
the shopping task (see Table 14). Despite the strong correlation between the EAT-26(ln) the
ORTO-P9r (see Table 3), this task is a measure of orthorexia-related food preferences and
disordered eating is not predictive of performance. This result demonstrates the discriminant
validity of the shopping task; it provides support that this task is a behavioural measure of
orthorexia rather than a behavioural measure of disordered eating characteristic anorexia or
bulimia nervosa.
Exploratory analyses. Exploratory analyses were undertaken with the intent of further
probing the significant predictive ability of orthorexia regarding performance on the shopping
task. A number of potential moderators were explored in order to ascertain whether the predictor
variable, ORTO-P9r, interacted with another construct in the prediction of shopping task
performance.
First, BMI was explored as a potential moderator of the significant relationship between
orthorexia and performance on the shopping task. BMI was demonstrated to moderate this
85
relationship such that the greatest predictive ability of orthorexia for shopping task performance
was observed when BMI was low, and no predictive ability was observed when BMI was high.
What is being observed here is a disconnect between behavioural intention and realization of the
intended behaviour among those higher in BMI. With reference to Ajzen’s theory of planned
behaviour, this disconnect can be explained in terms of perceived behavioural control. Beliefs
regarding self-efficacy exert their control at the level of behavioural intention and also at the
level of behaviour. Self-efficacy beliefs, therefore, can either augment or attenuate the
relationship between behavioural intention and realization of that behaviour (Ajzen, 2002).
Ovaskainen et al. (2015) demonstrated that health-related self-efficacy, defined as one’s
perceived ability to control their health-related behaviour, was negatively correlated with BMI.
After controlling for actual health behaviours and eating style, individuals with greater BMI did
not hold the belief that they were in control of the behaviours needed to improve or maintain
their health. In the context of the present study, this weak health-related self-efficacy may be
interfering with the realization of intentions to consistently follow through with a style of eating
that one perceives to be beneficial in terms of health status. These individuals may regard the
preferential consumption of natural food favourably, they may perceive that others share this
view, and they may intend to act in accordance with these beliefs and attitudes, thus obtaining
higher scores on the shopping task. However, it is at the point where behavioural intention
translates to into behaviour when this weak health-related self-efficacy exerts its effect. Without
the strength of the belief one has the capability to control their behaviour and subsequently their
health status, the ability to consistently adhere to the potentially restrictive eating pattern
characteristic of orthorexia is unlikely to be realized. It is important to remember that the
connection between the preferential approach of natural foods and avoidance of nonnatural foods
86
with improved health is subjective. The connections in the pathway according to the theory of
planned behaviour are in accordance with what is subjectively perceived by the individual. An
actual relationship between orthorexia and physical health is not necessary for the connection
between attitudes, subjective norms, behavioural intention, perceived behavioural control and
behaviour to occur.
Next, sample ranking and sample consumption were demonstrated to moderate the
relationship between ORTO-P9r and shopping task performance. In contrast to food preference
measured by the IAT which was implicit, sample ranking was an explicit measure of food
preference. The participants were asked to rank order the six food samples in order of preference.
Higher scores on this task indicated a higher proportion of the natural food samples ranked in the
top three rank positions. The strength of the positive relationship between ORTO-P9r and
shopping task performance was greatest among those participants who demonstrated the greatest
preference for the natural food samples via ranking them in order of preference.
Sample consumption was another index of food preference, inferred on the basis of the
participants’ behaviour in the contrived laboratory setting. This variable was calculated based on
the relative amount of natural and nonnatural food samples consumed by the participants during
the taste test. Higher scores on this task indicated that a greater proportion of overall food (g)
consumed came from the natural food bars. The relationship between ORTO-P9r and shopping
task performance was moderated by sample consumption such that ORTO-P9r demonstrated the
greatest predictive ability regarding shopping task performance among those participants whose
consumption behaviour suggested the greatest preference for the natural food samples.
One possible explanation for the obtained findings involves the idiosyncratic nature of
food preferences among those high in trait orthorexia. Recall that no predictive ability was
87
observed for ORTO-P9r concerning sample ranking or sample consumption. A subgroup of
participants who are high in trait orthorexia but whose dietary preferences were not adequately
represented by the selected food stimuli of the present study may be responsible for the absence
of an association between ORTO-P9r and shopping task performance. Further, the food
characteristics that were of focus during the selection of items employed in the shopping task
may be faulted with a failure to generalize to all individuals high in trait orthorexia. The
characteristics that were thought to be of universal importance among those high in trait
orthorexia included being organic, free from genetically modified organisms, and produced with
limited human intervention. It would appear that some individuals identified as being high in
trait orthorexia through the endorsement of items on the ORTO-15 and ORTO-P9, yet do not
endorse a preference for the food stimuli utilized in the present study. These food stimuli were
selected on the basis of a suspected universal preference by this population. Further research is
required in order to ascertain the range of characteristics that are considered important and that
are taken into consideration in the selection of food with the intent of improved health status.
Clinical Implications
The insights gained from the current study are clinically applicable in a number of ways.
First, this study provides more evidence in support of the theory of planned behaviour. Applied
to the topic of eating behaviour, it is demonstrated that prevalent positive attitudes toward a style
of eating is unrelated to an intention to follow that style of eating. In this study, the style of
eating that was assessed was a preference for natural foods and an avoidance of nonnatural foods
which is not necessarily supported as the style of eating that will optimize health. However, if the
principle observed here is applied to healthy eating in general, the clinical implications become
evident. Currently, a number of chronic health problems in western society including diabetes
88
and heart disease are, at least in part, preventable and manageable with dietary modifications.
Despite the widespread availability of information surrounding eating choices that facilitate
health, this information is not being translated into practice. According to a report by the
National Center for Chronic Disease Prevention and Health Promotion, Division of Nutrition,
Physical Activity and Obesity (2013), 38% of adults in the United states indicated that they
consumed fruit less than once per day, and 23% indicated consuming vegetables less than once
per day. Concerning adolescents, these figures were 36% and 38% for fruits and vegetables,
respectively.
Typical approaches to aid in the prevention and management of health problems tend to
be awareness-focused. Education about healthy eating and its consequences has an undeniably
important role. People need to have the information available to make informed decisions. With
respect to the theory of planned behaviour, education would facilitate the development of
attitudes toward different styles of eating. Information about the benefits of healthy eating may
contribute to a favourable view of this behaviour because these behavioural beliefs develop
based on belief concerning the likely consequences of engaging in the specified behaviour
(Ajzen, 2002). What is known from the theory of planned behaviour, and from the results of the
present study, is that attitudes do not necessarily translate into behavioural intention if this
pathway is intercepted by issues with perceived behavioural control (Ajzen, 2002). The findings
of this study support the idea that barriers to healthy eating (subjective or otherwise) do not lie in
the attitudes of people toward the behaviour, suggesting that this aspect need not be the primary
target of change. Rather, the emphasis should be placed upon targeting the factors that are
perceived to be beyond the control of the individual. The elevated cost of food discussed
previously, is not isolated to natural food products. In the United States, an inverse relationship
89
exists between food cost and energy density, with most energy-dense foods comprising highly
refined ingredients as well as added fats and sugars (Drewnowski & Specter, 2004).
Additionally, associations have been demonstrated between low family income and (a) low fruit
and vegetable consumption; and (b) lower-quality diets, where quality is defined in terms of
adherence to recommendations surrounding daily intake of the food groups (i.e., grains,
vegetables, fruits, milk products, meats; Drewnowksi & Specter, 2004).
Another variable that may attenuate perceived behavioural control and, thus, serve as a
moderator in the relationship between attitude and intention is health-related self-efficacy. As
discussed previously, the perception of one’s ability to manage and exert control over one’s
health status is imperative in determining whether or not the individual takes an active role in the
pursuit of improved health. The finding of the present study concerning the moderating role of
BMI in the pathway between behavioural intention (shopping task) and behavioural realization
(orthorexia), paired with the finding by Ovaskainen et al. (2015) that health-related self-efficacy
is weaker in those of higher BMI, strengthens the argument of these aspects of perceived
behavioural control as points of intervention to foster changes in eating style. Programs and
educational information directed at fostering health-related self-efficacy may aid with the
translation of positive attitudes toward healthy eating to intention and realization of this positive
behaviour.
Another important contribution of the present study is the development of a novel
measure of behavioural intention regarding food preference. Performance on the shopping task
was predicted by orthorexia, supporting this task as a valid measure of this trait. This task may
prove useful for research purposes along the lines of those undertaken in the present study.
Further, this task could be modified to assess behavioural intention with respect to alternate
90
styles of eating. For example, the task could be scored on the basis of high- and low-calorie
items rather than natural and nonnatural items, or on the basis of other food characteristics,
depending on the quality of interest.
Limitations and Future Directions
This study was not without limitations, the most evident being the failure of the food
selected and/or the the instructional set utilized to attempt to elicit the intended experience of
uncertainty and perceived threat. Future research of this nature should involve a pilot study in
order to ascertain a procedure that will be perceived as threatening, specifically to those high in
orthorexia.
With respect to the IAT, an attempt was made to render the distinction between natural
and nonnatural items as clear and obvious as possible, even to those who are less well-versed in
the characteristics important to those high in orthorexia. As such, the majority of the natural
stimuli utilized contained labels and words indicative of their natural status, whereas the
nonnatural stimuli did not. This could have had an effect on the results of the IAT since the
scores are calculated on the basis of reaction time, and since stimuli that require reading may
take a longer time to process and categorize. The likelihood of this having significantly affected
the results is low, however, since 99% of the sample categorized the stimuli that required reading
(i.e., the natural stimuli) more quickly and with fewer errors that the nonnatural stimuli. If
anything, this fact may have attenuated the strong implicit preference for natural food that was
observed.
Future studies should expand upon the present findings through inclusion of the variables
that have been postulated to play a contributory role in the pathway from attitude to realization of
behaviour. This discussion was developed on the basis of the assumption that the subjective
91
norms toward natural food reflected reported societal norms but this aspect was not actually
measured. A brief questionnaire tapping into participants’ thoughts about the attitudes of others
toward natural and nonnatural food would ensure that this assumption was based on measured
fact. Further, studies should directly probe the hypothesized moderator of perceived behavioural
control and attempt to delineate the different aspects that comprise this concept. Participants
could be directly asked what barriers they perceive to be in the way of following an eating style
that they view in a demonstrably positive regard. Alternatively, the hypothesized monetary and
self-efficacy barriers could be tested.
In addition, a greater understanding of the food characteristics that are important in
determining food quality and preference among those high in trait orthorexia is required.
Qualitative research with the aim of ascertaining the variations in orthorexic food preference
would be beneficial to inform research design in the future.
Conclusions
Hypothesis testing and exploratory analyses revealed two main findings. First, orthorexia
demonstrated significant predictive ability surrounding a behavioural intention indicative of a
preference for natural food, demonstrated by performance on the shopping task. The EAT-26(ln),
a measure of disordered eating, did not demonstrate predictive ability, thus providing support for
the validity of this novel task in the assessment of behavioural intention in line with the
preferences characteristics of those high in orthorexia.
Secondly, this relationship appears to be contingent upon BMI. The predictive ability of
orthorexia regarding shopping task performance is greatest for those of low BMI and is not
significant for those high in BMI. Although further research is required to verify the following
speculation, previous research suggests a lower health-related self-efficacy to be associated with
92
greater BMI (Ovaskainen et al., 2015). The theory of planned behaviour suggests that perceived
behaviour control may moderate the relationship between behavioural intention and behavioural
realization. Thus, the absence of association between intention (i.e., shopping task performance)
and realization (i.e., orthorexia) among those high in BMI is quite possibly due to the lesser
degree of perceived behavioural control over health status that has been demonstrated in this
population.
The present study expanded upon the orthorexia literature by contributing a novel task of
behavioural intention with demonstrated concurrent and discriminant validity. This study also
provided support for the theory of planned behaviour in regard to eating behaviour characteristic
of orthorexia. The knowledge gained can be applied to whatever eating style is subjectively
considered to be healthy by the individual or group specified, and supports alternative targets of
intervention for the promotion of healthy eating on a population level. These findings contribute
to our understanding of eating behaviour and the disconnect between attitude, behavioural
intention, and behavioural realization.
93
References
Abramowitz, J. S., Deacon, B. J., & Valentiner, D. P. (2007). The Short Health Anxiety
Inventory: Psychometric properties and construct validity in a non-clinical sample.
Cognitive Therapy and Research, 31(6), 871–883. doi:http://doi.org/10.1007/s10608-
006-9058-1
Adriaanse, M. A., Evers, C., Verhoeven, A. A. C., & de Ridder, D. T. D. (2015). Investigating
sex differences in psychological predictors of snack intake among a large representative
sample. Public Health Nutrition, 19(4), 625-632. doi:10.1017/S136898001500097X.
Ajzen, I. (2002). Perceived behavioral control, self-efficacy, locus of control, and the theory of
planned behavior. Journal of Applied Social Psychology, 33(4), 665-683.
doi:10.1111/j.1559-1816.2002.tb00236.x
Aksoydan, E., & Camci, N. (2009). Prevalence of orthorexia nervosa among Turkish
performance artists. Eating and Weight Disorders-Studies on Anorexia, Bulimia and
Obesity, 14(1), 33–37. doi:10.1007/bf03327792w
Alberts, N. M., Hadjistavropoulos, H. D., Jones, S. L., & Sharpe, D. (2013). The Short Health
Anxiety Inventory: A systematic review and meta-analysis. Journal of Anxiety Disorders,
27(1), 68–78. doi:http://doi.org/10.1016/j.janxdis.2012.10.009
Altman, S. E., & Shankman, S. A. (2009). What is the association between obsessive–
compulsive disorder and eating disorders? Clinical Psychology Review, 29(7), 638–646.
doi:http://doi.org/10.1016/j.cpr.2009.08.001
American Psychiatric Association. (2013). Diagnostic and statistical manual of mental
disorders. (5th ed.). Washington, DC: American Psychiatric Association.
Arusoğlu, G., Kabakci, E., Köksal, G., & Merdol, T. K. (2008). Orthorexia nervosa and adaption
94
of ORTO-11 into Turkish. Turkish Journal of Psychiatry, 19(3), 283–291. Retrieved
from http://www.turkpsikiyatri.com/C19S3/en/en283-291.pdf
Babicz-Zielińska, E., Wądołowska, L., & Tomaszewski, D. (2013). Eating disorders: Problems
of contemporary civilisation – a review. Polish Journal of Food and Nutrition Sciences,
63(3), 133-146. doi:http://doi.org/10.2478/v10222-012-0078-0
Bağcı Bosi, A. T., Çamur, D., & Güler, Ç. (2007). Prevalence of orthorexia nervosa in resident
medical doctors in the faculty of medicine (Ankara, Turkey). Appetite, 49(3), 661–666.
doi:http://doi.org/10.1016/j.appet.2007.04.007
Bland J., & Altman, D. (1997). Statistics notes: Cronbach's alpha. British Medical Journal,
314(7080), 275. doi:10.1136/bmj.314.7080.572
Blechert, J., Meule, A., Busch, N. A., & Ohla, K. (2014). Food-pics: An image database for
experimental research on eating and appetite. Frontiers in Psychology, 5(617), 1-10.
doi:https://doaj.org/article/0db27015edf8457aa35615613b6e431e
Bo, S., Zoccali, R., Ponzo, V., Soldati, L., De Carli, L., Benso, A., … Abbate-Daga, G. (2014).
University courses, eating problems and muscle dysmorphia: Are there any associations?
Journal of Translational Medicine, 12, 1-8. doi:http://doi.org/10.1186/s12967-014-0221-
2
Bratman, S. (1997). Health Food Junkie. Yoga Journal, 42-50. Retrieved from:
http://www.orthorexia.com/original-orthorexia-essay/
Bratman, S., & Knight, D. (2000). Health food junkies: Orthorexia nervosa: Overcoming the
obsession with healthful eating. New York: Broadway.
Bredahl, L. (1999). Consumers cognitions with regard to genetically modified foods: Results of a
qualitative study in four countries. Appetite 33(3), 343-360.
95
doi:http://doi.org/10.1006/appe.1999.0267
Brockmeyer, T., Hahn, C., Reetz, C., Schmidt, U., & Friederich, H.C. (2015). Approach bias
modification in food craving: A proof-of-concept study. European Eating Disorders
Review, 23(5), 352–360. doi:http://doi.org/10.1002/erv.2382
Brytek-Matera, A., Donini, L., Krupa, M., Poggiogalle, E., & Hay, P. (2015). Orthorexia nervosa
and self-attitudinal aspects of body image in female and male university students. Journal
of Eating Disorders, 3(1), 1-8. doi:http://doi.org/10.1186/s40337-015-0038-2
Brytek-Matera, A., Krupa, M., Poggiogalle, E., & Donini, L. M. (2014). Adaptation of the
ORTHO-15 test to Polish women and men. Eating and Weight Disorders - Studies on
Anorexia, Bulimia and Obesity, 19(1), 69–76. doi:http://doi.org/10.1007/s40519-014-
0100-0
Brytek-Matera, A., Rogoza, R., Gramaglia, C., & Zeppegno, P. (2015). Predictors of orthorexic
behaviours in patients with eating disorders: a preliminary study. BMC Psychiatry, 15(1),
1-8. doi:http://doi.org/10.1186/s12888-015-0628-1
Brytek-Matera, A. (2012). Orthorexia nervosa–an eating disorder, obsessive-compulsive disorder
or disturbed eating habit. Archives of Psychiatry and Psychotherapy, 1, 55–60. Retrieved
from
http://www.archivespp.pl/uploads/images/2012_14_1/BrytekMatera55__APP1_2012.pdf
Bundros, J., Clifford, D., Silliman, K., & Neyman Morris, M. (2016). Prevalence of orthorexia
nervosa among college students based on Bratman’s test and associated tendencies.
Appetite, 101, 86–94. doi:http://doi.org/10.1016/j.appet.2016.02.144
Calder, A. J., Beaver, J. D., Davis, M. H., Van Ditzhuijzen, J., Keane, J., & Lawrence, A. D.
(2007). Disgust sensitivity predicts the insula and pallidal response to pictures of
96
disgusting foods: Neural correlates of disgust. European Journal of Neuroscience,
25(11), 3422–3428. doi:http://doi.org/10.1111/j.1460-9568.2007.05604.x
Cash, T. F., Fleming, E. C., Alindogan, J., Steadman, L., & Whitehead, A. (2002). Beyond body
image as a trait: The development and validation of the Body Image States Scale. Eating
Disorders, 10(2), 103–113. doi:10.1080/10640260290081678
Catalina-Zamora, M. L., Bote-Bonaechea, B., García-Sánchez, F., & Ríos-Rial, B. (2005).
Orthorexia nervosa: A new eating behaviour disorder? Actas Espanolas de Psiquiatria,
33(1), 66-68. Retrieved from
https://www.researchgate.net/profile/Berta_Bote/publication/8028963_Orthorexia_nervos
a_A_new_eating_behavior_disorder/links/0deec5318789ba735b000000.pdf
Centers for Disease Control and Prevention. (2013). State Indicator Report on Fruits and
Vegetables, 2013. Atlanta, GA: Centers for Disease Control and Prevention, US Dept. of
Health and Human Services. Retrieved from
https://www.cdc.gov/nutrition/downloads/State-Indicator-Report-Fruits-Vegetables-
2013.pdf
Ciarrochi, J., & Bilich, L. (2006) Acceptance and commitment therapy measures package:
Process measures of potential relevance to ACT. Retrieved from
http://www.mindfulness-extended.nl/content3/wp-content/uploads/2013/07/Measures-
Package.pdf#page=41.
Darwin, C. (1859). On the origin of species: By means of natural selection or the preservation of
favoured races in the struggle for life.
doi:http://dx.doi.org.libproxy.wlu.ca/10.1037/13681-004
Donini, L. M., Marsili, D., Graziani, M. P., Imbriale, M., & Cannella, C. (2004). Orthorexia
97
nervosa: A preliminary study with a proposal for diagnosis and an attempt to measure the
dimension of the phenomenon. Eating and Weight Disorders-Studies on Anorexia,
Bulimia and Obesity, 9(2), 151–157. doi:10.1007/bf03325060
Donini, L. M., Marsili, D., Graziani, M. P., Imbriale, M., & Cannella, C. (2005). Orthorexia
nervosa: Validation of a diagnosis questionnaire. Eating and Weight Disorders-Studies
on Anorexia, Bulimia and Obesity, 10(2), e28–e32. doi:10.1007/bf03327537
Drewnowski, A., & Specter, S. E. (2004). Poverty and obesity: The role of energy density and
energy costs. American Journal of Clinical Nutrition, 79(1), 6-16. Retrieved from
http://ajcn.nutrition.org/content/79/1/6.full.pdf+html
Dunn, T. M., & Bratman, S. (2016). On orthorexia nervosa: A review of the literature and
proposed diagnostic criteria. Eating Behaviors, 21, 11–17.
doi:http://doi.org/10.1016/j.eatbeh.2015.12.006
Ellis, E. M., Kiviniemi, M. T., & Cook-Cottone, C. (2014). Implicit affective associations predict
snack choice for those with low, but not high levels of eating disorder symptomatology.
Appetite, 77, 124–132. doi:http://doi.org/10.1016/j.appet.2014.03.003
Eriksson, L., Baigi, A., Marklund, B., & Lindgren, E. C. (2008). Social physique anxiety and
sociocultural attitudes toward appearance impact on orthorexia test in fitness participants.
Scandinavian Journal of Medicine & Science in Sports, 18(3), 389–394.
doi:http://doi.org/10.1111/j.1600-0838.2007.00723.x
Fidan, T., Ertekin, V., Işikay, S., & Kırpınar, I. (2010). Prevalence of orthorexia among medical
students in Erzurum, Turkey. Comprehensive Psychiatry, 51(1), 49–54.
doi:http://doi.org/10.1016/j.comppsych.2009.03.001
Frewer, L. J., Howard, C., & Shepherd, R. (1995). Genetic engineering and food: What
98
determines consumer acceptance? British Food Journal, 97(8), 31–36.
doi:http://dx.doi.org/10.1108/00070709510100118
Garner, D. M., & Garfinkel, P. E. (1979). The Eating Attitudes Test: An index of the symptoms
of anorexia nervosa. Psychological Medicine, 9(2), 273-279.
doi:http://dx.doi.org/10.1017/S0033291700030762
Garner, D. M., Olmsted, M. P., Bohr, Y., & Garfinkel, P. E. (1982). The Eating Attitudes Test:
Psychometric features and clinical correlates. Psychological Medicine, 12, 871-878.
Retrieved from http://www.eat-26.com/Docs/1982_Garner_EAT-26.pdf
Grabe, H. J., Thiel, A., & Freyberger, H. J. (2000). Symptoms of eating disorders in obsessive-
compulsive disorder. Acta Psychiatrica Scandinavica, 102(6), 449–453.
doi:10.1034/j.1600-0447.2000.102006449.x
Greenwald, A. G., & Banaji, M. R. (1995). Implicit social cognition: Attitudes, self-esteem and
stereotypes. Psychological Review 102(1), 4-27. doi:http://dx.doi.org/10.1037/0033-
295X.102.1.4
Greenwald, A. G., McGhee, D. E., & Schwartz, J. L. (1998). Measuring individual differences in
implicit cognition: The implicit association test. Journal of Personality and Social
Psychology, 74(6), 1464-1480. doi:http://dx.doi.org/10.1037/0022-3514.74.6.1464
Greenwald, A. G., Nosek, B. A., & Banaji, M. R. (2003). Understanding and using the Implicit
Association Test: I. An improved scoring algorithm. Journal of Personality and Social
Psychology, 85(2), 197–216. doi:10.1037/0022-3514.85.2.197
Halmi, K. A., Tozzi, F., Thornton, L. M., Crow, S., Fichter, M. M., Kaplan, A. S., … Bulik, C.
M. (2005). The relation among perfectionism, obsessive-compulsive personality disorder
and obsessive-compulsive disorder in individuals with eating disorders. International
99
Journal of Eating Disorders, 38(4), 371–374. doi:http://doi.org/10.1002/eat.20190
Håman, L., Barker-Ruchti, N., Patriksson, G., & Lindgren, E.-C. (2015). Orthorexia nervosa: An
integrative literature review of a lifestyle syndrome. International Journal of Qualitative
Studies on Health and Well-Being, 10, 1-15. doi:http://doi.org/10.3402/qhw.v10.26799
Hansen, T., Jensen, T. M., & Solgaard, H. S. (2004). Predicting online grocery buying intention:
A comparison of the theory of reasoned action and the theory of planned behaviour.
International Journal of Information Management, 24(6), 539-550.
doi:10.1016/j.ijinfomgt.2004.08.004
Hayes, A. F. (2013). Introduction to mediation, moderation, and conditional process analysis: A
regression-based approach. New York, NY: Guliford Press.
Hayes, A. F. & Rockwood, N. J. (2016). Regression-based statistical mediation and moderation
analysis in clinical research: Observations, recommendations, and implementation.
Behaviour Research and Therapy, doi:http://dx.doi.org/10.1016/j.brat.2016.11.001
Haynes, A., Kemps, E., Moffitt, R., & Mohr, P. (2015). Reduce temptation or resist it?
Experienced temptation mediates the relationship between implicit evaluations of
unhealthy snack foods and subsequent intake. Psychology & Health, 30(5), 534–550.
doi:http://doi.org/10.1080/08870446.2014.984713
Hensel, B. K., Leshner, G., & Logan, R. A. (2013). Behavioural intention. Consumer Health
Informatics Research resource. Retrieved from https://chirr.nlm.nih.gov/behavioral-
intention.php.
Hinds, A. L., Woody, E. Z., Drandic, A., Schmidt, L. A., Van Ameringen, M., Coroneos, M., &
Szechtman, H. (2010). The psychology of potential threat: Properties of the security
motivation system. Biological Psychology, 85(2), 331–337.
100
doi:http://doi.org/10.1016/j.biopsycho.2010.08.003
Hinds, A. L., Woody, E. Z., Schmidt, L. A., Van Ameringen, M., & Szechtman, H. (2015). In the
wake of a possible mistake: Security motivation, checking behavior, and OCD. Journal
of Behavior Therapy and Experimental Psychiatry, 49, 133–140.
doi:http://doi.org/10.1016/j.jbtep.2015.03.016
Hinds, A. L., Woody, E. Z., Van Ameringen, M., Schmidt, L. A., & Szechtman, H. (2012).
When too much is not enough: Obsessive-compulsive disorder as a pathology of
stopping, rather than starting. PLoS ONE, 7(1), e30586.
doi:http://doi.org/10.1371/journal.pone.0030586
Kakoschke, N., Kemps, E., & Tiggemann, M. (2014). Attentional bias modification encourages
healthy eating. Eating Behaviors, 15(1), 120–124.
doi:http://doi.org/10.1016/j.eatbeh.2013.11.001
Kinzl, J. F., Hauer, K., Traweger, C., & Kiefer, I. (2006). Orthorexia nervosa in dieticians.
Psychotherapy and Psychosomatics, 75(6), 395–396.
doi:http://doi.org/10.1159/000095447
Knight, L. J., & Boland, F. J. (1989). Restrained eating: An experimental disentanglement of the
disinhibiting variables of perceived calories and food type. Journal of Abnormal
Psychology, 98(4), 412-420. doi:10.1037//0021-843X.98.4.412
Korinth, A., Schiess, S., & Westenhoefer, J. (2010). Eating behaviour and eating disorders in
students of nutrition sciences. Public Health Nutrition, 13(01), 32-37.
doi:http://doi.org/10.1017/S1368980009005709
Koven, N., & Abry, A. (2015). The clinical basis of orthorexia nervosa: Emerging perspectives.
Neuropsychiatric Disease and Treatment, 11, 385-394.
101
doi:http://doi.org/10.2147/NDT.S61665
Koven, N. S., & Senbonmatsu, R. (2013). A neuropsychological evaluation of orthorexia
nervosa. Open Journal of Psychiatry, 3(2), 214–222.
doi:http://doi.org/10.4236/ojpsych.2013.32019
Kummer, A., Dias, F. M., & Teixeira, A. L. (2008). On the concept of orthorexia nervosa.
Scandinavian Journal of Medicine & Science in Sports, 18(3), 395–396.
doi:http://doi.org/10.1111/j.1600-0838.2008.00809.x
Li, A., & Bagger, J. (2007). The Balanced Inventory of Desirable Responding (BIDR): A
reliability generalization study. Educational and Psychological Measurement, 67(3), 525-
544. doi:10.1177/0013164406292087
Liénard, P., & Boyer, P. (2006). Whence collective rituals? A cultural selection model of
ritualized behavior. American Anthropologist, 108(4), 814–827.
doi:10.1525/aa.2006.108.4.814
Madden, T. J., Ellen, P. S., & Ajzen, I. (1992). A comparison of the theory of planned behaviour
and the theory of reasoned action. Personality and Social Psychology Bulletin, 18(1), 3-9.
doi:10.1177/0146167292181001
McKinley, J. C., & Hathaway, S. R. (1942). A multiphasic personality schedule (Minnesota): IV.
Psychasthenia. Journal of Applied Psychology, 26(5), 614-624.
doi:http://dx.doi.org.libproxy.wlu.ca/10.1037/h0063530
Missbach, B., Hinterbuchinger, B., Dreiseitl, V., Zellhofer, S., Kurz, C., & König, J. (2015).
When eating right is measured wrong: A validation and critical examination of the
ORTO-15 questionnaire in German. PloS One, 10(8), 1-15.
doi:10.1371/journal.pone.01357
102
Moroze, R. M., Dunn, T. M., Holland, J. C., Yager, J., & Weintraub, P. (2015). Microthinking
about micronutrients: A case of transition from obsessions about healthy eating to near-
fatal “orthorexia nervosa” and proposed diagnostic criteria. Psychosomatics, 56(4), 397–
403. doi:10.1016/j.psym.2014.03.003
Musolino, C., Warin, M., Wade, T., & Gilchrist, P. (2015). “Healthy anorexia”: The complexity
of care in disordered eating. Social Science & Medicine, 139, 18–25.
doi:http://doi.org/10.1016/j.socscimed.2015.06.030
Neuberg, S. L., Kenrick, D. T., & Schaller, M. (2011). Human threat management systems: Self-
protection and disease avoidance. Neuroscience & Biobehavioral Reviews, 35(4), 1042–
1051. doi:http://doi.org/10.1016/j.neubiorev.2010.08.011
Olatunji, B. O., Etzel, E. N., Tomarken, A. J., Ciesielski, B. G., & Deacon, B. (2011). The effects
of safety behaviors on health anxiety: An experimental investigation. Behaviour
Research and Therapy, 49(11), 719–728. doi:http://doi.org/10.1016/j.brat.2011.07.008
Ovaskainen, M., Tapanainen, H., Laatikainen, T., Männistö, S., Heinonen, H., & Vartiaine, E.
(2015). Perceived health-related self-efficacy associated with BMI in adults in a
population-based survey. Scandinavian Journal of Public Health, 43, 197-203.
doi:10.1177/1403494814566263
Park, S. W., Kim, J. Y., Go, G. J., Jeon, E. S., Pyo, H. J., & Kwon, Y. J. (2011). Orthorexia
nervosa with hyponatremia, subcutaneous Emphysema, pneumomediastimum,
pneumothorax, and pancytopenia. Electrolytes & Blood Pressure, 9(1), 32-37.
doi:http://doi.org/10.5049/EBP.2011.9.1.32
Paulhus, D. L. (1988). Assessing self deception and impression management in self-reports: the
Balanced Inventory of Desirable Responding. Retrieved from http://www.mindfulness-
103
extended.nl/content3/wp-content/uploads/2013/07/Measures-Package.pdf#page=41.
Pigott, T. A., Altemus, M., Rubenstein, C. S., Hill, J. L., Bihari, K., L’Heureux, F., . . . Murphy,
D. L. (1991). Symptoms of eating disorders in patients with obsessive-compulsive
disorder. The American Journal of Psychiatry, 148(11), 1552-1557.
doi:http://dx.doi.org/10.1176/ajp.148.11.1552
Piskorski, J., & Guzik, P. (2007). Geometry of the Poincaré plot of RR intervals and its
asymmetry in healthy adults. Physiological Measurement, 28(3), 287-300.
doi:10.1088/0967-3334/28/3/005
Prestwich, A., Hurling, R., & Baker, S. (2011). Implicit shopping: Attitudinal determinants of the
purchasing of healthy and unhealthy foods. Psychology & Health, 26(7), 875–885.
doi:http://doi.org/10.1080/08870446.2010.509797
Polivy, J. (1996). Psychological consequences of food restriction. Journal of the American
Dietetic Association, 96(6), 589-592. doi:10.1016/S0002-8223(96)00161-7
Porges, A. W. (1995). Orienting in a defensive world: Mammalian modifications of our
evolutionary heritage: A polyvagal theory. Psychophysiology, 32(4), 301-318.
doi:10.1111/j.1469-8986.1995.tb01213.x
Porges, S. W. (2001). The polyvagal theory: Phylogenetic substrates of a social nervous system.
International Journal of Psychophysiology, 42(2), 123–146. doi:10.1016/S0167-
8760(01)00162-3
Porges, S. W., & Byrne, E. A. (1992). Research methods for measurement of heart rate and
respiration. Biological Psychology, 34(2–3), 93–130. doi:10.1016/0301-0511(92)90012-J
Ramacciotti, C. E., Perrone, P., Coli, E., Burgalassi, A., Conversano, C., Massimetti, G., &
Dell’Osso, L. (2011). Orthorexia nervosa in the general population: A preliminary
104
screening using a self-administered questionnaire (ORTO-15). Eating and Weight
Disorders-Studies on Anorexia, Bulimia and Obesity, 16(2), e127–e130.
doi:10.1007/BF03325318
Rangel, C., Dukeshire, S., & MacDonald, L. (2012). Diet and anxiety: An exploration into the
Orthorexic Society. Appetite, 58(1), 124–132. http://doi.org/10.1016/j.appet.2011.08.024
Richetin, J., Perugini, M., Prestwich, A., & O’Gorman, R. (2007). The IAT as a predictor of food
choice: The case of fruits versus snacks. International Journal of Psychology, 42(3),
166–173. doi:http://doi.org/10.1080/00207590601067078
Roininen, K., & Tuorila, H. (1999). Health and taste attitudes in the prediction of use frequency
and choice between less healthy and more healthy snacks. Food Quality and Preference,
10(4), 357–365. doi:10.1016/S0950-3293(98)00057-3
Rozin, P., Ashmore, M., & Markwith, M. (1996). Lay American conceptions of nutrition: Dose
insensitivity, categorical thinking, contagion, and the monotonic mind. Health
Psychology, 15(6), 438-447. doi:http://dx.doi.org/10.1037/0278-6133.15.6.438
Rozin, P. (2005). The meaning of “natural” process more important than content. Psychological
Science, 16(8), 652–658. doi:10.1111/j.1467-9280.2005.01589.x
Rozin, P., Spranca, M., Krieger, Z., Neuhaus, R., Surillo, D., Swerdlin, A., & Wood, K. (2004).
Preference for natural: Instrumental and ideational/moral motivations, and the contrast
between foods and medicines. Appetite, 43(2), 147–154.
doi:http://doi.org/10.1016/j.appet.2004.03.005
Rudiger, J. A., Cash, T. F., Roehrig, M., & Thompson, J. K. (2007). Day-to-day body-image
states: Prospective predictors of intra-individual level and variability. Body Image, 4(1),
1–9. doi:http://doi.org/10.1016/j.bodyim.2006.11.004
105
Saddichha, S., Babu, G. N., & Chandra, P. (2012). Orthorexia nervosa presenting as prodrome of
schizophrenia. Schizophrenia Research, 134(1), 110. doi:10.1016/j.schres.2011.10.017
Salkovskis, P. M., Rimes, K. A., Warwick, H. M. C., & Clark, D. M. (2002). The Health Anxiety
Inventory: Development and validation of scales for the measurement of health anxiety
and hypochondriasis. Psychological Medicine, 32(5), 843–853.
doi:http://dx.doi.org/10.1017/S0033291702005822
Segura-García, C., Papaianni, M. C., Caglioti, F., Procopio, L., Nisticò, C. G., Bombardiere, L.,
… Capranica, L. (2012). Orthorexia nervosa: A frequent eating disordered behavior in
athletes. Eating and Weight Disorders-Studies on Anorexia, Bulimia and Obesity, 17(4),
e226–e233. doi:10.3275/8272
Sellin, J. (2014). Dietary dilemmas, delusions, and decisions. Clinical Gastroenterology and
Hepatology, 12(10), 1601–1604. doi:http://doi.org/10.1016/j.cgh.2013.09.015
Sparks, P., Shepherd, R., & Frewer, L. J. (1994). Gene technology, food production, and public
opinion: A UK study. Agriculture and Human Values, 11(1), 19–28.
doi:10.1007/BF01534445
Speranza, M., Corcos, M., Godart, N., Loas, G., Guilbaud, O., Jeammet, P., & Flament, M.
(2001). Obsessive compulsive disorders in eating disorders. Eating Behaviours, 2(3),
193-207. doi:10.1016/S1471-0153(01)00035-6
Stochel, M., Janas - Kozik, M., Zejda, J., Hyrnik, J., Jelonek, I., & Siwiec, A. (2015). Validation
of ORTO-15 questionnaire in the group of urban youth aged 15-21. Psychiatria Polska,
49(1), 119–134. doi:http://doi.org/10.12740/PP/25962
Szechtman, H., & Woody, E. (2004). Obsessive-compulsive disorder as a disturbance of security
motivation. Psychological Review, 111(1), 111–127. doi:http://doi.org/10.1037/0033-
106
295X.111.1.111
Tarvainen, M. P. (2014). Kubios HRV version 2.2: User’s guide. The Mathworks Inc.: Biosignal
Analysis and Medical Imaging Group.
Valera, J. H., Ruiz, P. A., Valdespino, B. R., & Visioli, F. (2014). Prevalence of orthorexia
nervosa among ashtanga yoga practitioners: A pilot study. Eating and Weight Disorders -
Studies on Anorexia, Bulimia and Obesity, 19(4), 469–472.
doi:http://doi.org/10.1007/s40519-014-0131-6
Vandereycken, W. (2011). Media hype, diagnostic fad or genuine disorder? Professionals’
opinions about night eating syndrome, orthorexia, muscle dysmorphia, and emetophobia.
Eating Disorders, 19(2), 145–155. doi:http://doi.org/10.1080/10640266.2011.551634
Varga, M., Dukay-Szabó, S., Túry, F., & van Furth, E. F. (2013). Evidence and gaps in the
literature on orthorexia nervosa. Eating and Weight Disorders - Studies on Anorexia,
Bulimia and Obesity, 18(2), 103–111. doi:http://doi.org/10.1007/s40519-013-0026-y
Varga, M., Thege, B. K., Dukay-Szabó, S., Túry, F., & van Furth, E. F. (2014). When eating
healthy is not healthy: Orthorexia nervosa and its measurement with the ORTO-15 in
Hungary. BMC Psychiatry, 14(1), 1-11. doi:10.1186/1471-244X-14-5
Wardle, J., Haase, A. M., Steptoe, A., Nillapun, M., Jonwutiwes, K., Bellisie, F. (2004). Gender
differences in food choice: The contribution of health beliefs and dieting. Annals of
Behavioural Medicine, 27(2), 107-116. doi:10.1207/s15324796abm2702_5
Werle, C. O. C., Trendel, O., & Ardito, G. (2013). Unhealthy food is not tastier for everybody:
The “healthy=tasty” French intuition. Food Quality and Preference, 28(1), 116–121.
doi:http://doi.org/10.1016/j.foodqual.2012.07.007
Woody, E. Z., Lewis, V., Snider, L., Grant, H., Kamath, M., & Szechtman, H. (2005). Induction
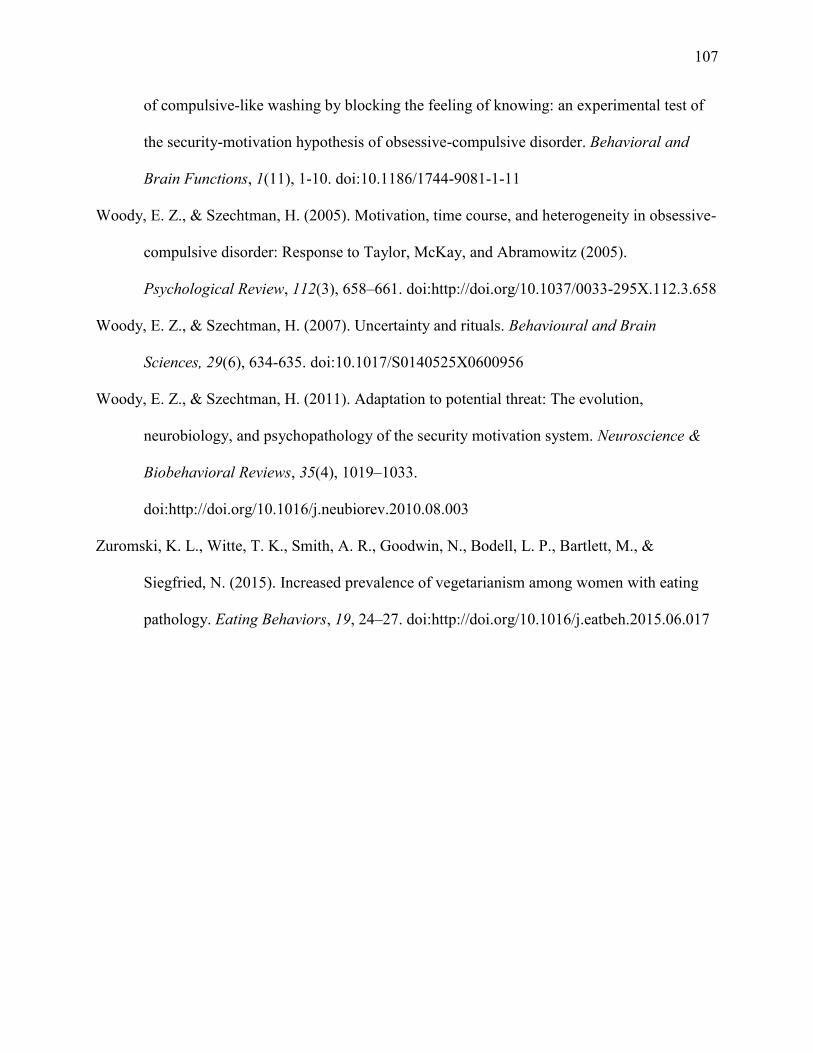
107
of compulsive-like washing by blocking the feeling of knowing: an experimental test of
the security-motivation hypothesis of obsessive-compulsive disorder. Behavioral and
Brain Functions, 1(11), 1-10. doi:10.1186/1744-9081-1-11
Woody, E. Z., & Szechtman, H. (2005). Motivation, time course, and heterogeneity in obsessive-
compulsive disorder: Response to Taylor, McKay, and Abramowitz (2005).
Psychological Review, 112(3), 658–661. doi:http://doi.org/10.1037/0033-295X.112.3.658
Woody, E. Z., & Szechtman, H. (2007). Uncertainty and rituals. Behavioural and Brain
Sciences, 29(6), 634-635. doi:10.1017/S0140525X0600956
Woody, E. Z., & Szechtman, H. (2011). Adaptation to potential threat: The evolution,
neurobiology, and psychopathology of the security motivation system. Neuroscience &
Biobehavioral Reviews, 35(4), 1019–1033.
doi:http://doi.org/10.1016/j.neubiorev.2010.08.003
Zuromski, K. L., Witte, T. K., Smith, A. R., Goodwin, N., Bodell, L. P., Bartlett, M., &
Siegfried, N. (2015). Increased prevalence of vegetarianism among women with eating
pathology. Eating Behaviors, 19, 24–27. doi:http://doi.org/10.1016/j.eatbeh.2015.06.017
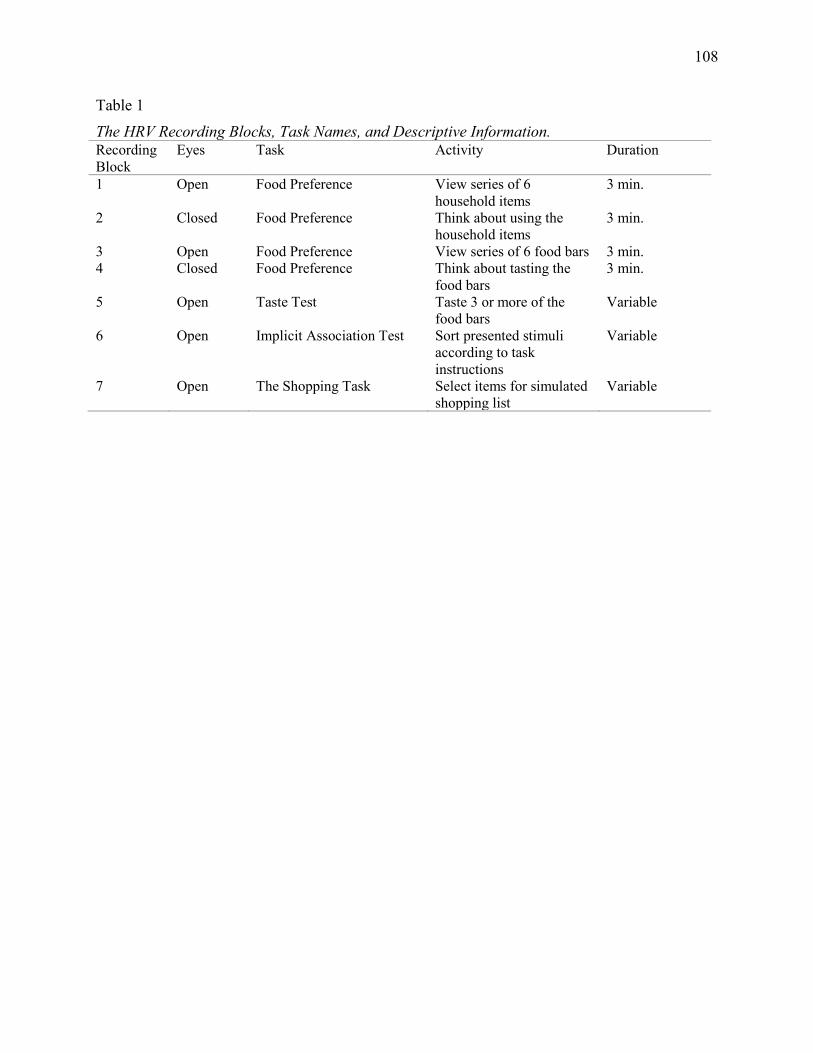
108
Table 1 The HRV Recording Blocks, Task Names, and Descriptive Information. Recording Block
Eyes Task Activity Duration
1 Open Food Preference View series of 6 household items
3 min.
2 Closed Food Preference Think about using the household items
3 min.
3 Open Food Preference View series of 6 food bars 3 min. 4 Closed Food Preference Think about tasting the
food bars 3 min.
5 Open Taste Test Taste 3 or more of the food bars
Variable
6 Open Implicit Association Test Sort presented stimuli according to task instructions
Variable
7 Open The Shopping Task Select items for simulated shopping list
Variable
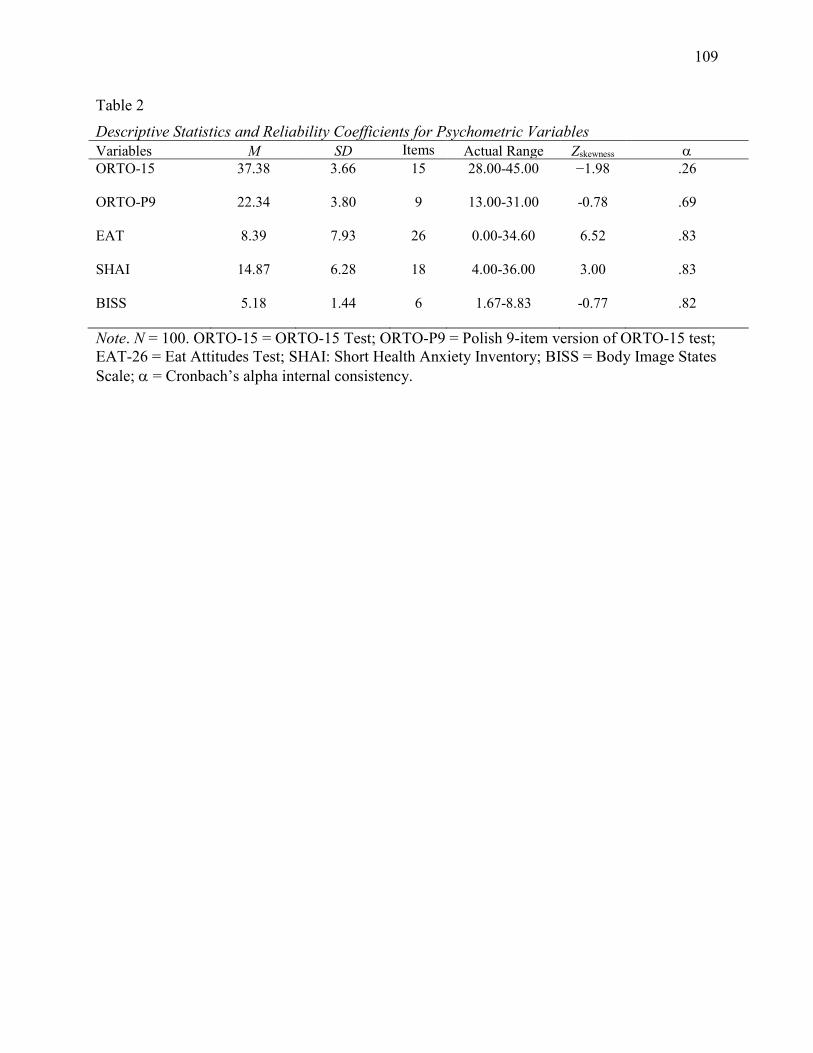
109
Table 2 Descriptive Statistics and Reliability Coefficients for Psychometric Variables Variables M SD Items Actual Range Zskewness ORTO-15 37.38 3.66 15 28.00-45.00 −1.98 .26
ORTO-P9 22.34 3.80 9 13.00-31.00 -0.78 .69
EAT 8.39 7.93 26 0.00-34.60 6.52 .83
SHAI 14.87 6.28 18 4.00-36.00 3.00 .83
BISS 5.18 1.44 6 1.67-8.83 -0.77 .82
Note. N = 100. ORTO-15 = ORTO-15 Test; ORTO-P9 = Polish 9-item version of ORTO-15 test; EAT-26 = Eat Attitudes Test; SHAI: Short Health Anxiety Inventory; BISS = Body Image States Scale; = Cronbach’s alpha internal consistency.
110
Table 3 Intercorrelations Among Psychometric Variables Variables ORTO-15r ORTO-P9r EAT-26(ln) SHAI(ln) BISS ORTO-15r ─ .802** .351** .116 -.082
ORTO-P9r
EAT-26(ln)
SHAI(ln)
BISS
─
.538**
─
.281**
.433**
─
-.218*
-.277**
-.382**
─
Note. N = 100. ORTO-15r = ORTO-15 Test (reciprocal); ORTO-P9r = Polish 9-item version of ORTO-15 Test (reciprocal); EAT-26(ln) = Eating Attitudes Test (logarithmic transformation); SHAI(ln) = Short Health Anxiety Inventory (logarithmic transformation); BISS = Body Image States Scale. **p < .01
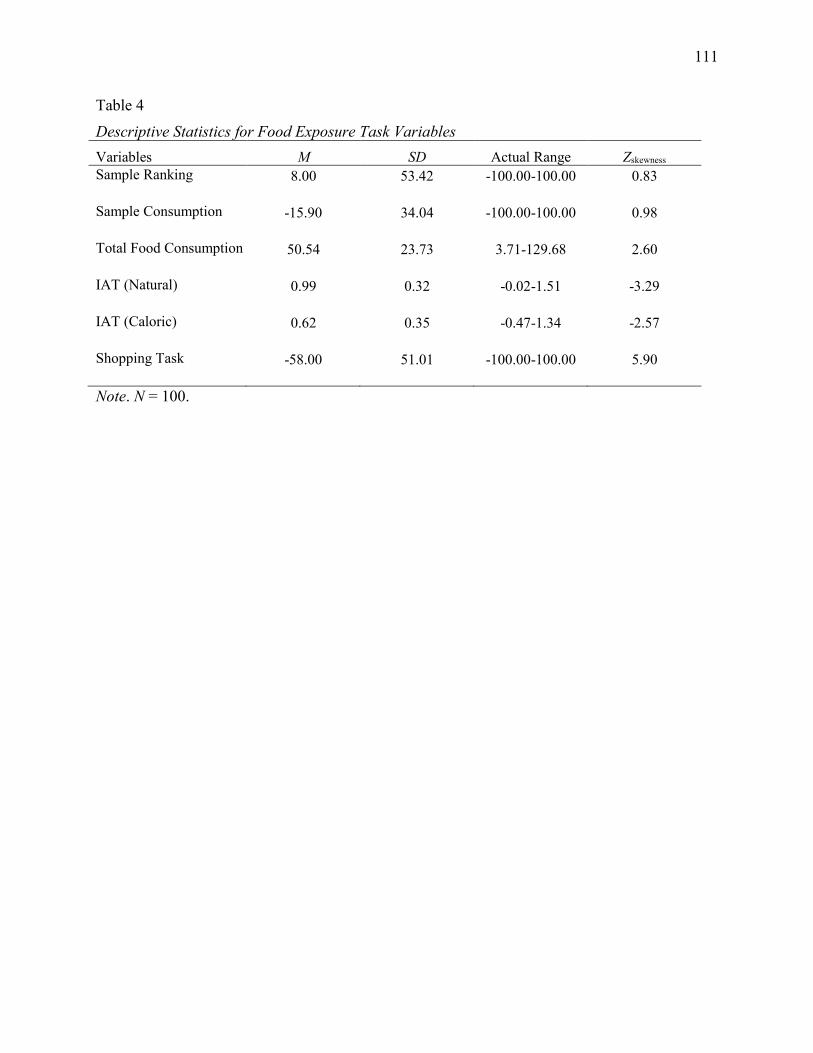
111
Table 4 Descriptive Statistics for Food Exposure Task Variables Variables M SD Actual Range Zskewness Sample Ranking 8.00 53.42 -100.00-100.00 0.83
Sample Consumption -15.90 34.04 -100.00-100.00 0.98
Total Food Consumption 50.54 23.73 3.71-129.68 2.60
IAT (Natural) 0.99 0.32 -0.02-1.51 -3.29
IAT (Caloric) 0.62 0.35 -0.47-1.34 -2.57
Shopping Task -58.00 51.01 -100.00-100.00 5.90
Note. N = 100.
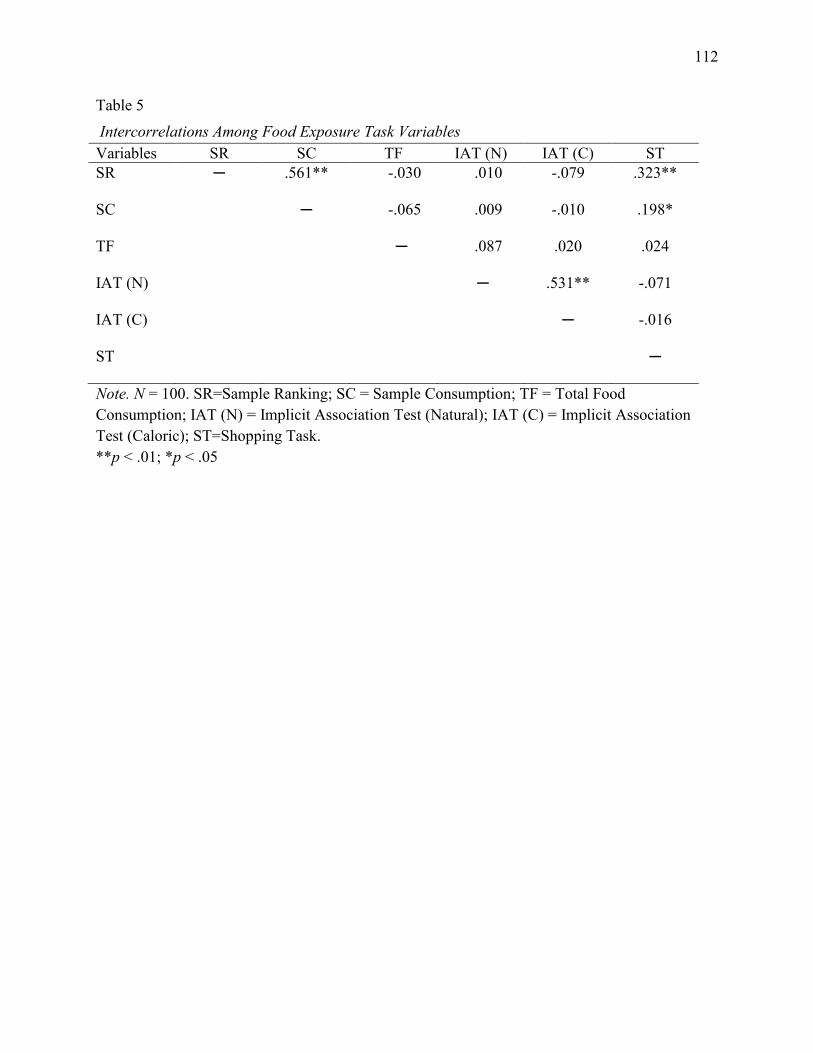
112
Table 5 Intercorrelations Among Food Exposure Task Variables Variables SR SC TF IAT (N) IAT (C) ST SR ─ .561** -.030 .010 -.079 .323**
SC ─ -.065 .009 -.010 .198*
TF
IAT (N)
IAT (C)
ST
─
.087
─
.020
.531**
─
.024
-.071
-.016
─
Note. N = 100. SR=Sample Ranking; SC = Sample Consumption; TF = Total Food Consumption; IAT (N) = Implicit Association Test (Natural); IAT (C) = Implicit Association Test (Caloric); ST=Shopping Task. **p < .01; *p < .05
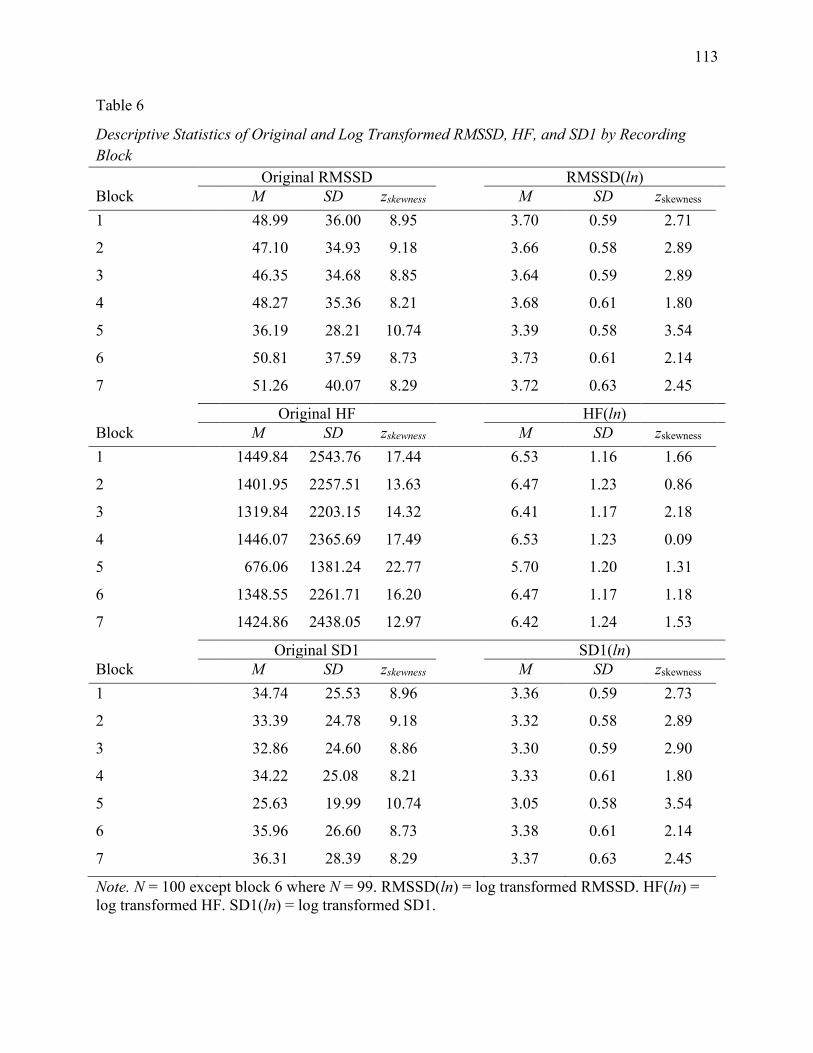
113
Table 6
Descriptive Statistics of Original and Log Transformed RMSSD, HF, and SD1 by Recording Block Original RMSSD RMSSD(ln) Block M SD zskewness M SD zskewness 1 48.99 36.00 8.95 3.70 0.59 2.71
2 47.10 34.93 9.18 3.66 0.58 2.89
3 46.35 34.68 8.85 3.64 0.59 2.89
4 48.27 35.36 8.21 3.68 0.61 1.80
5 36.19 28.21 10.74 3.39 0.58 3.54
6 50.81 37.59 8.73 3.73 0.61 2.14
7 51.26 40.07 8.29 3.72 0.63 2.45
Original HF HF(ln) Block M SD zskewness M SD zskewness 1 1449.84 2543.76 17.44 6.53 1.16 1.66
2 1401.95 2257.51 13.63 6.47 1.23 0.86
3 1319.84 2203.15 14.32 6.41 1.17 2.18
4 1446.07 2365.69 17.49 6.53 1.23 0.09
5 676.06 1381.24 22.77 5.70 1.20 1.31
6 1348.55 2261.71 16.20 6.47 1.17 1.18
7 1424.86 2438.05 12.97 6.42 1.24 1.53
Original SD1 SD1(ln) Block M SD zskewness M SD zskewness 1 34.74 25.53 8.96 3.36 0.59 2.73
2 33.39 24.78 9.18 3.32 0.58 2.89
3 32.86 24.60 8.86 3.30 0.59 2.90
4 34.22 25.08 8.21 3.33 0.61 1.80
5 25.63 19.99 10.74 3.05 0.58 3.54
6 35.96 26.60 8.73 3.38 0.61 2.14
7 36.31 28.39 8.29 3.37 0.63 2.45
Note. N = 100 except block 6 where N = 99. RMSSD(ln) = log transformed RMSSD. HF(ln) = log transformed HF. SD1(ln) = log transformed SD1.
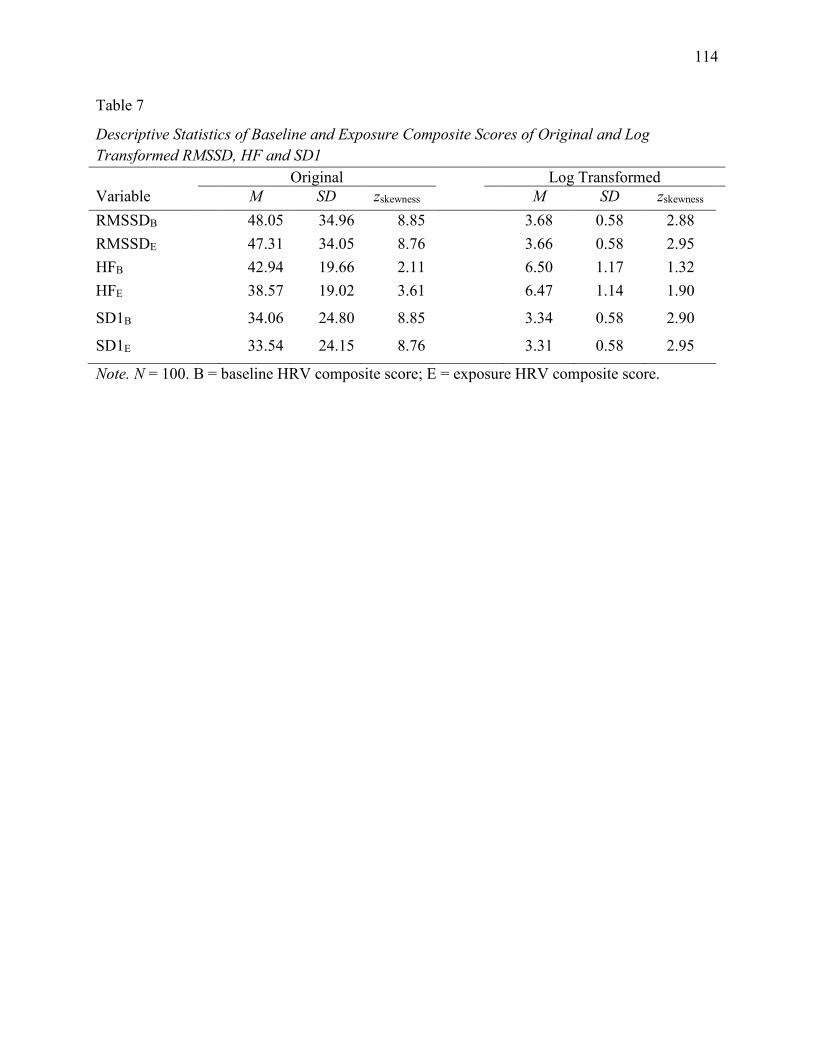
114
Table 7
Descriptive Statistics of Baseline and Exposure Composite Scores of Original and Log Transformed RMSSD, HF and SD1 Original Log Transformed Variable M SD zskewness M SD zskewness RMSSDB 48.05 34.96 8.85 3.68 0.58 2.88 RMSSDE 47.31 34.05 8.76 3.66 0.58 2.95 HFB 42.94 19.66 2.11 6.50 1.17 1.32 HFE 38.57 19.02 3.61 6.47 1.14 1.90
SD1B 34.06 24.80 8.85 3.34 0.58 2.90
SD1E 33.54 24.15 8.76 3.31 0.58 2.95
Note. N = 100. B = baseline HRV composite score; E = exposure HRV composite score.
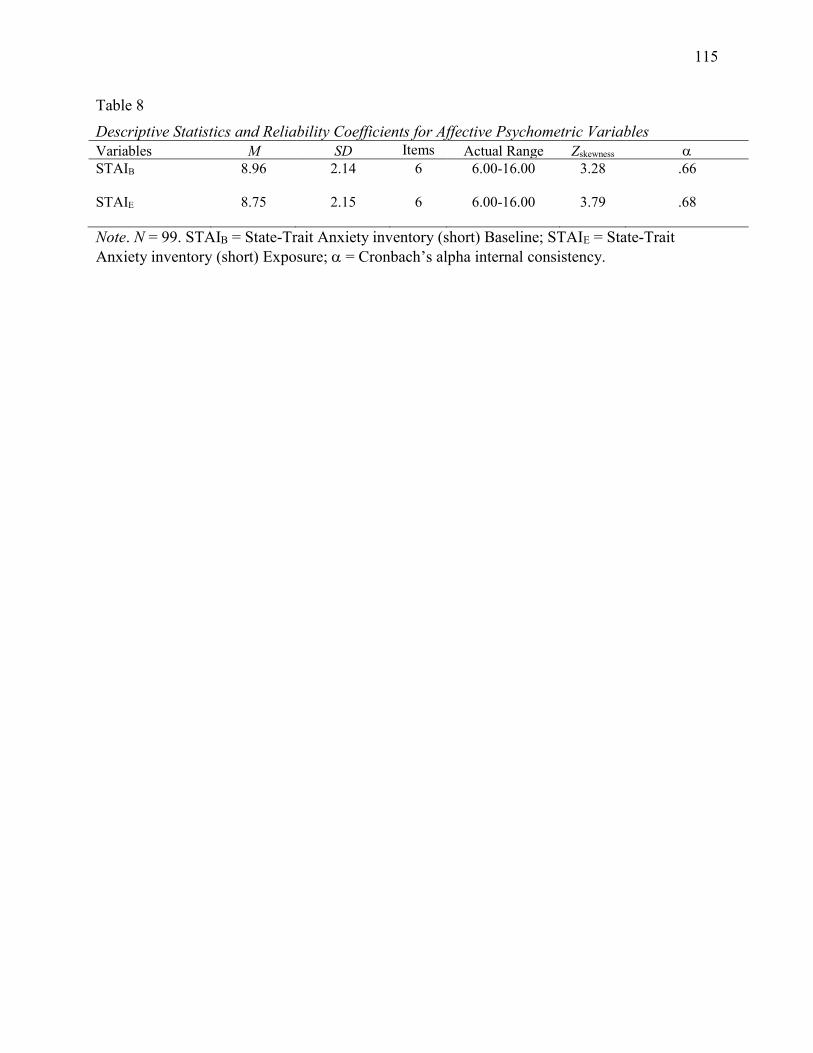
115
Table 8 Descriptive Statistics and Reliability Coefficients for Affective Psychometric Variables Variables M SD Items Actual Range Zskewness STAIB 8.96 2.14 6 6.00-16.00 3.28 .66
STAIE 8.75 2.15 6 6.00-16.00 3.79 .68
Note. N = 99. STAIB = State-Trait Anxiety inventory (short) Baseline; STAIE = State-Trait Anxiety inventory (short) Exposure; = Cronbach’s alpha internal consistency.
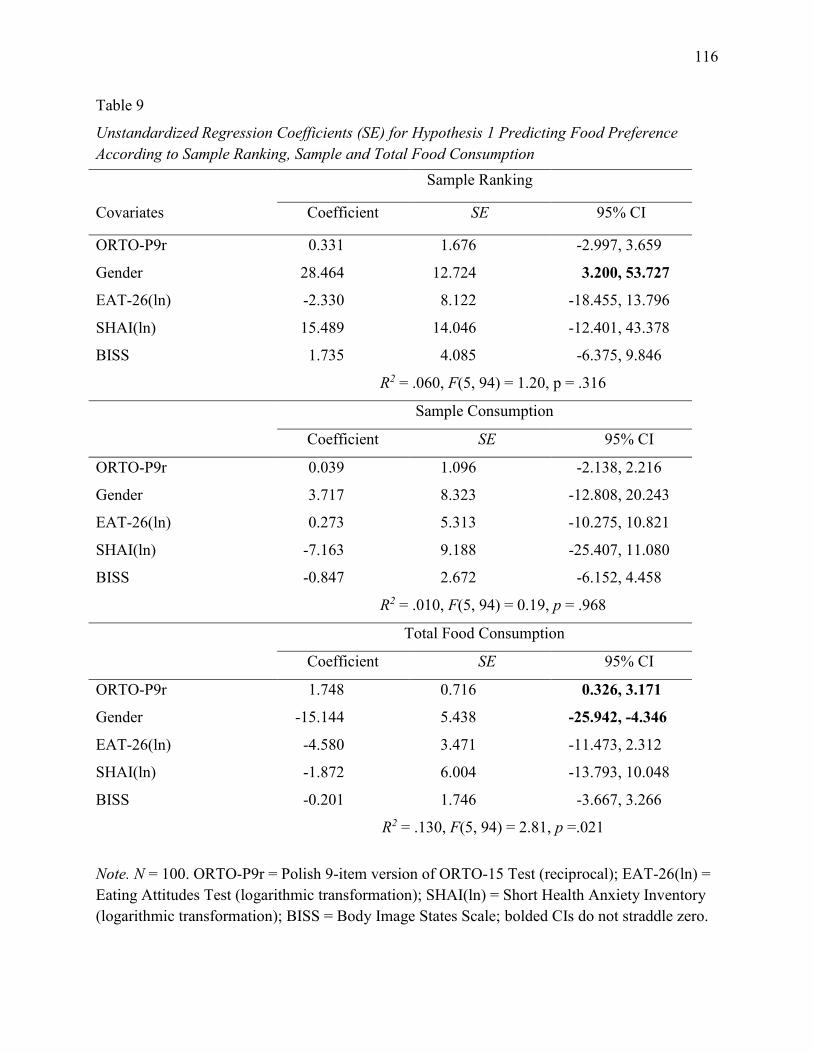
116
Table 9
Unstandardized Regression Coefficients (SE) for Hypothesis 1 Predicting Food Preference According to Sample Ranking, Sample and Total Food Consumption
Note. N = 100. ORTO-P9r = Polish 9-item version of ORTO-15 Test (reciprocal); EAT-26(ln) = Eating Attitudes Test (logarithmic transformation); SHAI(ln) = Short Health Anxiety Inventory (logarithmic transformation); BISS = Body Image States Scale; bolded CIs do not straddle zero.
Sample Ranking
Covariates Coefficient SE 95% CI
ORTO-P9r 0.331 1.676 -2.997, 3.659
Gender 28.464 12.724 3.200, 53.727
EAT-26(ln) -2.330 8.122 -18.455, 13.796
SHAI(ln) 15.489 14.046 -12.401, 43.378
BISS 1.735 4.085 -6.375, 9.846
R2 = .060, F(5, 94) = 1.20, p = .316
Sample Consumption
Coefficient SE 95% CI
ORTO-P9r 0.039 1.096 -2.138, 2.216
Gender 3.717 8.323 -12.808, 20.243
EAT-26(ln) 0.273 5.313 -10.275, 10.821
SHAI(ln) -7.163 9.188 -25.407, 11.080
BISS -0.847 2.672 -6.152, 4.458
R2 = .010, F(5, 94) = 0.19, p = .968
Total Food Consumption
Coefficient SE 95% CI
ORTO-P9r 1.748 0.716 0.326, 3.171
Gender -15.144 5.438 -25.942, -4.346
EAT-26(ln) -4.580 3.471 -11.473, 2.312
SHAI(ln) -1.872 6.004 -13.793, 10.048
BISS -0.201 1.746 -3.667, 3.266
R2 = .130, F(5, 94) = 2.81, p =.021
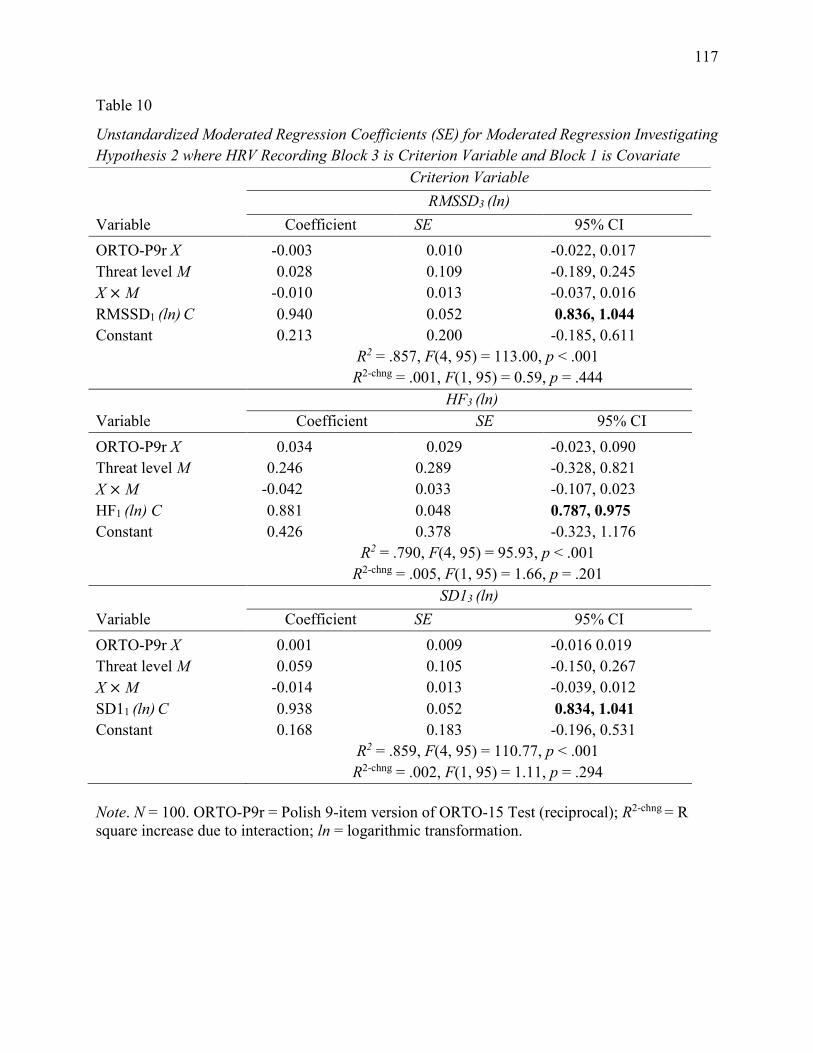
117
Table 10
Unstandardized Moderated Regression Coefficients (SE) for Moderated Regression Investigating Hypothesis 2 where HRV Recording Block 3 is Criterion Variable and Block 1 is Covariate
Note. N = 100. ORTO-P9r = Polish 9-item version of ORTO-15 Test (reciprocal); R2-chng = R square increase due to interaction; ln = logarithmic transformation.
Criterion Variable RMSSD3 (ln) Variable Coefficient SE 95% CI ORTO-P9r X -0.003 0.010 -0.022, 0.017 Threat level M 0.028 0.109 -0.189, 0.245 X × M -0.010 0.013 -0.037, 0.016 RMSSD1 (ln) C 0.940 0.052 0.836, 1.044 Constant 0.213 0.200 -0.185, 0.611 R2 = .857, F(4, 95) = 113.00, p < .001
R2-chng = .001, F(1, 95) = 0.59, p = .444
HF3 (ln) Variable Coefficient SE 95% CI ORTO-P9r X 0.034 0.029 -0.023, 0.090 Threat level M 0.246 0.289 -0.328, 0.821 X × M -0.042 0.033 -0.107, 0.023 HF1 (ln) C 0.881 0.048 0.787, 0.975 Constant 0.426 0.378 -0.323, 1.176 R2 = .790, F(4, 95) = 95.93, p < .001
R2-chng = .005, F(1, 95) = 1.66, p = .201
SD13 (ln) Variable Coefficient SE 95% CI ORTO-P9r X 0.001 0.009 -0.016 0.019 Threat level M 0.059 0.105 -0.150, 0.267 X × M -0.014 0.013 -0.039, 0.012 SD11 (ln) C 0.938 0.052 0.834, 1.041 Constant 0.168 0.183 -0.196, 0.531 R2 = .859, F(4, 95) = 110.77, p < .001
R2-chng = .002, F(1, 95) = 1.11, p = .294
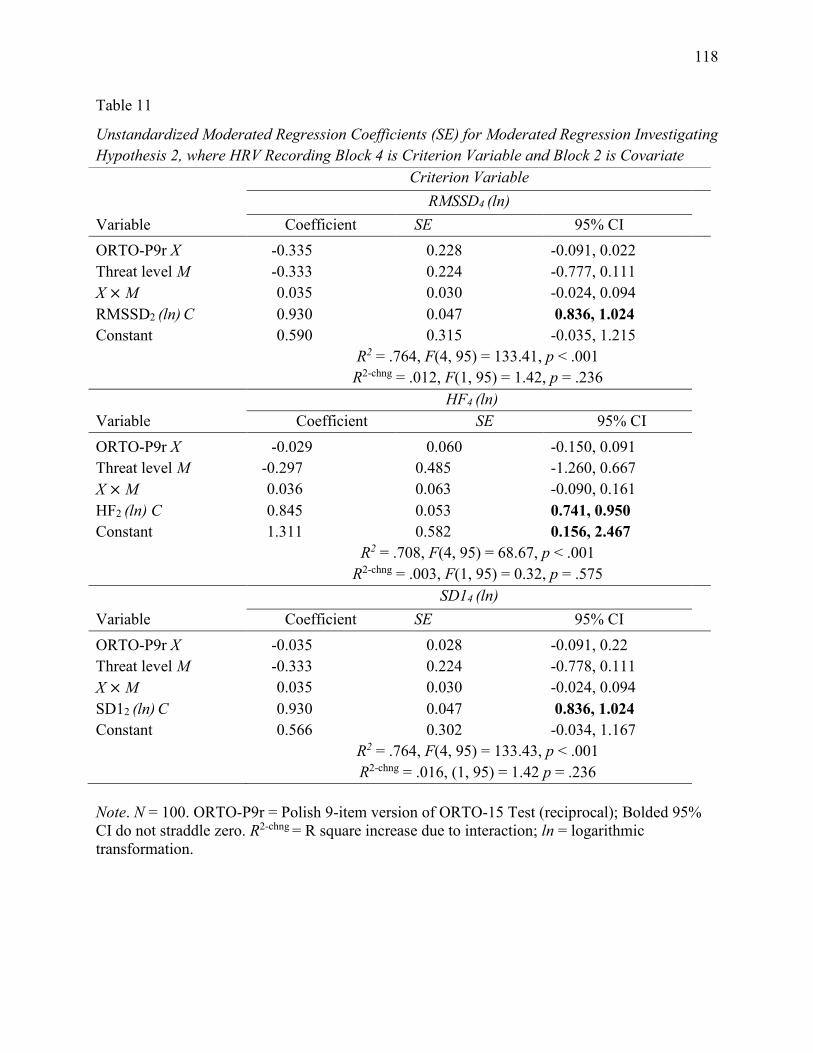
118
Table 11
Unstandardized Moderated Regression Coefficients (SE) for Moderated Regression Investigating Hypothesis 2, where HRV Recording Block 4 is Criterion Variable and Block 2 is Covariate
Note. N = 100. ORTO-P9r = Polish 9-item version of ORTO-15 Test (reciprocal); Bolded 95% CI do not straddle zero. R2-chng = R square increase due to interaction; ln = logarithmic transformation.
Criterion Variable RMSSD4 (ln) Variable Coefficient SE 95% CI ORTO-P9r X -0.335 0.228 -0.091, 0.022 Threat level M -0.333 0.224 -0.777, 0.111 X × M 0.035 0.030 -0.024, 0.094 RMSSD2 (ln) C 0.930 0.047 0.836, 1.024 Constant 0.590 0.315 -0.035, 1.215 R2 = .764, F(4, 95) = 133.41, p < .001
R2-chng = .012, F(1, 95) = 1.42, p = .236
HF4 (ln) Variable Coefficient SE 95% CI ORTO-P9r X -0.029 0.060 -0.150, 0.091 Threat level M -0.297 0.485 -1.260, 0.667 X × M 0.036 0.063 -0.090, 0.161 HF2 (ln) C 0.845 0.053 0.741, 0.950 Constant 1.311 0.582 0.156, 2.467 R2 = .708, F(4, 95) = 68.67, p < .001
R2-chng = .003, F(1, 95) = 0.32, p = .575
SD14 (ln) Variable Coefficient SE 95% CI ORTO-P9r X -0.035 0.028 -0.091, 0.22 Threat level M -0.333 0.224 -0.778, 0.111 X × M 0.035 0.030 -0.024, 0.094 SD12 (ln) C 0.930 0.047 0.836, 1.024 Constant 0.566 0.302 -0.034, 1.167 R2 = .764, F(4, 95) = 133.43, p < .001
R2-chng = .016, (1, 95) = 1.42 p = .236
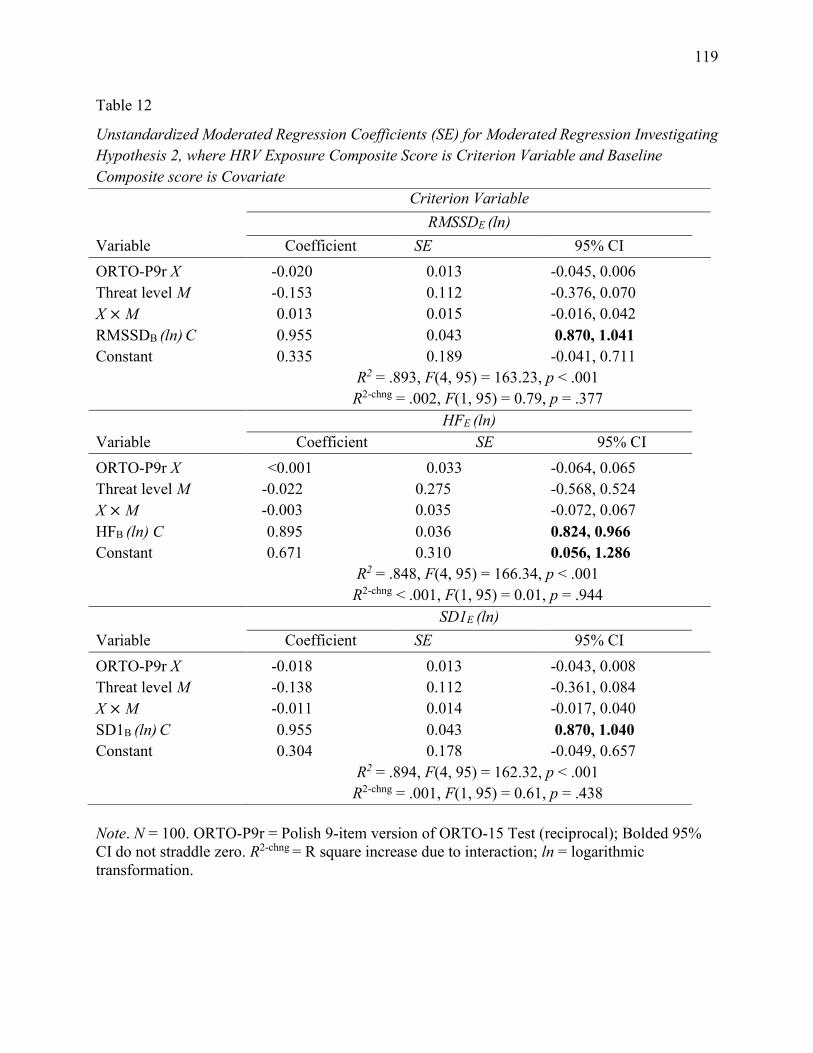
119
Table 12
Unstandardized Moderated Regression Coefficients (SE) for Moderated Regression Investigating Hypothesis 2, where HRV Exposure Composite Score is Criterion Variable and Baseline Composite score is Covariate
Note. N = 100. ORTO-P9r = Polish 9-item version of ORTO-15 Test (reciprocal); Bolded 95% CI do not straddle zero. R2-chng = R square increase due to interaction; ln = logarithmic transformation.
Criterion Variable RMSSDE (ln) Variable Coefficient SE 95% CI ORTO-P9r X -0.020 0.013 -0.045, 0.006 Threat level M -0.153 0.112 -0.376, 0.070 X × M 0.013 0.015 -0.016, 0.042 RMSSDB (ln) C 0.955 0.043 0.870, 1.041 Constant 0.335 0.189 -0.041, 0.711 R2 = .893, F(4, 95) = 163.23, p < .001
R2-chng = .002, F(1, 95) = 0.79, p = .377
HFE (ln) Variable Coefficient SE 95% CI ORTO-P9r X <0.001 0.033 -0.064, 0.065 Threat level M -0.022 0.275 -0.568, 0.524 X × M -0.003 0.035 -0.072, 0.067 HFB (ln) C 0.895 0.036 0.824, 0.966 Constant 0.671 0.310 0.056, 1.286 R2 = .848, F(4, 95) = 166.34, p < .001
R2-chng < .001, F(1, 95) = 0.01, p = .944
SD1E (ln) Variable Coefficient SE 95% CI ORTO-P9r X -0.018 0.013 -0.043, 0.008 Threat level M -0.138 0.112 -0.361, 0.084 X × M -0.011 0.014 -0.017, 0.040 SD1B (ln) C 0.955 0.043 0.870, 1.040 Constant 0.304 0.178 -0.049, 0.657 R2 = .894, F(4, 95) = 162.32, p < .001
R2-chng = .001, F(1, 95) = 0.61, p = .438
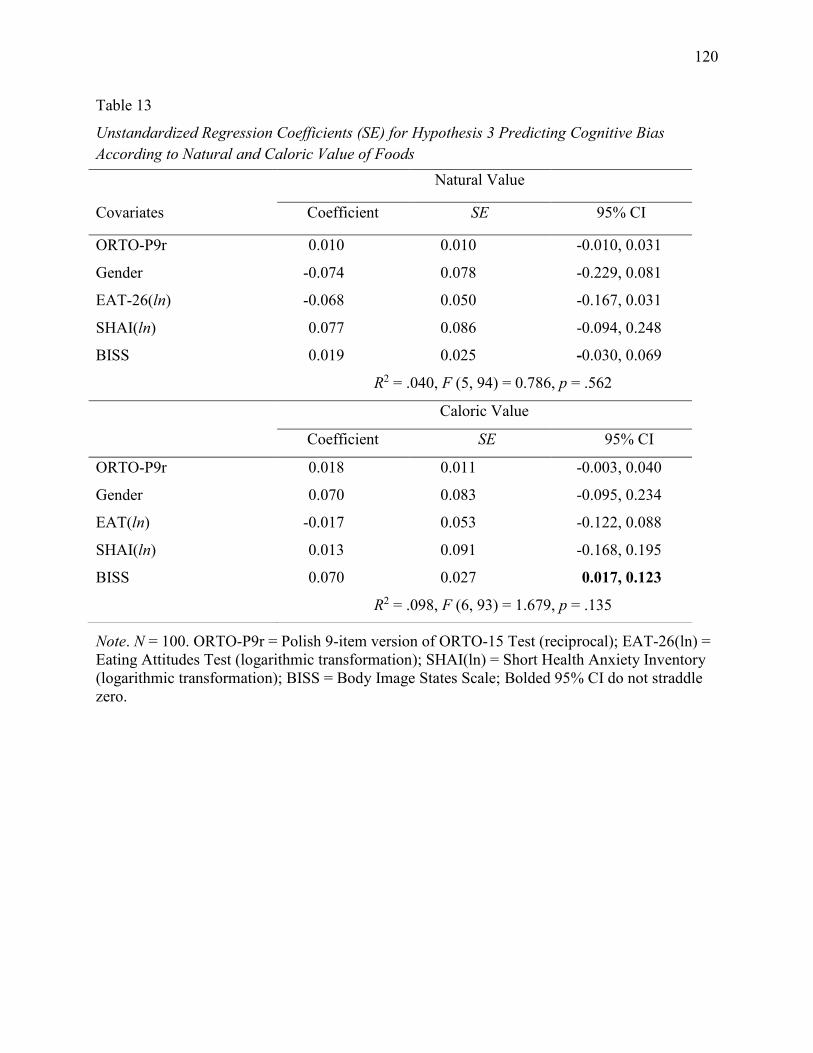
120
Table 13
Unstandardized Regression Coefficients (SE) for Hypothesis 3 Predicting Cognitive Bias According to Natural and Caloric Value of Foods
Note. N = 100. ORTO-P9r = Polish 9-item version of ORTO-15 Test (reciprocal); EAT-26(ln) = Eating Attitudes Test (logarithmic transformation); SHAI(ln) = Short Health Anxiety Inventory (logarithmic transformation); BISS = Body Image States Scale; Bolded 95% CI do not straddle zero.
Natural Value
Covariates Coefficient SE 95% CI
ORTO-P9r 0.010 0.010 -0.010, 0.031
Gender -0.074 0.078 -0.229, 0.081
EAT-26(ln) -0.068 0.050 -0.167, 0.031
SHAI(ln) 0.077 0.086 -0.094, 0.248
BISS 0.019 0.025 -0.030, 0.069
R2 = .040, F (5, 94) = 0.786, p = .562
Caloric Value
Coefficient SE 95% CI
ORTO-P9r 0.018 0.011 -0.003, 0.040
Gender 0.070 0.083 -0.095, 0.234
EAT(ln) -0.017 0.053 -0.122, 0.088
SHAI(ln) 0.013 0.091 -0.168, 0.195
BISS 0.070 0.027 0.017, 0.123
R2 = .098, F (6, 93) = 1.679, p = .135
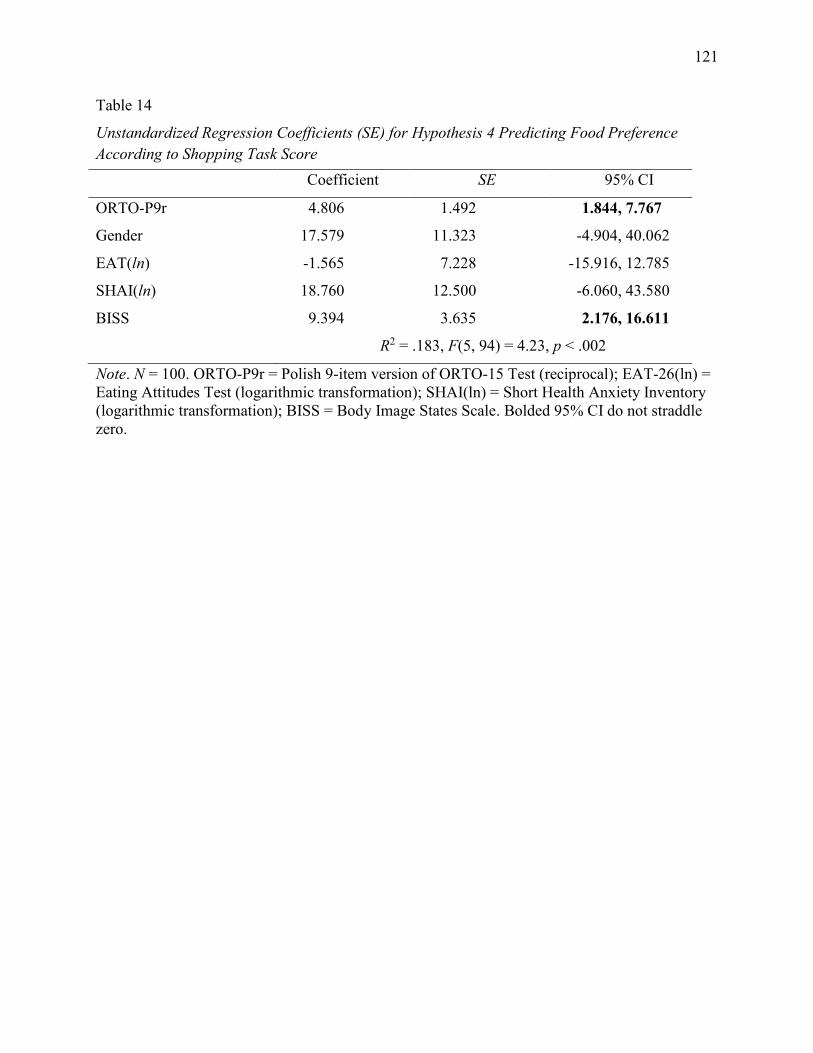
121
Table 14
Unstandardized Regression Coefficients (SE) for Hypothesis 4 Predicting Food Preference According to Shopping Task Score
Note. N = 100. ORTO-P9r = Polish 9-item version of ORTO-15 Test (reciprocal); EAT-26(ln) = Eating Attitudes Test (logarithmic transformation); SHAI(ln) = Short Health Anxiety Inventory (logarithmic transformation); BISS = Body Image States Scale. Bolded 95% CI do not straddle zero.
Coefficient SE 95% CI
ORTO-P9r 4.806 1.492 1.844, 7.767
Gender 17.579 11.323 -4.904, 40.062
EAT(ln) -1.565 7.228 -15.916, 12.785
SHAI(ln) 18.760 12.500 -6.060, 43.580
BISS 9.394 3.635 2.176, 16.611
R2 = .183, F(5, 94) = 4.23, p < .002
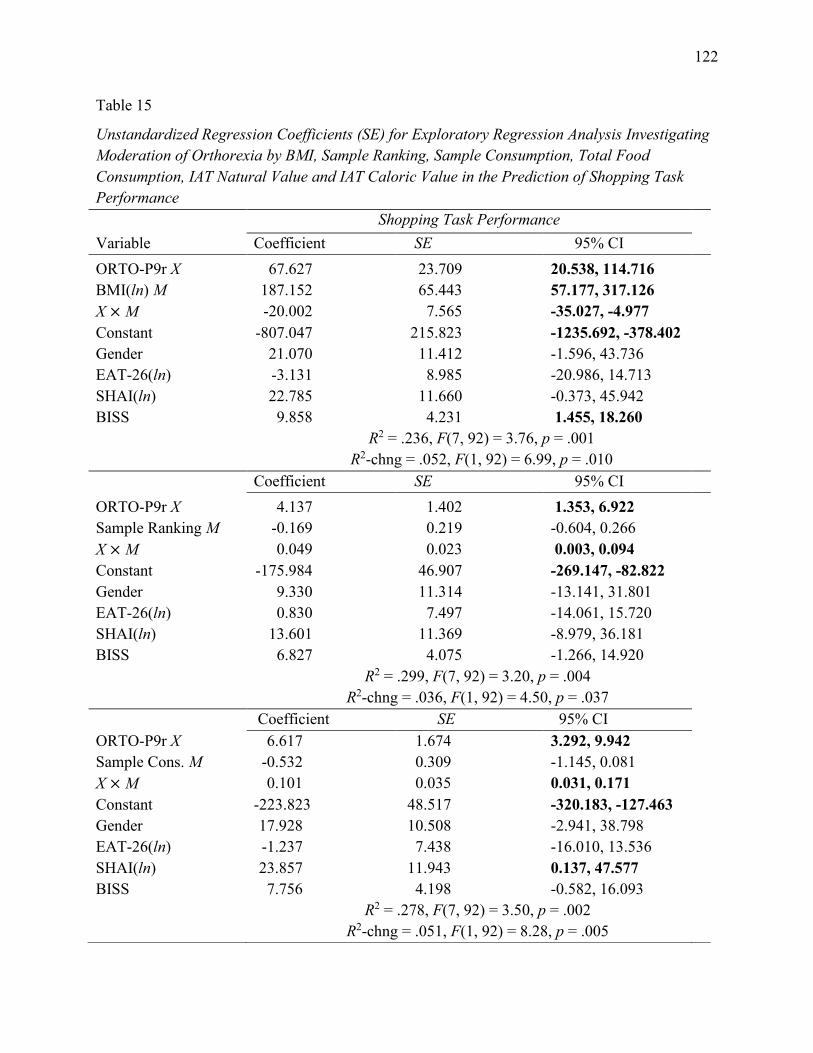
122
Table 15
Unstandardized Regression Coefficients (SE) for Exploratory Regression Analysis Investigating Moderation of Orthorexia by BMI, Sample Ranking, Sample Consumption, Total Food Consumption, IAT Natural Value and IAT Caloric Value in the Prediction of Shopping Task Performance Shopping Task Performance Variable Coefficient SE 95% CI ORTO-P9r X 67.627 23.709 20.538, 114.716 BMI(ln) M 187.152 65.443 57.177, 317.126 X × M -20.002 7.565 -35.027, -4.977 Constant -807.047 215.823 -1235.692, -378.402 Gender 21.070 11.412 -1.596, 43.736 EAT-26(ln) -3.131 8.985 -20.986, 14.713 SHAI(ln) 22.785 11.660 -0.373, 45.942 BISS 9.858 4.231 1.455, 18.260 R2 = .236, F(7, 92) = 3.76, p = .001 R2-chng = .052, F(1, 92) = 6.99, p = .010 Coefficient SE 95% CI ORTO-P9r X 4.137 1.402 1.353, 6.922 Sample Ranking M -0.169 0.219 -0.604, 0.266 X × M 0.049 0.023 0.003, 0.094 Constant -175.984 46.907 -269.147, -82.822 Gender 9.330 11.314 -13.141, 31.801 EAT-26(ln) 0.830 7.497 -14.061, 15.720 SHAI(ln) 13.601 11.369 -8.979, 36.181 BISS 6.827 4.075 -1.266, 14.920 R2 = .299, F(7, 92) = 3.20, p = .004 R2-chng = .036, F(1, 92) = 4.50, p = .037 Coefficient SE 95% CI ORTO-P9r X 6.617 1.674 3.292, 9.942 Sample Cons. M -0.532 0.309 -1.145, 0.081 X × M 0.101 0.035 0.031, 0.171 Constant -223.823 48.517 -320.183, -127.463 Gender 17.928 10.508 -2.941, 38.798 EAT-26(ln) -1.237 7.438 -16.010, 13.536 SHAI(ln) 23.857 11.943 0.137, 47.577 BISS 7.756 4.198 -0.582, 16.093 R2 = .278, F(7, 92) = 3.50, p = .002 R2-chng = .051, F(1, 92) = 8.28, p = .005
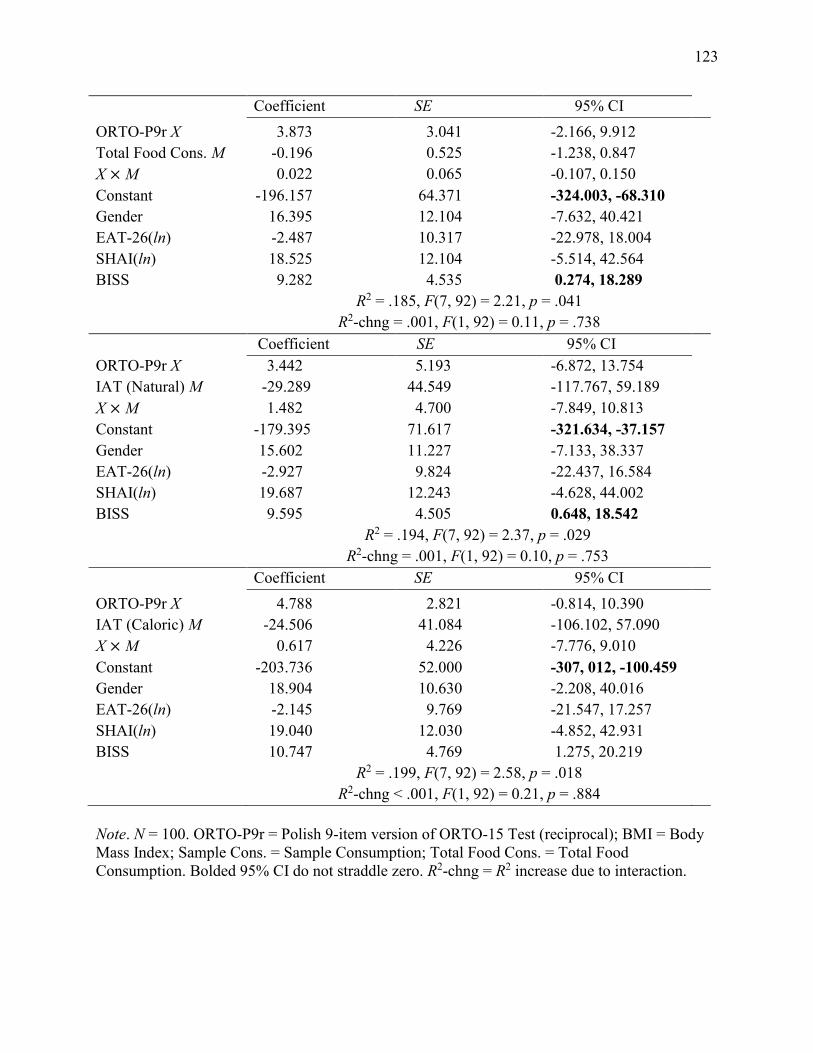
123
Note. N = 100. ORTO-P9r = Polish 9-item version of ORTO-15 Test (reciprocal); BMI = Body Mass Index; Sample Cons. = Sample Consumption; Total Food Cons. = Total Food Consumption. Bolded 95% CI do not straddle zero. R2-chng = R2 increase due to interaction.
Coefficient SE 95% CI ORTO-P9r X 3.873 3.041 -2.166, 9.912 Total Food Cons. M -0.196 0.525 -1.238, 0.847 X × M 0.022 0.065 -0.107, 0.150 Constant -196.157 64.371 -324.003, -68.310 Gender 16.395 12.104 -7.632, 40.421 EAT-26(ln) -2.487 10.317 -22.978, 18.004 SHAI(ln) 18.525 12.104 -5.514, 42.564 BISS 9.282 4.535 0.274, 18.289 R2 = .185, F(7, 92) = 2.21, p = .041 R2-chng = .001, F(1, 92) = 0.11, p = .738 Coefficient SE 95% CI ORTO-P9r X 3.442 5.193 -6.872, 13.754 IAT (Natural) M -29.289 44.549 -117.767, 59.189 X × M 1.482 4.700 -7.849, 10.813 Constant -179.395 71.617 -321.634, -37.157 Gender 15.602 11.227 -7.133, 38.337 EAT-26(ln) -2.927 9.824 -22.437, 16.584 SHAI(ln) 19.687 12.243 -4.628, 44.002 BISS 9.595 4.505 0.648, 18.542 R2 = .194, F(7, 92) = 2.37, p = .029 R2-chng = .001, F(1, 92) = 0.10, p = .753 Coefficient SE 95% CI ORTO-P9r X 4.788 2.821 -0.814, 10.390 IAT (Caloric) M -24.506 41.084 -106.102, 57.090 X × M 0.617 4.226 -7.776, 9.010 Constant -203.736 52.000 -307, 012, -100.459 Gender 18.904 10.630 -2.208, 40.016 EAT-26(ln) -2.145 9.769 -21.547, 17.257 SHAI(ln) 19.040 12.030 -4.852, 42.931 BISS 10.747 4.769 1.275, 20.219 R2 = .199, F(7, 92) = 2.58, p = .018 R2-chng < .001, F(1, 92) = 0.21, p = .884
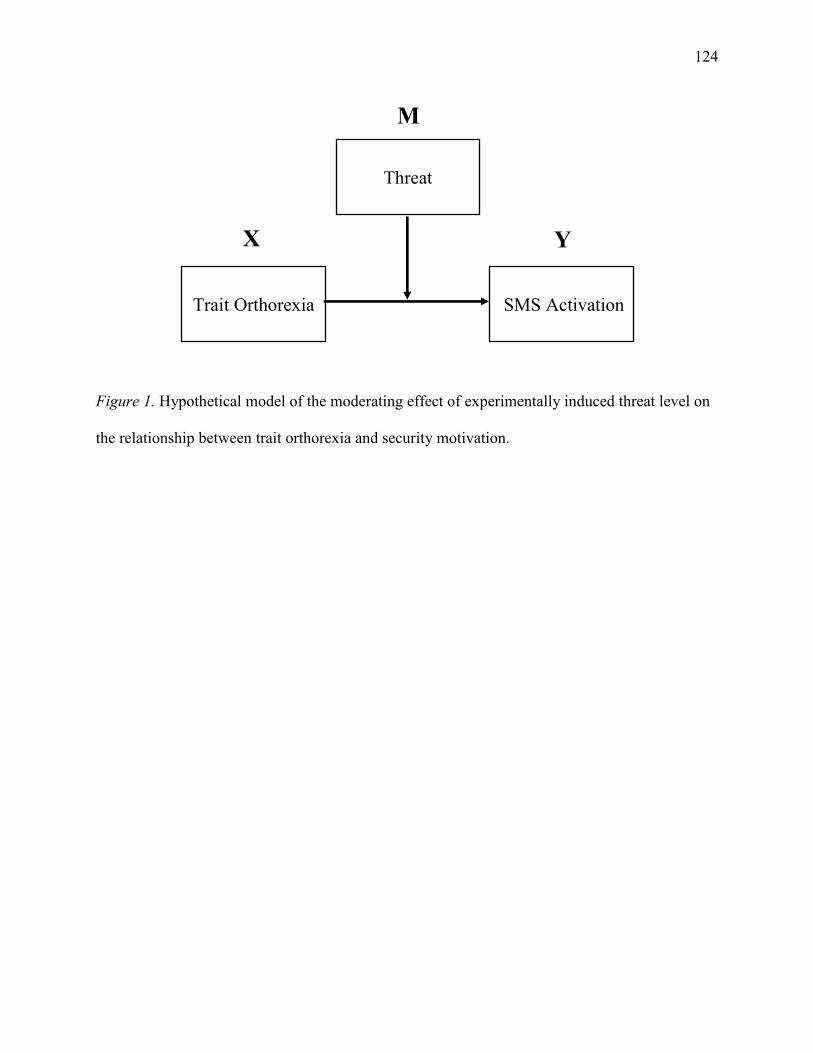
124
Figure 1. Hypothetical model of the moderating effect of experimentally induced threat level on
the relationship between trait orthorexia and security motivation.
X
M
Y
Threat
SMS Activation Trait Orthorexia
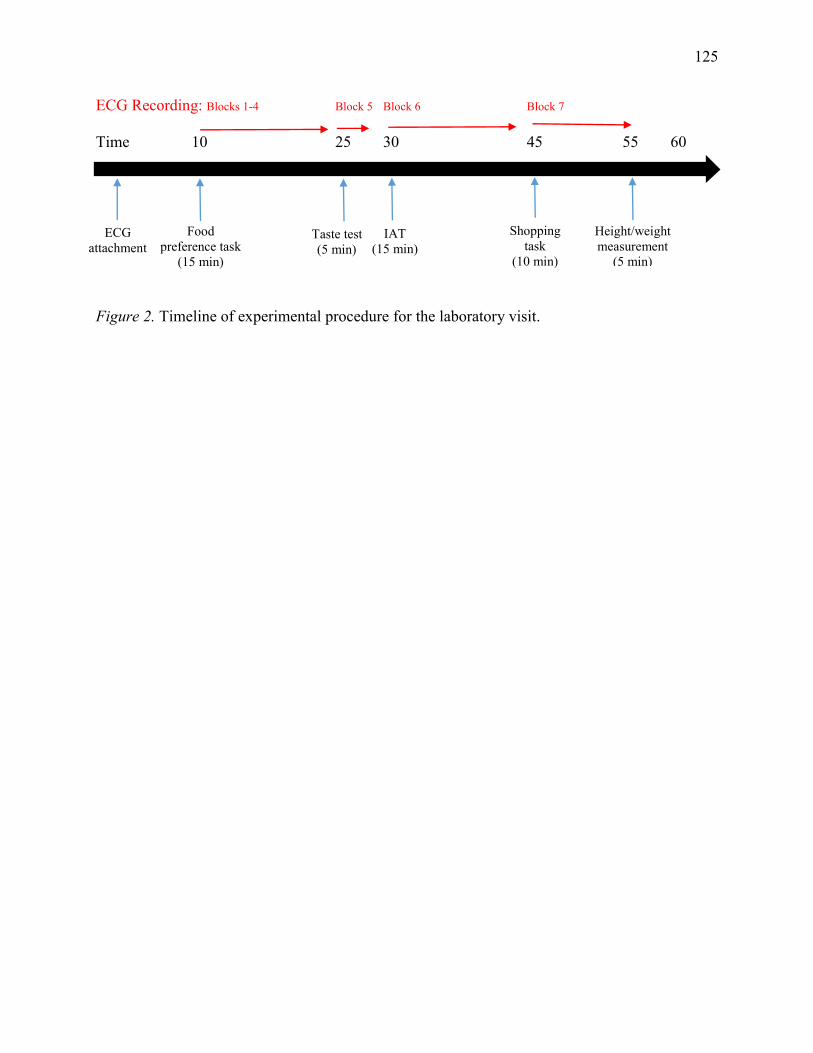
125
ECG Recording: Blocks 1-4 Block 5 Block 6 Block 7
Time 10 25 30 45 55 60
Figure 2. Timeline of experimental procedure for the laboratory visit.
ECG attachment
Food preference task
(15 min)
Height/weight measurement
(5 min)
Taste test (5 min)
Shopping task
(10 min)
IAT (15 min)
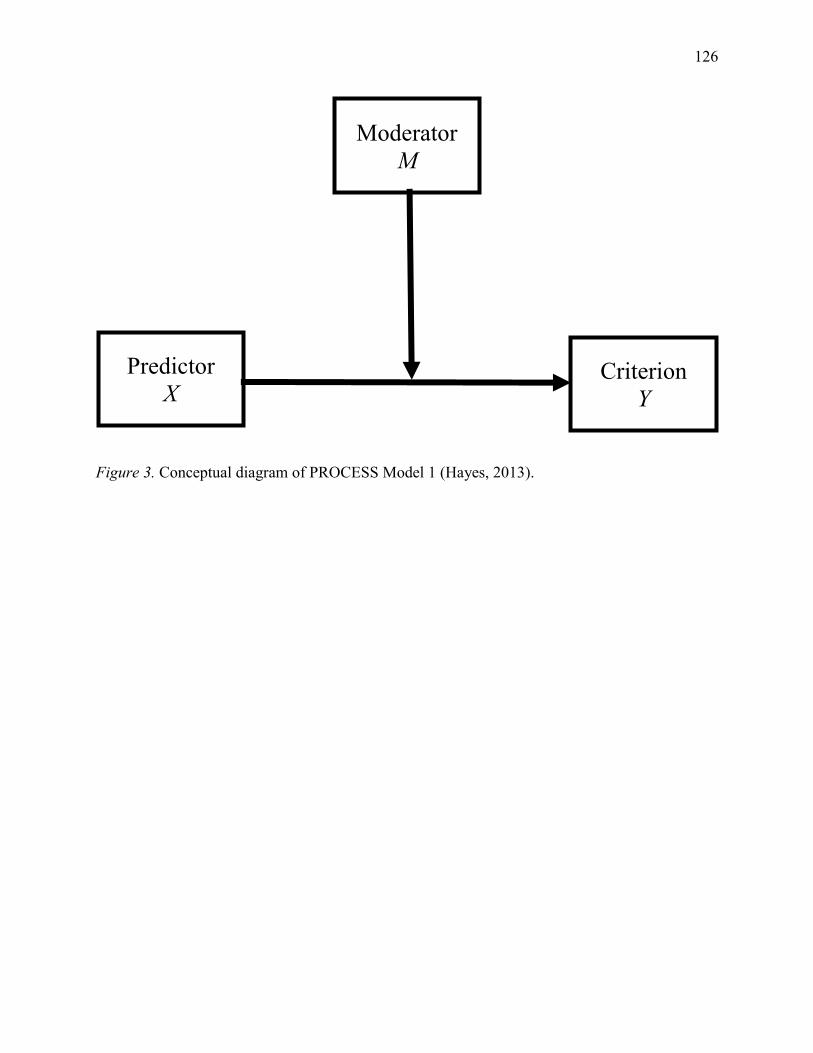
126
Figure 3. Conceptual diagram of PROCESS Model 1 (Hayes, 2013).
Moderator M
Predictor X
Criterion Y
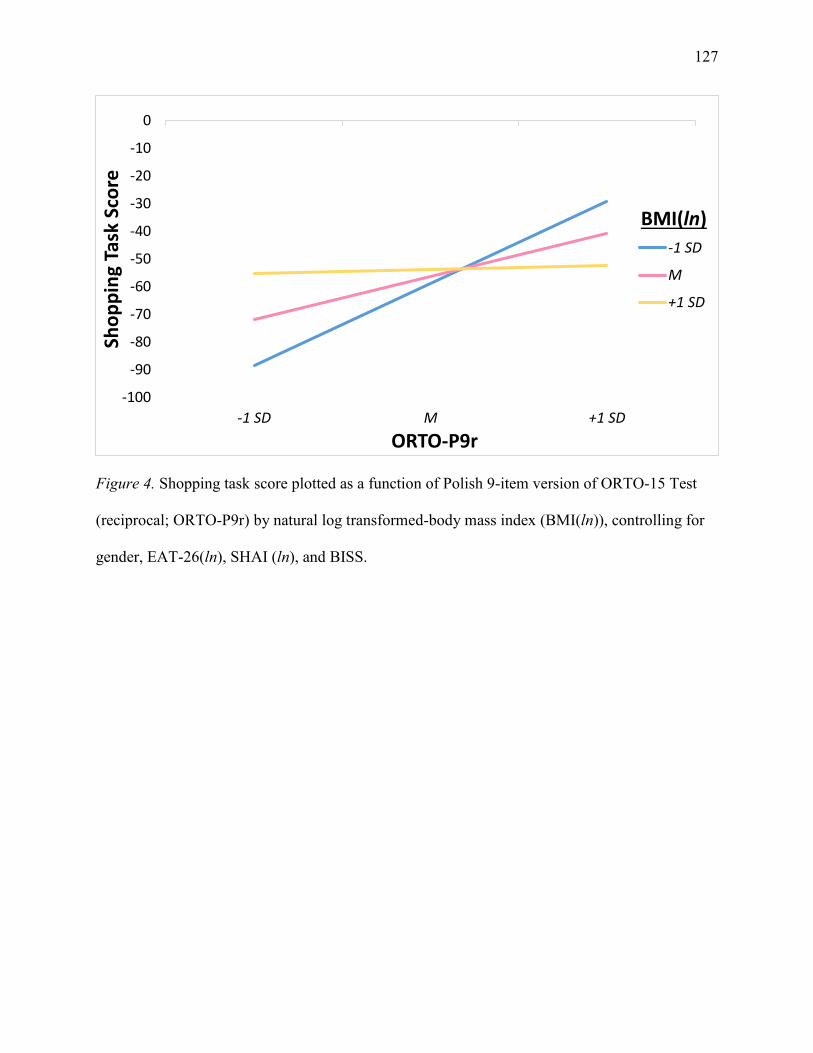
127
Figure 4. Shopping task score plotted as a function of Polish 9-item version of ORTO-15 Test
(reciprocal; ORTO-P9r) by natural log transformed-body mass index (BMI(ln)), controlling for
gender, EAT-26(ln), SHAI (ln), and BISS.
-100
-90
-80
-70
-60
-50
-40
-30
-20
-10
0
-1 SD M +1 SD
Sho
pp
ing
Task
Sco
re
ORTO-P9r
-1 SD
M
+1 SD
BMI(ln)
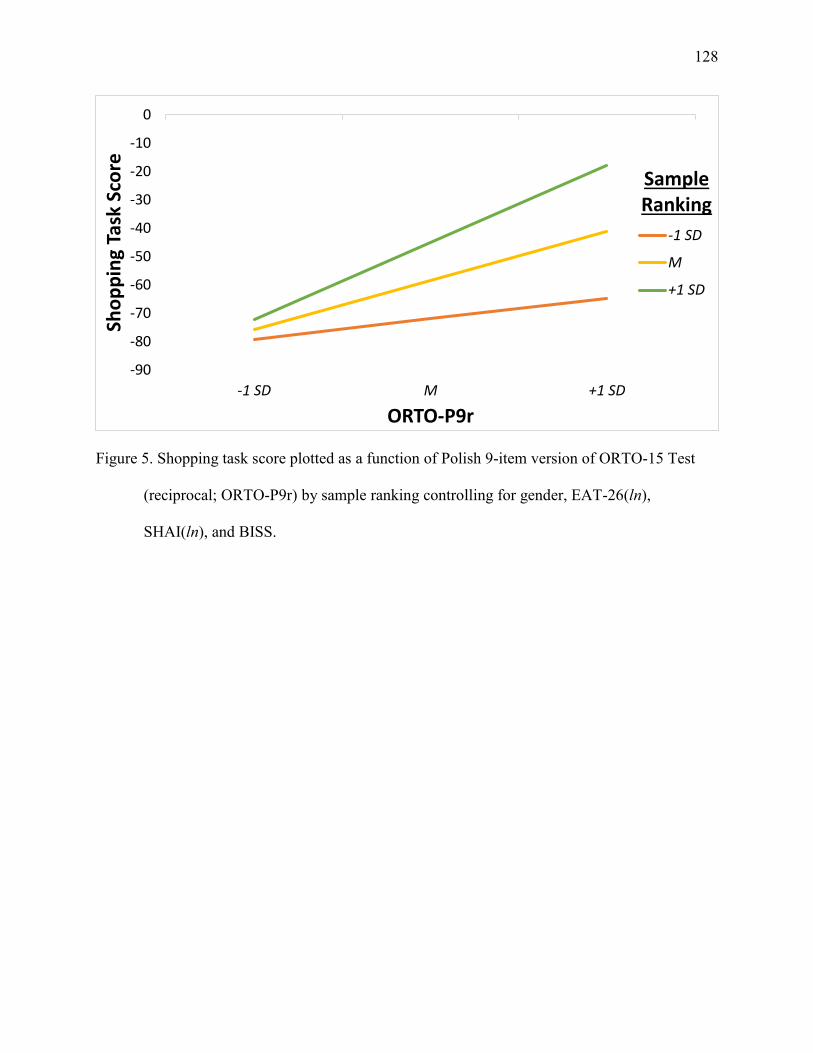
128
Figure 5. Shopping task score plotted as a function of Polish 9-item version of ORTO-15 Test
(reciprocal; ORTO-P9r) by sample ranking controlling for gender, EAT-26(ln),
SHAI(ln), and BISS.
-90
-80
-70
-60
-50
-40
-30
-20
-10
0
-1 SD M +1 SD
Sho
pp
ing
Task
Sco
re
ORTO-P9r
-1 SD
M
+1 SD
Sample Ranking
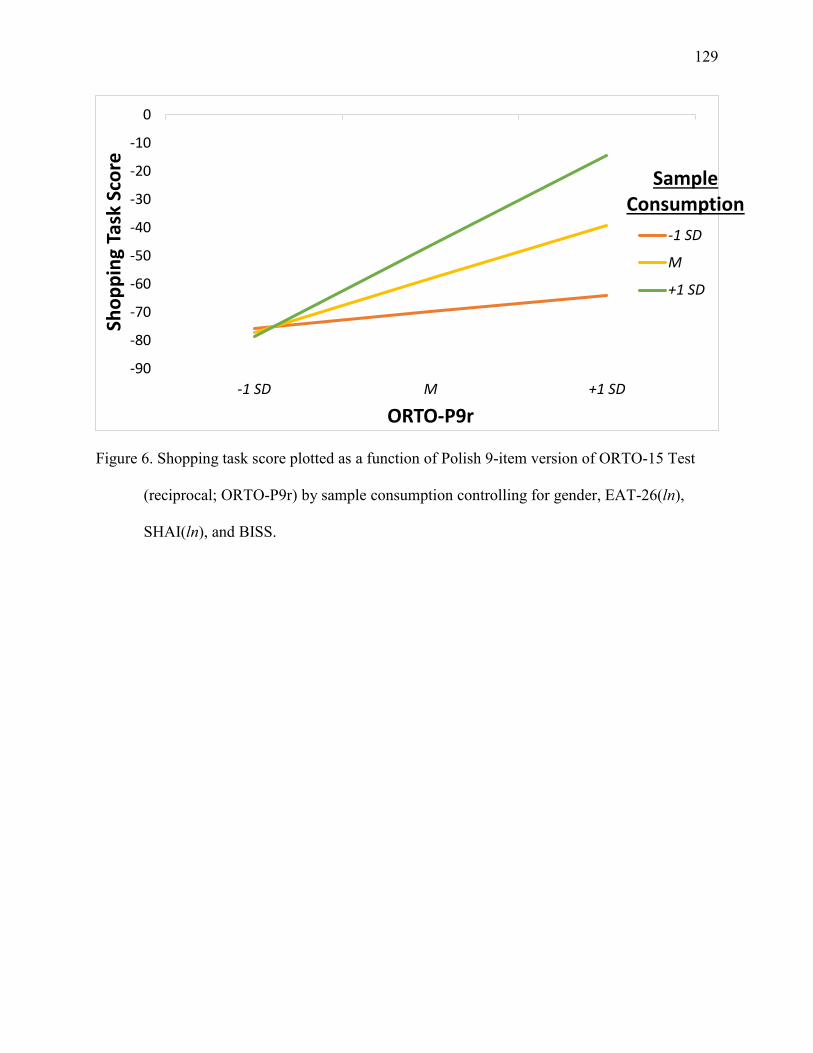
129
Figure 6. Shopping task score plotted as a function of Polish 9-item version of ORTO-15 Test
(reciprocal; ORTO-P9r) by sample consumption controlling for gender, EAT-26(ln),
SHAI(ln), and BISS.
-90
-80
-70
-60
-50
-40
-30
-20
-10
0
-1 SD M +1 SD
Sho
pp
ing
Task
Sco
re
ORTO-P9r
-1 SD
M
+1 SD
Sample Consumption
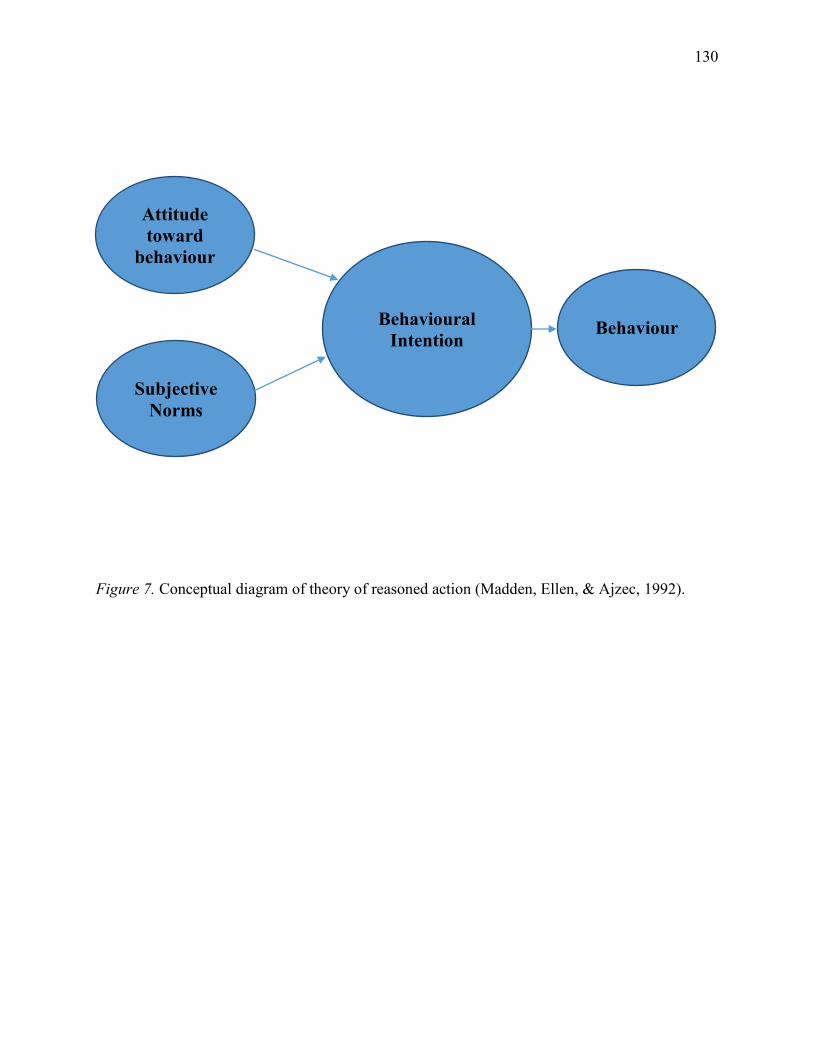
130
Figure 7. Conceptual diagram of theory of reasoned action (Madden, Ellen, & Ajzec, 1992).
Behaviour Behavioural Intention
Attitude toward
behaviour
Subjective Norms
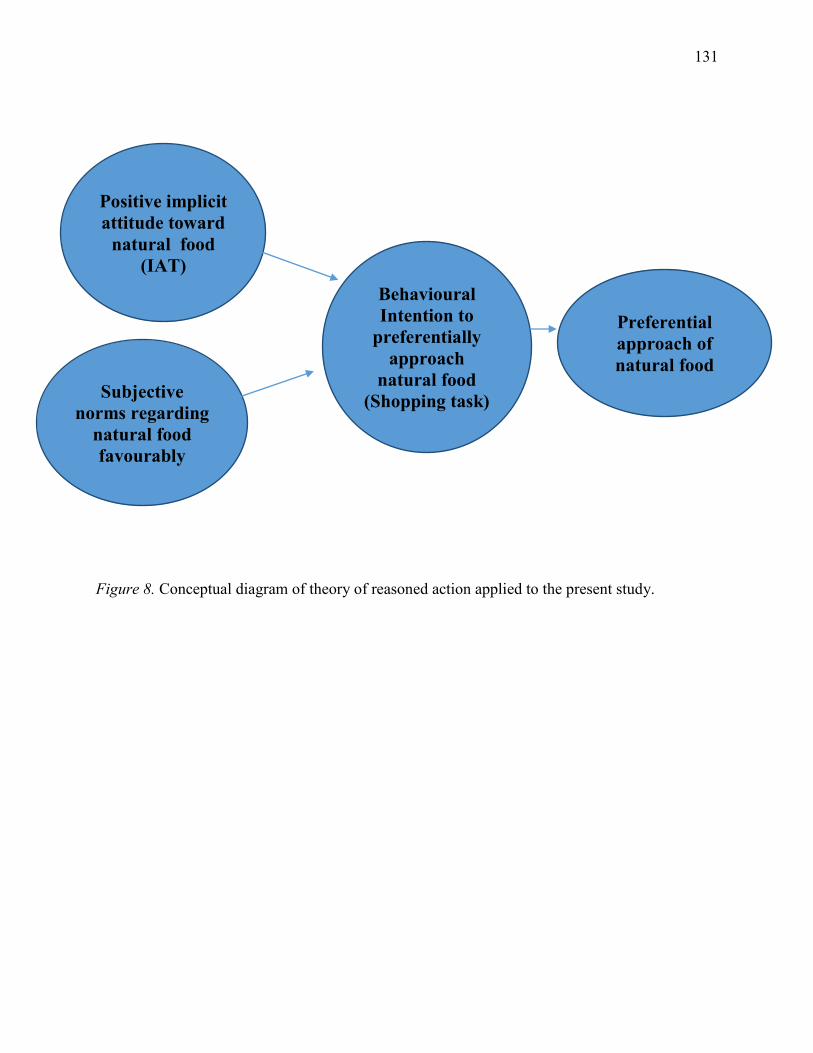
131
Figure 8. Conceptual diagram of theory of reasoned action applied to the present study.
Preferential approach of natural food
Behavioural Intention to
preferentially approach
natural food (Shopping task)
Positive implicit attitude toward
natural food (IAT)
Subjective norms regarding
natural food favourably
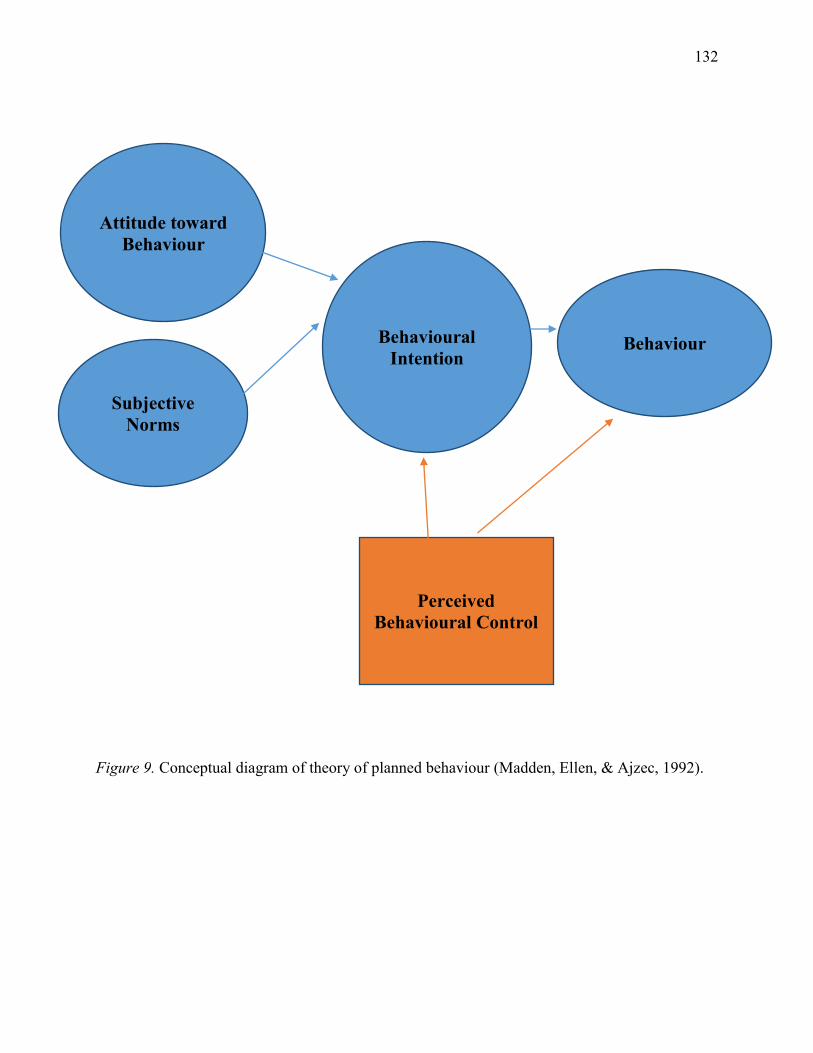
132
Figure 9. Conceptual diagram of theory of planned behaviour (Madden, Ellen, & Ajzec, 1992).
Behaviour Behavioural Intention
Attitude toward Behaviour
Subjective Norms
Perceived Behavioural Control
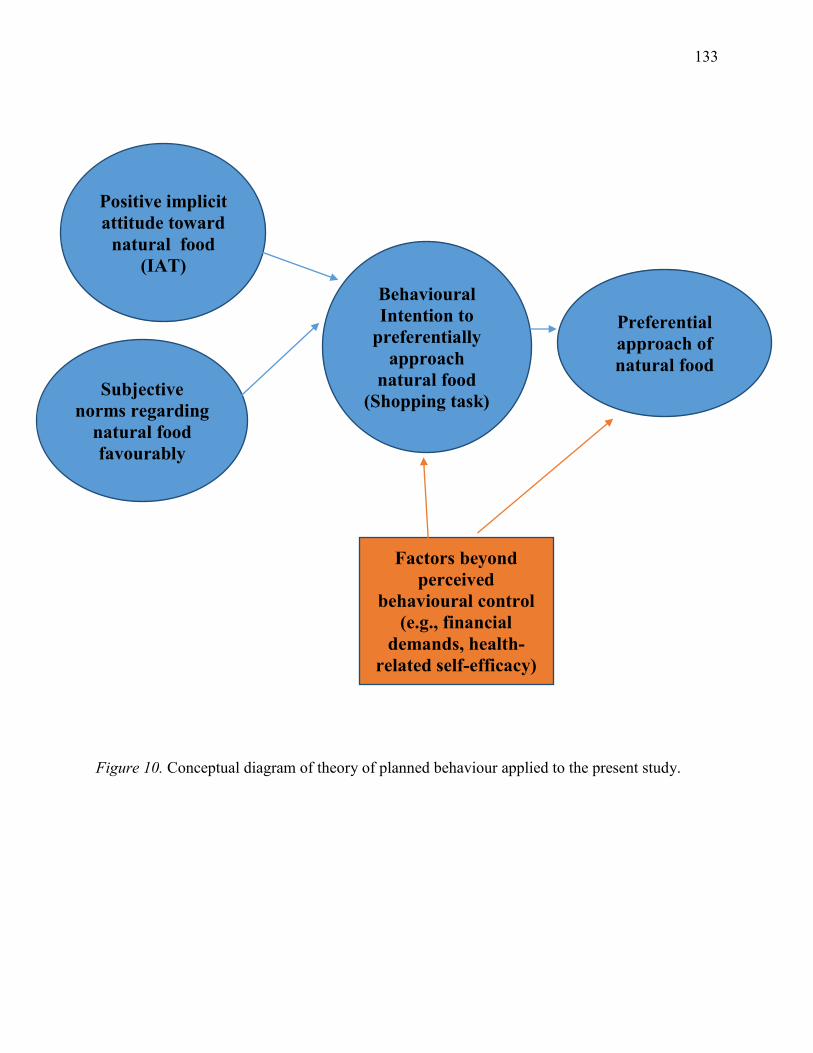
133
Figure 10. Conceptual diagram of theory of planned behaviour applied to the present study.
Preferential approach of natural food
Behavioural Intention to
preferentially approach
natural food (Shopping task)
Positive implicit attitude toward
natural food (IAT)
Subjective norms regarding
natural food favourably
Factors beyond perceived
behavioural control (e.g., financial
demands, health-related self-efficacy)
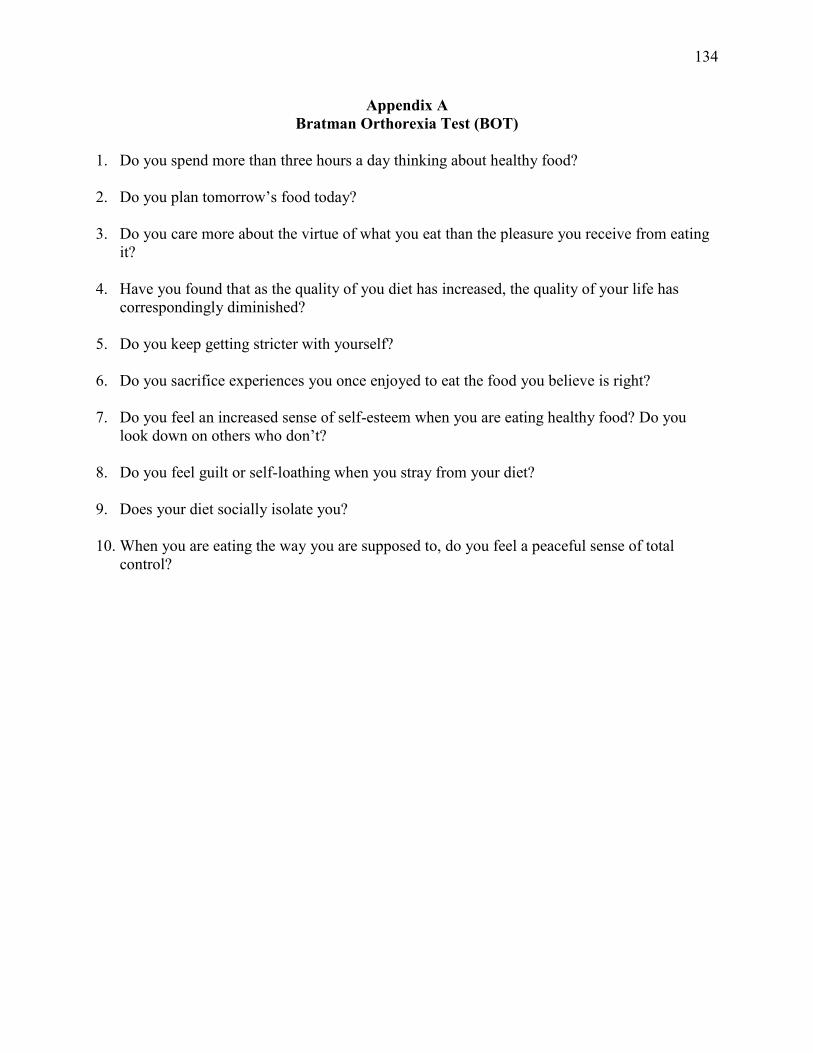
134
Appendix A Bratman Orthorexia Test (BOT)
1. Do you spend more than three hours a day thinking about healthy food?
2. Do you plan tomorrow’s food today? 3. Do you care more about the virtue of what you eat than the pleasure you receive from eating
it? 4. Have you found that as the quality of you diet has increased, the quality of your life has
correspondingly diminished? 5. Do you keep getting stricter with yourself? 6. Do you sacrifice experiences you once enjoyed to eat the food you believe is right? 7. Do you feel an increased sense of self-esteem when you are eating healthy food? Do you
look down on others who don’t? 8. Do you feel guilt or self-loathing when you stray from your diet? 9. Does your diet socially isolate you? 10. When you are eating the way you are supposed to, do you feel a peaceful sense of total
control?
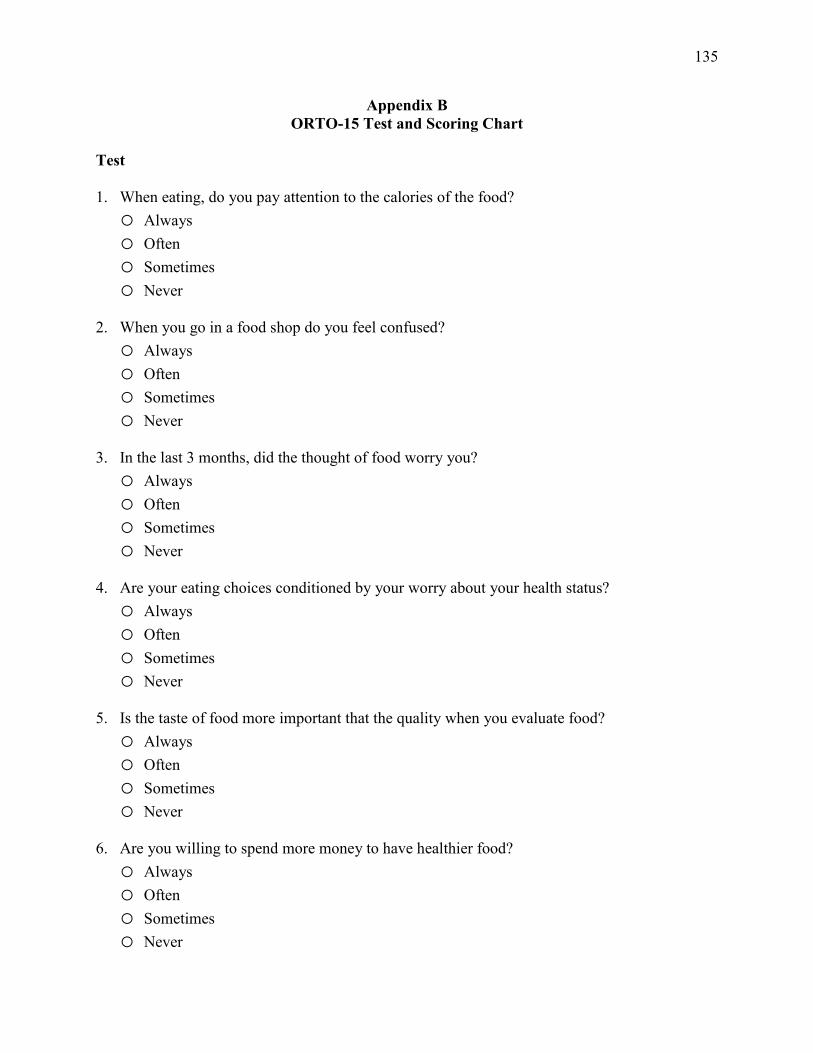
135
Appendix B ORTO-15 Test and Scoring Chart
Test
1. When eating, do you pay attention to the calories of the food? o Always o Often o Sometimes o Never
2. When you go in a food shop do you feel confused? o Always o Often o Sometimes o Never
3. In the last 3 months, did the thought of food worry you? o Always o Often o Sometimes o Never
4. Are your eating choices conditioned by your worry about your health status? o Always o Often o Sometimes o Never
5. Is the taste of food more important that the quality when you evaluate food? o Always o Often o Sometimes o Never
6. Are you willing to spend more money to have healthier food? o Always o Often o Sometimes o Never

136
7. Does the thought about food worry you for more than three hours a day? o Always o Often o Sometimes o Never
8. Do you allow yourself any eating transgressions? o Always o Often o Sometimes o Never
9. Do you think your mood affects your eating behaviour? o Always o Often o Sometimes o Never
10. Do you think that the conviction to eat only healthy food increases self-esteem? o Always o Often o Sometimes o Never
11. Do you think that eating health food changes your lifestyle (frequency of eating out, friends,
…)? o Always o Often o Sometimes o Never
12. Do you think that consuming healthy food may improve your appearance? o Always o Often o Sometimes o Never
13. Do you feel guilty when transgressing? o Always
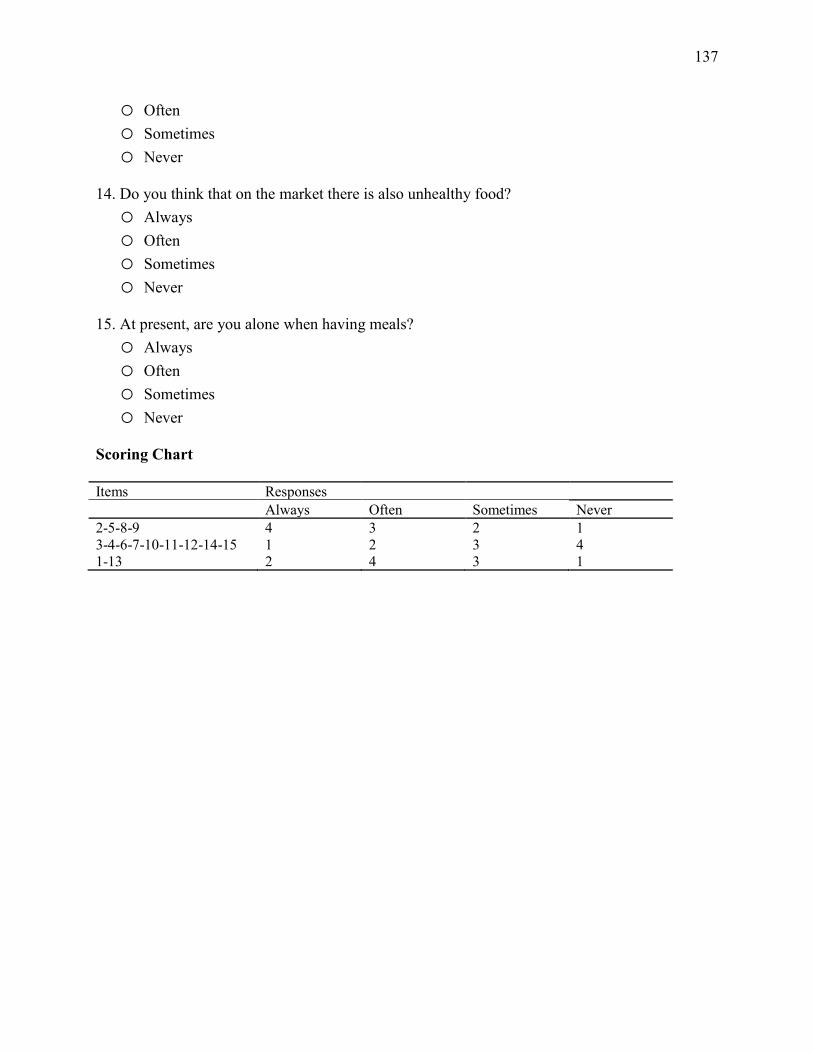
137
o Often o Sometimes o Never
14. Do you think that on the market there is also unhealthy food? o Always o Often o Sometimes o Never
15. At present, are you alone when having meals? o Always o Often o Sometimes o Never
Scoring Chart Items Responses Always Often Sometimes Never 2-5-8-9 4 3 2 1 3-4-6-7-10-11-12-14-15 1 2 3 4 1-13 2 4 3 1

139
questionnaires. This level of distress or discomfort is no more than you would experience in your daily life when thinking about these topics. You may choose not to answer any of the questions without penalty. If at any point during or after this study you would like to speak to a mental health professional, feel free to contact the Student Health and Counseling Centre located in the Prettie Residence in person or by telephone at 807-343-8361.
Your participation in this study is completely voluntary and you may withdraw from it at any time without penalty.
If you are registered in a Psychology undergraduate course that is eligible for bonus points, your participation in both components (online questionnaire and laboratory visit) would lead to 3 bonus points credited to your final grade in that course: 1 for completing the online questionnaire and another 2 for completing the lab visit. Please feel free to contact Brittany Mascioli and/or Dr. Ron Davis with any questions that you might have about this study. If you wish to receive a summary of the findings of this study, you will have the opportunity to indicate your interest to do so during the completion of the online questionnaire, during the laboratory session, as well as during a final debriefing email that will be sent once all participants have participated. You will be asked to provide an email address to indicate where the summary should be sent. The summary will be sent at the conclusion of the study once all participants have completed their participation and all analyses have been conducted. You will not be identified directly or indirectly through this process or any subsequent process involving publication of the results. This study has been approved by the Lakehead University Research Ethics Board. If you have any questions related to the ethics of the research and would like to speak to someone outside of the research team, please contact Sue Wright at the Research Ethics Board at 807-343-8283 or [email protected] Sincerely, Brittany Mascioli [email protected] (705) 365-0986 Dr. Ron Davis [email protected] (807) 343-8646

141
Appendix E Eating Attitudes Test-26
Instructions: Please answer the questions below as accurately, honestly, and completely as possible. Check a response for each of the following statements: 1. I am terrified about being overweight. o Always o Usually o Often o Sometimes o Rarely o Never
2. I avoid eating when I am hungry. o Always o Usually o Often o Sometimes o Rarely o Never
3. I find myself preoccupied with food. o Always o Usually o Often o Sometimes o Rarely o Never
4. I have gone on eating binges where I feel that I may not be able to stop. o Always o Usually o Often o Sometimes o Rarely o Never
5. I cut my food into small pieces.

142
o Always o Usually o Often o Sometimes o Rarely o Never
6. I am aware of the calorie content of foods that I eat. o Always o Usually o Often o Sometimes o Rarely o Never
7. I particularly avoid food with a high carbohydrate content (i.e. bread, rice, potatoes, etc.) o Always o Usually o Often o Sometimes o Rarely o Never
8. I feel that others would prefer if I ate more. o Always o Usually o Often o Sometimes o Rarely o Never
9. I vomit after I have eaten. o Always o Usually o Often o Sometimes o Rarely o Never
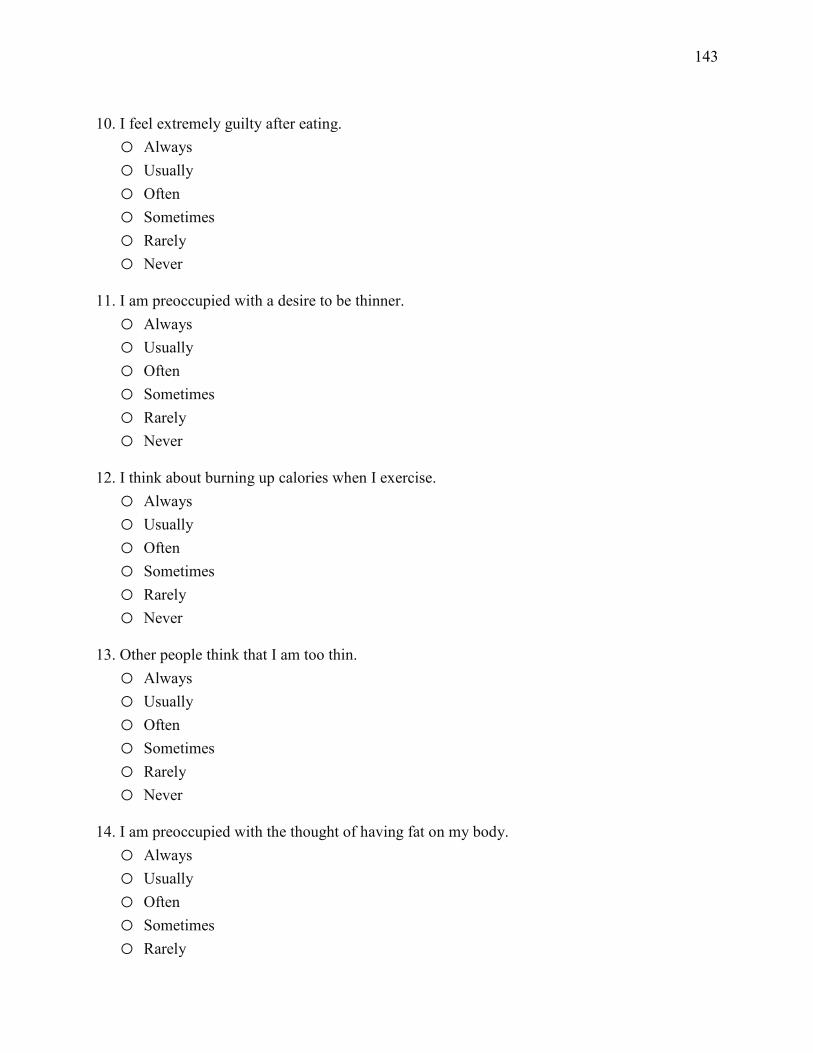
143
10. I feel extremely guilty after eating. o Always o Usually o Often o Sometimes o Rarely o Never
11. I am preoccupied with a desire to be thinner. o Always o Usually o Often o Sometimes o Rarely o Never
12. I think about burning up calories when I exercise. o Always o Usually o Often o Sometimes o Rarely o Never
13. Other people think that I am too thin. o Always o Usually o Often o Sometimes o Rarely o Never
14. I am preoccupied with the thought of having fat on my body. o Always o Usually o Often o Sometimes o Rarely
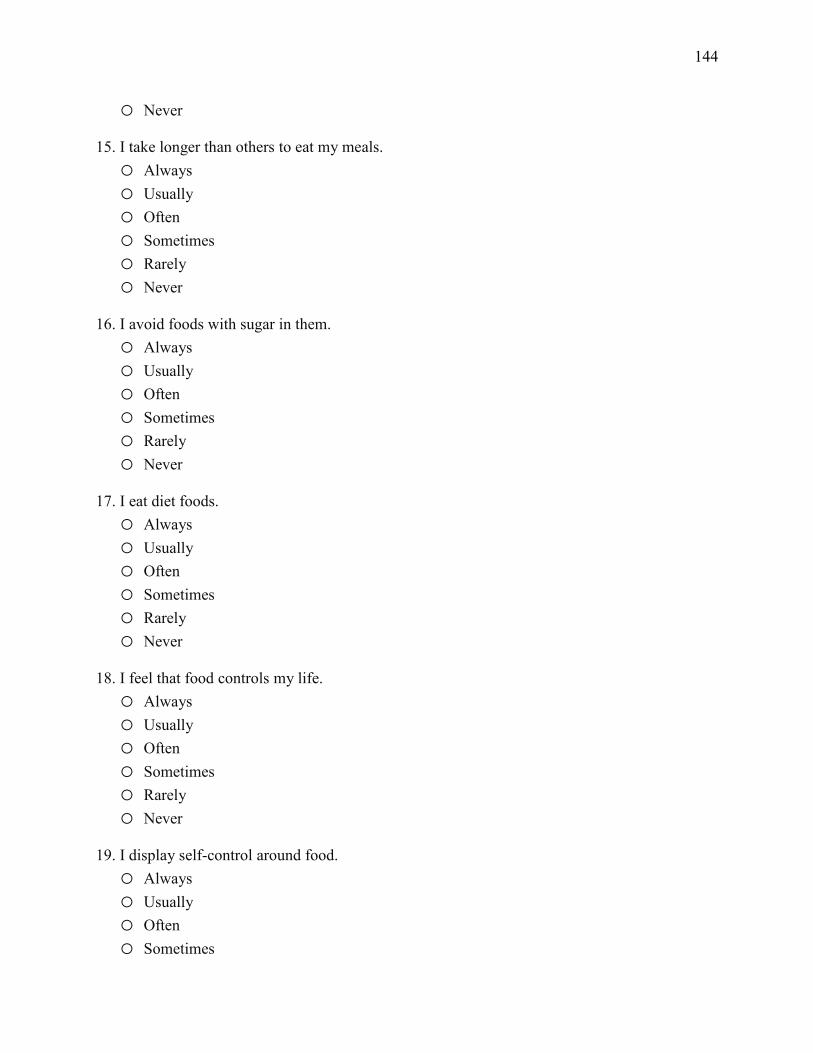
144
o Never
15. I take longer than others to eat my meals. o Always o Usually o Often o Sometimes o Rarely o Never
16. I avoid foods with sugar in them. o Always o Usually o Often o Sometimes o Rarely o Never
17. I eat diet foods. o Always o Usually o Often o Sometimes o Rarely o Never
18. I feel that food controls my life. o Always o Usually o Often o Sometimes o Rarely o Never
19. I display self-control around food. o Always o Usually o Often o Sometimes
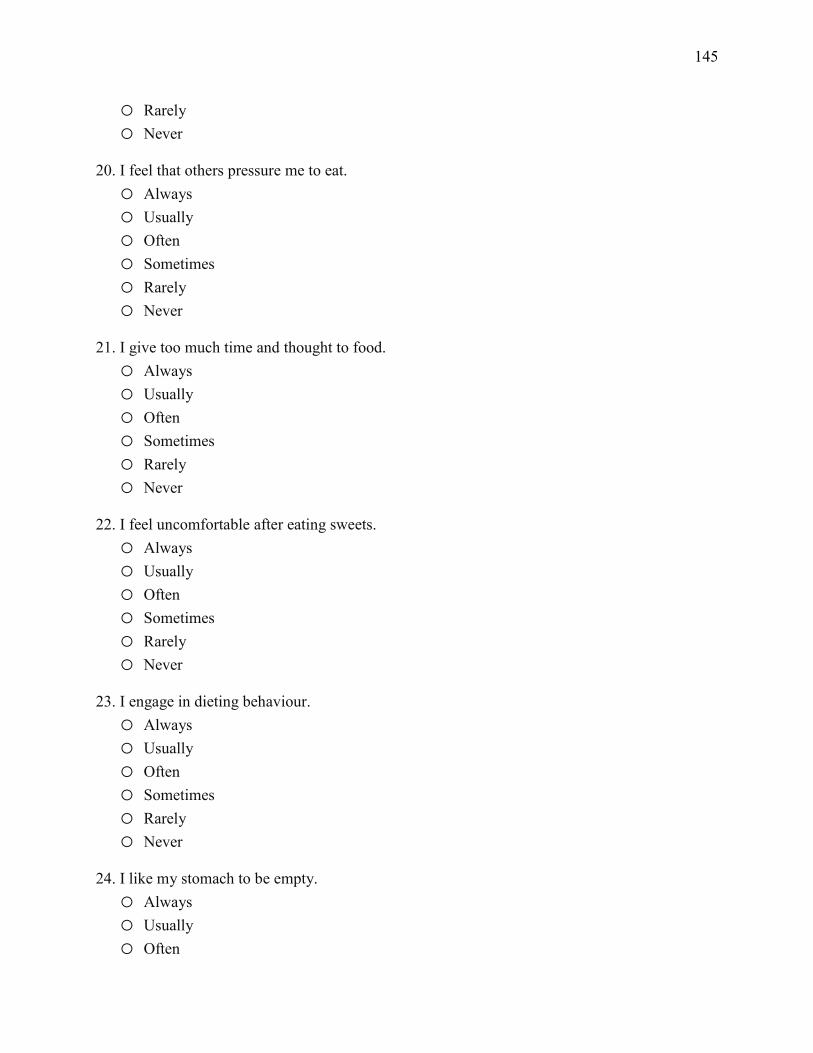
145
o Rarely o Never
20. I feel that others pressure me to eat. o Always o Usually o Often o Sometimes o Rarely o Never
21. I give too much time and thought to food. o Always o Usually o Often o Sometimes o Rarely o Never
22. I feel uncomfortable after eating sweets. o Always o Usually o Often o Sometimes o Rarely o Never
23. I engage in dieting behaviour. o Always o Usually o Often o Sometimes o Rarely o Never
24. I like my stomach to be empty. o Always o Usually o Often
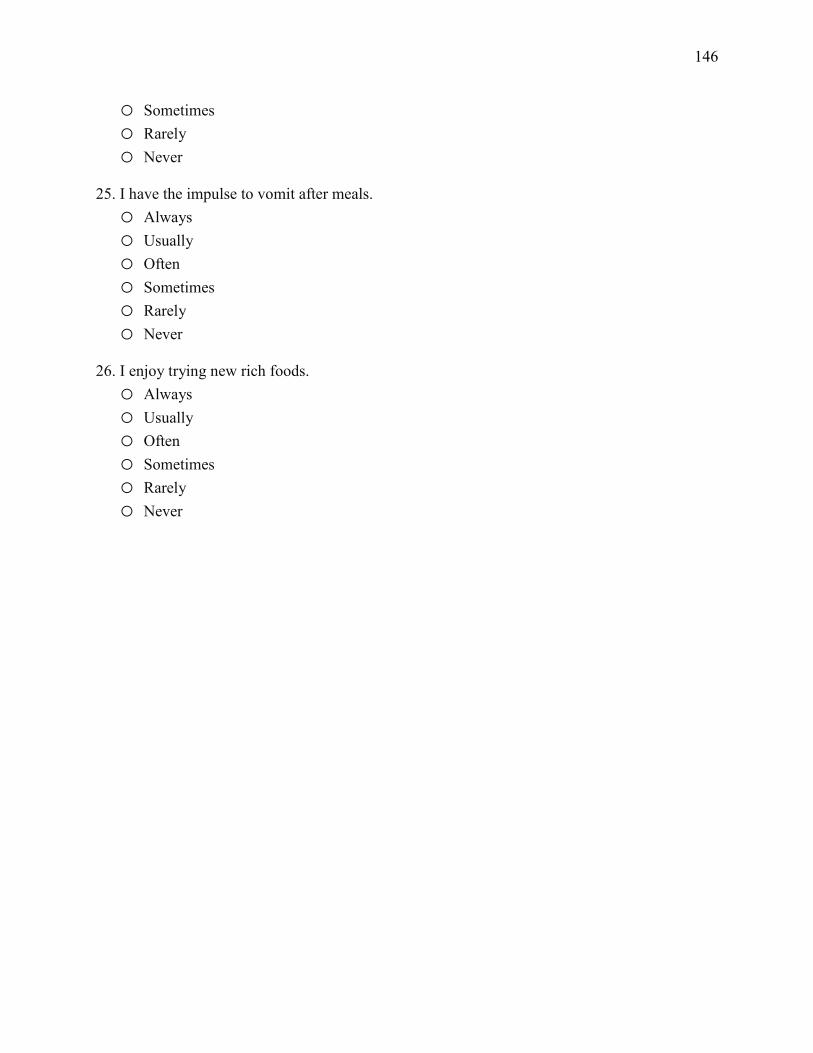
146
o Sometimes o Rarely o Never
25. I have the impulse to vomit after meals. o Always o Usually o Often o Sometimes o Rarely o Never
26. I enjoy trying new rich foods. o Always o Usually o Often o Sometimes o Rarely o Never

147
Appendix F Body Image States Scale
For each of the items below, check the box beside the one statement that best describes how you feel RIGHT NOW, AT THIS VERY MOMENT. Read the items carefully to be sure the statement you choose accurately and honestly describes how you feel right now. 1. Right now I feel… o Extremely dissatisfied with my physical appearance o Mostly dissatisfied with my physical appearance o Moderately dissatisfied with my physical appearance o Slightly dissatisfied with my physical appearance o Neither dissatisfied nor satisfied with my physical appearance o Slightly satisfied with my physical appearance o Moderately satisfied with my physical appearance o Mostly satisfied with my physical appearance o Extremely satisfied with my physical appearance
2. Right now I feel… o Extremely satisfied with my body size and shape o Mostly satisfied with my body size and shape o Moderately satisfied with my body size and shape o Slightly satisfied with my body size and shape o Neither dissatisfied nor satisfied with my body size and shape o Slightly dissatisfied with my body size and shape o Moderately dissatisfied with my body size and shape o Mostly dissatisfied with my body size and shape o Extremely dissatisfied with my body size and shape
3. Right now I feel… o Extremely dissatisfied with my weight o Mostly dissatisfied with my weight o Moderately dissatisfied with my weight o Slightly dissatisfied with my weight o Neither dissatisfied nor satisfied with my weight o Slightly satisfied with my weight o Moderately satisfied with my weight o Mostly satisfied with my weight
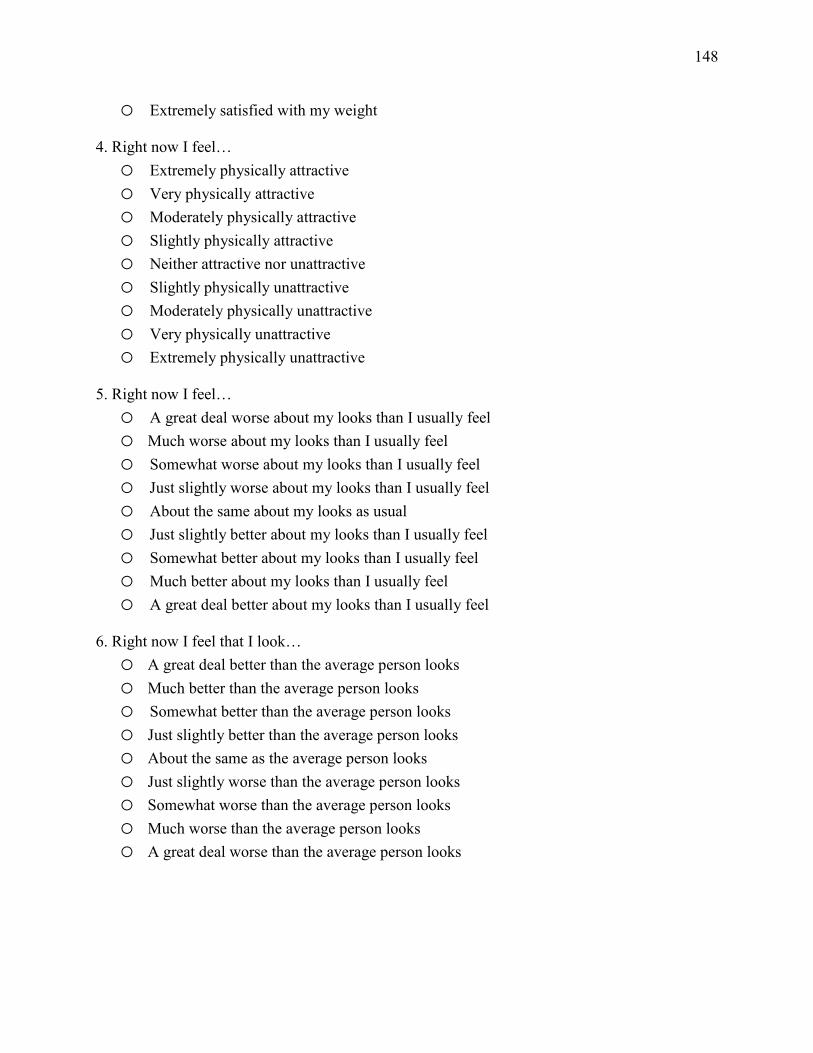
148
o Extremely satisfied with my weight 4. Right now I feel… o Extremely physically attractive o Very physically attractive o Moderately physically attractive o Slightly physically attractive o Neither attractive nor unattractive o Slightly physically unattractive o Moderately physically unattractive o Very physically unattractive o Extremely physically unattractive
5. Right now I feel… o A great deal worse about my looks than I usually feel o Much worse about my looks than I usually feel o Somewhat worse about my looks than I usually feel o Just slightly worse about my looks than I usually feel o About the same about my looks as usual o Just slightly better about my looks than I usually feel o Somewhat better about my looks than I usually feel o Much better about my looks than I usually feel o A great deal better about my looks than I usually feel
6. Right now I feel that I look… o A great deal better than the average person looks o Much better than the average person looks o Somewhat better than the average person looks o Just slightly better than the average person looks o About the same as the average person looks o Just slightly worse than the average person looks o Somewhat worse than the average person looks o Much worse than the average person looks o A great deal worse than the average person looks
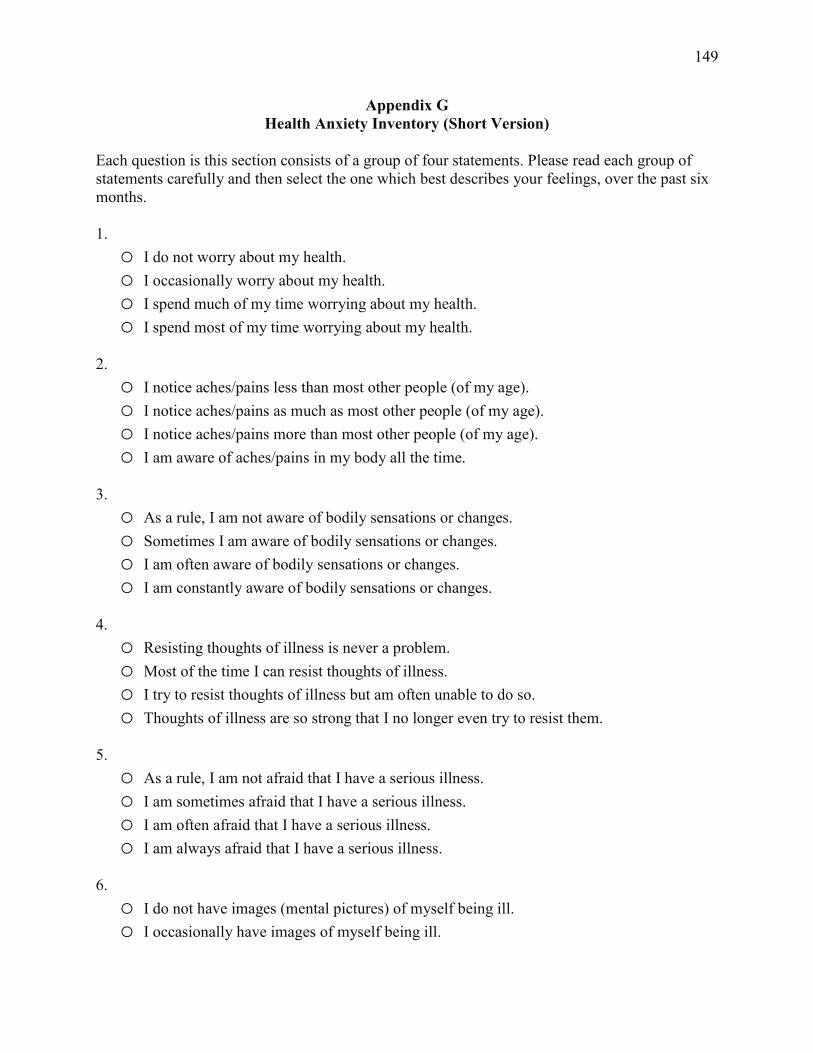
149
Appendix G Health Anxiety Inventory (Short Version)
Each question is this section consists of a group of four statements. Please read each group of statements carefully and then select the one which best describes your feelings, over the past six months. 1. o I do not worry about my health. o I occasionally worry about my health. o I spend much of my time worrying about my health. o I spend most of my time worrying about my health.
2. o I notice aches/pains less than most other people (of my age). o I notice aches/pains as much as most other people (of my age). o I notice aches/pains more than most other people (of my age). o I am aware of aches/pains in my body all the time.
3. o As a rule, I am not aware of bodily sensations or changes. o Sometimes I am aware of bodily sensations or changes. o I am often aware of bodily sensations or changes. o I am constantly aware of bodily sensations or changes.
4. o Resisting thoughts of illness is never a problem. o Most of the time I can resist thoughts of illness. o I try to resist thoughts of illness but am often unable to do so. o Thoughts of illness are so strong that I no longer even try to resist them.
5. o As a rule, I am not afraid that I have a serious illness. o I am sometimes afraid that I have a serious illness. o I am often afraid that I have a serious illness. o I am always afraid that I have a serious illness.
6. o I do not have images (mental pictures) of myself being ill. o I occasionally have images of myself being ill.
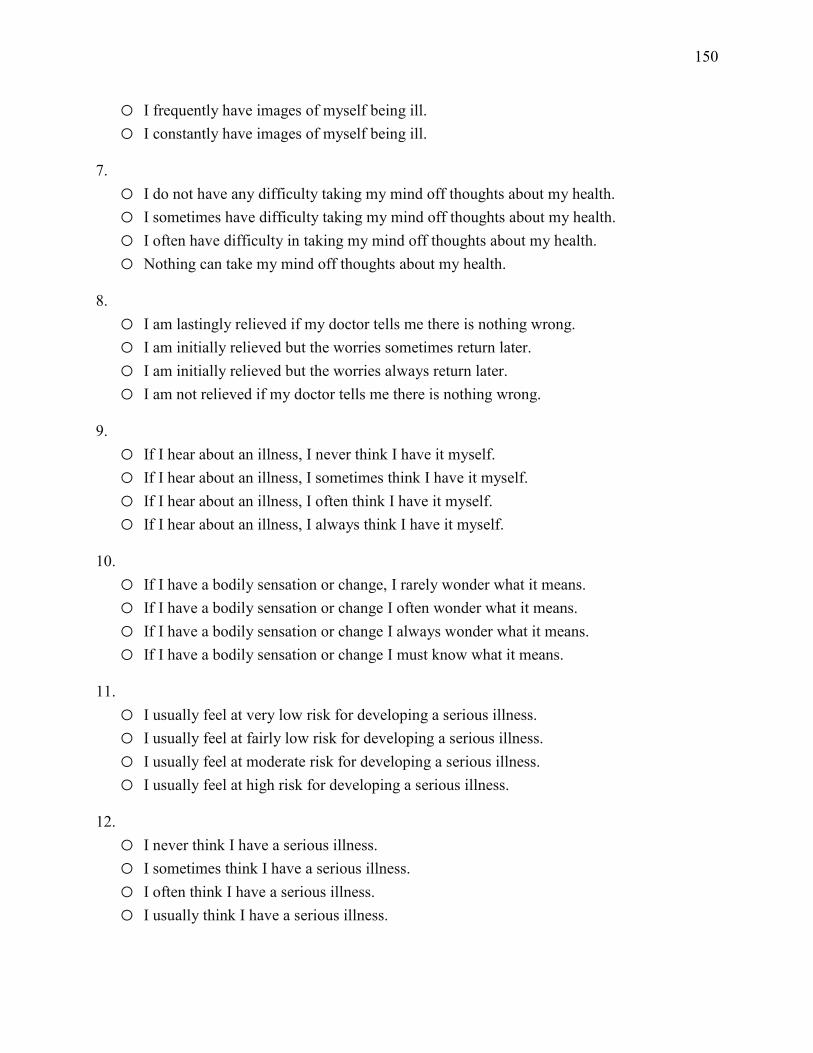
150
o I frequently have images of myself being ill. o I constantly have images of myself being ill.
7. o I do not have any difficulty taking my mind off thoughts about my health. o I sometimes have difficulty taking my mind off thoughts about my health. o I often have difficulty in taking my mind off thoughts about my health. o Nothing can take my mind off thoughts about my health.
8. o I am lastingly relieved if my doctor tells me there is nothing wrong. o I am initially relieved but the worries sometimes return later. o I am initially relieved but the worries always return later. o I am not relieved if my doctor tells me there is nothing wrong.
9. o If I hear about an illness, I never think I have it myself. o If I hear about an illness, I sometimes think I have it myself. o If I hear about an illness, I often think I have it myself. o If I hear about an illness, I always think I have it myself.
10. o If I have a bodily sensation or change, I rarely wonder what it means. o If I have a bodily sensation or change I often wonder what it means. o If I have a bodily sensation or change I always wonder what it means. o If I have a bodily sensation or change I must know what it means.
11. o I usually feel at very low risk for developing a serious illness. o I usually feel at fairly low risk for developing a serious illness. o I usually feel at moderate risk for developing a serious illness. o I usually feel at high risk for developing a serious illness.
12. o I never think I have a serious illness. o I sometimes think I have a serious illness. o I often think I have a serious illness. o I usually think I have a serious illness.
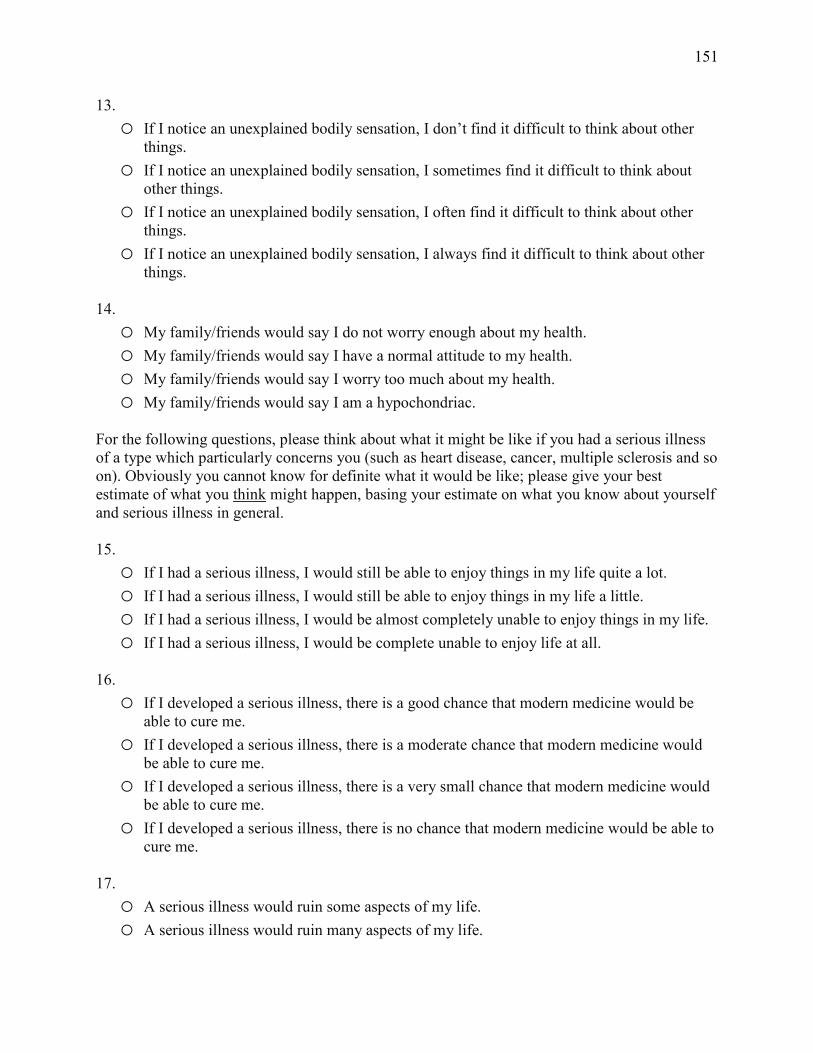
151
13. o If I notice an unexplained bodily sensation, I don’t find it difficult to think about other
things. o If I notice an unexplained bodily sensation, I sometimes find it difficult to think about
other things. o If I notice an unexplained bodily sensation, I often find it difficult to think about other
things. o If I notice an unexplained bodily sensation, I always find it difficult to think about other
things.
14. o My family/friends would say I do not worry enough about my health. o My family/friends would say I have a normal attitude to my health. o My family/friends would say I worry too much about my health. o My family/friends would say I am a hypochondriac.
For the following questions, please think about what it might be like if you had a serious illness of a type which particularly concerns you (such as heart disease, cancer, multiple sclerosis and so on). Obviously you cannot know for definite what it would be like; please give your best estimate of what you think might happen, basing your estimate on what you know about yourself and serious illness in general. 15. o If I had a serious illness, I would still be able to enjoy things in my life quite a lot. o If I had a serious illness, I would still be able to enjoy things in my life a little. o If I had a serious illness, I would be almost completely unable to enjoy things in my life. o If I had a serious illness, I would be complete unable to enjoy life at all.
16. o If I developed a serious illness, there is a good chance that modern medicine would be
able to cure me. o If I developed a serious illness, there is a moderate chance that modern medicine would
be able to cure me. o If I developed a serious illness, there is a very small chance that modern medicine would
be able to cure me. o If I developed a serious illness, there is no chance that modern medicine would be able to
cure me.
17. o A serious illness would ruin some aspects of my life. o A serious illness would ruin many aspects of my life.
152
o A serious illness would ruin almost every aspect of my life. o A serious illness would ruin every aspect of my life.
18. o If I had a serious illness, I would not feel that I had lost my dignity. o If I had a serious illness, I would feel that I had lost a little of my dignity. o If I had a serious illness, I would feel that I had lost quite a lot of my dignity. o If I had a serious illness, I would feel that I had totally lost my dignity.
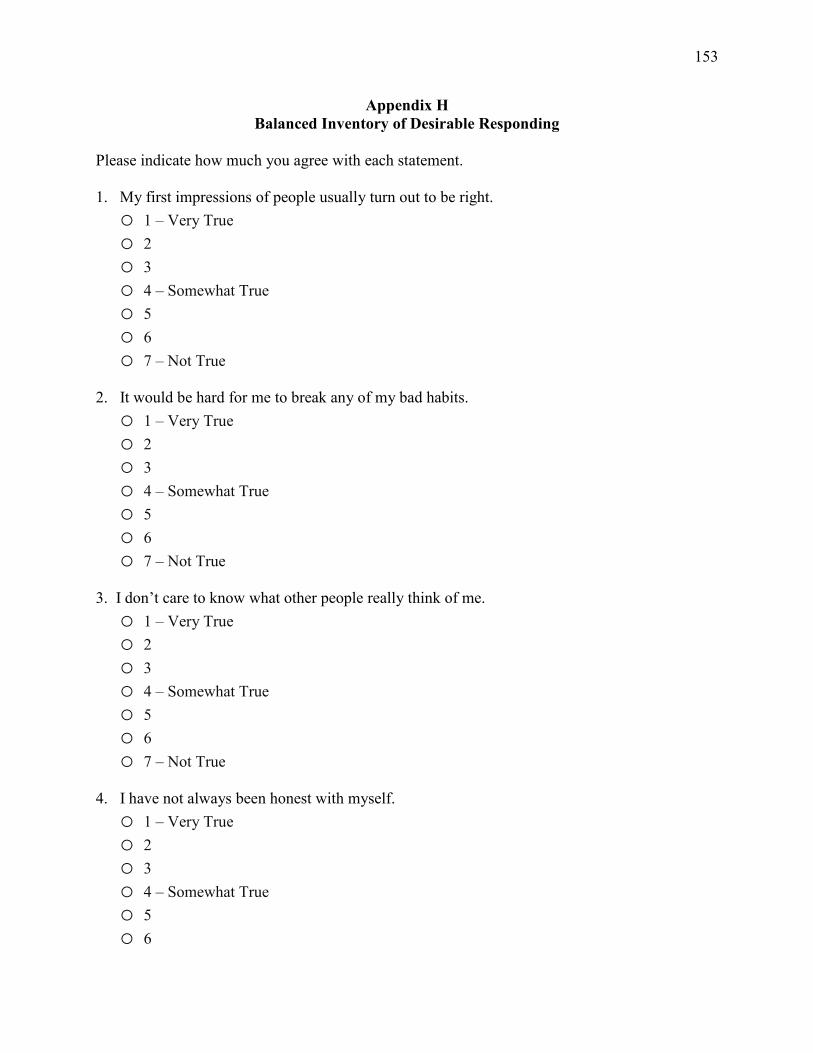
153
Appendix H Balanced Inventory of Desirable Responding
Please indicate how much you agree with each statement. 1. My first impressions of people usually turn out to be right. o 1 – Very True o 2 o 3 o 4 – Somewhat True
o 5
o 6
o 7 – Not True 2. It would be hard for me to break any of my bad habits. o 1 – Very True o 2 o 3 o 4 – Somewhat True
o 5
o 6
o 7 – Not True 3. I don’t care to know what other people really think of me. o 1 – Very True o 2 o 3 o 4 – Somewhat True
o 5
o 6
o 7 – Not True 4. I have not always been honest with myself. o 1 – Very True o 2 o 3 o 4 – Somewhat True
o 5
o 6
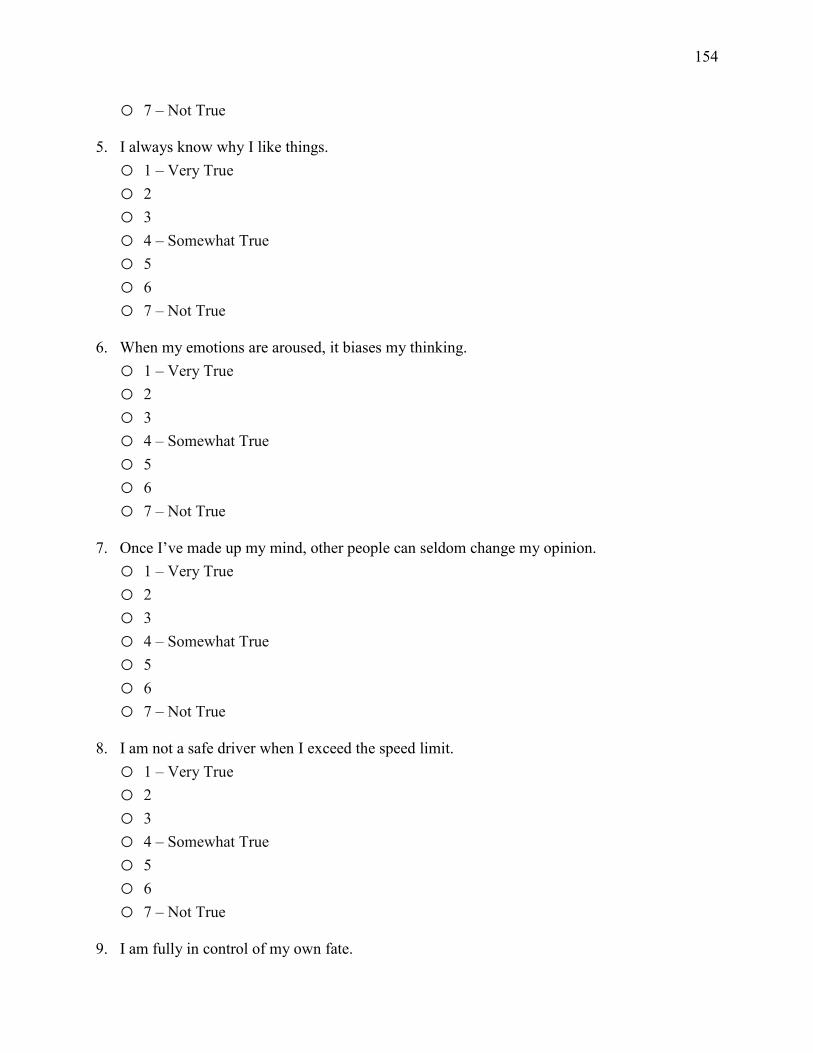
154
o 7 – Not True 5. I always know why I like things. o 1 – Very True o 2 o 3 o 4 – Somewhat True
o 5
o 6
o 7 – Not True 6. When my emotions are aroused, it biases my thinking. o 1 – Very True o 2 o 3 o 4 – Somewhat True
o 5
o 6
o 7 – Not True 7. Once I’ve made up my mind, other people can seldom change my opinion. o 1 – Very True o 2 o 3 o 4 – Somewhat True
o 5
o 6
o 7 – Not True 8. I am not a safe driver when I exceed the speed limit. o 1 – Very True o 2 o 3 o 4 – Somewhat True
o 5
o 6
o 7 – Not True 9. I am fully in control of my own fate.
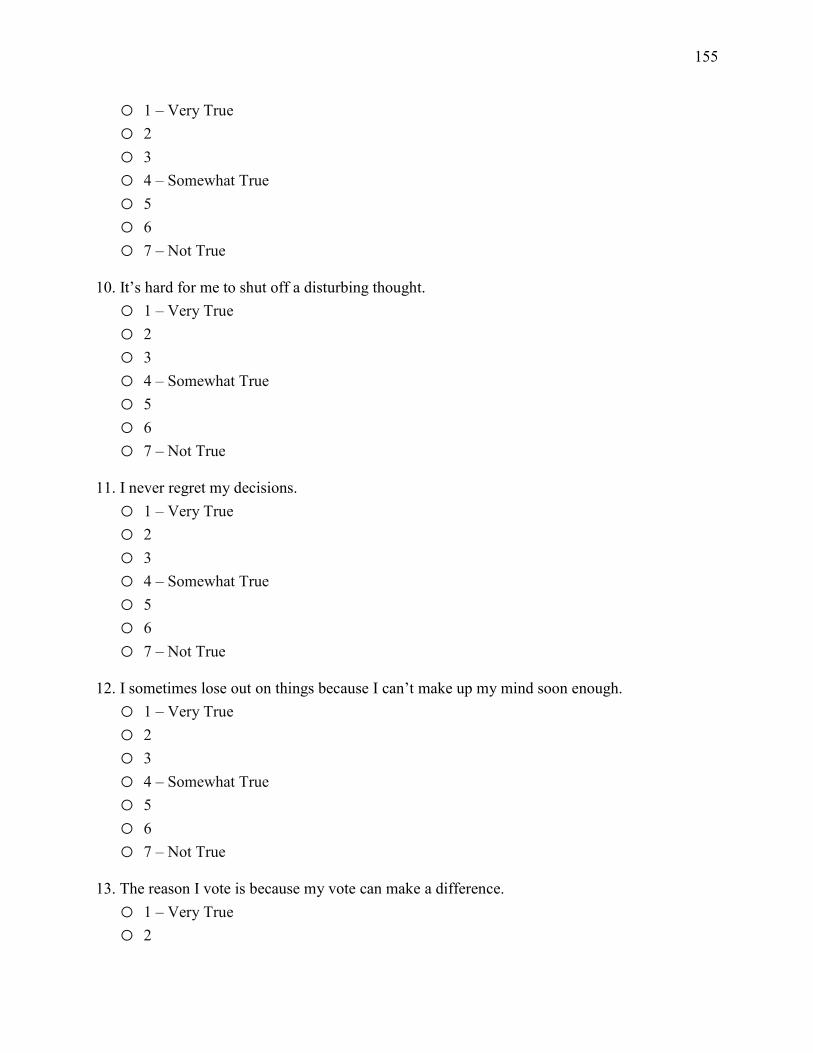
155
o 1 – Very True o 2 o 3 o 4 – Somewhat True
o 5
o 6
o 7 – Not True 10. It’s hard for me to shut off a disturbing thought. o 1 – Very True o 2 o 3 o 4 – Somewhat True
o 5
o 6
o 7 – Not True 11. I never regret my decisions. o 1 – Very True o 2 o 3 o 4 – Somewhat True
o 5
o 6
o 7 – Not True 12. I sometimes lose out on things because I can’t make up my mind soon enough. o 1 – Very True o 2 o 3 o 4 – Somewhat True
o 5
o 6
o 7 – Not True 13. The reason I vote is because my vote can make a difference. o 1 – Very True o 2
156
o 3 o 4 – Somewhat True
o 5
o 6
o 7 – Not True 14. My parents were not always fair when they punished me. o 1 – Very True o 2 o 3 o 4 – Somewhat True
o 5
o 6
o 7 – Not True 15. I am a completely rational person. o 1 – Very True o 2 o 3 o 4 – Somewhat True
o 5
o 6
o 7 – Not True 16. I rarely appreciate criticism. o 1 – Very True o 2 o 3 o 4 – Somewhat True
o 5
o 6
o 7 – Not True 17. I am very confident of my judgments. o 1 – Very True o 2 o 3
157
o 4 – Somewhat True
o 5
o 6
o 7 – Not True 18. I have sometimes doubted my ability as a lover. o 1 – Very True o 2 o 3 o 4 – Somewhat True
o 5
o 6
o 7 – Not True 19. It’s all right with me if some people happen to dislike me. o 1 – Very True o 2 o 3 o 4 – Somewhat True
o 5
o 6
o 7 – Not True 20. I don’t always know the reasons why I do the things I do. o 1 – Very True o 2 o 3 o 4 – Somewhat True
o 5
o 6
o 7 – Not True 21. I sometimes tell lies if I have to. o 1 – Very True o 2 o 3 o 4 – Somewhat True
o 5
158
o 6
o 7 – Not True 22. I never cover up my mistakes. o 1 – Very True o 2 o 3 o 4 – Somewhat True
o 5
o 6
o 7 – Not True 23. There have been occasions when I have taken advantage of someone. o 1 – Very True o 2 o 3 o 4 – Somewhat True
o 5
o 6
o 7 – Not True 24. I never swear. o 1 – Very True o 2 o 3 o 4 – Somewhat True
o 5
o 6
o 7 – Not True 25. I sometimes try to get even rather than forgive and forget. o 1 – Very True o 2 o 3 o 4 – Somewhat True
o 5
o 6
o 7 – Not True
159
26. I always obey laws, even if I’m unlikely to get caught. o 1 – Very True o 2 o 3 o 4 – Somewhat True
o 5
o 6
o 7 – Not True 27. I have said something bad about a friend behind his or her back. o 1 – Very True o 2 o 3 o 4 – Somewhat True
o 5
o 6
o 7 – Not True 28. When I hear people talking privately, I avoid listening. o 1 – Very True o 2 o 3 o 4 – Somewhat True
o 5
o 6
o 7 – Not True 29. I have received too much change from a salesperson without telling him or her. o 1 – Very True o 2 o 3 o 4 – Somewhat True
o 5
o 6
o 7 – Not True 30. I always declare everything at customs. o 1 – Very True
160
o 2 o 3 o 4 – Somewhat True
o 5
o 6
o 7 – Not True 31. When I was young I sometimes stole things. o 1 – Very True o 2 o 3 o 4 – Somewhat True
o 5
o 6
o 7 – Not True 32. I have never dropped litter on the street. o 1 – Very True o 2 o 3 o 4 – Somewhat True
o 5
o 6
o 7 – Not True 33. I sometimes drive faster than the speed limit. o 1 – Very True o 2 o 3 o 4 – Somewhat True
o 5
o 6
o 7 – Not True 34. I never read sexy books or magazines. o 1 – Very True o 2 o 3
161
o 4 – Somewhat True
o 5
o 6
o 7 – Not True 35. I have done things that I don’t tell other people about. o 1 – Very True o 2 o 3 o 4 – Somewhat True
o 5
o 6
o 7 – Not True 36. I never take things that don’t belong to me. o 1 – Very True o 2 o 3 o 4 – Somewhat True
o 5
o 6
o 7 – Not True 37. I have taken sick-leave from work or school even though I wasn’t really sick. o 1 – Very True o 2 o 3 o 4 – Somewhat True
o 5
o 6
o 7 – Not True 38. I have never damaged a library book or store merchandise without reporting it. o 1 – Very True o 2 o 3 o 4 – Somewhat True
o 5
162
o 6
o 7 – Not True 39. I have some pretty awful habits. o 1 – Very True o 2 o 3 o 4 – Somewhat True
o 5
o 6
o 7 – Not True 40. I don’t gossip about other people’s business. o 1 – Very True o 2 o 3 o 4 – Somewhat True
o 5
o 6
o 7 – Not True
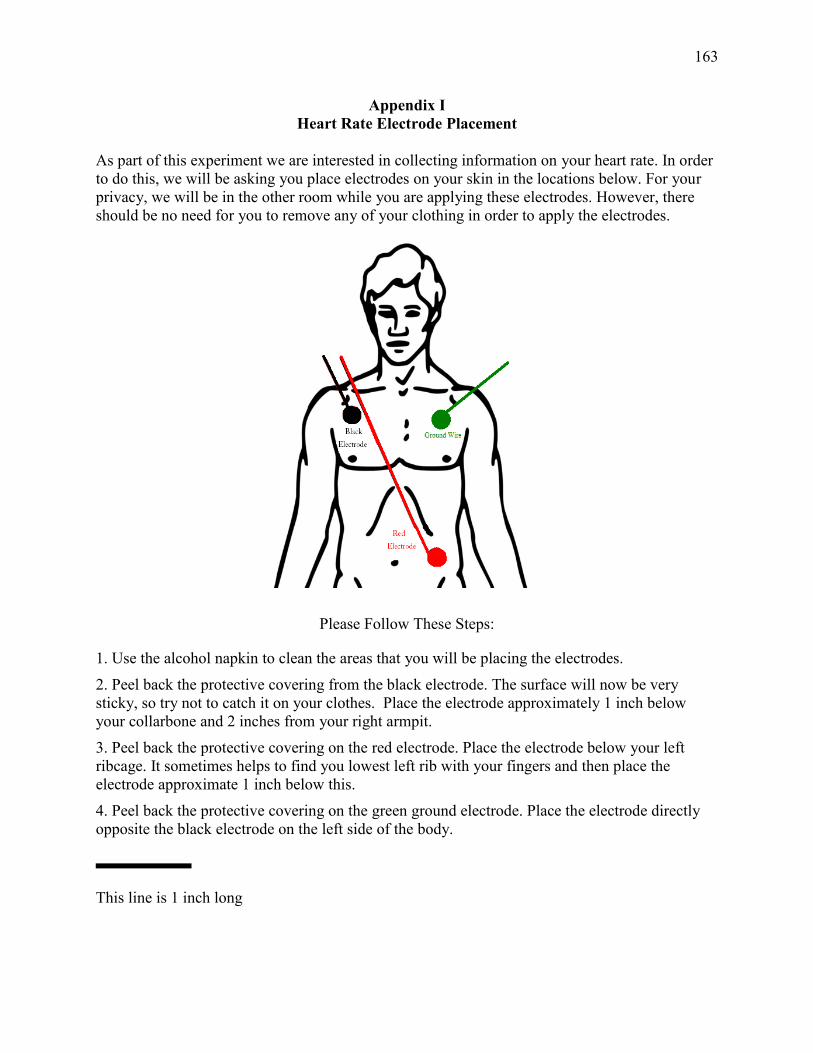
163
Appendix I Heart Rate Electrode Placement
As part of this experiment we are interested in collecting information on your heart rate. In order to do this, we will be asking you place electrodes on your skin in the locations below. For your privacy, we will be in the other room while you are applying these electrodes. However, there should be no need for you to remove any of your clothing in order to apply the electrodes.
Please Follow These Steps:
1. Use the alcohol napkin to clean the areas that you will be placing the electrodes. 2. Peel back the protective covering from the black electrode. The surface will now be very sticky, so try not to catch it on your clothes. Place the electrode approximately 1 inch below your collarbone and 2 inches from your right armpit. 3. Peel back the protective covering on the red electrode. Place the electrode below your left ribcage. It sometimes helps to find you lowest left rib with your fingers and then place the electrode approximate 1 inch below this. 4. Peel back the protective covering on the green ground electrode. Place the electrode directly opposite the black electrode on the left side of the body.
This line is 1 inch long
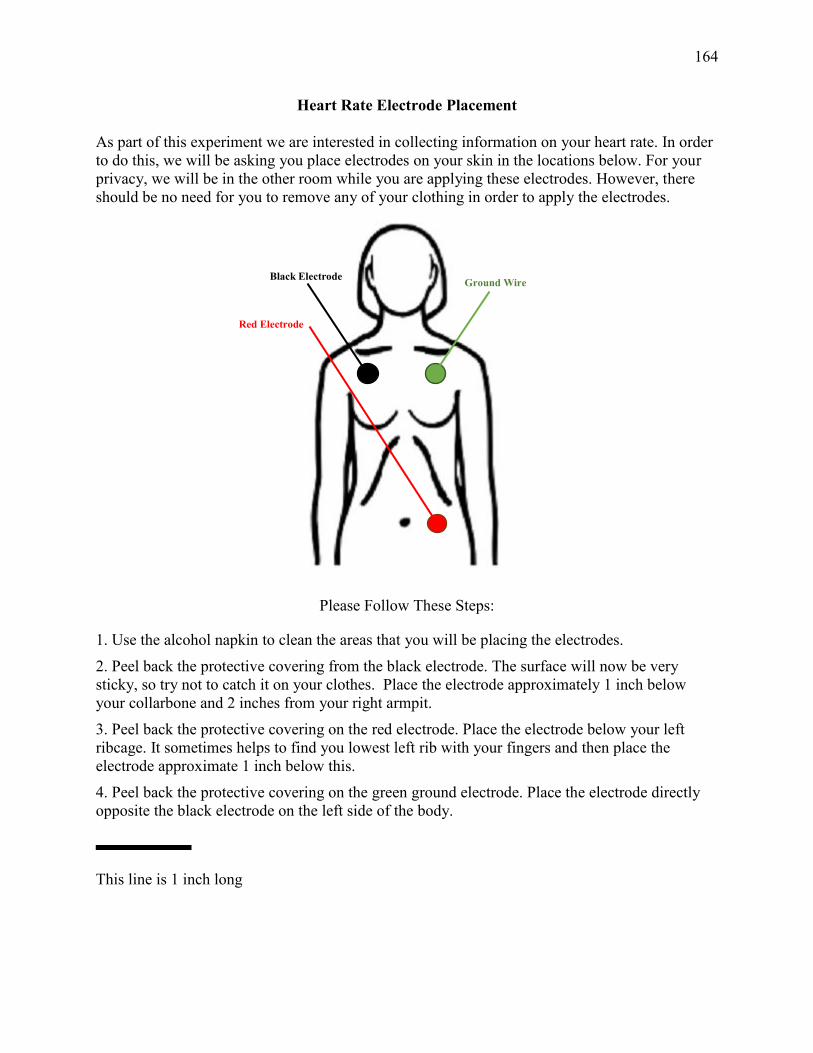
164
Heart Rate Electrode Placement
As part of this experiment we are interested in collecting information on your heart rate. In order to do this, we will be asking you place electrodes on your skin in the locations below. For your privacy, we will be in the other room while you are applying these electrodes. However, there should be no need for you to remove any of your clothing in order to apply the electrodes.
Please Follow These Steps:
1. Use the alcohol napkin to clean the areas that you will be placing the electrodes. 2. Peel back the protective covering from the black electrode. The surface will now be very sticky, so try not to catch it on your clothes. Place the electrode approximately 1 inch below your collarbone and 2 inches from your right armpit. 3. Peel back the protective covering on the red electrode. Place the electrode below your left ribcage. It sometimes helps to find you lowest left rib with your fingers and then place the electrode approximate 1 inch below this. 4. Peel back the protective covering on the green ground electrode. Place the electrode directly opposite the black electrode on the left side of the body.
This line is 1 inch long
Ground Wire
Red Electrode
Black Electrode

165
Appendix J IAT Target Concept Images
Natural Images

166
Nonnatural Images

167
Low-Calorie Images
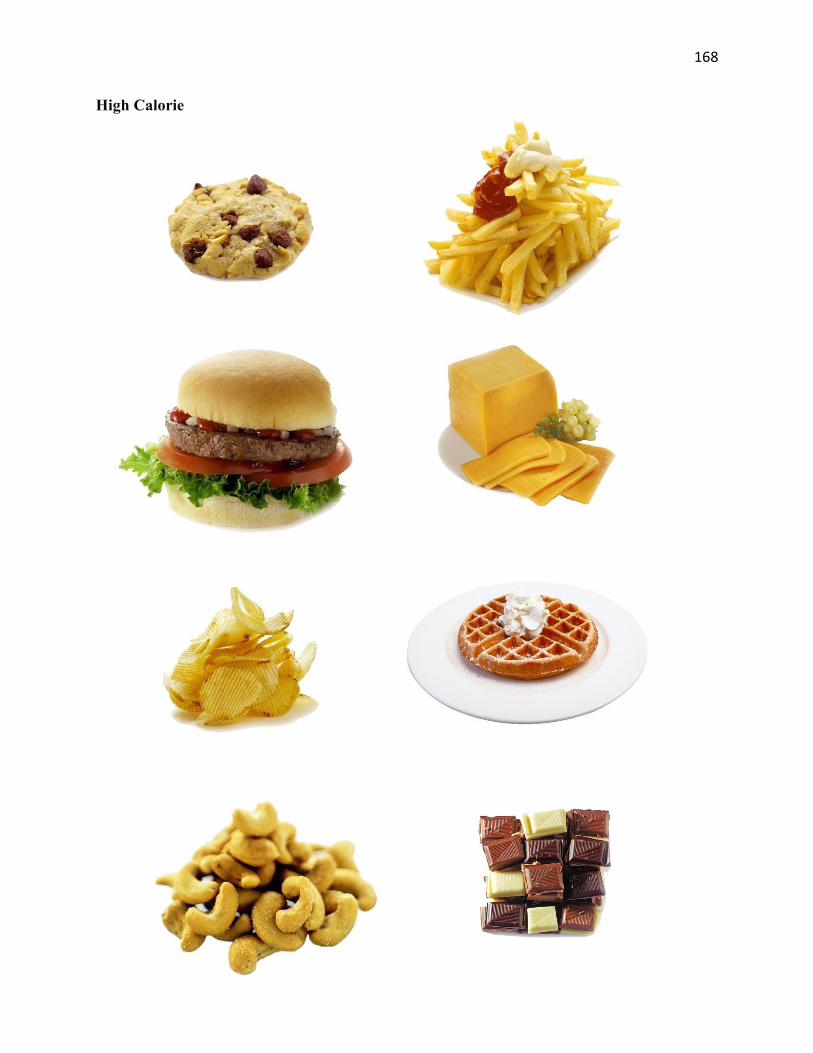
168
High Calorie

169
Appendix K Selected Screenshots of the Shopping Task