Is it over yet? (Perspectives on the Med Mal Crisis) Robert J. Walling III, FCAS, MAAA 2006 CAS...
21
Is it over yet? (Perspectives on the Med Mal Crisis) Robert J. Walling III, FCAS, MAAA 2006 CAS Spring Meeting May 9, 2006
-
Upload
arron-thompson -
Category
Documents
-
view
214 -
download
1
Transcript of Is it over yet? (Perspectives on the Med Mal Crisis) Robert J. Walling III, FCAS, MAAA 2006 CAS...

Is it over yet?(Perspectives on the Med Mal Crisis)
Robert J. Walling III, FCAS, MAAA
2006 CAS Spring Meeting
May 9, 2006


From Where’s Perspective

Historical, Cyclical Swings
60%
70%
80%
90%
100%
110%
120%
130%
140%
150%
160%
1981 1982 1983 1984 1985 1986 1987 1988 1989 1990 1991 1992 1993 1994 1995 1996 1997 1998 1999 2000 2001 2002 2003
Year
Ne
t O
pe
rati
ng
Rati
o
Medical Malpractice All Lines Homeowners Workers Compensation Other Liability Private Passenger AL
Note 5 Year change!
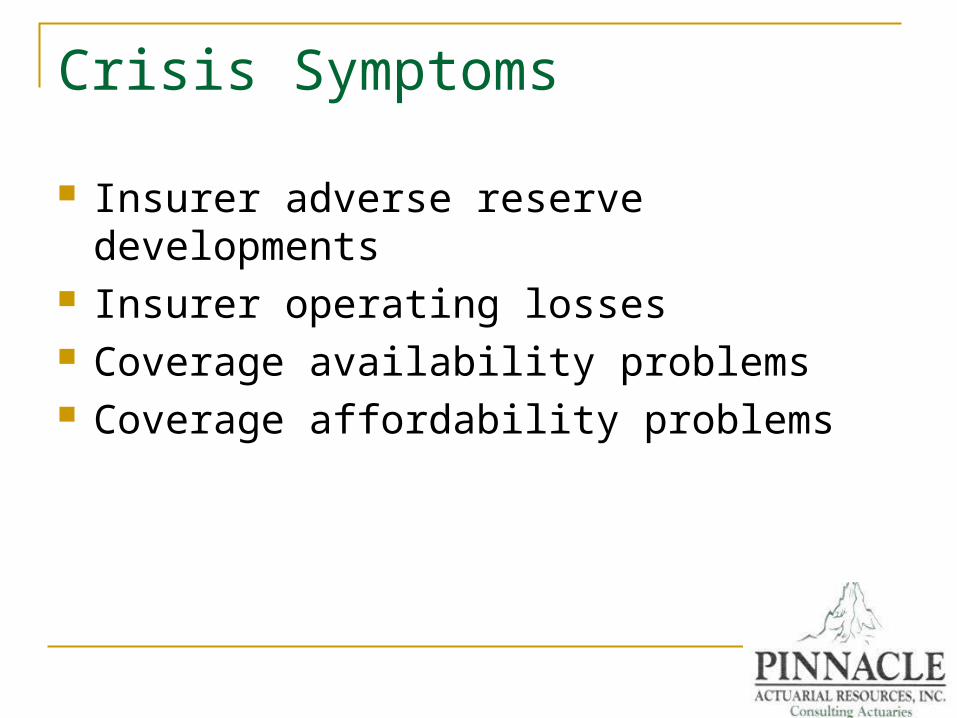
Crisis Symptoms
Insurer adverse reserve developments Insurer operating losses Coverage availability problems Coverage affordability problems

Industry Reserve Development
0
1,000
2,000
3,000
4,000
5,000
6,000
7,000
8,000
1981 1982 1983 1984 1985 1986 1987 1988 1989 1990 1991 1992 1993 1994 1995 1996 1997 1998 1999 2000 2001 2002 2003
Original Held Mature Evaluation

Widespread, but not Uniform

2005 Reserve Developments for Insurers in “Crisis States”
Report Year ProAssurance Doctors Co. ISMIE
Physicians Ins. Mut.
Northwest Phys.
Healthcare Svcs Grp.
State Volunteer
One Year 1996 -2,353 -198 3,050 48 33 0 -2,214Reserve 1997 -1,541 -175 -2,174 54 25 0 1,078Development 1998 1,206 -128 2,952 708 50 -250 4,610
1999 375 -136 7,976 -652 -7 413 6622000 -283 -1,625 465 854 -373 -223 -3,8762001 4,178 -9,970 371 -1,180 203 -2 -2,8542002 -713 642 -1,041 1,284 -833 -526 2,0512003 -14,120 -4,869 -1,912 149 -813 -4,616 5,8682004 -10,544 -23,885 -10,113 -1,724 -191 -2,062 -678
Report Year FPIC MAG Mutual
Med Mutual MD
Med Mutual NC ProMutual
Ct. Medical Ins Co.
Med Assurance MS
One Year 1996 -984 -928 -362 14 -407 -994 -52Reserve 1997 2,849 -393 -147 -280 238 271 379Development 1998 4,528 4,267 -716 6 599 -973 -294
1999 2,631 1,894 -859 -261 574 -3,646 2,1242000 -219 -168 660 582 2,419 -4,144 1882001 6,821 -2,738 -4,426 1,680 494 -3,519 -1,4782002 6,766 5,937 -3,108 -1,201 5,315 -4,762 6,9552003 -6,465 -7,508 -8,912 -551 8,328 -141 3,9572004 -27,098 -10,491 -5,602 -2,328 7,529 -2,120 822

Schedule P Held Loss & DCC Ratios for Insurers in “Crisis States”Report
Year ProAssurance Doctors Co. ISMIEPhysicians Ins. Mut.
Northwest Phys.
Healthcare Svcs Grp.
State Volunteer FPIC MAG Mutual ProMutual
Held Net 1996 93.3% 93.0% 101.8% 93.7% 89.7% 95.8% 89.8% 78.7% 85.5% 76.6% 96.4% 119.6% 100.4% 76.5%Loss & DCC 1997 105.9% 82.2% 107.4% 115.7% 136.2% 95.4% 110.1% 110.9% 86.4% 60.5% 91.1% 131.7% 104.1% 96.7%Ratios 1998 104.8% 92.2% 131.5% 108.9% 129.2% 97.4% 116.4% 109.6% 115.1% 77.6% 64.7% 173.4% 121.2% 126.1%
1999 101.3% 71.6% 137.0% 109.7% 141.5% 158.1% 98.8% 96.2% 111.8% 102.1% 80.6% 119.9% 141.4% 191.2%2000 101.0% 106.4% 115.4% 106.9% 180.9% 122.5% 101.3% 133.6% 116.4% 111.8% 75.2% 158.1% 171.9% 123.5%2001 97.8% 116.5% 128.4% 138.9% 133.5% 7.9% 126.3% 104.6% 128.2% 117.8% 78.6% 153.6% 204.3% 176.5%2002 82.4% 70.9% 121.7% 103.6% 104.3% 123.7% 111.8% 84.0% 98.6% 115.8% 68.8% 149.6% 156.1% 181.0%2003 81.9% 73.6% 91.0% 78.5% 90.2% 84.8% 94.4% 66.8% 84.7% 109.5% 74.6% 132.6% 130.8% 130.4%2004 78.6% 60.7% 79.6% 74.8% 82.4% 62.6% 83.1% 60.2% 85.2% 106.4% 71.1% 96.7% 117.4% 83.9%2005 75.1% 62.0% 88.4% 69.4% 72.3% 76.6% 79.6% 70.6% 83.4% 82.7% 67.1% 87.5% 172.8% 54.9%
Report Year FPIC MAG Mutual
Med Mutual MD
Med Mutual NC ProMutual
Ct. Medical Ins Co.
Med Assurance MS
Held Net 1996 78.7% 85.5% 76.6% 96.4% 119.6% 100.4% 76.5%Loss & DCC 1997 110.9% 86.4% 60.5% 91.1% 131.7% 104.1% 96.7%Ratios 1998 109.6% 115.1% 77.6% 64.7% 173.4% 121.2% 126.1%
1999 96.2% 111.8% 102.1% 80.6% 119.9% 141.4% 191.2%2000 133.6% 116.4% 111.8% 75.2% 158.1% 171.9% 123.5%2001 104.6% 128.2% 117.8% 78.6% 153.6% 204.3% 176.5%2002 84.0% 98.6% 115.8% 68.8% 149.6% 156.1% 181.0%2003 66.8% 84.7% 109.5% 74.6% 132.6% 130.8% 130.4%2004 60.2% 85.2% 106.4% 71.1% 96.7% 117.4% 83.9%2005 70.6% 83.4% 82.7% 67.1% 87.5% 172.8% 54.9%

Schedule P Held Loss & DCC Ratios for Insurers in “Crisis States”
50.0%
75.0%
100.0%
125.0%
150.0%
175.0%
200.0%
1999 2000 2001 2002 2003 2004 2005
ProAssurance ISMIE Physicians Ins. Mut. Northwest Phys. State Volunteer
FPIC MAG Mutual Med Mutual MD ProMutual Med Assurance of MS

Market Concentrations
Measured using HHI (Herfindahl-Hirschman Index) Sum the square of the market share of each firm in a market The index can range from 0 to 10,000 0 = Perfect competition 10,000 = Perfect Monopoly U.S. Department of Justice considers a result of
less than 1,000 to be a competitive marketplace 1,000-1,800 to be a moderately concentrated marketplace 1,800 or greater to be a highly concentrated marketplace
Used by some regulators to determine rate regulation


Market Concentrations in “Crisis States”1999 2000 2001 2002 2003 2004 Annual
HHI HHI HHI HHI HHI HHI Exponential ChangeState Index Index Index Index Index Index Trend 2003-04
AR 3,132 3,413 2,807 1,752 2,446 2,316 -11.0% -5.3%CT 2,241 2,020 1,829 1,491 1,479 1,636 -10.7% 10.6%FL 986 882 891 1,013 1,110 1,318 3.8% 18.8%GA 2,036 1,833 2,110 1,684 2,094 2,149 -0.3% 2.6%IL 2,860 2,226 2,705 2,507 3,321 3,409 4.3% 2.6%KY 1,615 1,403 1,275 1,004 1,357 1,255 -6.6% -7.5%MA 5,519 5,579 4,689 3,670 3,474 2,874 -12.6% -17.3%MS 2,271 2,430 2,150 1,786 2,837 2,887 1.4% 1.8%MO 1,138 974 882 822 1,070 992 -2.9% -7.2%NV 2,100 2,103 1,815 945 891 1,406 -22.2% 57.8%NJ 4,321 4,156 3,089 3,797 2,491 2,188 -11.2% -12.1%NY 3,443 3,472 3,184 3,557 3,143 2,754 -1.6% -12.4%NC 2,022 2,111 1,391 1,350 1,337 1,427 -12.0% 6.7%OH 1,407 1,381 1,116 1,310 1,297 1,317 -2.1% 1.5%OR 1,599 1,872 1,722 1,803 1,817 1,923 2.2% 5.9%PA 1,568 1,730 1,253 1,114 1,374 750 -6.8% -45.4%RI 2,705 2,826 2,414 2,468 3,006 2,824 0.8% -6.0%TN 3,254 3,075 2,464 2,446 2,379 2,926 -8.2% 23.0%WA 3,767 3,955 3,285 2,399 2,408 2,012 -13.0% -16.4%WV 3,099 2,875 2,788 1,797 1,127 1,169 -22.1% 3.7%WY 3,264 3,518 3,596 3,054 3,377 2,502 -0.7% -25.9%
Data Sources: 2004 Direct Written Premium: A.M. Best Page 15 data.

A Call for Efficiency

A Call for Greater Efficiency
Thecurrent
system iswoefully
inefficient
0%
10%
20%
30%
40%
50%
60%
70%
80%
90%
100%
Medical Malpractice Group A & H Private PassengerAuto Liability
WorkersCompensation
Line of Business
Per
cent
age
of In
sure
r E
xpen
ses
Losses ( Claimants' Share) Losses ( Attorneys' Share) ALAEULAE Commissions Taxes, Licenses & Fees Other Acquisition Expense General Expenses

VA BRNICP Efficiency
0%
10%
20%
30%
40%
50%
60%
70%
80%
90%
100%
Supplier Goods and Services
Staff Salary
Patient Legal Costs
Other Patient Benefits
Patient Insurance Costs
Housing & Assistive Technology
Prescriptions & Medical Equipment
Hospital & Medical Services
Transportation
Home Nursing
PatientBenefits

Tort Reforms Impact on Efficiency Damage caps by themselves do not improve
system efficiency Other elements of MICRA should help Some newer reforms may help too
Attorney fee caps Birth Related Neurological Injury Funds (NICA) Prelitigation screening “I’m Sorry’ laws
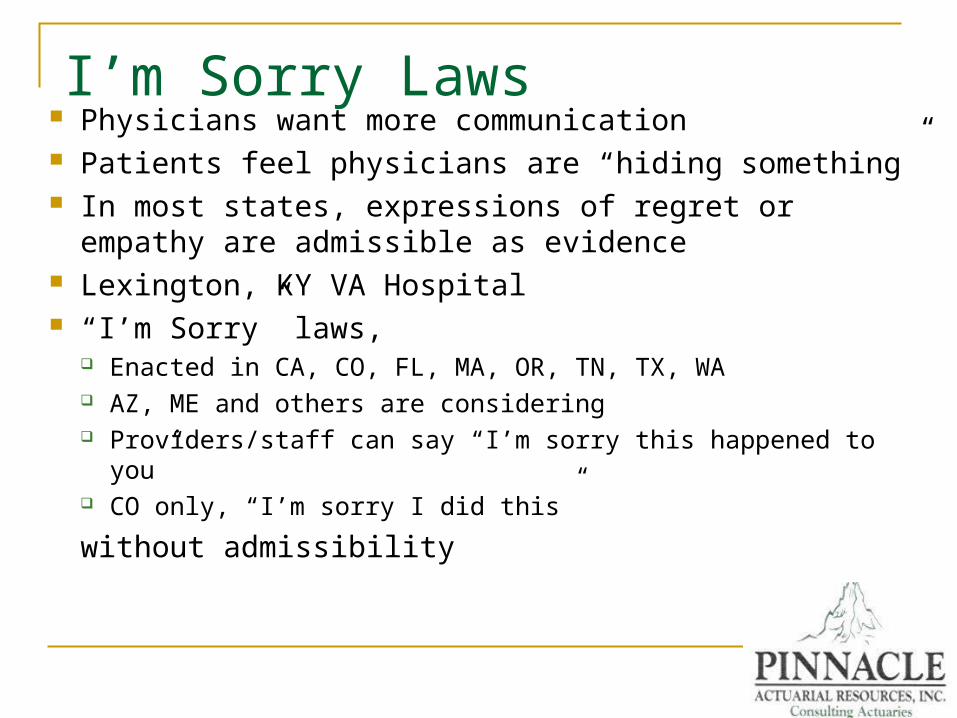
I’m Sorry Laws Physicians want more communication Patients feel physicians are “hiding something” In most states, expressions of regret or empathy are
admissible as evidence Lexington, KY VA Hospital “I’m Sorry” laws,
Enacted in CA, CO, FL, MA, OR, TN, TX, WA AZ, ME and others are considering Providers/staff can say “I’m sorry this happened to you” CO only, “I’m sorry I did this”
without admissibility

I’m Sorry Laws Insurers are:
Training providers on how to apologize (mandatory) Coordinating with claims
Initial results are significant Reduced severities Reduced loss adjustment expense Reduced attorney involvement
(CO: 2 lawsuits in 433 claims) Improved patient satisfaction In many cases, much improved efficiency

Impact of “I’m Sorry” Laws Focus on claims <$35,000 Company’s can match apology with aggressive
claims settlement strategy (e.g. COPIC) Increase efficiency at all costs (including higher
pure loss severity) Reduces ALAE on small claims 35-65%
(3.5%-6.0% cost reduction overall) Actually increases small claimant net damages

YearState Enacted Bill Notes
AZ 2005 SB 1036 Acts of Apology and Responsibility
CA 2001 Acts of Sympathy
CO 2003 HB 1232 Acts of Apology, Sympathy and Fault
FL 2004 90.4026 Acts of Sympathy
GA 2005 Acts of Apology and Regret
IL 2005 HB 4847Acts of Apology and Explanation, with 72 Hour Time Limit
IA2006
PendingHB 2716 Acts of Apology and Sympathy
MA 1986/2005 Acts of Apology and Regret
MI2006
PendingHB 4259 Acts of Apology and Sympathy
MT 2005 HB 24 Acts of Apology and Sympathy
NC 2004 HB 669Acts of Apology. Allows offers to undertake corrective or remedial treatment or actions, and gratuitous acts
OH 2004 HB 215 Acts of Apology and Sympathy
OK 2004 HB 2661 Acts of Apology and Sympathy
OR 2003 HB 3361 Acts of Apology and Regret
TN 2003 Acts of Sympathy
TX 1999 Acts of Sympathy
VA 2005 Acts of Sympathy
VT
WA 2004 SB 6645 Acts of Apology
WY 2004HB 1004 / SB
Acts of Apology and Explanation
Case Law provides immunity for apologies
Survey of “I’m Sorry” Laws by State