Optimize Your Data Protection Investment for Bottom Line Results.
Upload
is-yatirimCategory
view
189download
2
PERFORMANCE & FINANCIAL RESULTS – 9M12 19 November 2012

Performance & Financial
Results – 9M12
1
About Us
Turkish Capital Markets
Our Performance
Financial Results
Expectations
2 About Us
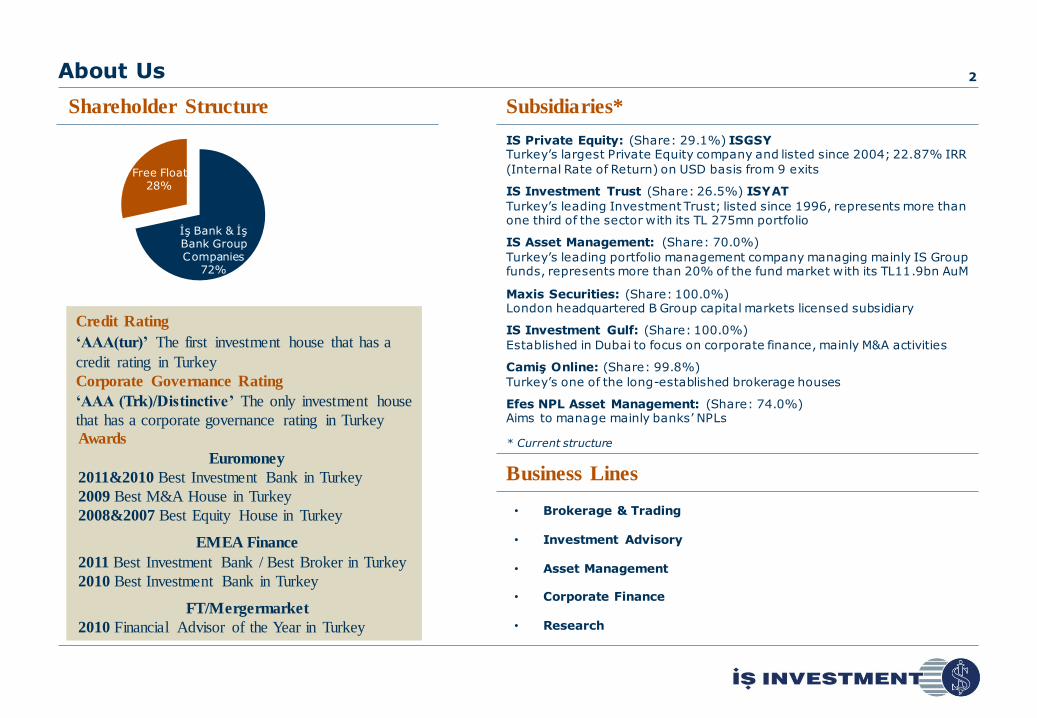
İş Bank & İş Bank Group Companies
72%
Free Float 28%
Shareholder Structure Subsidiaries*
• Brokerage & Trading
• Investment Advisory
• Asset Management
• Corporate Finance
• Research
Business Lines
Credit Rating
‘AAA(tur)’ The first investment house that has a
credit rating in Turkey
Corporate Governance Rating
‘AAA (Trk)/Distinctive’ The only investment house
that has a corporate governance rating in Turkey
Awards
Euromoney
2011&2010 Best Investment Bank in Turkey
2009 Best M&A House in Turkey
2008&2007 Best Equity House in Turkey
EMEA Finance
2011 Best Investment Bank / Best Broker in Turkey
2010 Best Investment Bank in Turkey
FT/Mergermarket
2010 Financial Advisor of the Year in Turkey
IS Private Equity: (Share: 29.1%) ISGSY Turkey’s largest Private Equity company and listed since 2004; 22.87% IRR
(Internal Rate of Return) on USD basis from 9 exits
IS Investment Trust (Share: 26.5%) ISYAT
Turkey’s leading Investment Trust; listed since 1996, represents more than one third of the sector with its TL 275mn portfolio
IS Asset Management: (Share: 70.0%)
Turkey’s leading portfolio management company managing mainly IS Group funds, represents more than 20% of the fund market with its TL11.9bn AuM
Maxis Securities: (Share: 100.0%) London headquartered B Group capital markets licensed subsidiary
IS Investment Gulf: (Share: 100.0%)
Established in Dubai to focus on corporate finance, mainly M&A activities
Camiş Online: (Share: 99.8%)
Turkey’s one of the long-established brokerage houses
Efes NPL Asset Management: (Share: 74.0%) Aims to manage mainly banks’ NPLs
* Current structure

Performance & Financial
Results – 9M12
3
About Us
Turkish Capital Markets
Our Performance
Financial Results
Expectations

Turkish Capital Markets Trading Volume* 4
Equity Market (In TL Billion)
1.137
891
0
200
400
600
800
1000
1200
1400
2011/9 2012/9
670 592
0
100
200
300
400
500
600
700
800
900
2011/9 2012/9
* Market transactions by members
Source: ISE
Derivatives Market (In TL Billion)
Derivative market was negatively affected by the poor
volume of the equity market
Trading volume of the equity market decreased 22% with
respect to the same period of 2011 in parallel with the
global markets’ performance
Source: TurkDEX

Turkish Capital Markets Trading Volume* 5
Bills & Bonds Market (In TL Billion)
793
542
0
200
400
600
800
1000
2011/9 2012/9
4,6 4,2
0
1
2
3
4
5
6
2011/9 2012/9
(9)%
* Market transactions by members
Securities L/B Market (In TL Billion)
Lower interest rates caused 32% decrease at fixed income market when compared to same period of 2011; deposit banks’
bond IPOs also had a negative effect as they are mostly held till the maturity
Source: ISE Source: Settlement Bank
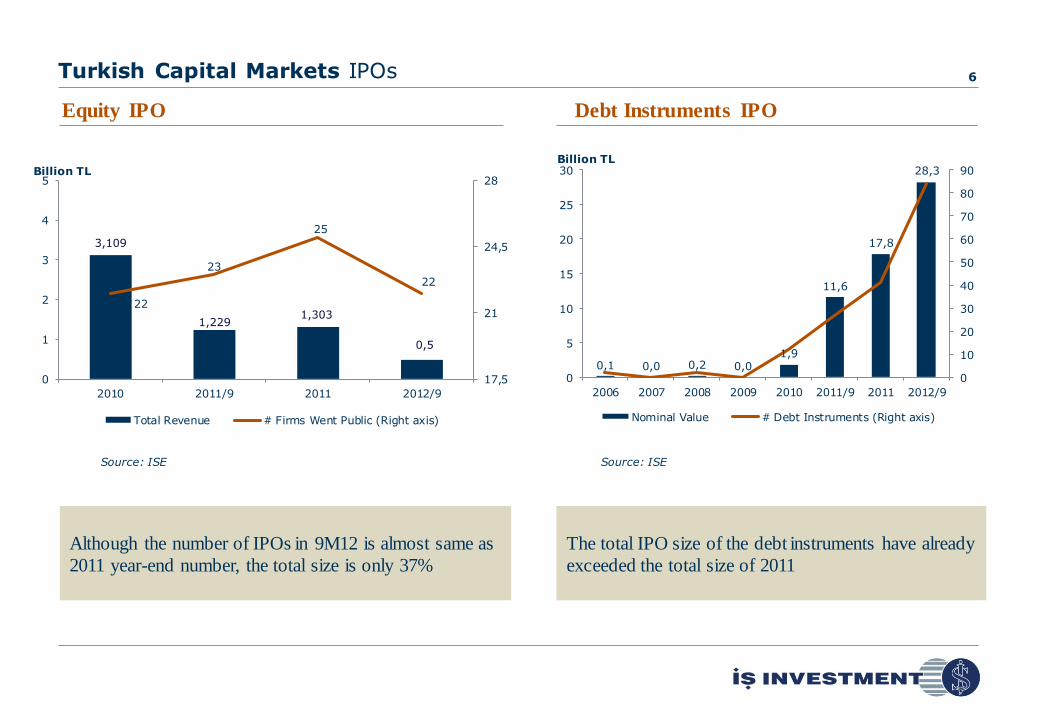
The total IPO size of the debt instruments have already
exceeded the total size of 2011
Turkish Capital Markets IPOs 6
Debt Instruments IPO Equity IPO
Source: ISE Source: ISE
Although the number of IPOs in 9M12 is almost same as
2011 year-end number, the total size is only 37%
0,1 0,0 0,2 0,0 1,9
11,6
17,8
28,3
0
10
20
30
40
50
60
70
80
90
0
5
10
15
20
25
30
2006 2007 2008 2009 2010 2011/9 2011 2012/9
Billion TL
Nominal Value # Debt Instruments (Right axis)
22
23
25
22
17,5
21
24,5
28
0
1
2
3
4
5
2010 2011/9 2011 2012/9
Billion TL
Total Revenue # Firms Went Public (Right axis)
0,5
1,303 1,229
3,109
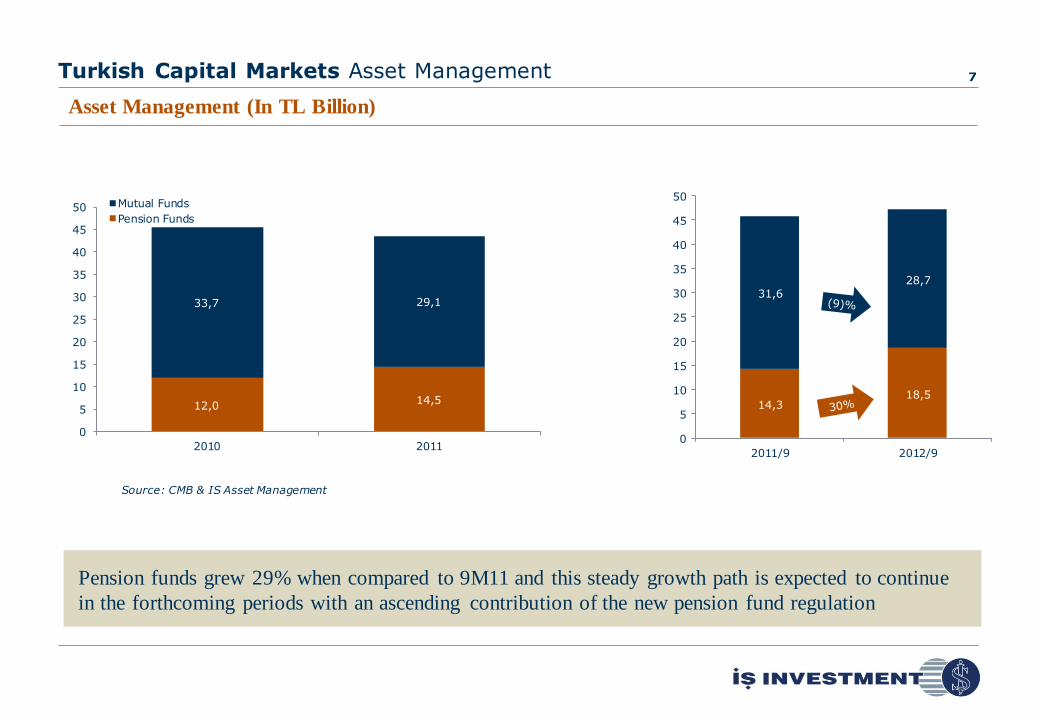
Turkish Capital Markets Asset Management 7
Source: CMB & IS Asset Management
Asset Management (In TL Billion)
14,3 18,5
31,6
28,7
0
5
10
15
20
25
30
35
40
45
50
2011/9 2012/9
Pension funds grew 29% when compared to 9M11 and this steady growth path is expected to continue
in the forthcoming periods with an ascending contribution of the new pension fund regulation
12,0 14,5
33,7 29,1
0
5
10
15
20
25
30
35
40
45
50
2010 2011
Mutual Funds
Pension Funds
Performance & Financial
Results – 9M12
8
About Us
Turkish Capital Markets
Our Performance
Financial Results
Expectations
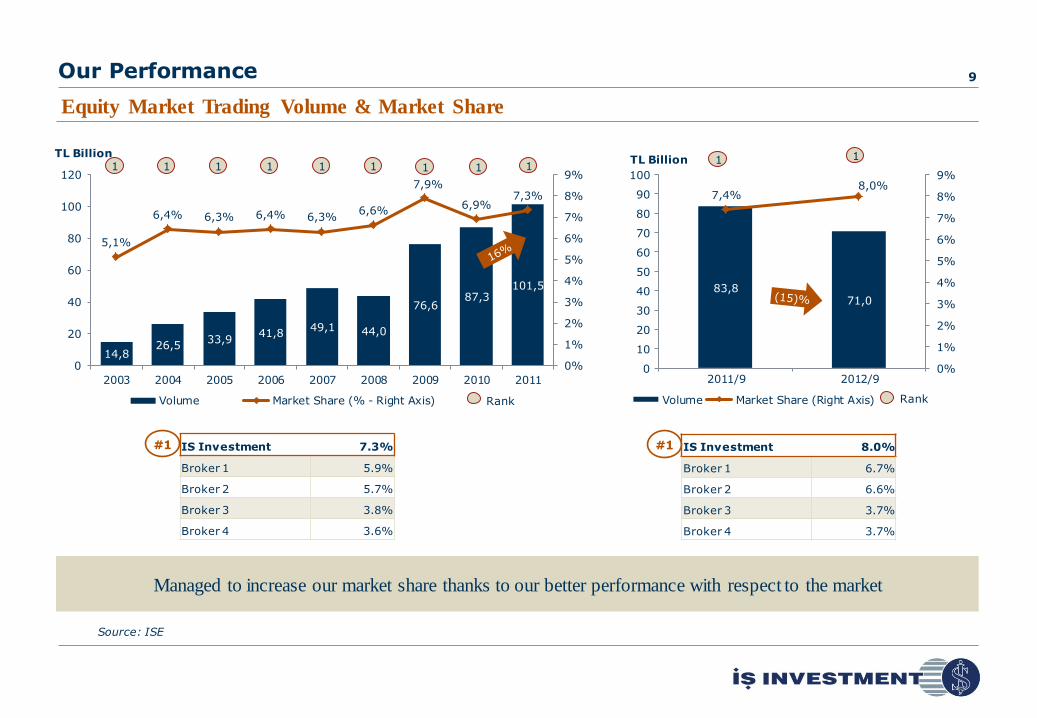
Our Performance 9
Source: ISE
IS Investment 8.0%
Broker 1 6.7%
Broker 2 6.6%
Broker 3 3.7%
Broker 4 3.7%
#1
83,8 71,0
7,4% 8,0%
0%
1%
2%
3%
4%
5%
6%
7%
8%
9%
0
10
20
30
40
50
60
70
80
90
100
2011/9 2012/9
TL Billion
Volume Market Share (Right Axis)
1 1
Rank
Managed to increase our market share thanks to our better performance with respect to the market
Equity Market Trading Volume & Market Share
14,8 26,5
33,9 41,8
49,1 44,0
76,6 87,3
101,5
5,1%
6,4% 6,3% 6,4% 6,3% 6,6%
7,9%
6,9% 7,3%
0%
1%
2%
3%
4%
5%
6%
7%
8%
9%
0
20
40
60
80
100
120
2003 2004 2005 2006 2007 2008 2009 2010 2011
TL Billion
Volume Market Share (% - Right Axis) Rank
1 1 1 1 1 1 1 1 1
IS Investment 7.3%
Broker 1 5.9%
Broker 2 5.7%
Broker 3 3.8%
Broker 4 3.6%
#1

Our Performance 10
Source: TurkDEX
IS Investment 14.8%
Broker 1 9.2%
Broker 2 5.6%
Broker 3 5.4%
Broker 4 4.4%
#1
82,9 87,8
12,4%
14,8%
0%
3%
6%
9%
12%
15%
0
20
40
60
80
100
120
2011/9 2012/9
TL Billion
Volume Market Share (Right Axis) Rank
1 1
As the largest player of the market, we increased our trading volume by 6% with a market share of 14,8%
whereas the market contracted by 12%
Derivatives Market Trading Volume & Market Share
1,5 9,0
40,0
56,9
88,4
99,3
111,1
25,2% 25,3%
16,9%
13,7%
13,2% 11,5%
12,6%
0%
5%
10%
15%
20%
25%
30%
0
20
40
60
80
100
120
2005 2006 2007 2008 2009 2010 2011
TL Billion
Volume Market Share (% - Right Axis) Rank
1 1 1 1 1 1 1
IS Investment 12.6%
Broker 1 6.3%
Broker 2 6.1%
Broker 3 4.2%
Broker 4 4.1%
#1

Our Performance 11
*Among Brokerage Houses
Source: ISE
11,2
8,6
10,7%
12,2%
0%
2%
4%
6%
8%
10%
12%
14%
0
2
4
6
8
10
12
2011/9 2012/9
TL Billion
Volume Market Share (Right Axis)
1 3
Rank
Our trading volume increased Q-o-Q in 2012 gradually but decreased Y-o-Y
Bills & Bonds Market Trading Volume and Market Share*
19,8
14,2 16,6 17,3
26,9
12,6
13,1% 11,8%
14,1% 12,9%
20,0%
10,2%
0%
5%
10%
15%
20%
25%
0
5
10
15
20
25
30
35
40
2006 2007 2008 2009 2010 2011
TL Billion
Volume Market Share (% - Right Axis) Rank
2 3 2 1 2 3

Our Performance 12
We completed 18 corporate bond IPOs with a market share of 25% in the first 9 months of the year
Corporate Bonds IPO - Size and Market Share
Source: ISE
1,5
7,9
12,7
21,3
0,4
3,7
5,1
7,0
0
5
10
15
20
25
30
2010 2011/9 2011 2012/9
TL Billion
IS Investment
Other
25%
32%
29%
25%

Our Performance 13
Source: ISE Settlement and Custody Bank Inc. & IS Investment
1.090
1.395
23,6%
33,0%
0%
4%
8%
12%
16%
20%
24%
28%
32%
36%
0
200
400
600
800
1000
1200
1400
1600
2011/9 2012/9
TL Million
Volume Market Share (Right axis)
We continue to be the most active institution in the market
Securities Lending/Borrowing Market
64 324
719
1.555 1.421 1.340
4,1%
11,5%
26,9%
37,9%
24,3% 24,9%
0%
5%
10%
15%
20%
25%
30%
35%
40%
45%
0
200
400
600
800
1000
1200
1400
1600
1800
2000
2006 2007 2008 2009 2010 2011
TL Million
Volume Market Share (% - Right axis) Rank
8 2 1 1 1 1

Our Performance 14
164,1
140,0
0
20
40
60
80
100
120
140
160
2011/9 2012/9
TL Million
Source: IS Investment, TSPAKB
Our equity margin trading size, which decreased just because of the lower trading volume of equity market,
still represents 17% of the market
Equity Margin Trading
45 34 64 60
139
492
254
468
736
826
0
100
200
300
400
500
600
700
800
900
2007 2008 2009 2010 2011
TL Million
IS Investment
Total Market
Our Performance 15
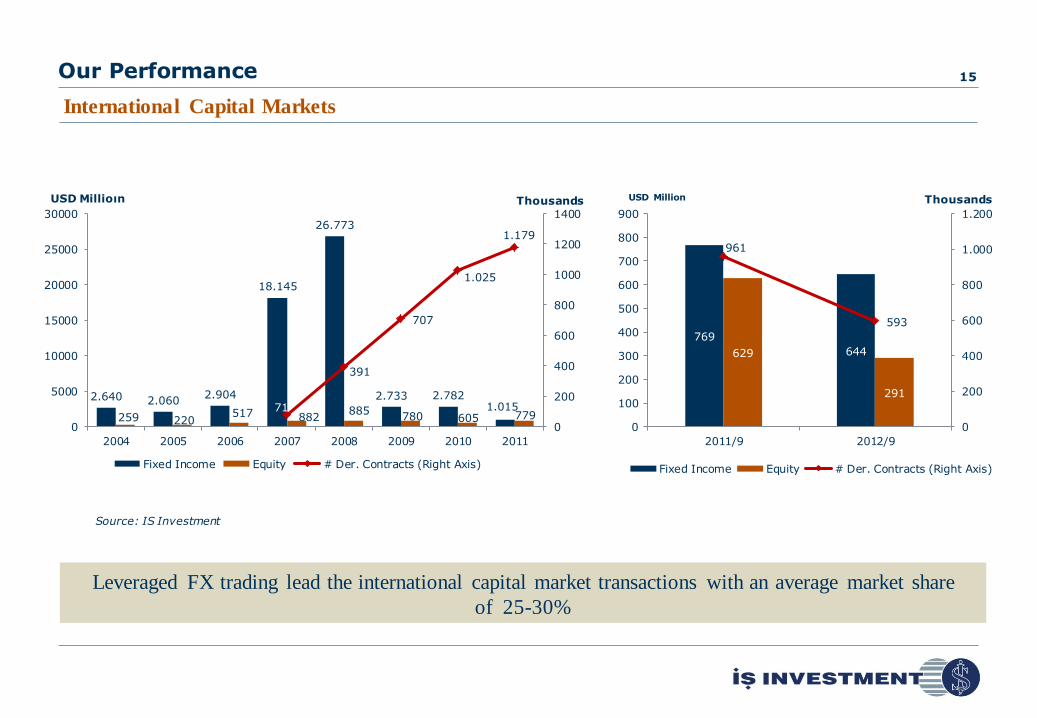
International Capital Markets
769
644 629
291
961
593
0
200
400
600
800
1.000
1.200
0
100
200
300
400
500
600
700
800
900
2011/9 2012/9
Thousands USD Million
Fixed Income Equity # Der. Contracts (Right Axis)
Source: IS Investment
2.640 2.060 2.904
18.145
26.773
2.733 2.782 1.015
259 220 517 882
885 780 605 779
71
391
707
1.025
1.179
0
200
400
600
800
1000
1200
1400
0
5000
10000
15000
20000
25000
30000
2004 2005 2006 2007 2008 2009 2010 2011
Thousands USD Millioın
Fixed Income Equity # Der. Contracts (Right Axis)
Leveraged FX trading lead the international capital market transactions with an average market share
of 25-30%
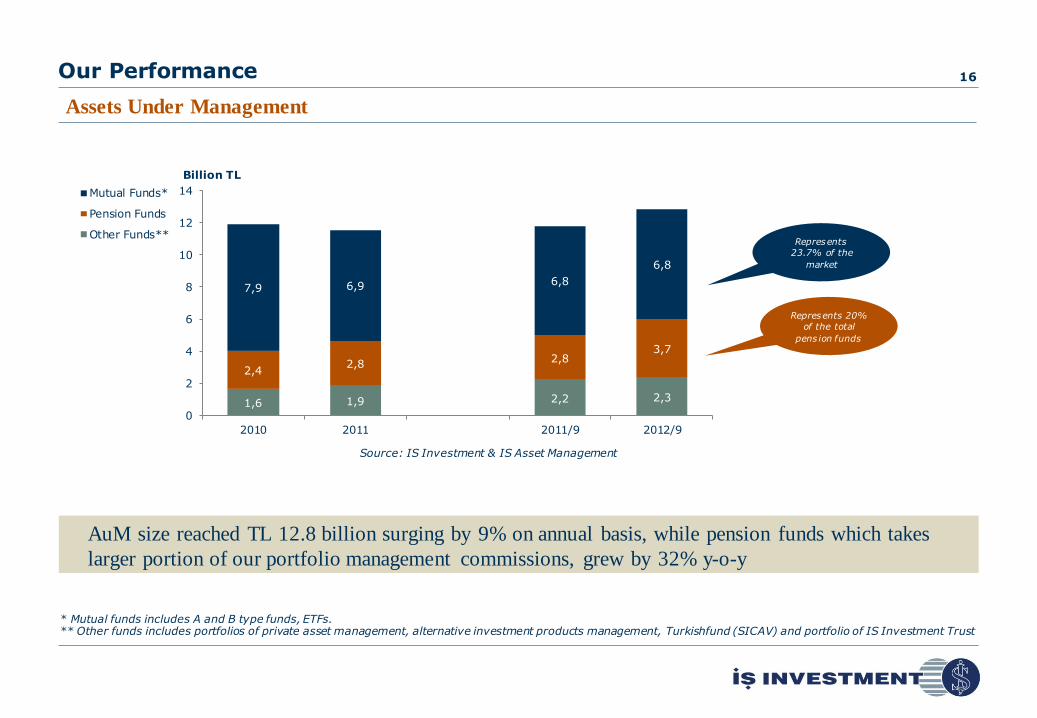
1,6 1,9 2,2 2,3
2,4 2,8
2,8 3,7
7,9 6,9 6,8
6,8
0
2
4
6
8
10
12
14
2010 2011 2011/9 2012/9
Billion TL
Mutual Funds*
Pension Funds
Other Funds**
Our Performance
AuM size reached TL 12.8 billion surging by 9% on annual basis, while pension funds which takes
larger portion of our portfolio management commissions, grew by 32% y-o-y
16
Source: IS Investment & IS Asset Management
Assets Under Management
* Mutual funds includes A and B type funds, ETFs. ** Other funds includes portfolios of private asset management, alternative investment products management, Turkishfund (SICAV) and portfolio of IS Investment Trust
Represents
23.7% of the
market
Represents 20%
of the total
pens ion funds
Performance & Financial
Results – 9M12
17
About Us
Turkish Capital Markets
Our Performance
Financial Results
Expectations

Financial Results Consolidated 18
IS Investment - Consolidated
TL (000) 9M11 9M12 YoY (%)
Total Assets 3,647,176 3,643,744 -
Shareholders' Equity 391,887 440,790 12
Net Profit 42,671 52,802 24
1.241
1.569
2.539 2.686
3.063
3.644
244 268 329 375 400 441
38,4 45,9 67,5 64,2 52,4 62,5*
19,4% 17,9%
22,5%
18,2%
13,5%
15,0%
0%
4%
8%
12%
16%
20%
24%
0
500
1.000
1.500
2.000
2.500
3.000
3.500
4.000
2007 2008 2009 2010 2011 2012/9
ROAE TL Million
Total Assets Shareholders' Equity Net Profit ROAE
Despite the poor trading volumes in the market especially in the 3rd quarter of 2012, we managed to increase our 9M12
net profit 24% with respect to the same period of 2011
* Income trailing (last 4 quarters’ net income)

24,5
38,4 36,8
45,9
55,4
67,5
46,0
64,2
42,7
52,4 52,8
?
0
10
20
30
40
50
60
70
TL Million
Financial Results Consolidated Net Profit 19
In the first 9 months of the year, we achieved to reach 2011 full-year net profit
2007 2008 2009 2010 2011 2012
9M
Full Year

Net Profit in TL 9M11 9M12 YoY (%)
IS Investment Only 36,837,252 44,041,171 20
IS Investment Trust (548,955) 9,540,834 NA
IS Private Equity 10,809,180 9,365,437 (13)
Other Subsidiaries
(Mainly IS Asset Management) 3,694,729 3,649,016 (1)
Elimination Adjustments* (8,121,012) (13,794,692) 70
Consolidated Net Profit 42,671,194 52,801,766 24
Financial Results Consolidation Effect 20
* Dividend and revenue elimination with subsidiaries
Consolidated Net Profit = [IS Investment Solo Net Profit + Contributions from Subsidiaries] – Elimination Adjustments
Contributions from Subsidiaries
Elimination Adjustments
IS Investment Solo Net Profit
Consolidated Net Profit

Interest and Trading Income
50%
Commission Income
50%
Interest and Trading Income
56% Commission
Income 44%
Financial Results Breakdown of Operating Revenues 21
Breakdown of Revenues
(TL 000) 9M11 9M12 YoY (%)
Interest and Trading Income* 84,000 121,541 45
Commission Revenues** 83,229 94,746 14
Total Operating Revenues 167,229 216,287 29
Operating Revenues – 9M11 Operating Revenues – 9M12
TL 167.2mn TL 216.3mn
Despite the volatile environment, our operating revenues kept increasing thanks to our
diversified revenue structure
* Considerable contribution from our subsidiaries to the interest & trading income ** Client based leveraged FX trading revenues, which is added to the commission revenues, can be seen under interest & derivative income at footnote 27.

Brokerage 72%
Corporate Finance
6%
Asset Management
21%
Other Commissions
1%
Brokerage 75% Corporate
Finance 6%
Asset Management
18%
Other Commissions
1%
Financial Results Breakdown of Commissions 22
Commission Revenues
(TL 000) 9M11 9M12 YoY (%)
Brokerage* 59,720 70,579 18
Corporate Finance 5,250 5,669 8
Asset Management 17,419 17,492 -
Other Commissions 840 1,007 20
Total 83,229 94,746 14
TL 83.2mn TL 94.7mn
Commission Income – 9M11 Commission Income – 9M12
Despite the unfavourable market conditions, brokerage revenues performed well owing to be active in
both domestic and international markets
* Leveraged FX trading revenues are added to the brokerage income

Other Exp. 2%
Marketing Exp. 17%
Adm. Exp. 81%
Other Exp. 2%
Marketing Exp. 15%
Adm. Exp. 83%
Financial Results Breakdown of Operating Expenses 23
Operating Expenses
(TL 000) 9M11 9M12 YoY (%)
Marketing, Sales and Distribution Expenses 16,588 22,552 36
General Administrative Expenses 88,487 108,936 23
Other Operating Expenses 1,764 2,255 28
Total 106,839 133,744 25
TL 106.8mn TL 133.7mn
Operating Expenses – 9M11 Operating Expenses – 9M12

Financial Results Price Performance 24
ISMEN Mcap
ISMEN increased 497% since the beginning of 2009
beating ISE 100 by 120%, while increased 40% year to
date
325
100
353
522
361
486
0
100
200
300
400
500
600
TL Millions
ISMEN Price Performance
ISMEN was selected to
• ISE Dividend Index (XTMTU)
• ISE Dividend 25 Index (XTM25)
• ISE Corporate Governance Index (XKURY)
0
100
200
300
400
500
600
700
ISMEN
ISE 100
Performance & Financial
Results – 9M12
25
About Us
Turkish Capital Markets
Our Performance
Financial Results
Expectations
Expectations 26
Corporate finance
Equity:
– We have mandates still watching a recovery in the stock markets both in domestic and global.
Corporate Bonds:
– After a significant performance in 2011, we have a number of mandates from various sectors with different size in 2012.
– IS Bank (TL 7.8bn), ING Bank (TL 450mn), IS Leasing (TL 100mn), IS Investment (TL 200mn), Alternatifbank (TL 150mn),
Creditwest (TL 50mn), Koç Fiat (TL 50mn), Boyner Holding (TL 100mn).
– We have new mandates.
Actively intermediating leveraged FX trading with a remarkable market share of 26-30%.
TradeMaster has been upgraded – investors are able to make leveraged FX trading via TM FX 24-hour/ 5 business day.
Prime brokerage service is still going up; new funds are in the pipeline.
New products: Single stock futures and options are going to be traded on the ISE.
New capital market law is expected to be approved by the Parliament till the end of the year.
IS Asset Management is estimated to benefit from new pension fund regulation which will be in force as of 2013.
Positive contribution from subsidiaries is expected to continue in the last quarter.

Investor Relations 27
Mr. Mert Erdoğmuş
Deputy CEO
Phone : +90 0212 350 24 12
Fax : +90 0212 350 20 01
E-mail : [email protected]
Mr. Ozan Altan
Head of IR
Phone : +90 0212 350 28 72
Fax : +90 0212 350 20 01
E-mail : [email protected]
The Investor Relations Department is responsible for the timely
communication of necessary, accurate, complete,
comprehensible and easily accessible information and
explanations, which are not considered to be trade secrets to its
shareholders and stakeholders.
http://www.isinvestment.com/wwa_ir_new.aspx
Mr. Alper Alkan
Associate
Phone : +90 0212 350 25 22
Fax : +90 0212 350 20 01
E-mail : [email protected]
Disclaimer
The information in this report is prepared by “IS YATIRIM MENKUL DEGERLER A.S.” (IS Investment) and it is not to be construed as
an offer or solicitation for the purchase or sale of any financial instrument or the provision of an offer to provide investment services.
Information, opinions and comments contained in this material are not under the scope of investment advisory services. Investment
advisory services are given according to the investment advisory contract, signed between the intermediary institutions, portfolio
management companies, investment banks and the clients. Opinions and comments contained in this report reflect the personal views of
the analysts who supplied them. The investments discussed or recommended in this report may involve significant risk, may be illiquid
and may not be suitable for all investors. Therefore, making decisions with respect to the information in this report cause inappropriate
results.
All prices, data and other information are not warranted as to completeness or accuracy and are subject to change without notice. Any
form of reproduction, dissemination, copying, disclosure, modification, distribution and/or publication of this report is strictly prohibited.
The information presented in this report has been obtained from sources believed to be reliable. IS Investment cannot be held responsible
for any errors or omissions or for results obtained from the use of such information.
28

IS Investment 29
HEAD
OFFICE
İş Kuleleri Kule-2 Kat:12
34330 4 . Levent İstanbul
T : 0212 350 20 00
F: 0212 350 20 01
ADANA
BRANCH
Ç ınarlı Mah. Turhan C emal Beriker Bulvarı
LEVENT
BRANCH
İş Kuleleri Kule-2 Kat:4
No:31 Kat:9 Seyhan A DANA, TURKEY 34330 4 . Levent İSTANBUL, TURKEY
T: +90 322 355 97 00 T : +90 212 350 29 00
F: +90 322 355 97 01 F: +90 212 350 29 01
AKARETLER
BRANCH
Süleyman Seba C ad. No:44 B1 Blok D:10
MASLAK
BRANCH
Büyükdere C ad. Nurol P laza No: 257
34357 A karetler İSTANBUL, TURKEY 34398 Maslak İSTANBUL, TURKEY
T : 0212 326 87 00 T : +90 212 367 85 00
F: 0212 326 86 87 F: +90 212 367 85 01
ANKARA
BRANCH
Tahran C ad. No: 3/8
YENİKOY
BRANCH
Köybaş ı Cad. İskele Çıkmazı No:6
06700 Kavaklıdere A NKARA, TURKEY 34464 Yeniköy İSTANBUL, TURKEY
T: +90 312 455 26 50 T : +90 212 363 01 00
F: +90 312 466 60 62 F: +90 212 363 01 01
BURSA
BRANCH
A tatürk Cad. Nalbantoğlu Mah. No:71/3
YEŞİLKÖY
BRANCH
Havalimanı Kavşağı EGS Business Park
16010 Osmangazi BURSA, TURKEY B3 Blok No:470
T : +90 266 294 80 00 34149 Yeşilköy İSTANBUL, TURKEY
F: +90 266 294 80 01 T : +90 212 463 20 00
F: +90 212 463 20 01
İZMİR
BRANCH
A kdeniz C ad. No:14 Birsel İş Merkezi D:501
SUADİYE
REP. OFFICE
Bağdat C ad. Kılıçoğlu Apt. No:451 Kat:1 D:4
35210 A lsancak İZMİR, TURKEY 34740 Suadiye İSTANBUL, TURKEY
T: +90 232 488 90 00 T : +90 216 665 46 00
F: +90 232 488 90 01 F: +90 216 665 46 01
KALAMIŞ
BRANCH
Fener Kalamış C ad. T ibaş Belvü Sitesi A 2 Blok D:3
ALMAATY
REP. OFFICE
2nd Floor , Block A 2 Samal Towers 97,
34726 Fenerbahçe İSTANBUL, TURKEY Zholdasbekov St, 050051 ALMAATA KAZAKİSTAN
T : +90 216 542 72 00 T : +7 727 334 05 08
F: +90 216 414 57 57 F: +7 727 334 05 09
SUBSIDIARY
MAXIS SECURITIES LTD
SUBSIDIARY
IS INVESTMENT GULF LIMITED
8 P rinces Street Dubai International Financial Centre
London EC 2R 8HL UNITED KINGDOM The Gate Village, Building 04, Lev el 1, Units 7 & 8
T : +44207 397 1431 PO Box 482079 Dubai, UAE
T: (+971) 555777726

PERFORMANCE & FINANCIAL RESULTS – 9M12 19 November 2012

![ANNUAL REPORT FISCAL YEAR 2017 ... › en › annual_report_fiscal_year_2017.pdf9 Chapter 1 Investment Results in Fiscal 2017 1 Investment Results [1] Rate of investment return / Amount](https://static.fdocuments.in/doc/165x107/5f284231338517462470380a/annual-report-fiscal-year-2017-a-en-a-annualreportfiscalyear2017pdf.jpg)