A demographic prespective to understand fertility barriers of Hong Kong

Demographic Research a free, expedited, online journal of peer-reviewed research and commentary in the population sciences published by the Max Planck Institute for Demographic Research Konrad-Zuse Str. 1, D-18057 Rostock · GERMANY www.demographic-research.org
DEMOGRAPHIC RESEARCH VOLUME 26, ARTICLE 13, PAGES 293-318 PUBLISHED 5 APRIL 2012 http://www.demographic-research.org/Volumes/Vol26/13/ DOI: 10.4054/DemRes.2012.26.13 Research Article
Is fertility stalling in Jordan?
Valeria Cetorelli
Tiziana Leone © 2012 Valeria Cetorelli & Tiziana Leone. This open-access work is published under the terms of the Creative Commons Attribution NonCommercial License 2.0 Germany, which permits use, reproduction & distribution in any medium for non-commercial purposes, provided the original author(s) and source are given credit. See http:// creativecommons.org/licenses/by-nc/2.0/de/

Table of Contents
1 Introduction 294 2 Background 295 2.1 Fertility stall 295 2.2 Determinants 296 2.3 Spuriousness 297 3 Context 298 3.1 Jordan’s fertility patterns 298 3.2 Family planning policy 301 3.3 Socio-economic trend 303 4 Data and methods 304 4.1 Data 304 4.2 Evaluation of age and birth date misreporting 305 4.3 Reconstruction of fertility trend 306 4.4 Assessment of fertility stall 307 5 Results 308 5.1 Age and birth date misreporting 308 5.2 Retrospective TFRs and long-term fertility trend 309 5.3 Fertility stall 313 6 Conclusions 314 7 Acknowledgments 315 References 316
Demographic Research: Volume 26, Article 13 Research Article
http://www.demographic–research.org 293
Is fertility stalling in Jordan?
Valeria Cetorelli1
Tiziana Leone2
Abstract
BACKGROUND Most of the recent literature on fertility stalls has concentrated on sub-Saharan Africa and has highlighted flaws in DHS data. No similar detailed research exists for presumed stalls occurring in countries outside that region. This is particularly surprising when considering that cases of fertility stalls have also been suggested in Middle Eastern countries, including Egypt, Syria and among the Palestinians in Israel and the Occupied Territory. OBJECTIVE The present paper is the first to study an apparent fertility stall in Jordan, using five DHS surveys, and to carry out a rigorous three-stage analysis to assess its genuineness. METHODS First, the quality of data concerning age and birth dates of women and their children is evaluated to control for possible misreporting. Second, retrospective fertility rates are calculated from each survey and a reliable fertility trend covering over 30 years is reconstructed from pooled data of all surveys. Finally, a linear regression model is fitted to assess whether the rate of fertility decline in the stalling period differs significantly from the rate of decline in the preceding period, and is not statistically different from zero. RESULTS The analysis demonstrates that not only is the stall real and not due to data errors, but is also one of the longest lasting recently assessed. For more than a decade, fertility in Jordan has remained relatively constant at a rate exceeding 3.5 children per woman. CONCLUSIONS This has important policy implications. It suggests the need for greater attention to possible cases of similar stalls in neighbouring countries and in-depth investigations of their determinants.
1 London School of Economics, Department of Social Policy, Houghton Street WC2A 2AE London, United Kingdom. E-mail: [email protected]. 2 London School of Economics, Department of Social Policy.

Cetorelli & Leone: Is fertility stalling in Jordan?
http://www.demographic–research.org 294
1. Introduction
Cases of fertility stalls have recently been observed in a number of mid-transitional countries, and the phenomenon has generated deep interest. In particular, presumed stalls in sub-Saharan Africa have been the object of a growing body of research (Bongaarts 2006, 2008; Westoff and Cross 2006; Agyei-Mensah 2007; Moultrie et al. 2008; Garenne 2008, 2009; Shapiro and Gebreselassie 2008; Schoumaker 2009; Ezeh, Mberu, and Emina 2009; Machiyama 2010). Yet no consensus on the determinants and extent of these stalls exists (Moultrie et al. 2008).
With regard to the determinants, two main hypotheses have been suggested. Since socio-economic development is a key driver of fertility decline, poorly performing economies, rising infant and child mortality and stagnating educational levels may have been responsible for the stalls. A deterioration of family planning programmes, due to declining national and international commitments in the past decade, may have also played a major role.
In terms of methodology, most studies have relied on published fertility estimates from DHS surveys at only few points in time, and may have mistaken slow fertility transitions for cases of stall. To prevent this problem, Moultrie et al. (2008) proposed a statistically testable approach that can be applied to retrospective and prospective data on fertility rates over long time periods. However, to the best of our knowledge, this method has never been replicated.
Another methodological limitation of most recent studies is that they have failed to take into account the quality of DHS data. Detailed analyses by Schoumaker (2009) and Machiyama (2010) have demonstrated several of the claimed stalls to be spurious. Their findings, albeit very interesting, are limited to stalls in sub-Saharan Africa. In fact, no similar detailed research exists for presumed stalls occurring in countries outside that region.
This is particularly surprising when considering that cases of fertility stalls have also been suggested in the Middle Eastern region, including Egypt (Eltigani 2003), Syria (Courbage and Todd 2011), Palestinian Territory (Khawaja 2000; Khawaja, Assaaf, and Jarallah 2009) and the Muslim subpopulation in Israel (Nahmias and Stecklov 2007). Indeed, very little attention has been paid to these stalls. The present paper is the first to study another apparent stall in the region, namely in Jordan, using five DHS surveys. A rigorous three-stage analysis, which will be described in more depth later on, is carried out to assess the nature of the stall. First, the quality of data concerning age and birth dates of women and their children is evaluated to control for possible misreporting. Second, retrospective fertility rates are calculated from each survey and a reliable fertility trend covering over 30 years is reconstructed from pooled data of all surveys. Finally, a linear regression model is fitted to assess whether the rate
Demographic Research: Volume 26, Article 13
http://www.demographic–research.org 295
of fertility decline in the stalling period differs significantly from the rate of decline in the preceding period and is not statistically different from zero. The study then gives two important contributions by investigating fertility dynamics in an under-studied region of the world, and by applying combined methods which have thus far been implemented only in a very limited number of studies.
2. Background
2.1 Fertility stall
The term ‘stall’ implies that an ongoing fertility transition is interrupted by a period of unchanged fertility, occurring before the end of the transition is reached (Bongaarts, 2008). Beyond this theoretical conceptualisation, different operational definitions of fertility stall have been proposed.
In his early work on the subject, Gendell (1985) elaborated four criteria for identifying a fertility stall. He required that: (i) fertility had already fallen by 20% from a high level of 5 or more children per woman, (ii) the decline had averaged on the order of at least 0.15 children per woman in the five years preceding the supposed stall, (iii) the rate of decline then experienced a substantial deceleration to at least a halving of the rate in the preceding period for five or four years at a minimum, and finally (iv) this substantial deceleration occurred at a point well above the replacement level.
Bongaarts (2006) proposed a more straightforward, although less rigorous, definition. He considered countries in mid-transition – i.e. with a total fertility rate (TFR) between 2.5 and 5 children per woman – to have experienced a stall, if their TFR failed to decline between two DHS surveys. Shapiro and Gebreselassie (2008) introduced an even less restrictive definition that included cases of early-transition stall – i.e. occurring at a TFR above 5 children per woman. Analogous definitions were, implicitly or explicitly, adopted by a number of other studies relying on DHS data (see for example Eltigani 2003; Westoff and Cross 2006; Agyei-Mensah 2007; Ezhe, Mberu, and Emina 2009; Shapiro et al. 2010). In a subsequent paper, Bongaarts (2008) claimed that countries with a decline of less than 0.25 children per woman between two DHS surveys could also be regarded to have stalled, since these declines were too small to be statistically significant. Garenne (2008) used a somewhat different definition, referring to fertility stalls as periods during which the slope recorded a statistically significant change from negative to nil or positive.
In response to the increasingly expanded definitions based on fertility estimates at only few points in time, Moultrie et al. (2008) proposed an approach providing greater empirical precision. Using retrospective and prospective data over a 16-year period,

Cetorelli & Leone: Is fertility stalling in Jordan?
http://www.demographic–research.org 296
their definition encompassed, in a linear regression model, the strict criteria first elaborated by Gendell. To identify a fertility stall, they required, as regression outcomes, a statistically significant difference in the rate of fertility decline over two time periods of at least five years’ duration but not necessarily of the same length, and, preferably, a slope of the line relating to the presumed stalling period that did not differ significantly from zero. Similarly, Machiyama (2010) elaborated his definition consistently with Gendell’s criteria and applied it to reconstructed fertility trends over long time periods. Unlike Moultrie et al. (2008), he did not refer to a regression model, and identified a fertility stall simply when the average annual pace of fertility decline during a DHS inter-survey period was less than half the pace in the previous inter-survey period, in countries where TFRs had already dropped by over 20% from the highest observed TFR.
The adoption by different studies of different operational definitions resulted in controversial findings on how many and which countries have experienced a fertility stall. In particular, approaches relying on published fertility rates at only few points in time – without a rigorous retracement of fertility trend and a statistically tested comparison between the rate of decline in the presumed stalling period and in that preceding it – are exposed to the risk of mistaking a slow fertility transition for a case of stalling. To prevent this risk, the present study follows the approach ideated by Moultrie et al. (2008). A fertility trend covering a period of 30 years is reconstructed and fitted into a linear regression model to assess the presence of a stall in the last decade.
2.2 Determinants
As with the lack of agreement on the operational definition for identifying fertility stalls, no conclusive evidence exists on the ultimate determinants of such stalls (Moultrie et al. 2008).
Gendell (1985, 1989), Aghajanian (1991) and, more recently, Westoff and Cross (2006), Agyei-Mensah (2007) and Ezeh, Mberu, and Emina (2009) claimed that fertility stalls may have been caused by a deterioration in family planning programmes due to declining national and international commitments. However, in his comprehensive analysis, Bongaarts (2006) found little support for this hypothesis.
Bongaarts (2006) did not find a significant link between fertility stalls and trends in socio-economic development either. The impact of changes in socio-economic indicators on the likelihood of fertility stall has also been examined in other studies, producing mixed results. Agyei-Mensah (2007) and Ishida, Stupp, and Sotomayor (2009) suggested that worsening economic conditions could have contributed to fertility stall. Conversely, Shapiro and Gebreselassie (2008) and Shapiro et al. (2010) assessed

Demographic Research: Volume 26, Article 13
http://www.demographic–research.org 297
that, ceteris paribus, rapid growth in GDP per capita translated into significantly slower decline in fertility. Garenne (2009) confirmed these controversial findings, identifying both cases where income per capita rose during the stalling period and others where it had a steady or declining trend.
Within the analysis of socio-economic determinants, Shapiro and Gebreselassie (2008) and Shapiro et al. (2010) pointed out changes in female education as a key factor, whereas Garenne (2009) found no clear-cut difference in educational trends between stalling and non-stalling countries. He stressed, instead, changes in female labour force participation as more significant.
Westoff and Cross (2006), Shapiro and Gebreselassie (2008) and Moultrie et al. (2008) supported a causal link between increase in infant and child mortality, mainly due to HIV/AIDS, and fertility stall. However, when including countries outside Sub-Saharan Africa, Shapiro et al. (2010) obtained a much weaker relationship.
Findings are relatively more consistent with reference to the proximate determinants. Gendell (1985, 1989), Bongaarts (2006), Westoff and Cross (2006), Ageyei-Mensah (2007), Khawaja, Assaaf, and Jarallah (2009) and Garenne (2009) found stalls to be typically associated with levelling off in contraceptive use, and, less often, decline in the mean age at marriage and childbearing. Some of these authors associated fertility stall with a rise in the desired fertility, while Sathar (2007), Menken et al. (2009) and Courbage and Todd (2011) suggested that a preference for sons could have played a role, as well. Nevertheless, in some countries fertility stall remained apparently inexplicable even at the level of proximate determinants (Garenne 2009). In these cases, the stall is very likely to be an artifice of the data.
This highlights the common limitation of most of the aforementioned analyses, that is, they searched for determinants of fertility stalls without any prior control for possible data quality problems. Indeed, the latter are partially responsible for the contradictory results described above, and are themselves the direct cause of some of the apparent stalls (Schoumaker 2009; Machiyama 2010).
2.3 Spuriousness
A few recent studies provided in-depth analyses of data quality in countries where fertility decline has apparently stalled.
Schoumaker (2009) carried out the first detailed DHS data evaluation with reference to fertility stalls in Sub-Saharan Africa. He first verified that trends in proximate and socio-economic determinants of fertility did not provide conclusive evidence of stalls in most countries. Secondly, he used birth histories to compare retrospective fertility trends obtained from consecutive surveys. Hence, he
Cetorelli & Leone: Is fertility stalling in Jordan?
http://www.demographic–research.org 298
demonstrated the presence of major birth displacements and omissions. Once having controlled for data errors, several apparent stalls in the region proved to be spurious.
His results were confirmed by Machiyama (2010). Also focusing on Sub-Saharan Africa, the latter made three sets of accurate data assessments. First, he controlled for age and birth date misreporting for both women and their children. Then he reconstructed retrospective annual fertility rates in order to identify discrepancies from consecutive surveys. He also used these rates to derive detailed fertility estimates and the long-term smoothed fertility trends. Thirdly, he explored possible reasons for the discrepancies in fertility rates by comparing the composition of women according to educational level and average parity. The final re-examination of fertility changes in the light of these assessments led to the conclusion that the number of real stalls had been largely overstated.
The outcomes of these studies, albeit very interesting, are limited to Sub-Saharan Africa – i.e. the region where DHS are affected the most by data quality problems (Arnold 1990; Pullum 2006). In fact, no similar data analysis exists for presumed stalls occurring in countries outside that region. The present study combines some of the accurate techniques described above and applies them for the first time to Jordan DHS data.
3. Context
3.1 Jordan’s fertility patterns
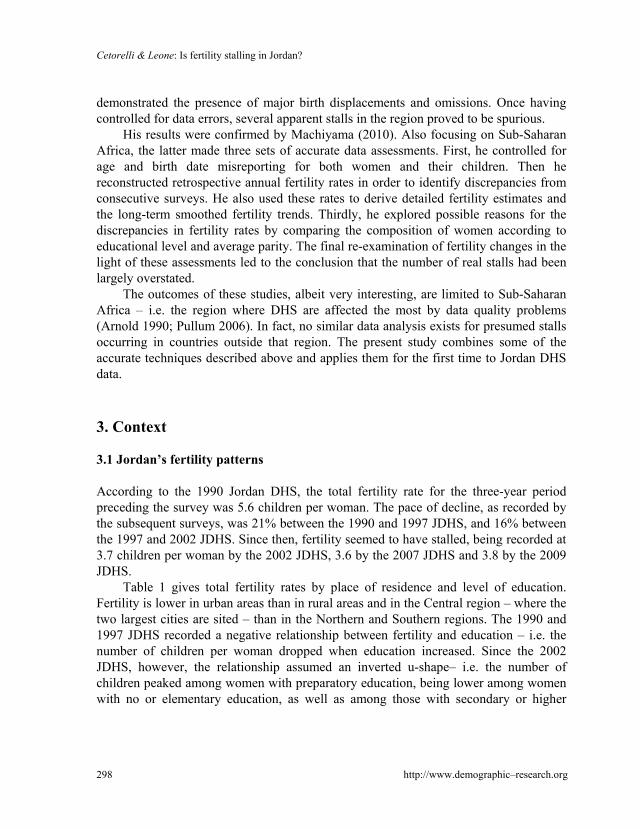
According to the 1990 Jordan DHS, the total fertility rate for the three-year period preceding the survey was 5.6 children per woman. The pace of decline, as recorded by the subsequent surveys, was 21% between the 1990 and 1997 JDHS, and 16% between the 1997 and 2002 JDHS. Since then, fertility seemed to have stalled, being recorded at 3.7 children per woman by the 2002 JDHS, 3.6 by the 2007 JDHS and 3.8 by the 2009 JDHS.
Table 1 gives total fertility rates by place of residence and level of education. Fertility is lower in urban areas than in rural areas and in the Central region – where the two largest cities are sited – than in the Northern and Southern regions. The 1990 and 1997 JDHS recorded a negative relationship between fertility and education – i.e. the number of children per woman dropped when education increased. Since the 2002 JDHS, however, the relationship assumed an inverted u-shape– i.e. the number of children peaked among women with preparatory education, being lower among women with no or elementary education, as well as among those with secondary or higher

Demographic Research: Volume 26, Article 13
http://www.demographic–research.org 299
education.3 Both regional and educational differentials narrowed over time, so that fertility rates recorded in most recent surveys are relatively homogeneous. Moreover, fertility stall seems to be a universal phenomenon, concerning all women regardless of their region of residence and level of education.
Table 1: TFRs for the 3-year period preceding each survey by
place of residence and level of education Background characteristics JDHS 1990 JDHS 1997 JDHS 2002 JDHS 2007 JDHS 2009
Place of residence Urban Rural
5.1 6.8
4.2 5.0
3.5 4.2
3.6 3.7
3.8 4.0
North Central South
6.3 5.0 6.6
4.8 4.1 4.8
3.9 3.5 4.0
3.8 3.5 3.6
4.0 3.8 4.1
Level of education No education Elementary Preparatory Secondary Higher
6.9 6.0 –
5.4 4.1
4.6 4.5 –
4.5 3.7
3.6 3.7 4.4 3.9 3.1
2.6 3.9 4.5 3.9 3.2
4.1 4.1 4.7 4.1 3.5
Total
5.6
4.4
3.7
3.6
3.8 Source: Measure DHS (2011) STATcompiler http://statcompiler.com
Figure 1 outlines the shape of age-specific fertility rates, which remained relatively constant over time. According to all surveys, fertility rates started low at the ages 15-19, increased rapidly thereafter, peaking at the ages 25-29, and then declined rather sharply in the following age-groups. Between the 1990 and 2002 JDHS, fertility rates dropped dramatically among all age-groups. Conversely, the 2009 JDHS recorded a slight increase in the fertility rate of women aged 25-29 and no decline among any age-groups.
3 The unreasonably low TFR for women with no education in 2007 is attributable to the very small sample size. In fact, in 2007 this group of women represents only 3.8% of the Jordanian female population between the ages of 15 and 49.

Cetorelli & Leone: Is fertility stalling in Jordan?
Figure 1: Age-specific fertility rates for the 3-year period preceding each survey
0.00
0.05
0.10
0.15
0.20
0.25
0.30
15-19 20-24 25-29 30-34 35-39 40-44 45-49
JDHS 1990
JDHS 1997
JDHS 2002
JDHS 2007
JDHS 2009
Source: Measure DHS (2011) STATcompiler http://statcompiler.com
The apparent stall during the recent period may be associated with trends in the two main proximate factors behind fertility outcome – i.e. nuptiality and contraception.
In Jordan virtually all births occur within marriage, since extra-marital childbearing is subject to strong cultural and religious sanctions (Almasarweh 2003; Department of Statistics of Jordan and ICF Macro 2010). It follows that nuptiality determines the onset of exposure to fertility. Table 2 gives the percentage of women never married at the time of each survey. This percentage increased from 43.8% in 1990 to 45.6% in 2002, but fell to only 41.5% in 2009. The reduction in never-married concerned young women and was particularly evident among those aged 25-29, that is also the age-group which recently increased its specific fertility rate. The reduced percentage of young women never married was accompanied by a corresponding increased percentage of women currently married – i.e. exposed to the risk of pregnancy – while the divorce and widowhood rates remained constant at a very low level.
The key factor affecting fertility within marriage is contraception. Table 3 shows that contraceptive use is relatively widespread among married women, and rose from an average of 40.0% in 1990 to 59.3% in 2009. Over the most recent period, this rise was, however, not consistent among all age-groups. At first sight, the apparent stall seems therefore to be associated with an increase in the percentage of young women married and with an inconsistent growth in their contraceptive use.
http://www.demographic–research.org 300

Demographic Research: Volume 26, Article 13
http://www.demographic–research.org 301
Table 2: Percentage of women never married at the time of each survey
Percentage of women never married
by age-groups
JDHS 15-19 20-24 45-49 All ages 25-29 30-34 35-39 40-44
1990 1997
89.4 91.8
54.8 61.8
26.3 33.8
10.9 19.3
5.4 10.2
2.7 5.7
2.0 3.9
43.8 45.4
2002 2007
93.8 94.2
65.9 63.3
34.7 30.7
20.4 20.6
12.7 14.6
7.4 8.4
4.6 4.1
45.6 42.6
2009 93.2 63.0 28.5 18.1 15.3 10.2 8.5 41.5 Source: Measure D 1) ST ler htt mpiler
able 3: Percentage of women married currently using contraception
using contraception
HS (201 ATcompi p://statco .com
T
at the time of each survey by age-groups Percentage of women married currently
JDHS 15-19 All ages 20-24 25-29 30-34 35-39 40-44 45-49
1990 1997
12.3 19.0
28.1 36.6
37.2 51.9
48.5 57.9
52.3 62.6
51.6 63.6
33.7 48.4
40.0 52.6
2002 2007
21.3 24.4
42.2 44.2
54.0 50.1
60.1 62.5
63.9 63.9
65.6 66.6
47.5 53.1
55.8 57.1
2009 27.0 42.6 58.0 61.8 67.6 69.0 53.1 59.3 Source: Measure D 1) ST ler htt mpiler
3.2 F mily planning policy
ordanian government promoted maternal and child health
Spacing National Programme,
HS (201 ATcompi p://statco .com
a
Since the early 1970s, the Jinterventions and broad-based access to education as indirect vehicles for an eventual fertility reduction. Voluntary family planning bodies were allowed to operate and received some financial support. The national health system also assisted couples who wished to practice family planning. Nevertheless, until the 1990s, no official population policy was in force. The government did not openly encourage the use of contraception, nor did it supply family planning services free of charge (Rizk 1977; Al-Qutob 1994).
In 1990, these services were still largely provided by clinics, pharmacies, private doctors and private hospitals. Table 4 shows that, according to the 1990 JDHS, only 24% of women using contraception obtained it from the Primary Health Care system of the Ministry of Health or from government hospitals.
From the beginning of the 1990s, the government adopted an increasingly explicit antinatalist approach. In 1993, it approved the Birth
Cetorelli & Leone: Is fertility stalling in Jordan?
http://www.demographic–research.org 302
aime
most doubled from 1990 to 2009
le attitude towards it. In 2009, ever-married wom
amil HS 990
JDHS 1997
JDHS 2002
JDHS 2007
JDHS 2009
d at promoting maternal and child health and reducing fertility through increased birth intervals, and in 1996 the National Population Strategy, containing a specific section on reproductive health. In 2002, a Higher Population Council, headed by the Prime Minister, was finally established to implement the National Population Strategy work plan and to address other pressing population and development challenges (Department of Statistics of Jordan and ICF Macro 2010).
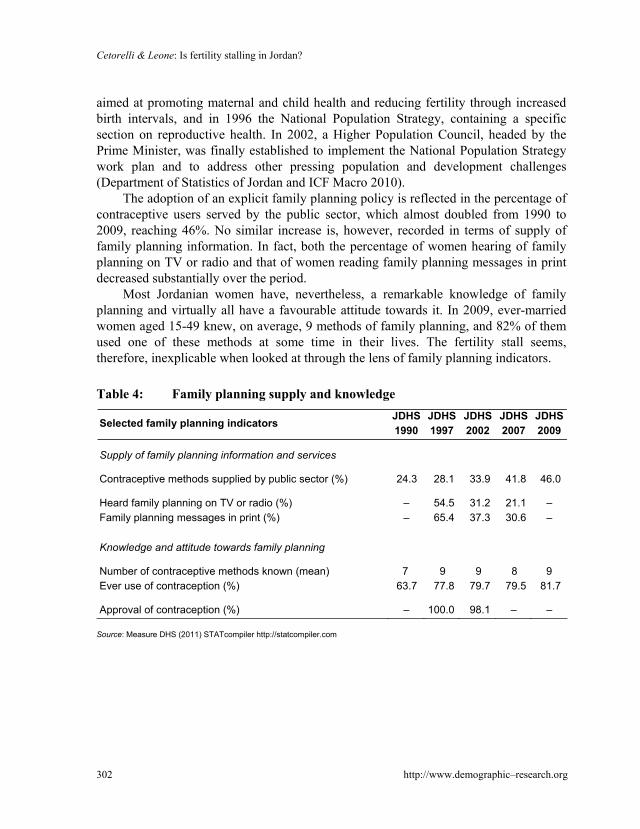
The adoption of an explicit family planning policy is reflected in the percentage of contraceptive users served by the public sector, which al
, reaching 46%. No similar increase is, however, recorded in terms of supply of family planning information. In fact, both the percentage of women hearing of family planning on TV or radio and that of women reading family planning messages in print decreased substantially over the period.
Most Jordanian women have, nevertheless, a remarkable knowledge of family planning and virtually all have a favourab
en aged 15-49 knew, on average, 9 methods of family planning, and 82% of them used one of these methods at some time in their lives. The fertility stall seems, therefore, inexplicable when looked at through the lens of family planning indicators.
Table 4: Family planning supply and knowledge
Selected f y planning indicators JD1
d services
) 24.3 28.1 33.9 41.8 46.0
Supply of family planning information an
Contraceptive methods supplied by public sector (%
Heard family planning on TV or radio (%) Family planning messages in print (%)
––
54.565.4
31.2 37.3
21.1 30.6
––
Knowledge and attitude towards family planning
763.7
977.8
100.0
979.7
879.5
981.7
Number of contraceptive methods known (mean) Ever use of contraception (%)
Approval of contraception (%)
–
98.1
–
– Source: Measure DHS (2011) STATcompiler http://statcompiler.com
Demographic Research: Volume 26, Article 13
http://www.demographic–research.org 303
3.3 Socio-economic trend
The apparent stall at a still relatively high fertility also contrasts with the image of Jordan, obtained from the same surveys, as a relatively advanced and progressing society in terms of socio-economic indicators – including levels of urbanisation, wealth, health and education.
As shown in Table 5, the Jordanian population is highly urbanised. According to the 1990 JDHS, in that year 74% of the population already lived in localities of more than 5,000 inhabitants. This percentage increased in the following years, reaching approximately 85% in the late 2000s. Most of the population is concentrated in the Central region, in particular in the governorates of Amman and Zarqa, which are named after the two largest cities.
Since 1990, the percentage of households possessing durable goods increased substantially, so that in 2009 virtually all households had a television, refrigerator, washing machine and telephone. The percentage of households possessing a private car increased by 98% from 1990 to 2009, while the percentage of those with internet access rose by 172% in only 7 years.
The country has also a relatively good level of maternal and child health. The median number of antenatal visits among ever-married women aged 15-49 for the three-year period preceding each survey was 6 in 1990 and stabilised at 8 since 1997. The percentage of deliveries occurring in health centres was 81% in 1990 and reached almost 100% in 2007. The mortality of infants between 0 and 1 years dropped by 32% from 1990 to 2009, when it was recorded at 23‰. Conversely, the mortality of children between 1 and 5 years stagnated over the period at about 5‰.
The high level of education is another characteristic of the Jordanian population in general, and of Jordanian women in particular. In 1990, already more than half of ever-married women between the ages of 15 and 49 had secondary or higher education. This percentage reached 90% in 2009. Female education is, however, not accompanied by equally high female labour force participation. The percentage of women employed, albeit increasing in the recent years, was still only 15% in 2009.

Cetorelli & Leone: Is fertility stalling in Jordan?
http://www.demographic–research.org 304
Table 5: Socio-economic trend
Selected socio-economic indicators JDHS 1990
JDHS 1997
JDHS 2002
JDHS 2007
JDHS 2009
Place of residence
Urban (%)
73.8
83.6
79.9
85.0
84.0
North (%) 28.1 26.7 25.7 27.4 28.4 Central (%) 62.4 67.2 64.9 63.3 62.7 South (%) 9.5 6.1 9.4 8.4 8.9 Possession of durable goods
Television Refrigerator Washing machine Telephone Internet access Car
91.2 81.6
– 33.9
– 23.5
91.5 84.7 – 37.9
– 23.4
96.3 93.2 92.9 72.6
5.0 38.0
97.2 94.6 93.8 90.0
8.3 40.2
98.4 96.8 95.1 97.1 13.6 46.5
Maternal and child health
Number of antenatal visits (median)
6
8
8
8
– Delivery occurred in health centre (%) 80.9 94.1 96.9 98.9 –
Infant mortality 1q0 (‰) Childhood mortality 4q1 (‰)
33.8 5.1
28.5 5.9
21.1 5.0
– –
23.1 5.1
Women status
Women with secondary or higher education (%)
54.0
75.6
82.5
88.7
90.1 Women employed (%) – – 9.7 11.8 15.2
Source: Measure DHS (2011) STATcompiler http://statcompiler.com
4. Data and methods
4.1 Data
This study is based on full birth histories from data files of Jordan DHS surveys conducted in 1990, 1997, 2002, 2007 and 2009. These surveys covered nationally representative samples of 8333, 7335, 7825, 14564 and 13577 households respectively, yielding the interviews of 6461, 5548, 6006, 10876 and 10109 ever-married women

Demographic Research: Volume 26, Article 13
http://www.demographic–research.org 305
between the ages of 15 and 49. The following three-stage analysis is carried out to evaluate data quality, reconstruct fertility trends, and assess the genuineness of the fertility stall.
4.2 Evaluation of age and birth date misreporting
Accurate information of age and birth dates of women and their children are pivotal for a correct estimate of fertility rates, and DHS surveys are by far the most reliable sources with this respect. However, misreporting and omissions remain critical problems of many of these surveys (Arnold 1990; Pullum 2006; Sullivan 2008).The first stage of the analysis controls for age and birth date incompleteness, digit preference in age reporting and systematic age displacement, employing the techniques first developed by Pullum (2006) and subsequently adopted by Machiyama (2010) to study the claimed fertility stalls in Sub-Saharan Africa.
To evaluate the completeness of information regarding age, year and month of birth of interviewed women and their children, the percentages of women and children whose information was not directly provided but imputed is calculated from the individual and birth data files of each survey.
A problem arising when the exact age is unknown is the tendency to prefer numbers ending in digits 0 and 5. Since standard age groups begin with those digits, this type of misreporting often produces shifts into the next higher age group. The standard summary measure of digit preference is Myers blended index (Myers 1940). This index is half the sum of the absolute deviations of the observed percentages from the expected percentages at each digit, and can be interpreted as the minimum percentage of individuals that would have to be shifted from one digit to another to achieve a uniform distribution across ages. The blending procedure adjusts for the fact that population growth and mortality tend to result in more people aged x than x+1. The analysis focuses on women between 15 and 44 years and children between 0 and 29 years, to have an equal representation of all final digits – i.e. 0 to 9 (Pullum 2006; Rodríguez 2006).
Finally, systematic age displacement across an age boundary for eligibility for specific survey questions is also relatively common. In the DHS protocol, only women aged 15-49 are eligible for the individual survey. The interviewers may therefore have some incentive, in order to reduce their workload, to misstate the ages of some women by entering them as too young or too old to participate in the individual survey. Similarly, only women with children born during the five years preceding the survey are eligible for the questionnaire on maternal and child health. As a result, interviewers could be motivated to transfer dates of childbirth backward to avoid asking the

Cetorelli & Leone: Is fertility stalling in Jordan?
http://www.demographic–research.org 306
additional questions (Pullum 2006; Machiyama 2010). To identify systematic age displacement across boundaries, a reformulation of the conventional age ratio is used (Pullum 2006). The latter estimates the percentages of women aged 15-19 misreported downwards as 10-14, the percentage of women aged 45-49 misreported upwards as 50-54, and the percentage of births in the fifth year preceding the survey misreported in the sixth year.
All the aforementioned forms of age and birth date misreporting can to some extent affect fertility estimates. The most serious problem is the systematic birth displacement of children, possibly accentuated by birth omissions, that may result in an underestimation of fertility during the 5 years preceding the survey and an overestimation 6 or more years before. If one survey suffers from this problem much more than the successive one(s), the measurement of fertility trend can be so distorted as to cause an erroneous impression of a stall (Machiyama 2010).
4.3 Reconstruction of fertility trend
An effective way to control for birth displacements and omissions is to re-estimate fertility rates from subsequent surveys. Birth histories can be used to reconstruct retrospective TFRs by single calendar year and compare them among surveys. In the absence of data quality problems, fertility trends during the overlapping periods of consecutive surveys should be relatively consistent. The reconstruction of fertility trends is carried out following the method elaborated by Schoumaker (2004). This method relies on the organisation of the birth histories as a person-period dataset, which can be analysed with Poisson regression. The first step consists of splitting the history of women aged 15-49 into segments. Every time the age of the woman or year changes, a new segment is created. The next step is to estimate the following Poisson regression model using the person-period data:
ln(mi) = ln(ti) + f(age) + g(time)
where mi is the expected number of children born in each time segment, ti is the length of the time segment or exposure, f(age) is a function of age, and g(time) is a function of calendar time. Precisely, age is included as a set of dummy variables for five-year age groups, while the function of calendar time is measured by a set of dummy variables that model annual variations in fertility. The regression coefficients of age groups are exponentiated, summed and multiplied by 5 to obtain the TFR for the reference year – i.e. the first year of the reconstructed period. The TFRs for following years are obtained

Demographic Research: Volume 26, Article 13
http://www.demographic–research.org 307
by multiplying the TFR of the reference year by the exponentials of regression coefficients of the following years. Standard errors for the TFR are computed using the delta method (Schoumaker 2010).
This approach assumes that there is no interaction between the age effect and the period effect – i.e. the shape of the age-specific fertility rates is constant over time. In the descriptive part of the paper it has been shown that this seems to be the case in Jordan. Furthermore, simulations indicate that the method gives reliable estimates even when the assumption does not strictly hold (Schoumaker 2006).
If retrospective fertility estimates from consecutive surveys match quite well, all Jordan DHS may be pooled together and the same model can be re-run for the pooled data. This allows a reliable long-term fertility trend to be reconstructed (Schoumaker 2010). For the present analysis, the reconstructed trend covering over 30 years is divided into a pre-transitional, a transitional and a stalling period.
4.4 Assessment of fertility stall
The comparison of the rates of fertility decline in the transitional and presumed stalling periods is finally used to provide a statistically robust assessment of the stall. To do so, the following linear regression model elaborated by Moultrie et al. (2008) is adopted:
ln(TFR) = j(time) + k(dummy) + z(time * dummy)
The model is fitted to the natural logarithm of the TFRs so that the resulting rates
reflect a continuous exponential decline in total fertility. The independent variables included in the model are a linear function of calendar time, a dummy variable distinguishing whether each measure of calendar time is before or after the presumed stall – coded 1 and 0 respectively – and an interaction term between the dummy variable and the measure of calendar time.
Essentially, the model evaluates whether two exponential curves for the proportions of the data where the dummy variable is 1 and 0 fit the data better than a single exponential curve for all the data. By applying this model, it is therefore possible to test whether or not the rate of fertility decline in the presumed stalling period differs significantly from the rate of decline in the preceding period and is not statistically different from zero (Moultrie et al. 2008).
A limitation of the regression analysis conducted by Moultrie et al. (2008) concerned the relatively small sample size consisting of only 16 time points – i.e. 10 years before the stall and 6 years after. With an almost doubled sample size – i.e. 19
Cetorelli & Leone: Is fertility stalling in Jordan?
http://www.demographic–research.org 308
years before the stall and 11 years after – the present analysis can definitely offer a more robust assessment.
5. Results
5.1 Age and birth date misreporting
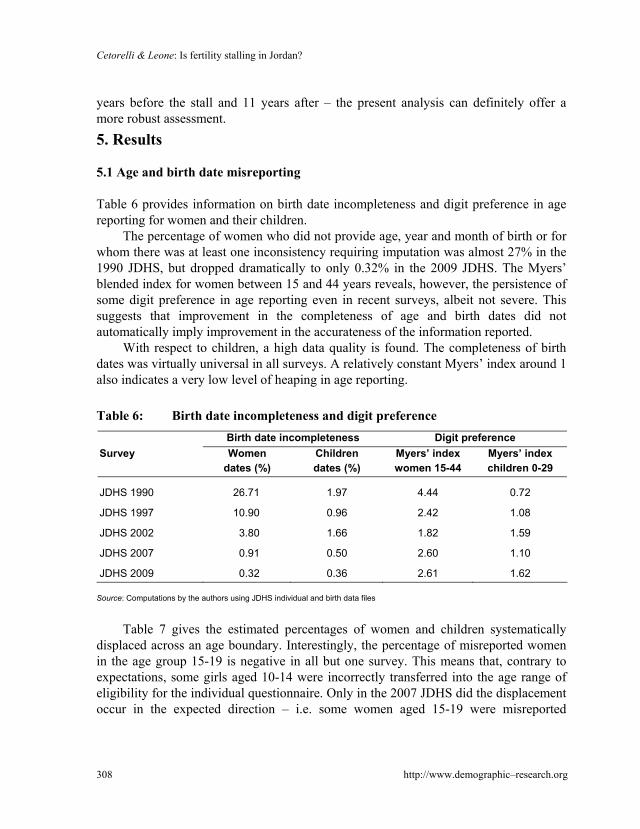
Table 6 provides information on birth date incompleteness and digit preference in age reporting for women and their children.
The percentage of women who did not provide age, year and month of birth or for whom there was at least one inconsistency requiring imputation was almost 27% in the 1990 JDHS, but dropped dramatically to only 0.32% in the 2009 JDHS. The Myers’ blended index for women between 15 and 44 years reveals, however, the persistence of some digit preference in age reporting even in recent surveys, albeit not severe. This suggests that improvement in the completeness of age and birth dates did not automatically imply improvement in the accurateness of the information reported.
With respect to children, a high data quality is found. The completeness of birth dates was virtually universal in all surveys. A relatively constant Myers’ index around 1 also indicates a very low level of heaping in age reporting.
Table 6: Birth date incompleteness and digit preference Birth date incompleteness Digit preference Survey Women
dates (%) Children dates (%)
Myers’ index women 15-44
Myers’ index children 0-29
JDHS 1990
26.71
1.97
4.44
0.72
JDHS 1997
10.90
0.96
2.42
1.08
JDHS 2002
3.80
1.66
1.82
1.59
JDHS 2007
0.91
0.50
2.60
1.10
JDHS 2009
0.32
0.36
2.61
1.62 Source: Computations by the authors using JDHS individual and birth data files
Table 7 gives the estimated percentages of women and children systematically
displaced across an age boundary. Interestingly, the percentage of misreported women in the age group 15-19 is negative in all but one survey. This means that, contrary to expectations, some girls aged 10-14 were incorrectly transferred into the age range of eligibility for the individual questionnaire. Only in the 2007 JDHS did the displacement occur in the expected direction – i.e. some women aged 15-19 were misreported

Demographic Research: Volume 26, Article 13
http://www.demographic–research.org 309
downwards as 10-14. The displaced percentages are, in all cases, low. The percentage of women aged 44-49 misreported upwards as 50-54 is slightly higher, especially in the 1997 JDHS, but overall these data errors do not seem serious enough to distort fertility estimates.
The only noteworthy point concerns birth displacement of children. The percentage of births displaced outside the interval of eligibility for the health questionnaire was very low in the 1990 and 1997 JDHS, while it reached almost 7% in the 2002 JDHS. This suggests an underestimation of the actual fertility for the fifth year preceding that survey – i.e. 1997 – and an overestimation for the sixth year – i.e. 1996. The two more recent JDHS have a percentage of birth displacement around 4%, indicating a reduced birth displacement. A reconstruction of retrospective TFRs by single calendar year, and a comparison across consecutive surveys, is required in order to assess the extent to which the relatively more severe birth displacement registered in the 2002 JDHS has distorted the actual fertility trend.
Table 7: Age and birth displacement Age and birth displacement
Survey
Women 15-19 (%)
Women 45-49 (%)
Children births (%)
JDHS 1990
-1.23
5.90
1.76
JDHS 1997
-2.34
9.93
1.36
JDHS 2002
-2.69
2.26
6.72
JDHS 2007
2.63
4.41
3.83
JDHS 2009
-1.23
2.49
4.15
Source: Computations by the authors using JDHS individual and birth data files
5.2 Retrospective TFRs and long-term fertility trend
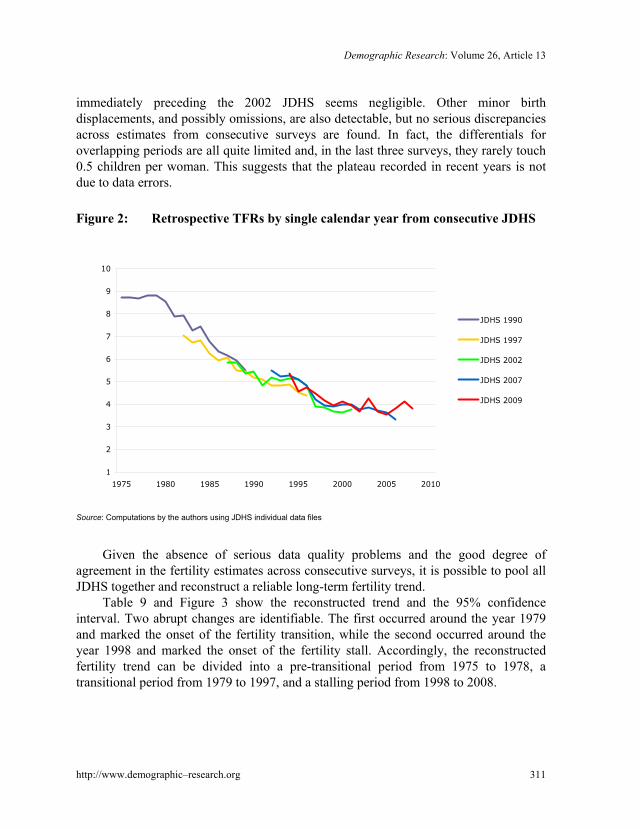
Table 8 presents detailed estimates of retrospective annual TFRs with 95% confidence intervals for the 15 years preceding each survey. Figure 2 displays the same estimates allowing a direct comparison across surveys. Overall, a period of more than 30 years, covering the entire fertility transition, is retraced.

Cetorelli & Leone: Is fertility stalling in Jordan?
http://www.demographic–research.org 310
Table 8: Retrospective TFRs by single calendar year with 95% confidence intervals
Retrospective TFR (95% conf. int.) Years JDHS 1990 JDHS 1997 JDHS 2002 JDHS 2007 JDHS 2009 1975 1976 1977 1978 1979 1980 1981 1982 1983 1984 1985 1986 1987 1988 1989 1990 1991 1992 1993 1994 1995 1996 1997 1998 1999 2000 2001 2002 2003 2004 2005 2006 2007 2008
8.71 (8.19 – 9.24) 8.72 (8.22 – 9.23) 8.69 (8.20 – 9.18) 8.82 (8.35 – 9.30) 8.81 (8.35 – 9.27) 8.53 (8.10 – 8.97) 7.90 (7.49 – 8.31) 7.95 (7.55 – 8.34) 7.27 (6.90 – 7.63) 7.43 (7.07 – 7.79) 6.76 (6.43 – 7.10) 6.33 (6.01 – 6.64) 6.16 (5.86 – 6.46) 5.92 (5.63 – 6.20) 5.51 (5.24 – 5.78)
7.05 (6.57 – 7.53) 6.72 (6.28 – 7.17) 6.84 (6.40 – 7.27) 6.24 (5.84 – 6.64) 5.93 (5.56 – 6.31) 6.09 (5.72 – 6.45) 5.52 (5.18 – 5.85) 5.45 (5.13 – 5.77) 5.20 (4.90 – 5.51) 5.08 (4.79 – 5.38) 4.84 (4.56 – 5.12) 4.82 (4.54 – 5.09) 4.86 (4.60 – 5.13) 4.53 (4.28 – 4.78) 4.39 (4.15 – 4.63)
5.87 (5.47 – 6.27) 5.85 (5.47 – 6.23) 5.37 (5.02 – 5.72) 5.47 (5.13 – 5.81) 4.83 (4.52 – 5.14) 5.17 (4.86 – 5.48) 5.05 (4.75 – 5.34) 5.15 (4.86 – 5.43) 5.12 (4.84 – 5.40) 4.85 (4.58 – 5.11) 3.89 (3.66 – 4.12) 3.88 (3.65 – 4.10) 3.69 (3.47 – 3.90) 3.65 (3.44 – 3.86) 3.77 (3.56 – 3.98)
5.50 (5.23 – 5.77) 5.24 (4.99 – 5.50) 5.26 (5.02 – 5.51) 5.09 (4.85 – 5.32) 4.84 (4.62 – 5.06) 4.22 (4.02 – 5.42) 3.94 (3.75 – 4.13) 3.90 (3.71 – 4.08) 4.01 (3.82 – 4.19) 4.01 (3.83 – 4.19) 3.76 (3.58 – 3.93) 3.84 (3.67 – 4.01) 3.75 (3.58 – 3.91) 3.66 (3.50 – 3.83) 3.31 (3.15 – 3.46)
5.38 (5.11 – 5.66) 4.55 (4.30 – 4.79) 4.72 (4.48 – 4.96) 4.46 (4.23 – 4.69) 4.19 (3.98 – 4.41) 3.93 (3.73 – 4.14) 4.14 (3.93 – 4.34) 3.93 (3.74 – 4.12) 3.68 (3.49 – 3.86) 4.25 (4.05 – 4.44) 3.70 (3.52 – 3.88) 3.54 (3.36 – 3.71) 3.80 (3.62 – 3.97) 4.12 (3.94 – 4.30) 3.82 (3.65 – 3.99)
Source: Computations by the authors using JDHS individual data files
In the 1970s, fertility was relatively stable at a rate exceeding 8.5 children per
woman. The subsequent fertility decline was rather rapid, with the TFR dropping to approximately 4 children per woman in the late 1990s. Since then, however, the decline has halted.
The detected birth displacement from the fifth to the sixth year preceding the 2002 JDHS is confirmed by the reconstructed fertility trend – the TFR unrealistically fell from almost 4.9 children per woman in 1996 to 3.9 in 1997. Nevertheless, when compared with subsequent surveys, the underestimation of fertility in the years
Demographic Research: Volume 26, Article 13
immediately preceding the 2002 JDHS seems negligible. Other minor birth displacements, and possibly omissions, are also detectable, but no serious discrepancies across estimates from consecutive surveys are found. In fact, the differentials for overlapping periods are all quite limited and, in the last three surveys, they rarely touch 0.5 children per woman. This suggests that the plateau recorded in recent years is not due to data errors.
Figure 2: Retrospective TFRs by single calendar year from consecutive JDHS
1
2
3
4
5
6
7
8
9
10
1975 1980 1985 1990 1995 2000 2005 2010
JDHS 1990
JDHS 1997
JDHS 2002
JDHS 2007
JDHS 2009
Source: Computations by the authors using JDHS individual data files
Given the absence of serious data quality problems and the good degree of agreement in the fertility estimates across consecutive surveys, it is possible to pool all JDHS together and reconstruct a reliable long-term fertility trend.
Table 9 and Figure 3 show the reconstructed trend and the 95% confidence interval. Two abrupt changes are identifiable. The first occurred around the year 1979 and marked the onset of the fertility transition, while the second occurred around the year 1998 and marked the onset of the fertility stall. Accordingly, the reconstructed fertility trend can be divided into a pre-transitional period from 1975 to 1978, a transitional period from 1979 to 1997, and a stalling period from 1998 to 2008.
http://www.demographic–research.org 311

Cetorelli & Leone: Is fertility stalling in Jordan?
http://www.demographic–research.org 312
The comparison of the rates of fertility decline in the transitional and stalling period is used, in the following sub-section, to provide a conclusive assessment of the stall.
Table 9: Reconstructed long-term fertility trend and 95% confidence intervals Retrospective TFRs from pooled data of all JDHS (95% conf. int.)
Years Pre-transition Transition Stall 1975 1976 1977 1978 1979 1980 1981 1982 1983 1984 1985 1986 1987 1988 1989 1990 1991 1992 1993 1994 1995 1996 1997 1998 1999 2000 2001 2002 2003 2004 2005 2006 2007 2008
8.35 (7.63 – 9.11) 8.37 (7.05 – 9.91) 8.36 (7.04 – 9.88) 8.50 (7.19 – 10.04)
8.51 (7.19 – 10.03) 8.27 (6.99 – 9.74) 7.68 (6.50 – 9.05) 7.43 (6.34 – 8.72) 6.93 (5.89 – 8.10) 7.07 (6.03 – 8.28) 6.45 (5.50 – 7.55) 6.08 (5.18 – 7.12) 6.02 (5.14 – 7.02) 5.73 (4.90 – 6.69) 5.42 (4.63 – 6.32) 5.31 (4.51 – 6.22) 4.95 (4.21 – 5.80) 5.21 (4.46 – 6.08) 5.07 (4.34 – 5.91) 5.22 (4.47 – 6.07) 4.88 (4.18 – 5.67) 4.75 (4.07 – 5.53) 4.26 (3.65 – 4.97)
4.06 (3.47 – 4.73) 3.90 (3.34 – 4.54) 4.00 (3.42 – 4.66) 3.96 (3.39 – 4.61) 3.76 (3.21 – 4.39) 4.07 (3.48 – 4.75) 3.76 (3.21 – 4.39) 3.64 (3.11 – 4.24) 3.55 (3.04 – 4.15) 4.15 (3.53 – 4.88) 3.85 (3.26 – 4.52)
Source: Computations by the authors using JDHS individual data files

Demographic Research: Volume 26, Article 13
Figure 3: Reconstructed fertility trend with 95% confidence interval from pooled JDHS
Source: Computations by the authors using JDHS individual data files
5.3 Fertility stall
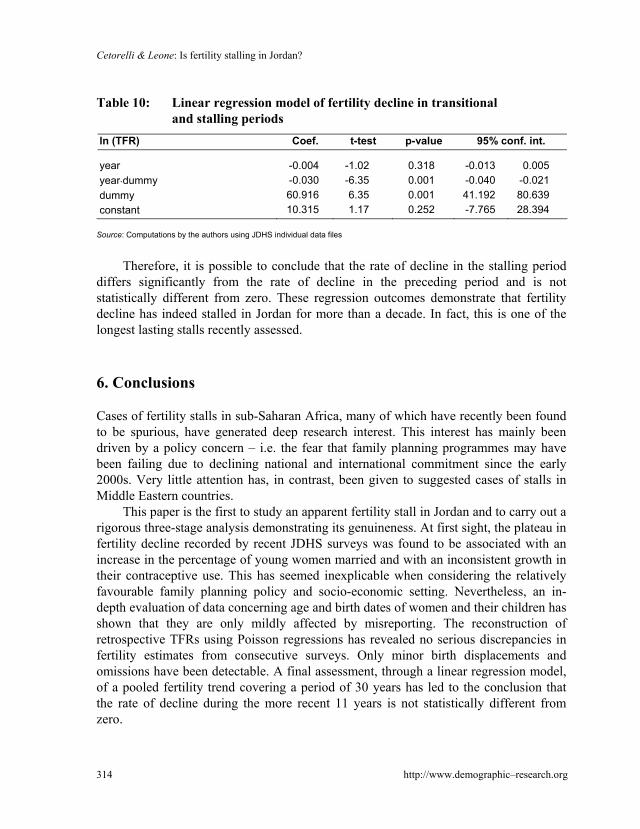
Table 10 reports the estimates from the linear regression model used to assess the presence of a fertility stall since the year 1998.
The coefficient for the presumed stalling period (dummy variable = 0) is -0.004, meaning that the underlying rate of fertility decline over the last 11 years was 0.4% per annum. A 95% confidence interval between -0.013 and 0.005 and a p-value of 0.318 confirm that the rate of decline cannot be considered statistically different from zero. The coefficient of the interaction term is estimated to be -0.030 and is statistically significant at the 1% level. Together the latter and the former coefficients show that the rate of decline for the transitional period, between 1979 and 1997, was 3.4% per annum.4
4 The abrupt change in fertility decline is confirmed when the regression is re-run using 1997 or 1999 as break-points instead of 1998. When 1997 is included in the presumed stalling period, the corresponding rate of fertility decline rises to 0.7% per annum with a coefficient significant at the 10% level. When 1999 is defined as the starting year of the stall, the rate of decline falls to 0.3% per annum with a p-value of 0.538.
http://www.demographic–research.org 313
Cetorelli & Leone: Is fertility stalling in Jordan?
Table 10: Linear regression model of fertility decline in transitional and stalling periods
ln (TFR) Coef. t-test p-value 95% conf. int.
year year⋅dummy dummy constant
-0.004 -0.030 60.916 10.315
-1.02 -6.35 6.35 1.17
0.318 0.001 0.001 0.252
-0.013 -0.040 41.192 -7.765
0.005 -0.021 80.639 28.394
Source: Computations by the authors using JDHS individual data files
Therefore, it is possible to conclude that the rate of decline in the stalling period
differs significantly from the rate of decline in the preceding period and is not statistically different from zero. These regression outcomes demonstrate that fertility decline has indeed stalled in Jordan for more than a decade. In fact, this is one of the longest lasting stalls recently assessed.
6. Conclusions
Cases of fertility stalls in sub-Saharan Africa, many of which have recently been found to be spurious, have generated deep research interest. This interest has mainly been driven by a policy concern – i.e. the fear that family planning programmes may have been failing due to declining national and international commitment since the early 2000s. Very little attention has, in contrast, been given to suggested cases of stalls in Middle Eastern countries.
This paper is the first to study an apparent fertility stall in Jordan and to carry out a rigorous three-stage analysis demonstrating its genuineness. At first sight, the plateau in fertility decline recorded by recent JDHS surveys was found to be associated with an increase in the percentage of young women married and with an inconsistent growth in their contraceptive use. This has seemed inexplicable when considering the relatively favourable family planning policy and socio-economic setting. Nevertheless, an in-depth evaluation of data concerning age and birth dates of women and their children has shown that they are only mildly affected by misreporting. The reconstruction of retrospective TFRs using Poisson regressions has revealed no serious discrepancies in fertility estimates from consecutive surveys. Only minor birth displacements and omissions have been detectable. A final assessment, through a linear regression model, of a pooled fertility trend covering a period of 30 years has led to the conclusion that the rate of decline during the more recent 11 years is not statistically different from zero.
http://www.demographic–research.org 314

Demographic Research: Volume 26, Article 13
http://www.demographic–research.org 315
Therefore, not only is the stall is real and not due to data errors, but it is also one of the longest lasting recently assessed. This has important policy implications and suggests the need for greater attention to possible cases of similar stalls in neighbouring countries. Further investigations are also required to shed light on the ultimate determinants of these stalls.
7. Acknowledgments
We would like to thank Bruno Schoumaker for his help with the use of the new Stata command tfr2. We are also indebted to Andrew Hinde and two anonymous reviewers for their valuable comments on an earlier version of the paper.

Cetorelli & Leone: Is fertility stalling in Jordan?
http://www.demographic–research.org 316
References
Aghajanian, A. (1991). Population change in Iran 1966-86: A stalled demographic transition? Population and Development Review 17(4): 703-715. doi:10.2307/ 1973603.
Agyei-Mensah, S. (2007). New times, new families: the stall in Ghanaian fertility. Paper presented at the fifth African Population Conference, Arusha, Tanzania.
Almasarweh, I.S. (2003). Adolescent and youth reproductive health in Jordan: Status, issues, policies, and programs. Washington, DC: Futures Group (Policy Project).
Al-Qutob, R. (1994). Towards family planning in Jordan. UNFPA Regional Office of the Country Support Team for the Arab States (Working paper, 9).
Arnold, F. (1990). Assessment of the quality of birth history data in the demographic and health surveys. Columbia, Maryland: Institute for Resource Development, Macro System, Inc. (DHS Methodological Reports, 1).
Bongaarts, J. (2006). The causes of stalling transitions. Studies in Family Planning 37(1): 1-16. doi:10.1111/j.1728-4465.2006.00079.x.
Bongaarts, J. (2008). Fertility transitions in developing countries: Progress or stagnation? Studies in Family Planning 39(2): 105-110. doi:10.1111/j.1728-4465.2008.00157.x.
Courbage, Y. and Todd, E. (2011). A Convergence of Civilizations. New York: Columbia University Press.
Department of Statistics of Jordan and ICF Macro (2010). Jordan Population and Family Health Survey 2009. Calverton, Maryland, USA: Department of Statistics and ICF Macro.
Eltigani, E. (2003). Stalled fertility decline in Egypt, Why? Population and Environment 25(1): 41-59. doi:10.1023/A:1025547622370.
Ezeh, A.C., Mberu, B.U., and Emina, J.O. (2009). Stall in fertility decline in Eastern African countries: Regional analysis of patterns, determinants and implications. Philosophical Transactions of the Royal Society of London, Series B 364(1532): 2991-3007. doi:10.1098/rstb.2009.0166.
Garenne, M. (2008). Fertility changes in Sub-Saharan Africa. Calverton, Maryland: Macro International Inc. (DHS Comparative Reports, 18).

Demographic Research: Volume 26, Article 13
http://www.demographic–research.org 317
Garenne, M. (2009). Situations of fertility stall in Sub-Saharan Africa. African Population Studies 23(2): 173-188.
Gendell, M. (1985). Stalls in the fertility decline in Costa Rica, Korea, and Sri Lanka. Washington, DC: The World Bank (World Bank Staff Working Paper, 693).
Gendell, M. (1989). Stalls in the fertility decline in Costa Rica and South Korea. International Family Planning Perspective 15(1): 15-21. doi:10.2307/2133274.
Ishida, K., Stupp, P., and Sotomayor, J.O. (2009). Stalled decline in fertility in Ecuador. International Perspectives on Sexual and Reproductive Health 35(4): 203-206. doi:10.1363/3520309.
Khawaja, M. (2000). The recent rise in Palestinian fertility: Permanent or transient? Population Studies 54(3): 331-346. doi:10.1080/713779091.
Khawaja, M., Assaaf, S., and Jarallah, Y. (2009). The transition to lower fertility in the West Bank and Gaza Strip: Evidence from recent surveys. Population Research 26(2): 153-174. doi:10.1007/s12546-009-9009-2.
Machiyama, K. (2010). A re-examination of recent fertility declines in Sub-Saharan Africa. Calverton, Maryland, USA: ICF Macro (DHS Working Paper, 68).
Measure DHS (2011). STATcompiler [electronic resource]. Calverton, Maryland: ICF Macro.
Menken, J., Khan, M.N., and Williams, J. (2009). The stalled fertility transition in Bangladesh: The effects of sex and number preferences. Paper presented at the International Union for the Scientific Study of Population XXVI International Population Conference, Marrakech.
Moultrie, T., Hosegood, V., McGrath, N., Hill, C., Herbst, K., and Newell, M.-L. (2008). Refining the criteria for stalled fertility declines: An application of rural KwaZulu-Natal, South Africa, 1990-2005. Studies in Family Planning 39(1): 39-48. doi:10.1111/j.1728-4465.2008.00149.x.
Myers, R.J. (1940). Errors and bias in the reporting of ages in census data. Transactions of the Actuarial Society of America 41(II): 395-415.
Nahmias, P. and Stecklov, G. (2007). The dynamics of fertility amongst Palestinians in Israel from 1980 to 2000. European Journal of Population 23(1): 71-99. doi:10.1007/s10680-006-9113-3.

Cetorelli & Leone: Is fertility stalling in Jordan?
http://www.demographic–research.org 318
Pullum, T.W. (2006). An assessment of age and date reporting in the DHS Surveys, 1985-2003. Calverton, Maryland: Macro International Inc. (Methodological Report, 5).
Rizk, H. (1977). Trends in fertility and family planning in Jordan. Studies in Family Planning 8(4): 91-99. doi:10.2307/1966113.
Rodríguez, G. (2006). Digit preference. Princeton University: Office of Population Research (ECO 572: Research Methods in Demography).
Sathar, Z.A. (2007). Stagnation in fertility levels in Pakistan. Asia-Pacific Population Journal 22(2): 113-131.
Schoumaker, B. (2004). A person-period approach to analysing birth histories. Population-E 59(5): 689-702. doi:10.3917/pope.405.0689.
Schoumaker, B. (2006). The reconstruction of fertility trends with DHS birth histories. Application of Poisson regression to person-period data. Paper presented at the Conference of the European Association for Population Studies, Liverpool.
Schoumaker, B. (2009). Stalls and reversals in fertility transitions in Sub-Saharan Africa: Real or spurious? Louvain-La-Neuve: Université Catholique De Louvain (Working Paper, 30).
Schoumaker, B. (2010). Reconstructing Fertility Trends in Sub-Saharan Africa by Combining Multiple Surveys Affected by Data Quality Problems. Paper presented at the annual meeting of the Population Association of America, Dallas.
Shapiro, D. and Gebreselassie, T. (2008). Fertility transition in Sub-Saharan Africa: Falling and stalling. African Population Studies 23(1): 3-23.
Shapiro, D., Kreider, C., Varner, C., and Sinha, M. (2010). Stalling of Fertility Transitions and Socioeconomic Change in the Developing World: Evidence from the Demographic and Health Surveys. Chaire Quetelet Annual Symposium in Demography at the Catholic University of Louvain, Belgium (prepared paper).
Sullivan, J. (2008). An assessment of the credibility of child mortality declines estimated from DHS mortality rates. UNICEF (Working Draft; Revision 1, 10/29/08).
Westoff, C. and Cross, A. (2006). The stall in the fertility transition in Kenya. Calverton, Maryland: ORC Macro (DHS Analytical Studies, 9).