Is dietary niche breadth linked to morphology and ... et al 2013 Biol J Linn... · Is dietary niche...
15
Is dietary niche breadth linked to morphology and performance in Sandveld lizards Nucras (Sauria: Lacertidae)? SHELLEY EDWARDS 1,2 *, KRYSTAL A. TOLLEY 1,2 , BIEKE VANHOOYDONCK 3 , G. JOHN MEASEY 4 and ANTHONY HERREL 5 1 Applied Biodiversity Research Division, South African National Biodiversity Institute, Claremont 7735, Cape Town, South Africa 2 Department of Botany and Zoology, University of Stellenbosch, Private Bag X1, Matieland 7602, South Africa 3 Department of Biology, University of Antwerp, Antwerp, Belgium 4 Department of Zoology, Nelson Mandela Metropolitan University, PO Box 77000, Port Elizabeth 6031, South Africa 5 Département d’Ecologie et de Gestion de la Biodiversité, UMR 7179 CNRS/MNHN, 57 rue Cuvier, Case postale 55, 75231, Paris, Cedex 5, France Received 28 March 2013; revised 1 June 2013; accepted for publication 2 June 2013 The functional characteristics of prey items (such as hardness and evasiveness) have been linked with cranial morphology and performance in vertebrates. In lizards particularly, species with more robust crania generally feed on harder prey items and possess a greater bite force, whereas those that prey on evasive prey typically have longer snouts. However, the link between dietary niche breadth, morphology, and performance has not been explicitly investigated in lizards. The southern African genus Nucras was used to investigate this link because the species exhibit differing niche breadth values and dietary compositions. A phylogeny for the genus was established using mitochondrial and nuclear markers, and morphological clusters were identified. Dietary data of five Nucras species, as reported previously, were used in correlation analyses between cranial shape (quantified using geometric morphometrics) and dietary niche breadth, and the proportion of hard prey taken and bite force capacity. Dietary niche breadth and the proportion of hard prey eaten were significantly related to cranial shape, although not once phylogeny was accounted for using a phylogenetic generalized least squares regression. The proportion of evasive prey eaten was a significant predictor of forelimb length when phylogeny was taken into account. We conclude that, in Nucras, the percentage of evasive prey taken co-evolves with forelimb morphology, and dietary niche breadth co-evolves with cranial shape. However, although head width is correlated with the proportion of hard prey eaten, this appears to be the result of shared ancestry rather than adaptive evolution. © 2013 The Linnean Society of London, Biological Journal of the Linnean Society, 2013, 110, 674–688. ADDITIONAL KEYWORDS: bite force – co-evolution – geometric morphometrics – phylogenetic generalized least squares regression – phylogeny – southern Africa – sprintspeed. INTRODUCTION Adaptations to particular habitats can be physiologi- cal, morphological or behavioural, and are often driven by a multitude of factors, such as habitat structure (Vitt, 1981; Vitt et al., 1997; Revell et al., 2007; Goodman & Isaac, 2008; Goodman, 2009; Measey, Hopkins & Tolley, 2009; Edwards et al., 2012), prey composition (Herrel et al., 2008), and sea- sonality (Huey, Pianka & Hoffman, 1977), amongst others. Variation in morphology may be driven by a number of factors, such as sexual selection (Braña, 1996), competition (Langkilde, 2009), foraging *Corresponding author. E-mail: [email protected] Biological Journal of the Linnean Society, 2013, 110, 674–688. With 4 figures © 2013 The Linnean Society of London, Biological Journal of the Linnean Society, 2013, 110, 674–688 674
-
Upload
vuongnguyet -
Category
Documents
-
view
218 -
download
0
Transcript of Is dietary niche breadth linked to morphology and ... et al 2013 Biol J Linn... · Is dietary niche...

Is dietary niche breadth linked to morphologyand performance in Sandveld lizards Nucras(Sauria: Lacertidae)?
SHELLEY EDWARDS1,2*, KRYSTAL A. TOLLEY1,2, BIEKE VANHOOYDONCK3,G. JOHN MEASEY4 and ANTHONY HERREL5
1Applied Biodiversity Research Division, South African National Biodiversity Institute, Claremont7735, Cape Town, South Africa2Department of Botany and Zoology, University of Stellenbosch, Private Bag X1, Matieland 7602,South Africa3Department of Biology, University of Antwerp, Antwerp, Belgium4Department of Zoology, Nelson Mandela Metropolitan University, PO Box 77000, Port Elizabeth6031, South Africa5Département d’Ecologie et de Gestion de la Biodiversité, UMR 7179 CNRS/MNHN, 57 rue Cuvier,Case postale 55, 75231, Paris, Cedex 5, France
Received 28 March 2013; revised 1 June 2013; accepted for publication 2 June 2013
The functional characteristics of prey items (such as hardness and evasiveness) have been linked with cranialmorphology and performance in vertebrates. In lizards particularly, species with more robust crania generally feedon harder prey items and possess a greater bite force, whereas those that prey on evasive prey typically have longersnouts. However, the link between dietary niche breadth, morphology, and performance has not been explicitlyinvestigated in lizards. The southern African genus Nucras was used to investigate this link because the speciesexhibit differing niche breadth values and dietary compositions. A phylogeny for the genus was established usingmitochondrial and nuclear markers, and morphological clusters were identified. Dietary data of five Nucras species,as reported previously, were used in correlation analyses between cranial shape (quantified using geometricmorphometrics) and dietary niche breadth, and the proportion of hard prey taken and bite force capacity. Dietaryniche breadth and the proportion of hard prey eaten were significantly related to cranial shape, although not oncephylogeny was accounted for using a phylogenetic generalized least squares regression. The proportion of evasiveprey eaten was a significant predictor of forelimb length when phylogeny was taken into account. We conclude that,in Nucras, the percentage of evasive prey taken co-evolves with forelimb morphology, and dietary niche breadthco-evolves with cranial shape. However, although head width is correlated with the proportion of hard prey eaten,this appears to be the result of shared ancestry rather than adaptive evolution. © 2013 The Linnean Society ofLondon, Biological Journal of the Linnean Society, 2013, 110, 674–688.
ADDITIONAL KEYWORDS: bite force – co-evolution – geometric morphometrics – phylogenetic generalizedleast squares regression – phylogeny – southern Africa – sprintspeed.
INTRODUCTION
Adaptations to particular habitats can be physiologi-cal, morphological or behavioural, and are oftendriven by a multitude of factors, such as habitat
structure (Vitt, 1981; Vitt et al., 1997; Revell et al.,2007; Goodman & Isaac, 2008; Goodman, 2009;Measey, Hopkins & Tolley, 2009; Edwards et al.,2012), prey composition (Herrel et al., 2008), and sea-sonality (Huey, Pianka & Hoffman, 1977), amongstothers. Variation in morphology may be driven by anumber of factors, such as sexual selection (Braña,1996), competition (Langkilde, 2009), foraging*Corresponding author. E-mail: [email protected]
bs_bs_banner
Biological Journal of the Linnean Society, 2013, 110, 674–688. With 4 figures
© 2013 The Linnean Society of London, Biological Journal of the Linnean Society, 2013, 110, 674–688674
method (Huey & Pianka, 1981; Huey et al., 1984;Verwaijen & Van Damme, 2007a, b, 2008; McBrayer& Wylie, 2009), and prey availability (Herrel et al.,2001; Verwaijen, Van Damme & Herrel, 2002). Thedietary composition, particularly the type of preytaken, may influence the head morphology of lizards(Herrel et al., 2001; Verwaijen et al., 2002). Lizardspecies that consume harder prey have been shown tohave relatively wider, more robust heads (in lacertidlizards: Herrel et al., 2001), which are assumed toallow more space for jaw adductor muscles (Herrelet al., 1999a) or a more vertical orientation of the jawadductors (Herrel, Aerts & De Vree, 1998). Selectivepressures on the functional aspects of the organism(i.e. organismal performance) may lead to the evolu-tion of particular phenotypes, which may lead togreater fitness (Arnold, 1983). Functionally, relativelylarger and more robust crania have been linked togreater bite forces in lizards (Anolis: Herrel et al.,2007; Podarcis: Herrel et al., 2001; Huyghe,Vanhooydonck & Van Damme, 2009), and a greaterbite force may be advantageous for lizards in thatthey may be able to feed on harder and larger prey(Herrel et al., 1999a). Other aspects of the crania,such as snout lengths, have been linked to thecapture of evasive prey items. For example, in anoles,longer jaws are assumed to facilitate easier capture offlying insects (Herrel, McBrayer & Larson, 2007;Herrel et al., 2011). Other functional aspects oflizards, such as the sprint speed and endurance,have been linked to the capture of evasive prey(Vanhooydonck, Herrel & Van Damme, 2007).
Although feeding on hard and/or evasive prey hasbeen linked to head shape and functional aspects ofhead and limb morphology in lizards (Vanhooydoncket al., 2007; Measey et al., 2011), the relationshipbetween dietary niche breadth (range of prey taken)and morphology has not been explicitly investigated.If a lizard species is specialized (low niche breadthvalue) to feed on a particular type of prey (e.g. hard orevasive prey), it may have particular phenotypic andbehavioural traits that allow for the capture of thatprey. On the other hand, if the species is a generalist,feeding on a large range of prey items, its morphologywould be versatile, enabling the processing of a largerange of prey types (e.g. hard or soft and/or evasive orsedentary prey). Investigations of the relationshipbetween body size and niche breadth in lizards havebeen undertaken (Costa et al., 2008), where a nega-tive relationship was found between body size andniche breadth in 159 lizard species. This was contraryto positive body size-niche breadth relationships inbirds (Brändle et al., 2002b), butterflies and moths(Wasserman & Mitter, 1978; Brändle, Ohlschlager &Brandl, 2002a) and herbivorous insects (Novotny &Basset, 1999), although the negative relationship in
lizards was attributed to the overall frequency distri-bution of body sizes in lizards. Little information,however, is available on the link between dietaryniche breadth and morphology in lizards, and theassociated variation in performance.
The southern African lacertid genus Nucras(Eremiadini, Lacertidae) was used to investigate thelink between dietary niche breadth and morphologybecause the species of this genus differ in dietaryniche breadth (Van Der Meer, Whiting & Branch,2010). Nucras are predominantly insectivorous, sup-plementing their diet with spiders, scorpions, andcentipedes, and each species preys upon arthropods ofvarying degrees of hardness and evasiveness (Branch,1998; Spawls, Howell & Drewes, 2006; Van Der Meeret al., 2010). All Nucras are described as active forag-ers (Branch, 1998), and thus morphological differ-ences between species are likely not driven byforaging methods but, instead, by other factors (suchas diet). There are ten described species from Eastand southern Africa (Branch, 1998); however, dietarydata for only five species are available to date (VanDer Meer et al., 2010).
In the present study, we hypothesized that cranialshape in lizards of the genus Nucras is related todietary niche breadth, and that functional capacitiesare linked to dietary composition. Although allNucras are described as active foragers (as opposed tosit-and-wait foragers), the type of prey that they areable to prey upon may be determined by their mor-phology. We predicted that species specializing onhard prey items would have more robust crania andhigher bite forces, and that those species feeding onevasive prey would have longer limbs and bettersprinting capacities. We constructed a phylogeny forthe genus, using both mitochondrial and nuclearmarkers, aiming to determine the evolutionaryhistory of the genus and to investigate potentialphylogenetic effects driving morphological similaritybetween species. We used linear morphometric tech-niques to identify morphologically similar groups ofspecies. Using the five species for which dietary dataare available, we first investigated the relation-ships between cranial morphology (using geometricmorphometric techniques), dietary niche breadth,prey characteristics, and bite force. We then investi-gated the relationship between limb lengths andsprinting capacity, and the proportion of evasive preytaken.
MATERIAL AND METHODSDNA EXTRACTION AND SEQUENCING
For the phylogenetic comparative methods, we esti-mated the phylogeny of Nucras using 48 individuals
NICHE BREADTH AND PHENOTYPE IN NUCRAS 675
© 2013 The Linnean Society of London, Biological Journal of the Linnean Society, 2013, 110, 674–688

from eight of the ten described species (Nucrasscalaris and Nucras caesicaudata were not includeddue to lack of samples; see Supporting information,Table S1). Thirty individuals were collected in thefield and tissue was stored in 95–100% ethanol. Thedataset was supplemented with sequences from sixindividuals available on GenBank/EMBL. Individualsfrom seven related genera within the Eremiadini(Australolacerta, Heliobolus, Ichnotropis, Latastia,Meroles, Philocortus, and Pseuderemias) obtainedfrom GenBank were used as outgroup taxa (Mayer &Pavlicev, 2007; Kapli et al., 2011). For all newlysequenced individuals, genomic DNA was isolatedfrom tail or liver tissue in accordance with a standardsalt-extraction protocol (Bruford et al., 1992). Stand-ard polymerase chain reaction (PCR) procedures wereutilized to amplify two mitochondrial (16S and ND4)and two nuclear genes (RAG1 and KIAA-2018). Forthe mitochondrial genes, the primer pairs L2510 andH3080 16S rRNA primers (Palumbi, 1996) and ND4(Forstner, Davis & Arevalo, 1995) and Leu1 (Arévalo,Davis & Sites, 1994) primers were used to amplify the16S and ND4 genetic markers, respectively. Theprimers RAG1-F0 and RAG1-R1 (Mayer & Pavlicev,2007), and KIAA2018-F1 and KIAA2018-R2 (Portiket al., 2011) were used to amplify the partial nuclearRAG1 and KIAA-2018 genes, respectively. For ampli-fication of the four genetic markers, 25-μL PCR mixescontained approximately 50 ng of genomic DNA,1 × SuperTherm reaction buffer, 1.5 mM MgCl2,0.2 μM of each primer, 200 μM dNTPs, and0.025 U/μL Taq polymerase (SuperThermTaq; South-ern Cross Biotechnologies). For the 16S, ND4, andKIAA-2018 gene fragments, a standard PCR protocolwas followed, with a cycling profile including aninitial denaturing step at 94 °C for 4 min, followed by35 cycles of 94 °C for 30 s, 50–55 °C for 30 s, and72 °C for 45 s, and with a final extension at 72 °C for8 min. Methods for the amplification of the RAG1gene region involved the use of a step-down procedure(Groth & Barrowclough, 1999). The products weresent directly to Macrogen for clean up and sequenc-ing, using the forward primers in all cases. Sequenceswere aligned using CLUSTALOMEGA, version 1.1.0(Sievers et al., 2011) and checked in BIOEDIT,version 7.0.5.2 (Hall, 1999). A 168-bp portion of the16S marker that could not be unambiguously alignedwas excluded from the analyses. Details of thesamples and EMBL accession numbers are providedin the Supporting information (Table S1).
PHYLOGENETIC TREE ESTIMATIONS
A partition homogeneity test (Farris et al., 1994,1995) was implemented in PAUP*, version 4.0b10(Swofford, 2002), and no conflict was found between
markers within each genome, nor between genomes.Sequence divergences were determined by estimat-ing the uncorrected p-distances between and withinspecies using MEGA, version 4 (Tamura et al.,2007).
Phylogenetic trees were constructed from the com-bined total evidence dataset from all four markers.Bayesian inference (BI) was performed with uniformpriors for all parameters (MRBAYES, version 3.1.0;Huelsenbeck & Ronquist, 2001; Ronquist &Huelsenbeck, 2003). The third codon position of theND4 gene was found to be saturated (DAMBE,version 5.2.65; Xia et al., 2003), and so it was parti-tioned separately from the other two codon positionsof the ND4 gene (1, the first and second codon posi-tions; 2, the third codon position). The remainingmarkers were partitioned separately resulting infive partitions in total. Evolutionary models bestfitting the individual marker datasets were chosen(MODELTEST, version 3.7; Posada & Crandall, 1998)and model priors were set accordingly (16S: GTR+G,ND4: GTR+I+G, RAG1: HKY+G, KIAA-2018:HKY+G). Two parallel runs for 20 × 106 generationseach were run for Markov chain Monte Carlo analy-sis, with trees sampled every 1000 generations. Thenumber of generations to discard as burn-in (1 × 10⁶
generations) was determined by examining thenumber of generations (1) at which the standarddeviation of split frequencies stabilized (at less than0.001); (2) at which the log-likelihood tree scoresreached stationarity; and (3) the effective samplesizes of all parameters were ≥ 400 (TRACER, version1.5; Rambaut & Drummond, 2007). A 50% majorityrule tree was constructed with the burn-in excludedusing the ‘sumt’ command in MRBAYES, and nodeswith ≥ 0.95 posterior probability were considered sup-ported. A partitioned maximum likelihood (ML)analysis was also run (RAXML, version 7.2.7, via theCipres Portal; Stamatakis, 2006; Stamatakis, Hoover& Rougemont, 2008) using the same partitions as theBayesian analysis, a GTR+I+G model of evolution,and automatic halting of bootstrapping (Stamatakis,2006; Stamatakis et al., 2008).
LINEAR MORPHOMETRIC ANALYSIS
For the linear morphometric analyses, 187 individu-als of nine Nucras species were measured usingdigital callipers (approximately 20 per species,N. scalaris was not included because of a lack ofspecimens; see Supporting information, Table S2).Measurements taken on the body and limbs were:body length from snout–vent length (SVL), femurlength (FM), tibia length (TB), humerus length (HM),and radius length (RD). Head measurements takenwere: head length (HL), head width at the widest part
676 S. EDWARDS ET AL.
© 2013 The Linnean Society of London, Biological Journal of the Linnean Society, 2013, 110, 674–688

of the temporal region (HW), head height of theposterior part of the cranium (HH), and lower jawlength (LJL). Unless otherwise specified, all analyseswere performed using R STUDIO, version 0.97.248 (RCore Team, 2012; R Studio, 2012). To eliminate theeffect of size in the traditional morphometric analy-ses, log10-transformed head and limb measurementswere regressed onto the geometric means of the par-ticular set of measurements using a linear model(package: ‘stats’, functions: ‘resid’ and ‘lm’; R CoreTeam, 2012). The absolute values and the size-corrected residuals for each morphometric characterwere used in further analyses. To identify whetherthe morphology of the lizards was linked to theirgenetic relationships, hierarchical clustering of themeans of the size-corrected residuals for each species(package: ‘stats’, function: ‘mean’; R Core Team, 2012)was performed to identify the morphological clustersand support for the nodes was obtained using 1000bootstrap replicates (package: ‘pvclust’, function:‘pvclust’, method.hclust: ‘complete’, method.dist:‘euclidean’, nboot: 1000; R Core Team, 2012). If themorphological clusters do not correspond to geneticclusters, then differences in morphology may bedriven by environmental factors such as diet or sub-strate and not solely by phylogenetic relationships,and further investigations into these factors would bewarranted.
DIETARY ANALYSIS
Five species (Nucras holubi, Nucras intertexta,Nucras lalandii, Nucras ornata, and Nucrastessellata; hereafter referred to as the ‘dietaryspecies’) were used to investigate the relationshipbetween diet and head shape because dietary infor-mation on these species was available (Table 1;adapted from Van Der Meer et al., 2010). Thesespecies can be considered as being characteristic formajor patterns in the genus because they are distrib-uted across the southern African landscape (Branch,1998), are representatives from each major geneticclade within the genus (see Results for phylogeneticanalysis), and are also representatives of each majormorphometric cluster (for hierarchical cluster analy-sis, see Results). The percentage volume in the dietfor each insect order was used in the analyses(adapted from Van Der Meer et al., 2010). In thedietary analyses, sexes were combined because therewere no significant differences in the percentagevolume of the different prey eaten by the two sexes(Van Der Meer et al., 2010). Although the diet of bothsexually mature and sexually immature individualswas examined in the analyses by Van Der Meer et al.(2010), mean prey volume was significantly correlatedwith SVL for N. intertexta and N. ornata but not for
N. holubi, N. lalandii and N. tessellata (Van Der Meeret al., 2010), indicating that possibly ontogeneticeffects are at play in terms of the percentage volumeof prey consumed by each age class in N. intertextaand N. ornata. Because the differences in preyvolume, number or type between age-classes werenot explicitly examined by Van Der Meer et al. (2010),we cannot exclude ontogenetic effects on preyconsumption.
Dietary niche breadth values (hereafter referred toas the niche breadth) for each species were estimatedusing the inverse of Simpson’s diversity index(Simpson, 1949):
B pi
N
==∑1 2
1
i
where B is the niche breadth value, i is the resourcecategory, N is the total number of categories, and p isthe proportion of resource category i. These nichebreadth values, ranging from one to n, indicatewhether the species preys upon a large range ofarthropod orders (high value, close to n) or specializeson a limited range of arthropod orders (low value,close to one). Each arthropod order was categorized aseither hard or soft, sedentary or evasive (Herrel, VanDamme & De Vree, 1996; Andrews & Bertram, 1997;Herrel et al., 1999a; Herrel, Verstappen & De Vree,1999b; Herrel et al., 2001; Verwaijen et al., 2002;Aguirre et al., 2003; Herrel et al., 2006; Vanhooydoncket al., 2007) and the percentage volumes of two preycategories were calculated for each studied species ofNucras (Table 1).
GEOMETRIC MORPHOMETRIC ANALYSIS
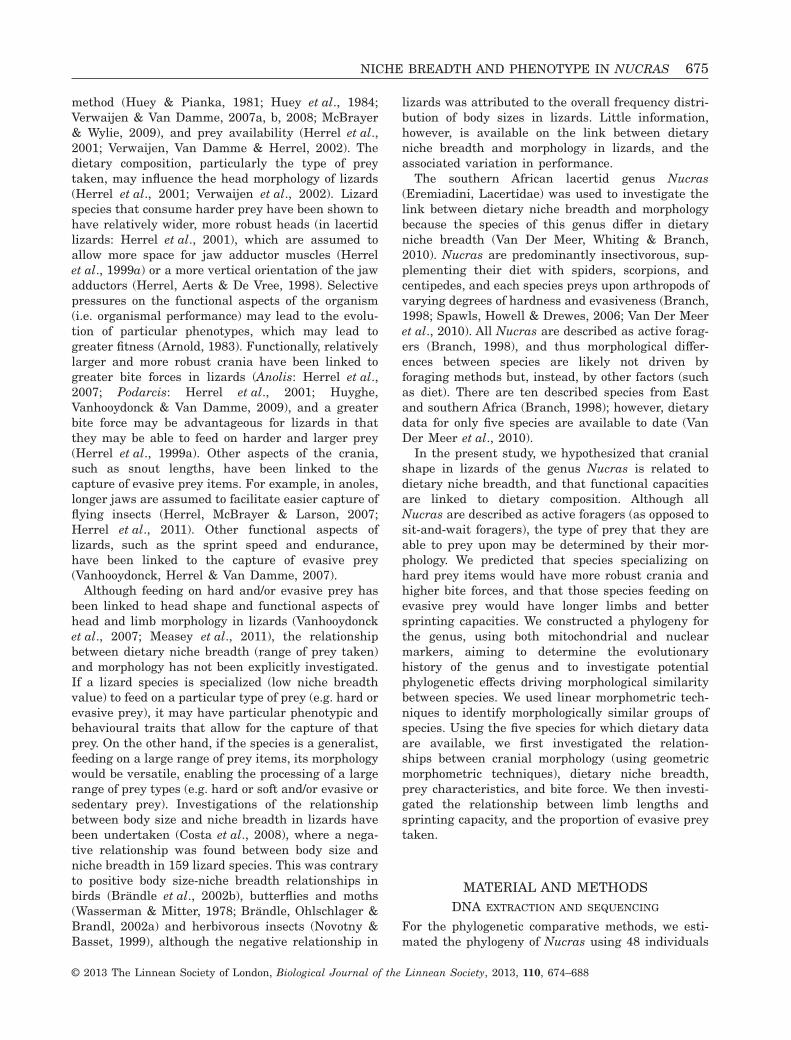
Geometric morphometric analyses of the crania wereperformed to investigate the cranial shape of thefive species used in the dietary analyses (14–22individuals per species, totalling 100 individuals; seeSupporting information, Table S2). The heads werephotographed using digital cameras (Fuji FinepixS2000HD, resolution 10.0 MP; Canon 50D, resolution10.0 MP and macro lens F18/100). The dorsal andlateral profiles were used because head width, headheight, and snout length have been shown to beimportant in species feeding on hard and/or evasiveprey; dimensions that would not have been apparentfrom other views of the crania (such as the ventralview). Homologous landmarks were chosen to appro-priately describe the shape of the whole cranium,and landmarks on the cheek region were includedand digitized (TPSUTIL, version 1.26, Rohlf, 2004;TPSDIG2, version 2.05, Rohlf, 2005; Fig. 1). A gener-alized Procrustes analysis (Rohlf & Slice, 1990;Rohlf, 1999) was performed in which the sizes were
NICHE BREADTH AND PHENOTYPE IN NUCRAS 677
© 2013 The Linnean Society of London, Biological Journal of the Linnean Society, 2013, 110, 674–688

Tab
le1.
Per
cen
tage
volu
me
ofpr
eyco
nsu
med
per
spec
ies
use
din
the
diet
ary
anal
yses
(sen
suV
anD
erM
eer
etal
.,20
10),
asw
ell
aspr
eyh
ardn
ess
and
evas
iven
ess
cate
gori
es(V
anh
ooyd
onck
etal
.,20
07),
and
nic
he
brea
dth
valu
es(c
alcu
late
din
the
pres
ent
stu
dy)
for
each
spec
ies
Cat
egor
ies
Pre
yh
ardn
ess
Pre
yev
asiv
enes
sN
ucr
ash
olu
biN
ucr
asin
tert
exta
Nu
cras
lala
nd
iiN
ucr
asor
nat
aN
ucr
aste
ssel
lata
Pre
yor
der
Ara
nea
eS
oft
Sed
enta
ry1.
906.
701.
4015
.30
1.30
Bla
ttar
iaS
oft
Eva
sive
2.50
13.0
00.
000.
500.
00C
hil
opod
aS
oft
Eva
sive
3.50
10.1
01.
3017
.60
0.30
Col
eopt
era
Har
dE
vasi
ve15
.60
11.5
018
.20
1.10
16.4
0D
iplo
poda
Sof
tS
eden
tary
0.00
0.00
0.50
0.20
0.00
Dip
tera
Sof
tE
vasi
ve3.
300.
900.
002.
700.
00H
emip
tera
Har
dE
vasi
ve0.
804.
400.
000.
400.
60H
ymen
opte
raH
ard
Eva
sive
1.00
0.50
0.80
0.00
0.00
An
tsH
ard
Sed
enta
ry0.
200.
000.
000.
3053
.00
Inse
cteg
gsS
oft
Sed
enta
ry0.
000.
001.
400.
000.
00Is
opte
raS
oft
Sed
enta
ry39
.30
7.60
3.30
8.50
11.3
0L
epid
opte
raS
oft
Eva
sive
2.50
11.7
00.
001.
301.
60M
anto
dea
Sof
tS
eden
tary
1.30
0.30
0.00
0.00
0.00
Neu
ropt
era
Sof
tE
vasi
ve0.
000.
000.
000.
001.
80O
rth
opte
raH
ard
Eva
sive
24.6
015
.40
63.3
049
.90
13.7
0S
corp
ion
esS
oft
Eva
sive
1.60
2.70
10.5
01.
400.
00S
olif
uga
eH
ard
Sed
enta
ry1.
204.
900.
000.
000.
00N
ich
ebr
eadt
h4.
1010
.75
2.24
3.21
2.94
Pro
port
ion
sH
ard
prey
perc
enta
ge0.
440.
410.
820.
520.
84E
vasi
vepr
eype
rcen
tage
0.56
0.78
0.93
0.76
0.34
Per
form
ance
Max
imu
mbi
tefo
rces
(N)
8.20
±2.
0124
.23
±7.
19−
−13
.85
±4.
93R
esid
ual
bite
forc
e0.
250.
21−
−0.
02M
axim
um
spri
nt
spee
ds(m
s−1)
2.88
±0.
433.
03±
0.61
4.17
−2.
39±
0.16
Res
idu
alsp
rin
tsp
eeds
0.03
−0.0
030.
30−
−0.1
9
Per
cen
tage
volu
me
ofh
ard
and
evas
ive
prey
con
sum
edpe
rsp
ecie
su
sed
inth
edi
etar
yan
alys
esan
dpe
rfor
man
ceva
lues
(max
imal
bite
forc
ean
dsp
rin
tsp
eeds
)fo
rea
chsp
ecie
s.V
alu
esfo
rth
epe
rfor
man
cem
ean
sar
egi
ven
asth
em
ean
±S
D.
678 S. EDWARDS ET AL.
© 2013 The Linnean Society of London, Biological Journal of the Linnean Society, 2013, 110, 674–688
standardized and the landmark configurations weretranslated and rotated. A relative warps analysis(similar to a principal components analysis) was per-formed on the residuals to identify which portions ofthe crania show the most variation between individu-als and species (TPSRELW; Rohlf, 2003). Deformationgrids (thin-plate splines) were used to visualizechanges in cranial shape.
PERFORMANCE ANALYSIS
The performance capacities of four Nucrasspecies (N. holubi, N. intertexta, N. lalandii, andN. tessellata; see Supporting information, Table S3),caught and measured in the field, were used to iden-tify the functional relationship between morphologyand diet (sample sizes: N. holubi = 5, N. intertexta =19, N. lalandii = 1, and N. tessellata = 2). Themaximal bite force out of five trials was determinedby having the lizard bite two metal plates connectedto an isometric force transducer and a charge ampli-fier (Herrel et al., 1999a, 2001). For the bite forceanalyses, N. lalandii was not included as a resultof the poor biting performance of the single indivi-dual obtained during field work. To eliminate theeffect of size, the log10-transformed maximal bite force
values were regressed onto the log10-transformed geo-metric means of the head measurements (i.e. themean of the sum of HL, HW, HH, and LJL) using alinear model (package: ‘stats’, functions: ‘resid’ and‘lm’; R Core Team, 2012) and the mean residuals foreach species were used in subsequent analyses.
To determine the maximal sprint speed for eachspecies, the lizards were allowed to rest in an incu-bator at 35 °C for 1 h before each trial to standardizebody temperature. The temperature was chosenaccording to the preferred body temperatures forother lacertid lizards (Huey et al., 1977; Bauwenset al., 1995; Castilla, Van Damme & Bauwens, 1999;Vanhooydonck, Van Damme & Aerts, 2001) becauseoptimal body temperature for performance trials havenot been identified for all Nucras species (onlyN. intertexta and N. tessellata; Huey et al., 1977). Thesprint speeds were determined using a 2-m long cork-covered racetrack with sensors placed at 25-cm inter-vals along the track (Vanhooydonck et al., 2001). Runswere repeated three times, and lizards were allowedto rest for at least 1 h between each run, and themaximum of the sprint speeds for each individualwere taken (measured in metres per second). Thelog10-transformed maximal sprint speed values wereregressed onto the log10-transformed geometric meansof the limb measurements to eliminate the effect ofsize (package: ‘stats’, function: ‘resid’ and ‘lm’; R CoreTeam, 2012) and the mean residuals for each specieswere used in further analyses.
STATISTICAL ANALYSIS
Correlation analyses were performed between themean morphometric variables for each species (bothsize-corrected linear morphometric residuals and geo-metric relative warp scores), dietary niche breadthvalues, proportions of hard and evasive prey, andmean size-corrected performance residuals for eachspecies (package: ‘stats’, functions: ‘cor.test’ and‘summary.lm’; R Core Team, 2012).
PHYLOGENETIC COMPARATIVE ANALYSIS
A phylogenetic generalized least squares analysis(PGLS; Grafen, 1989; Hansen & Martins, 1996;Hansen, 1997; Martins & Hansen, 1997; Martins &Housworth, 2002) was employed to identify the coevo-lution of morphological traits and dietary composi-tion, and performance variables (package: ‘nlme’,function: ‘gls’, method: ‘REML’; R Core Team, 2012).The mean species values of the both absolute andrelative log10-transformed morphometric and perfor-mance traits were used in the analyses. The PGLSmethod statistically accounts for the expected covari-ance of the measured variables between species
12
35
8
12
1318
17
1615
1110
64
1
2
14
1312
1110
9
8
76
5
4 3
1914 9
7
Figure 1. Diagram depicting the homologous landmarksthat were digitized for the geometric morphometric analy-ses for the dorsal (top) and lateral (bottom) views of theNucras crania.
NICHE BREADTH AND PHENOTYPE IN NUCRAS 679
© 2013 The Linnean Society of London, Biological Journal of the Linnean Society, 2013, 110, 674–688
resulting from phylogenetic relationship forregression-based or analyses of variance, at the sametime as incorporating an explicit model of evolution.A significant result indicates that the relationshipholds once phylogeny has been accounted for. Thephylogenetic covariance matrix was estimated usingthe branch lengths from the phylogenetic tree and theexpected pattern of phylogenetic covariance specifiedby the Brownian Motion (BM) model of evolution(package: ‘ape’, function: ‘corBrownian’; Paradis,2012). PGLS analyses were not performed for biteforce values, as the low sample size (three meanvalues) would give spurious results.
RESULTSPHYLOGENETIC RELATIONSHIPS AND MORPHOLOGICAL
CLUSTERING OF ALL NUCRAS
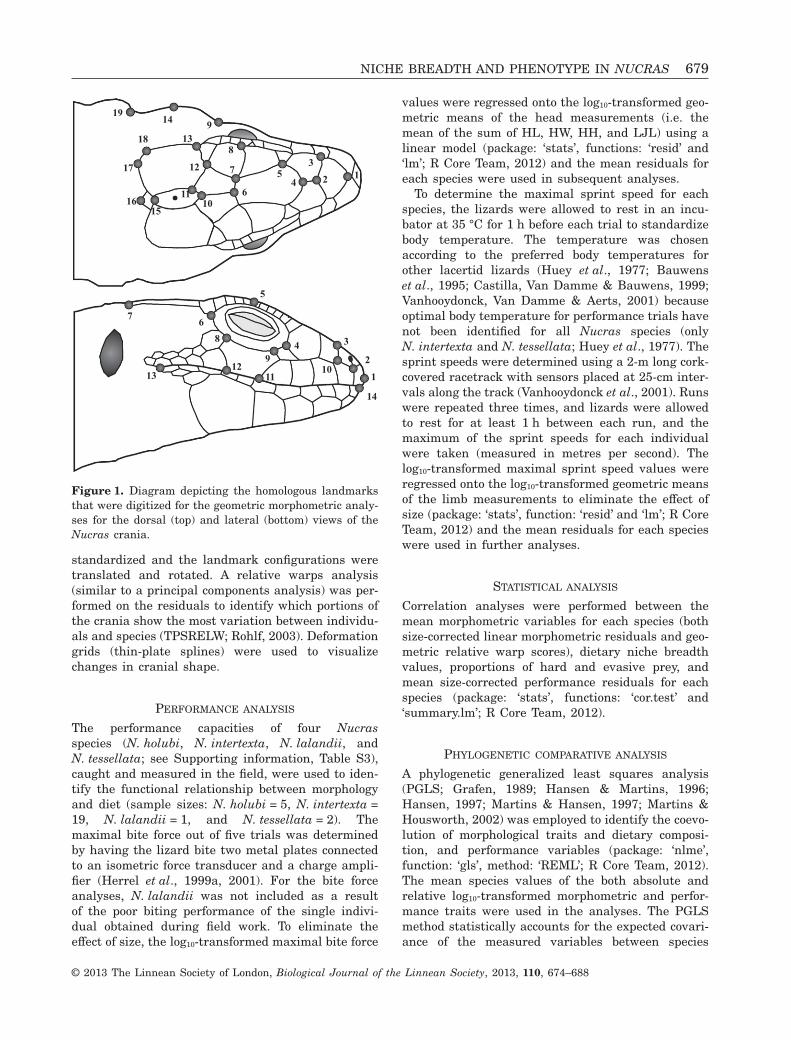
Phylogenetic trees constructed using both methods(BI and ML) had the same topology with high supportvalues for the clades recovered (Fig. 2A; Fig. S2). Alldescribed species were recovered as monophyletic,with high sequence divergences (uncorrectedp-distances) between them (16S: 5.80 ± 2.47%; ND4:13.31 ± 1.12%; RAG1: 1.07 ± 0.51%; KIAA:0.58 ± 0.29%). The separate clades are geographically
proximate: the single sample of Nucras boulengeri(the only species from East Africa) is sister to theremaining Nucras species, which are themselves splitinto two well-supported main clades: Clade A (coastaland south-interior of southern Africa) and Clade B(savannah biome of southern Africa) (Fig. 2A; see alsoSupporting infromation, Fig. S1). The sequence diver-gences between N. boulengeri and the other Nucras(16S: 5.98 ± 1.44%; ND4: 16.95 ± 1.03%; RAG1: 5.41 ±0.84%; KIAA: 1.25 ± 0.41%) approximated the level ofsequence divergence between other genera in thisstudy (16S: 10.10 ± 1.79%; ND4: 16.58 ± 1.01%;RAG1: 5.59 ± 0.80%; KIAA: 2.61 ± 0.53%). Four mor-phological clusters were obtained using hierarchicalclustering analyses (Fig. 2B) but with little supportfor the four clusters, whereas relationships betweenspecies within the clusters was highly supported.Morphological clusters did not correspond to geneticclades, indicating that morphology may not only bedriven by the shared ancestry, but also by otherfactors, such as diet.
DIETARY, MORPHOLOGICAL, AND PERFORMANCE
ANALYSIS OF FIVE NUCRAS SPECIES
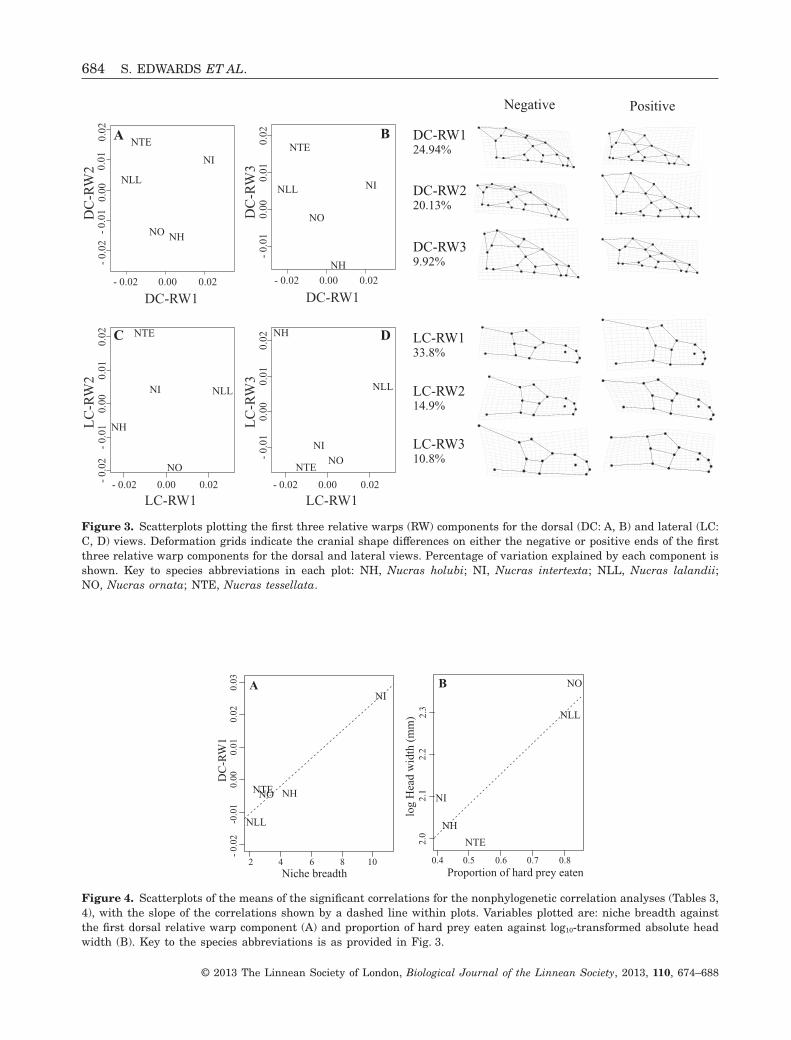
Two significant relationships were found between (1)niche breadth and the means of first dorsal cranial
Pseudoeremias
PhilocortusLatastia
IchnotropisMeroles
Australolacerta
0.2 substitutions per site
N. tessellata
N. taeniolata
N. livida
N. lalandii
N. intertexta
N. ornata
N. holubi
N. boulengeri
Heliobolus
Clade A
Clade B
ACluster 1(CLS1)
Cluster 2(CLS2)
Cluster 3(CLS3)
B
N. tessellata
N. taeniolata
N. livida
N. lalandii
N. intertexta
N. ornata
N. holubi
N. boulengeri
N. caesicaudata
Cluster 4(CLS4)
1.0100
1.01001.0
100
1.0100
1.099
1.0100
0.9565
0.9565
1.0100
0.8228
1.0100
0.6265 1.0
92
99
99
99
79
94
94
98
Figure 2. Phylogenetic tree shown (A) inferred from Bayesian analyses (BI) and likelihood methods (ML) using acombined dataset of mtDNA (16S, ND4) and nuclear DNA (RAG1, KIAA-2018) (topology from BI shown). Support valuesshown at the nodes and indicated by the circles at the nodes: Bayesian posterior probabilities > 0.90 (above node; left fillof circle) and ML bootstrap values > 50% (below node; right fill of circle). If a node is supported using both algorithms,the circle at the node is filled completely. Hierarchical clustering dendrogram (B) of the morphometric measurements,showing the four morphological clusters (CLS1–4) obtained. Supported values [AU (approximately unbiased) P-values]shown at the nodes, and dark-grey filled circles indicate nodes with strong support (AU > 95%), and light-grey filled circlesindicate nodes with moderate support (95% > AU > 90%).
680 S. EDWARDS ET AL.
© 2013 The Linnean Society of London, Biological Journal of the Linnean Society, 2013, 110, 674–688

view relative warp scores (positive relationship;Table 3) and (2) between the proportion of hard preyeaten and absolute head width (positive relationship;Fig. 4 and Tables 2 and 3). Bite force was significantlypositively related to body size (SVL) and linear headmeasurements (HL, HW, HH, and LJL; Table 3). Theproportion of evasive prey was not significantlyrelated to either absolute or relative limb measure-ments, or sprint speeds (Table 4). Sprint speeds werepositively related to absolute but not relative limbmeasurements, which was expected as larger indi-viduals will have longer stride-lengths and thereforewill be able to run faster than smaller individuals(Table 4).
The first three relative warps of the dorsal cranialview described the width and elongation of the cheekof the five Nucras species (Fig. 3). The first dorsalview relative warp (DC-RW1) was positively relatedto niche breadth in the nonphylogenetic correlations(Fig. 4, Table 3), indicating that species that are morespecialized, in this case specialist feeders on hardprey (N. tessellata and N. lalandii; Table 1), havecheek regions that are not as wide, and are moreposteriorly elongated (landmarks 8, 9, 13, 14, 18, and19; Fig. 3), compared to more generalist species(N. intertexta) (Fig. 3). The proportion of hard preyconsumed was not related to any of the relative warpscomponents, although it was significantly positivelyrelated to the absolute head width. There was norelationship between bite force and linear head meas-urements in the phylogenetic correlations, althoughthis is likely a result of the low sample size (threedata points = species means) used in the analyses.The lateral-view relative warp scores, describing theelongation of the snout (LC-RW1: landmarks 1–4, 10,11, 14) and posterior cranial height (LC-RW2 and-RW3: landmarks 6–8, 11, 12) (Fig. 3), were notrelated to either niche breadth or proportion of hardprey taken, which was similar to results for absolute
and relative linear measurements of head length andheight (Table 3).
PHYLOGENETIC COMPARATIVE ANALYSIS
There were no significant relationships between theproportion of hard prey eaten and cranial morphologyonce phylogeny was taken into account (Table 3), indi-cating that the relationships between these variablesin the nonphylogenetic correlations may be influencedby a shared ancestry. Interestingly, although therewere no significant relationships between the propor-tion of evasive prey and limb morphology, once phy-logeny was taken into account, there were significantrelationships between forelimb dimensions and theproportion of evasive prey taken (Table 4).
DISCUSSION
In the genus Nucras, we show a link between headshape, diet, and underlying functional performance atthe whole-organism level, before phylogeny is takeninto account. Clustering based on morphology did notcorrespond to the clades identified in the molecularphylogeny, indicating that factors other than phylog-eny influence the evolution of morphology in Nucraslizards. When the diet of selected species was com-pared with morphology and performance, dietaryniche breadth and the proportion of hard prey eatenwere found to be correlated with cranial shape,although not when phylogeny was accounted for, sug-gesting that cranial shape in the five species investi-gated is somewhat constrained by evolutionaryhistory. Absolute values of performance (bite force andsprint speeds) were significantly positively related toabsolute head and limb measurements, respectively.When phylogeny was accounted for, the relationshipbetween forelimbs and proportion of evasive prey was
Table 2. The mean ± SD of the linear morphometric measurements (mm) for the species used in the dietary analyses
CategoriesNucrasholubi
Nucrasintertexta
Nucraslalandii
Nucrasornata
Nucrastessellata
Sample number (N) 28 29 36 25 23Snout–vent length (SVL) 51.19 ± 4.83 68.73 ± 10.51 83.86 ± 11.67 76.84 ± 17.85 59.10 ± 9.03Head length (HL) 11.62 ± 1.00 14.99 ± 1.87 15.79 ± 1.88 17.08 ± 3.52 13.66 ± 1.98Head width (HW) 7.50 ± 0.94 8.18 ± 1.26 10.04 ± 1.55 10.99 ± 2.44 7.43 ± 1.29Head height (HH) 6.21 ± 0.98 6.99 ± 1.17 8.43 ± 1.16 8.48 ± 2.06 5.88 ± 1.08Lower jaw length (LJL) 12.67 ± 0.98 15.76 ± 1.89 17.05 ± 1.99 19.85 ± 4.40 14.25 ± 1.98Femur length (FM) 8.25 ± 0.99 11.31 ± 1.87 11.07 ± 1.39 11.37 ± 2.46 9.87 ± 1.49Tibia length (TB) 7.53 ± 1.16 9.74 ± 1.41 9.35 ± 1.16 9.90 ± 2.08 8.59 ± 1.66Humerus length (HM) 5.55 ± 0.80 7.62 ± 1.12 7.31 ± 1.01 8.30 ± 1.59 6.23 ± 1.24Radius length (RD) 5.16 ± 0.57 6.67 ± 0.98 6.46 ± 1.00 7.20 ± 1.57 5.42 ± 0.94
NICHE BREADTH AND PHENOTYPE IN NUCRAS 681
© 2013 The Linnean Society of London, Biological Journal of the Linnean Society, 2013, 110, 674–688

Tab
le3.
Non
phyl
ogen
etic
and
phyl
ogen
etic
corr
elat
ion
sbe
twee
nn
ich
ebr
eadt
h,
prop
orti
onof
har
dpr
eyea
ten
,bi
tefo
rce
capa
city
(abs
olu
tean
dre
lati
ve)
and
cran
ial
mor
phom
etri
cs(g
eom
etri
cm
orph
omet
ric
scor
es,
and
rela
tive
and
abso
lute
lin
ear
mor
phom
etri
cm
easu
rem
ents
)
Inde
pen
den
tD
epen
den
t*
Non
phyl
ogen
etic
Ph
ylog
enet
ic
Var
ian
ces
(R2 )
Slo
peC
orre
lati
on(r
)P
-val
ue
Slo
peC
orre
lati
on(r
)P
-val
ue
Nic
he
brea
dth
(pre
yra
nge
)S
nou
t–ve
nt
len
gth
(SV
L)
0.00
1−0
.002
−0.0
40.
950.
03−0
.69
0.33
LC
-RW
10.
07−0
.002
−0.2
60.
680.
00−0
.69
0.09
LC
-RW
20.
003
0.00
030.
060.
930.
00−0
.69
0.85
LC
-RW
30.
03−0
.001
−0.1
80.
770.
00−0
.69
0.39
DC
-RW
10.
840.
004
0.91
0.03
0.00
4−0
.74
0.03
DC
-RW
20.
080.
001
0.28
0.65
0.00
2−0
.74
0.33
DC
-RW
30.
010.
0003
0.09
0.88
0.00
1−0
.74
0.66
Hea
dle
ngt
h(H
L)
0.00
040.
001
0.02
0.98
0.01
−0.6
90.
73H
ead
wid
th(H
W)
0.08
−0.0
1−0
.28
0.65
0.02
−0.6
90.
43H
ead
hei
ght
(HH
)0.
02−0
.007
−0.1
50.
800.
02−0
.69
0.34
Low
erja
wle
ngt
h(L
JL)
0.00
5−0
.003
−0.0
70.
910.
01−0
.69
0.75
Rel
ativ
eH
L0.
210.
004
0.45
0.44
0.00
−0.6
90.
51R
elat
ive
HW
0.35
−0.0
1−0
.59
0.29
0.01
−0.6
90.
38R
elat
ive
HH
0.01
−0.0
02−0
.10
0.88
0.01
−0.6
90.
32R
elat
ive
LJL
0.02
0.00
10.
160.
800.
00−0
.69
0.23
Pro
port
ion
har
dpr
eyS
VL
0.57
0.71
0.75
0.14
−0.0
3−0
.95
0.97
LC
-RW
10.
600.
080.
780.
12−0
.02
−0.9
50.
76L
C-R
W2
0.17
−0.0
3−0
.41
0.49
0.01
−0.9
50.
86L
C-R
W3
0.03
−0.0
1−0
.16
0.80
−0.0
7−0
.95
0.10
DC
-RW
10.
43−0
.05
−0.6
50.
240.
02−0
.91
0.60
DC
-RW
20.
09−0
.02
−0.3
10.
620.
03−0
.91
0.40
DC
-RW
30.
010.
005
0.10
0.88
0.02
−0.9
10.
59H
L0.
540.
480.
740.
160.
20−0
.95
0.67
HW
0.82
0.73
0.91
0.03
−0.0
3−0
.95
0.96
HH
0.67
0.62
0.82
0.09
−0.2
1−0
.95
0.73
LJL
0.64
0.62
0.80
0.10
0.23
−0.9
50.
69R
elat
ive
HL
0.08
−0.0
5−0
.28
0.65
0.11
−0.9
50.
41R
elat
ive
HW
0.06
0.06
0.25
0.68
−0.1
5−0
.95
0.41
Rel
ativ
eH
H0.
02−0
.04
−0.1
30.
84−0
.33
−0.9
50.
06R
elat
ive
LJL
0.06
0.03
0.24
0.70
0.13
−0.9
50.
08
Bit
efo
rce
(N)
SV
L0.
791.
000.
89<
0.00
01–
––
HL
0.89
0.21
0.94
<0.
0001
––
–H
W0.
770.
080.
88<
0.00
01–
––
HH
0.74
0.11
0.86
<0.
0001
––
–L
JL0.
880.
200.
94<
0.00
01–
––
Rel
ativ
ebi
tefo
rce
Rel
ativ
eH
L0.
030.
030.
190.
38–
––
Rel
ativ
eH
W0.
09−0
.09
−0.3
00.
16–
––
Rel
ativ
eH
H0.
001
0.01
0.02
0.91
––
–R
elat
ive
LJL
0.00
1−0
.005
−0.0
30.
91–
––
*LC
,la
tera
lcr
ania
lvi
ew;
DC
,do
rsal
cran
ial
view
;R
W,
rela
tive
war
pco
mpo
nen
t.P
hyl
ogen
yw
asta
ken
into
acco
un
tu
sin
gth
eB
row
nia
nM
otio
n(B
M)
mod
elin
aph
ylog
enet
icge
ner
aliz
edle
ast
squ
ares
anal
ysis
.V
aria
nce
s(R
2 ),
slop
eof
the
corr
elat
ion
,an
dP
ears
on’s
corr
elat
ion
indi
ces
(r)
are
show
nfo
rco
rrel
atio
ns
betw
een
vari
able
s(w
ith
out
taki
ng
phyl
ogen
yin
toac
cou
nt)
.S
ign
ifica
nt
corr
elat
ion
s(P
<0.
05)
are
indi
cate
din
bold
.
682 S. EDWARDS ET AL.
© 2013 The Linnean Society of London, Biological Journal of the Linnean Society, 2013, 110, 674–688

significant, indicating that forelimb lengths haveco-evolved with the proportion of evasive prey taken.
The morphological cluster dendrogram was not con-gruent with the molecular phylogeny. Two species,N. tessellata and Nucras livida, once consideredsubspecies of N. tessellata (Fitzsimons, 1943), aremorphologically and genetically distinct, which isconsistent with the current species designations(Branch & Bauer, 1995). The phylogeny shows thatNucras taeniolata, N. holubi, and N. ornata, once con-sidered subspecies of N. taeniolata (Broadley, 1972)are separate lineages, and are also in separate mor-phological clusters, which is also consistent with thecurrent species designations (Jacobsen, 1989; Branch,1998). Although related species are geographicallyproximate to each other, the morphological topology isincongruent with the phylogeny (see Supportinginformation, Fig. S1). The phylogeny indicates theevolutionary patterns of radiations within the genus,whereas the morphology may be driven by otherfactors, such as diet, causing the topologies to differ.
Niche breadth (i.e. range of arthropod orders taken)was significantly correlated with cranial shape, indi-cating that species preying on a large number ofarthropod orders have wider cheek regions (as in
N. intertexta) and higher bite forces, whereas thosespecies that specialize (low niche breadth values) onhard prey items have more robust crania (shortersnouts) but narrower cheek regions (as in N. lalandiiand N. tessellata), and lower biting capacities. Therewas also a positive relationship between absolutehead width and the proportion of hard prey consumedin Nucras. Previously, it was shown in other lacertidlizards that those species consuming harder preyhave wider heads as a result of the larger jawadductor muscles (e.g. Herrel et al., 2001; Verwaijenet al., 2002; Huyghe et al., 2009) facilitating a greaterrelative bite force. It was expected that those Nucrasspecies specializing on hard prey would show harderbite forces; however, this was not the case. By con-trast, the dietary niche breadth (the variety of preytaken) determined how hard a species bit. Althoughpuzzling at first, variation in prey size may explainthis result. Because hardness is known to increasewith prey size (Herrel et al., 2001; Aguirre et al.,2003), species eating only hard, yet small prey maynot need very high bite forces. On the other hand,generalist species may profit from high bite forcesbecause this would allow them to consume a widerange of prey varying in size and hardness. With the
Table 4. Nonphylogenetic and phylogenetic correlations between proportion of evasive prey eaten, sprint speed capacity(absolute and relative) and limb measurements (relative and absolute)
Independent Dependent
Nonphylogenetic Phylogenetic
Variances(R2) Slope
Correlation(r) P-value Slope
Correlation(r) P-value
Proportionevasiveprey
Snout–vent length (SVL) 0.66 0.69 0.81 0.09 0.64 −0.93 0.16Femur length (FM) 0.40 0.36 0.64 0.25 0.37 −0.93 0.22Tibia length (TB) 0.46 0.30 0.68 0.21 0.33 −0.93 0.14Humerus length (HM) 0.51 0.48 0.71 0.18 0.58 −0.93 0.05Radius length (RD) 0.60 0.46 0.77 0.13 0.54 −0.93 0.03Relative FM 0.03 −0.02 −0.16 0.79 −0.06 −0.93 0.38Relative TB 0.57 −0.07 −0.75 0.14 0.09 −0.93 0.24Relative HM 0.32 0.08 0.56 0.32 −0.09 −0.93 0.03Relative RD 0.18 0.06 0.42 0.48 0.13 −0.93 0.03
Sprintspeed(m·s−1)
SVL 0.97 23.15 0.48 < 0.0001 0.31 −0.97 0.07FM 0.97 3.86 0.26 < 0.0001 0.23 −0.97 0.14TB 0.98 3.52 0.21 < 0.0001 0.10 −0.97 0.47HM 0.97 2.46 0.49 < 0.0001 0.07 −0.97 0.46RD 0.97 2.25 0.41 < 0.0001 0.11 −0.97 0.37
Relativesprintspeed
Relative FM 0.05 0.00 −0.23 0.27 0.11 −0.97 0.31Relative TB 0.07 −0.05 −0.26 0.23 −0.03 −0.15 0.78Relative HM 0.04 0.08 0.19 0.38 −0.06 −0.15 0.31Relative RD 0.04 0.06 0.19 0.37 0.06 −0.15 0.19
Phylogeny was taken into account using the Brownian Motion (BM) model in a phylogenetic generalized least squaresanalysis.Variances (R2), slope of the correlation, Pearson’s correlation indices (r) and P-value shown for correlationsbetween variables (without taking phylogeny into account). Significant correlations (P ≤ 0.05) are indicated in bold.
NICHE BREADTH AND PHENOTYPE IN NUCRAS 683
© 2013 The Linnean Society of London, Biological Journal of the Linnean Society, 2013, 110, 674–688
Negative Positive
DC-RW124.94%
DC-RW220.13%
DC-RW39.92%
LC-RW133.8%
LC-RW214.9%
LC-RW310.8%
- 0.02 0.00 0.02-0.
02-
0.01
0.00
0.01
0.02
LC-RW1
LC
-RW
2
NTE
NH
NI NLL
NO
C
- 0.02 0.00 0.02
-0.
010.
000.
010.
02
LC-RW1
LC
-RW
3
NTE
NH
NI
NLL
NO
D
-0.
020.
000.
02
DC-RW1
DC
-RW
2
NTE
NH
NI
NLL
NO
A
0.01
-0.
01
- 0.02 0.00 0.02
-0.
010.
000.
010.
02
DC-RW1
DC
-RW
3
NTE
NH
NINLL
NO
B
- 0.02 0.00 0.02
Figure 3. Scatterplots plotting the first three relative warps (RW) components for the dorsal (DC: A, B) and lateral (LC:C, D) views. Deformation grids indicate the cranial shape differences on either the negative or positive ends of the firstthree relative warp components for the dorsal and lateral views. Percentage of variation explained by each component isshown. Key to species abbreviations in each plot: NH, Nucras holubi; NI, Nucras intertexta; NLL, Nucras lalandii;NO, Nucras ornata; NTE, Nucras tessellata.
NH
NI
NONTE
NLL
2 4 6 8 10
-0.
020.
000.
010.
020.
03
Niche breadth
DC
-RW
1-0
.01
A
0.4 0.5 0.6 0.7 0.8
2.0
2.1
2.2
2.3
Proportion of hard prey eaten
NH
NI
NLL
NO
NTE
log
Hea
d w
idth
(m
m)
B
Figure 4. Scatterplots of the means of the significant correlations for the nonphylogenetic correlation analyses (Tables 3,4), with the slope of the correlations shown by a dashed line within plots. Variables plotted are: niche breadth againstthe first dorsal relative warp component (A) and proportion of hard prey eaten against log10-transformed absolute headwidth (B). Key to the species abbreviations is as provided in Fig. 3.
684 S. EDWARDS ET AL.
© 2013 The Linnean Society of London, Biological Journal of the Linnean Society, 2013, 110, 674–688

small number of species included in the present study,however, the results involving bite force need to betreated as preliminary, and increasing sample sizesmay clarify this relationship with more confidence.Thus, further studies correlating individual preyhardness with bite force are needed to better under-stand the factors driving the evolution of head shapein Nucras lizards.
Sprint speed was related to body size and limbmorphology in absolute terms, although neither ofthese was related to the proportion of evasive preytaken. This lack of a relationship was also found forother lacertid lizards (Vanhooydonck et al., 2007). Assuggested previously (Vanhooydonck et al., 2007),maximal sprint speed may not be as important as fastacceleration for the capture of evasive prey. Once theprey takes flight, it is essentially out of reach of thelizards and no amount of running at top speed willenable the lizard to capture the prey. Thus, the abilityto capture the evasive prey immediately once sightedbefore it escapes would be crucial. In comparisons ofdietary and functional capacities, measures of accel-eration in addition to sprint speed and stamina mayturn out to be more informative in understanding alizards’ ability to capture elusive prey.
In conclusion, the PGLS analyses retrieved signifi-cant relationships between niche breadth and thefirst relative warp score of the head in dorsal view,as well as between limb morphology and the propor-tion of evasive prey eaten. The proportion of hardprey taken did not show any relationship with headshape descriptors when phylogeny was accounted for,suggesting an important role of shared ancestry inthe observed co-variation between head shape, dietand bite force. By contrast, the proportion of elusiveprey eaten was shown to co-evolve with forelimbdimensions in the species included in the presentstudy. Future analyses incorporating a largernumber of species and incorporating data on bothprey size as well as functional properties are neededto better understand the evolution of body propor-tions in relation to diet in this genus. Despite theselimitations, our data do suggest interestingco-variation between morphology, niche breadth,prey type, and performance that would be worthexploring further.
ACKNOWLEDGEMENTS
We thank the National Research Foundation (NRF) ofSouth Africa [South African Biosystematics Initiative(SABI) and the Key International Science Collabora-tion (KISC)] and the International Foundation ofScience (IFS) of Sweden, and the South AfricanNational Biodiversity Institute for funding this work.SE was supported by NRF Free-standing and SABI
Grant-holder linked bursaries and the ErasmusMundus scholarship. We thank leFras Mouton, ArevaResources Namibia, and Duncan MacFadyen forlogistical assistance and Oppenheimer and Sons forco-funding and access to their nature reserves(Tswalu, Rooipoort, and Venetia). A proportion oftissues used were collected during the South AfricaReptile Conservation Assessment (SARCA) project.We thank Raoul Van Damme for advice and sugges-tions with respect to the manuscript. Field workassistance was given by Buyisile Makhubo, WernerConradie, Hannlie Engelbrecht, Joh Henschel, andJohn Visser. We thank Bayworld (Port Elizabeth) andDitsong (Pretoria) Museums, and the Ellerman Col-lection (Stellenbosch University) for access to and useof their collections. This work was conducted undernational and provincial research permits: Namibia(1504/2010 & 81305), Kenya (permit MOEST 13/001/36C 183), Eastern Cape (CRO 156/10CR, CRO 157/10CR), Free State (01/6828), Limpopo (CPM-333-00002), Mpumulanga (MPB. 5299), Northern Cape(FAUNA 110/2011, FAUNA 111/2011), North West(017297), and Western Cape (AAA004-0322-0035,AAA004-00807-0035, AAA007-00002-0056, 045-AAA004-00052). Ethical clearance was obtained fromSANBI (permit number 002/10) and University ofStellenbosch (permit number 11NP_EDW01).
REFERENCES
Aguirre LF, Herrel A, Van Damme R, Mathyssen E. 2003.The implications of food hardness for diet in bats. Func-tional Ecology 17: 201–212.
Andrews C, Bertram JEA. 1997. Mechanical work as adeterminant of prey-handling behavior in the Tokay gecko(Gekko gecko). Physiology and Zoology 70: 193–201.
Arévalo E, Davis SK, Sites JJW. 1994. Mitochondrial DNAsequence divergence and phylogenetic relationships amongeight chromosome races of the Sceloporus grammicuscomplex (Phrynosomatidae) in central Mexico. SystematicBiology 43: 387–418.
Arnold SJ. 1983. Morphology, performance and fitness.American Zoologist 23: 347–361.
Bauwens D, Garland T Jr, Castilla AM, Van Damme R.1995. Evolution of sprint speed in lacertid lizards: morpho-logical, physiological and behavioral consideration. Evolu-tion 49: 848–863.
Braña F. 1996. Sexual dimorphism in lacertid lizards: malehead increase vs female abdomen increase? Oikos 75: 511–523.
Branch WR. 1998. Field guide to the snakes and otherreptiles of southern Africa, rev. edn. Cape Town: StruikPublishers.
Branch WR, Bauer AM. 1995. The Herpetofauna of theLittle Karoo, Western Cape, South Africa, with notes on lifehistory and taxonomy. Herpetological Natural History 3:47–89.
NICHE BREADTH AND PHENOTYPE IN NUCRAS 685
© 2013 The Linnean Society of London, Biological Journal of the Linnean Society, 2013, 110, 674–688
Brändle M, Ohlschlager S, Brandl R. 2002a. Rangesizes in butterflies: correlation across scales. EvolutionaryEcology Research 4: 993–1004.
Brändle M, Prinzing A, Pfeifer R, Brandl R. 2002b.Dietary niche breadth for Central European birds: correla-tions with species-specific traits. Evolutionary EcologyResearch 4: 643–657.
Broadley DG. 1972. A review of the Nucras tessellata group(Sauria: Lacertidae). Arnoldia 20: 1–35.
Bruford MW, Hanotte O, Brookfield JFY, Burke T. 1992.Singlelocus and multilocus DNA fingerprint. In: Ha R, ed.Molecular genetic analysis of populations: a practicalapproach. Oxford: IRL Press, 225–270.
Castilla AM, Van Damme R, Bauwens D. 1999. Field bodytemperatures, mechanisms of thermoregulation and evolu-tion of thermal characteristics in lacertid lizards. NaturaCroatica 8: 253–274.
Costa GC, Vitt LJ, Pianka ER, Mesquita DO, Colli GR.2008. Optimal foraging constrains macroecological patterns:body size and dietary niche breadth in lizards. GlobalEcology and Biogeography 17: 670–677.
Edwards S, Vanhooydonck B, Herrel A, Measey GJ,Tolley K. 2012. Convergent evolution associated withhabitat decouples phenotype from phylogeny in a clade oflizards. PLoS ONE 7: e52636.
Farris JS, Kallersjo M, Kluge AG, Bult C. 1994. Testingsignificance of congruence. Cladistics 10: 315–320.
Farris JS, Kallersjo M, Kluge AG, Bult C. 1995. Construct-ing a significance test for incongruence. Systematic Biology44: 570–572.
Fitzsimons VF. 1943. The lizards of South Africa. Issue 1 ofMemoir. Pretroia: Transvaal Museum.
Forstner MRJ, Davis SK, Arevalo E. 1995. Support for thehypothesis of Anguimorph ancestry for the suborderSerpentes from phylogenetic analysis of mitochondrial DNAsequences. Molecular Phylogenetics and Evolution 4: 93–102.
Goodman BA. 2009. Nowhere to run: the role of habitatopenness and refuge use in defining patterns of morphologi-cal and performance evolution in tropical lizards. Journal ofEvolutionary Biology 22: 1535–1544.
Goodman BA, Isaac JL. 2008. Convergent body flatteningin a clade of tropical rock using skinks (Scincidae:Lygosominae). Biological Journal of the Linnean Society 94:399–411.
Grafen A. 1989. The phylogenetic regression. PhilosophicalTransactions of the Royal Society of London Series B, Bio-logical Sciences 326: 119–157.
Groth JG, Barrowclough GF. 1999. Basal divergencesin birds and the phylogenetic utility of the nuclearRAG-1 gene. Molecular Phylogenetics and Evolution 12:115–123.
Hall TA. 1999. BioEdit: a user-friendly biological sequencealignment editor and analysis program for Windows 95/98/NT. Nucleic Acids Symposium Series 41: 95–98.
Hansen TF. 1997. Stabilizing selection and the comparativeanalysis of adaptation. Evolution 51: 1341–1351.
Hansen TF, Martins EP. 1996. Translating betweenmicroevolutionary process and macroevolutionary patterns:
the correlation structure of interspecific data. Evolution 50:1404–1417.
Herrel A, Aerts P, De Vree F. 1998. Ecomorphology of thelizard feeding apparatus: a modelling approach. Nether-lands Journal of Zoology 48: 1–25.
Herrel A, Cottam MD, Godbeer K, Sanger T, Losos JB.2011. An ecomorphological analysis of native and intro-duced populations of the endemic lizard Anolis maynardi ofthe Cayman Islands. Breviora 522: 1–10.
Herrel A, Huyghe K, Vanhooydonck B, Backeljau T,Breugelmans K, Grbac I, Van Damme R, Irschick D.2008. Rapid large-scale evolutionary divergence in morphol-ogy and performance associated with exploitation of adifferent dietary resource. Proceedings of the NationalAcademy of Sciences of the United States of America 105:4792–4795.
Herrel A, Joachim R, Vanhooydonck B, Irschick DJ.2006. Ecological consequences of ontogenetic changes inhead shape and bite performance in the Jamaican lizardAnolis lineatopus. Biological Journal of the Linnean Society89: 443–454.
Herrel A, McBrayer LD, Larson PM. 2007. Functionalbasis for sexual differences in bite force in the lizard Anoliscarolinensis. Biological Journal of the Linnean Society 91:111–119.
Herrel A, Spithoven L, Van Damme R, De Vree F. 1999a.Sexual dimorphism of head size in Gallotia galloti; testingthe niche divergence hypothesis by functional analyses.Functional Ecology 13: 289–297.
Herrel A, Van Damme R, De Vree F. 1996. Sexual dimor-phism of head size in Podarcis hispanica atrata: testingthe dietary divergence hypothesis by bite force analysis.Netherlands Journal of Zoology 46: 253–262.
Herrel A, Van Damme R, Vanhooydonck B, De Vree F.2001. The implications of bite performance for diet in twospecies of lacertid lizards. Canadian Journal of Zoology 79:662–670.
Herrel A, Verstappen M, De Vree F. 1999b. Modulatorycomplexity of the feeding repertoire in scincid lizards.Journal of Comparative Physiology 184: 501–518.
Huelsenbeck JP, Ronquist F. 2001. MRBAYES: Bayesianinference of phylogeny. Bioinformatics 17: 754–755.
Huey RB, Bennett AF, Alder HJ, Nagy KA. 1984. Loco-motor capacity and foraging behaviour of Kalahari lacertidlizards. Animal Behavior 32: 41–50.
Huey RB, Pianka ER. 1981. Ecological consequences offoraging mode. Ecology 62: 991–999.
Huey RB, Pianka ER, Hoffman JA. 1977. Seasonal varia-tion in thermoregulatory behavior and body temperature ofdiurnal Kalahari lizards. Ecology 58: 1066–1075.
Huyghe K, Vanhooydonck B, Van Damme R. 2009. It’s allin the head: morphological basis for differences in bite forceamong color morphs of the dalmatian wall lizard. Journal ofMorphology 268: 1088–1089.
Jacobsen NHG. 1989. A herpetological survey of the Trans-vaal. DPhil Thesis, University of Natal.
Kapli P, Poulakakis N, Lymberakis P, Mylonas M. 2011.A re-analysis of the molecular phylogeny of Lacertidae with
686 S. EDWARDS ET AL.
© 2013 The Linnean Society of London, Biological Journal of the Linnean Society, 2013, 110, 674–688

currently available data. Basic Applied Herpetology 25:97–104.
Langkilde T. 2009. Invasive fire ants alter behavior andmorphology of native lizards. Ecology 90: 208–217.
Martins EP, Hansen TF. 1997. Phylogenies and the com-parative method: a general approach to incorporatingphylogenetic information into the analysis of interspecificdata. American Naturalist 149: 646–667.
Martins EP, Housworth EA. 2002. Phylogeny shape andthe phylogenetic comparative method. Systematic Biology51: 873–880.
Mayer W, Pavlicev M. 2007. The phylogeny of the familyLacertidae (Reptilia) based on nuclear DNA sequences: con-vergent adaptations to arid habitats within the subfamilyEremiainae. Molecular Phylogenetics and Evolution 44:1155–1163.
McBrayer LD, Wylie JE. 2009. Concordance between loco-motor morphology and foraging mode in lacertid lizards.Zoology 112: 370–378.
Measey GJ, Hopkins K, Tolley KA. 2009. Morphology,ornaments and performance in two chameleon ecomorphs:is the casque bigger than the bite? Zoology 112: 217–226.
Measey GJ, Rebelo AD, Herrel A, Vanhooydonck B,Tolley KA. 2011. Diet, morphology and performance in twochameleon morphs: do harder bites equate with harderprey? Journal of Zoology 285: 247–255.
Novotny V, Basset Y. 1999. Body size and host plant spe-cialization: a relationship from a community of herbivorousinsects on Ficus from Papua New Guinea. Journal of Tropi-cal Ecology 15: 315–328.
Palumbi S. 1996. Nucleic acids II: the polymerase chainreaction. In: Hillis DM, Moritz C, Mable BK, eds. Molecularsystematics, 2nd edn. 205–247. Sunderland, MA: SinauerAssociates.
Paradis E. 2012. Analysis of phylogenetics and evolution withR, 2nd edn. New York, NY: Springer.
Portik DM, Wood PL Jr, Grismer JL, Stanley EL,Jackman TR. 2011. Identification of 104 rapidly-evolvingnuclear protein-coding markers for amplification acrossscaled reptiles using genomic resources. ConservationGenetic Resources 4: 1–10.
Posada D, Crandall KA. 1998. MODELTEST: testing themodel of DNA substitution. Bioinformatics 14: 817–818.
R Core Team. 2012. R: a language and environment forstatistical computing. Vienna: R Foundation for StatisticalComputing. Available at: http://www.r-project.org/
R Studio. 2012. RStudio: integrated development environ-ment for R, Version 0.97.390. Boston, MA: R Studio. Avail-able at: http://www.rstudio.org/ (accessed January 2013)
Rambaut A, Drummond AJ. 2007. Tracer, Version 1.5.Computer program and documentation distributed byauthor. Available at: http://beast.bio.ed.ac.uk/Tracer(accessed July 2011)
Revell LJ, Johnson MA, Schulte JA, Kolbe JJ, Losos JB.2007. A phylogenetic test for adaptive convergence in rock-dwelling lizards. Evolution 61: 2898–2912.
Rohlf FJ. 1999. Shape statistics: procrustes superimpositionsand tangent spaces. Journal of Classification 16: 197–223.
Rohlf FJ. 2003. tpsPLS, partial least-squares, Version 1.12.Stony Brook, NY: Department of Ecology and Evolution,State University of New York at Stony Brook.
Rohlf FJ. 2004. tpsUtil, file utility program, Version 1.26.Stony Brook, NY: Department of Ecology and Evolution,State University of New York at Stony Brook.
Rohlf FJ. 2005. tpsDig, digitize landmarks and outlines,Version 2.05. Stony Brook, NY: Department of Ecology andEvolution, State University of New York at Stony Brook.
Rohlf FJ, Slice DE. 1990. Extensions of the Procrustesmethod for the optimal superimposition of landmarks. Sys-tematic Zoology 39: 40–59.
Ronquist F, Huelsenbeck JP. 2003. MRBAYES 3: Bayesianphylogenetic inference under mixed models. Bioinformatics19: 1572–1574.
Sievers F, Wilm A, Dineen D, Gibson TJ, Karplus K, LiW, Lopez R, McWilliam H, Remmert M, Söding J,Thompson JD, Higgins DG. 2011. Fast, scalable genera-tion of high-quality protein multiple sequence alignmentsusing Clustal Omega. Molecular Systematic Biology 7: 539.
Simpson EH. 1949. Measurement of diversity. Nature 163:688.
Spawls S, Howell K, Drewes RC. 2006. Reptiles andamphibians of East Africa. Princeton, NJ: Princeton Uni-versity Press.
Stamatakis A. 2006. RAxML-VI-HPC: maximum likelihood-based phylogenetic analyses with thousands of taxa andmixed models. Bioinformatics 22: 2688–2690.
Stamatakis A, Hoover P, Rougemont J. 2008. A rapidbootstrap algorithm for the RaXML web servers. SystematicBiology 57: 758–771. Available at: http://www.phylo.org/index.php/portal/ (accessed November to January 2012).
Swofford DL. 2002. PAUP*. Phylogenetic analysis using par-simony (*and other methods), 4th edn. Sunderland, MA:Sinauer.
Tamura K, Dudley J, Nei M, Kumar S. 2007. MEGA4:molecular evolutionary genetics analysis (MEGA) softwareversion 4.0. Molecular Biology and Evolution 24: 1596–1599.
Van Der Meer MH, Whiting MJ, Branch WR. 2010.Ecology of southern African Sandveld lizards (Lacertidae,Nucras). Copeia 4: 568–577.
Vanhooydonck B, Herrel A, Van Damme R. 2007. Interac-tions between habitat use, behavior and the trophic niche oflacertid lizards. In: Reilly SM, McBrayer LD, Miles DB, eds.Lizard ecology: the evolutionary consequences of foragingmode. Cambridge: Cambridge University Press, 427–449.
Vanhooydonck B, Van Damme R, Aerts P. 2001. Speedand stamina trade-off in lacertid lizards. Evolution 55:1040–1048.
Verwaijen D, Van Damme R. 2007a. Does foraging modemould morphology in lacertid lizards? Journal of Evolution-ary Biology 20: 1950–1961.
Verwaijen D, Van Damme R. 2007b. Correlated evolution ofthermal characteristics and foraging strategy in lacertidlizards. Journal of Thermal Biology 32: 388–395.
Verwaijen D, Van Damme R. 2008. Foraging mode andlocomotor capacities in Lacertidae. Amphibia-Reptilia 29:197–206.
NICHE BREADTH AND PHENOTYPE IN NUCRAS 687
© 2013 The Linnean Society of London, Biological Journal of the Linnean Society, 2013, 110, 674–688

Verwaijen D, Van Damme R, Herrel A. 2002. Relationshipsbetween head size, bite force, prey handling efficiency anddiet in two sympatric lacertid lizards. Functional Ecology16: 842–850.
Vitt LJ. 1981. Lizard reproduction: habitat specificity andconstraints on relative clutch mass. American Naturalist117: 506–514.
Vitt LJ, Caldwell JP, Zani PA, Titus TA. 1997. The role ofhabitat shift in the evolution of lizard morphology: evidence
from tropical Tropidurus. Proceedings of the NationalAcademy of Science of the United States of America 94:3828–3832.
Wasserman SS, Mitter C. 1978. The relationship of bodysizeto breadth of diet in some Lepidoptera. Ecological Entomol-ogy 3: 155–160.
Xia X, Xie Z, Salemi M, Chen L, Wang Y. 2003. An index ofsubstitution saturation and its application. MolecularPhylogenetics and Evolution 26: 1–7.
SUPPORTING INFORMATION
Additional Supporting Information may be found in the online version of this article at the publisher’s web-site:
Figure S1. Map of the distributions within the African continent of all Nucras species used in the phylogeneticanalyses. The key to the coloration (for genetic clades) and patterns (for morphological clusters) within eachspecies distribution is shown to the right of the map. Countries are labelled and each species is labelled in italicfont. Distributions for the species were adapted from Branch (1998) and Spawls et al. (2006).Figure S2. Phylogenetic tree of the genus Nucras based on the combined partial 16S, ND4, RAG1 andKIAA-2018 gene regions and inferred by BI and ML (Bayesian topology shown). Sample numbers are indicatedat terminal tips, and species names are given. Nodes are considered supported if posterior probabilities > 0.95(estimated using Bayesian inference) and/or bootstrap values > 75% (using maximum likelihood analyses).Table S1. List of specimens used for the phylogenetic analyses. Genus, species, museum, and field accessionnumbers are given, as well as EMBL-Bank accession numbers, for the two mitochondrial (16S, ND4) and twonuclear (RAG1, KIAA-2018) gene fragments sequenced.Table S2. List of specimens used for the morphometric analyses. Genus, species, museum, and field accessionnumbers are given, as well as an indication of whether the specimen was used in the linear morphometric andgeometric morphometric analyses.Table S3. List of specimens used for the performance analyses (all specimens were caught in the field). Species,sample size for performance analyses, and field accession numbers are given.
688 S. EDWARDS ET AL.
© 2013 The Linnean Society of London, Biological Journal of the Linnean Society, 2013, 110, 674–688