Is Descriptive Representation a Proxy for Substantive...
27
Is Descriptive Representation a Proxy for Substantive Representation? * Sveinung Arnesen † Dominik Duell ‡ Mikael Johannesson § Working paper. Sunday 3 rd December, 2017 Abstract We measure the appeal of descriptive representation – representation based on social group markers – and investigate its relation to substantive representation. Applying con- joint survey experiments within the Norwegian Citizen Panel, we test whether voters perceive and use descriptive representation as a proxy for substantive representation. We find that voters discriminate between candidates based on social markers with a weak preference for in-group representatives and prefer candidates who share their political views. Voters also form beliefs on candidates’ preferences on different political issues based on simply knowing the candidates’ social markers. We conclude that there is a demand for substantive repre- sentation and that voters demonstrate their ability to discern candidates’ policy positions based on social markers, allowing descriptive representation to enable substantive represen- tation. The results of our direct experimental test of descriptive representation as a proxy for substantive representation, however, are inconclusive. * We thank Catherine de Vries, Eric Dickson, Robert Johns, and discussants at various conferences for their thoughtful comments. † University of Bergen. Corresponding author ([email protected]) ‡ University of Essex § University of Bergen
Transcript of Is Descriptive Representation a Proxy for Substantive...

Is Descriptive Representation a Proxy for
Substantive Representation? ∗
Sveinung Arnesen† Dominik Duell‡ Mikael Johannesson§
Working paper.Sunday 3rd December, 2017
Abstract
We measure the appeal of descriptive representation – representation based on socialgroup markers – and investigate its relation to substantive representation. Applying con-joint survey experiments within the Norwegian Citizen Panel, we test whether voters perceiveand use descriptive representation as a proxy for substantive representation. We find thatvoters discriminate between candidates based on social markers with a weak preference forin-group representatives and prefer candidates who share their political views. Voters alsoform beliefs on candidates’ preferences on different political issues based on simply knowingthe candidates’ social markers. We conclude that there is a demand for substantive repre-sentation and that voters demonstrate their ability to discern candidates’ policy positionsbased on social markers, allowing descriptive representation to enable substantive represen-tation. The results of our direct experimental test of descriptive representation as a proxyfor substantive representation, however, are inconclusive.
∗We thank Catherine de Vries, Eric Dickson, Robert Johns, and discussants at various conferences for theirthoughtful comments.†University of Bergen. Corresponding author ([email protected])‡University of Essex§University of Bergen

1 Introduction
Representation is at the heart of how contemporary democracies organize their governing ’by
the people’ and has as such been studied extensively. One important aspect within this field
has been the normative and empirical study of descriptive representation (Mansbridge, 1999;
Reynolds, 2013) – political representation based on shared social characteristics. Many studies
have concluded that descriptive representation is crucial in supporting the principles of democ-
racy: Citizens tend to be more willing to accept a political decision made by a representative
body that descriptively reflects society (Arnesen and Peters, 2017), have more trust in such an
institution (Pitkin, 1967; Bobo and Gilliam, 1990), feel symbolically represented by it (Schwindt-
Bayer and Mishler, 2005), see this institution as more responsive (Fenno, 1978; Pantoja and
Segura, 2003; Sanchez and Morin, 2011), and are more likely to seek political participation in it
(Gay, 2002; Broockman, 2014). A lack of descriptive representation has been linked to policy
outcomes biased against, for example, women and minorities (Bratton and Ray, 2002; Franck
and Rainer, 2012).
This study asks whether voters value descriptive representation itself or largely utilize it
to achieve substantive representation – political representation based on shared political pref-
erences. Voters take shared social markers as cues and group identity becomes instrumental
in electoral decisions (Rahn, 1993; Chandra, 2004; Eifert, Miguel and Posner, 2010). With
instrumental group identities, voters may think of descriptive representation as a mere proxy
for substantive representation (Phillips, 1995). In two conjoint experiments embedded in the
Norwegian Citizen Panel, we elicit voters’ willingness and ability to facilitate descriptive rep-
resentation based on shared age, gender, education, religion, or place of residence to achieve
substantive representation. The appropriate counterfactual comparison to clarify the relation-
ship between descriptive and substantive representation is to look at voters’ choices when they
learn candidates’ social markers only versus when they know candidates’ policy preferences
as well. Should the vote choice be less driven by social markers as soon as policy preference
information is available, voters utilize descriptive representation as a proxy for substantive rep-
resentation. The respondents in our first conjoint experiment are asked to choose between a
series of pairs of hypothetical candidates while seeing, in random order, either candidates’ social
markers only, candidates’ political preferences only, or both. In our second conjoint experiment,
we show respondents more profiles of candidates containing social markers only and elicit their
1
beliefs about those candidates’ presumed political preferences. In other words, we test whether
voters are able to form expectations about how social markers and preferences relate.
In experiment 1, we find that respondents prefer political candidates based on descriptive
characteristics and candidates who share their political views. Voters also choose candidates who
share the same religious or educational background. We cannot, however, identify the utilization
of descriptive representation for substantive representation cleanly. We learn from experiment 2
that voters infer candidates’ policy positions from the candidates’ social markers. We conclude
that descriptive representation enables voters to choose instrumentally, allowing for substantive
representation, but survey respondents in our study do not fully make use of this ability.
Scholars have explored the relationship between descriptive and substantive representation.
Gay (2002) attempts to understand the effect of descriptive representation on political attitudes
and behavior by controlling for the confounding influences of representatives’ policy positions
with observational data. Hayes and Hibbing (2017) find in a series of survey experiments that
descriptive but not substantive representation affects African Americans’ sense of being sym-
bolically represented. Other studies have identified variation in the value that different social
groups attach to descriptive representation. This value is lower for Hispanics (Henderson, Sekhon
and Titiunik, 2016) and women (West, 2017) than for African Americans. Additionally, this
value varies strongly with partisanship (Casellas and Wallace, 2015) and whether the winning
candidate comes from voters’ social group (Bowler, 2017). Carnes and Lupu (2016) elicit vot-
ers’ valuation for representation by working-class politicians across countries. Stepping outside
the U.S. context as well and incorporating multiple social markers, our study implements an
experimental test of voters’ valuations of descriptive representation and of descriptive represen-
tation as a proxy for substantive representation. Jones (2016)’s study is closest to ours as it
endows hypothetical representatives with racial identities and preferences on five policy issues.
The study finds a mostly erroneous attribution of shared preferences to co-racial candidates.
We demonstrate that for salient group markers in Norway, the respondents are often able to
correctly predict candidates’ policy preferences based on candidates’ social markers.
2 Research design and hypotheses
We present two conjoint experiments implemented in two separate waves of the Norwegian Cit-
izen Panel (NCP) during spring and fall of 2016 (Ivarsflaten, 2016b,a) with 1139 participants
2

in experiment 1 and 1077 in experiment 2. Such experiments can handle complex choice situa-
tions wherein several attributes have an important influence on judgment (Auspurg, Hinz and
Sauer, 2017). The NCP is a probability-based general population survey panel administered
by the Digital Social Science Core Facility (DIGSSCORE) at the University of Bergen.1 Given
its homogeneity, Norway could be seen as a least-likely case (Eckstein, 2000) for finding voters
who appreciate descriptive representation, which arguably is more important in societies with
substantial between-group differences. Finding any appeal of descriptive representation in Nor-
way could be taken as indicative for more diverse countries. Still, divisions arise along the lines
of gender, education level, age, and region of residence2and descriptive representation is valued
(Arnesen and Peters, 2017).
In conjoint experiment 1, we ask the respondents which of two hypothetical candidates they
would prefer to represent them in the national parliament. In random order, respondents make
three such decisions (representing three different treatments): (1) one decision where the can-
didates are randomized with regard to the social markers age, gender, education, religion, and
region of residence (group treatment); (2) another decision where candidates vary in their stated
preferences on three policy issues: income inequality, refugee rights, and emission reduction (is-
sue treatment); and (3) a third decision where candidates are described by both social markers
and political preferences (both treatment).3 In conjoint experiment 2, the respondents are pre-
sented with a scenario identical to the group treatment in Experiment 1; that is, respondents
are given two profiles of hypothetical candidates characterized by age, gender, education, reli-
gion, and region of residence. Respondents are then asked to guess the preferences of the two
candidates on the three policy issues (shown in random order).4
1The data in our analysis come from the “Norwegian Citizen Panel Wave 6, 2016” and “Norwegian Citizen Panel
Wave 7, 2016”. The survey was financed by the University of Bergen (UiB) and Uni Rokkan Centre. The data are
provided by UiB, prepared and made available by Ideas2Evidence, and distributed by the Norwegian Social Science
Data Services (NSD). Neither UiB, Uni Rokkan Centre nor NSD are responsible for our analyses/interpretations.
2We included these social markers plus religion, occupational, and marital statues in our study but the latter
two had no effect on vote choice and were excluded from the main analysis. Without effect, the question whether
a marker facilitates substantive representation is redundant (we find an effect of work experience, but we do not
consider this attribute to form a social group). We do not include race given that racial minorities are very small
in Norway. The Supporting Information (SI) offers the full presentation of results.
3All potential values across the attributes are shown in Table A.1, and an example of the screen displayed to
respondents is given in Figure A.1 in the SI.
4Additionally, respondents were randomly assigned into groups that presented either two “politicians” or two
“persons.” This assignment enables us to measure whether people perceive politicians as having different views
than non-politicians; our results show that they do not (see Figure C.3 in the SI).
3

This study sets out to answer whether voters value descriptive representation itself or largely
utilize it to achieve substantive representation. Hypothesis 1 follows accordingly: descriptive
representation serves as a proxy for achieving substantive representation. We test hypothesis 1
by comparing the effect of shared social markers on vote choice across group and both treatments
in experiment 1. When social markers are influential independent of whether issue positions are
shown, descriptive representation does not allow instrumental motivations to drive vote choice.
When social markers lose their influence when political preferences are shown as well, we argue
that information about social markers enables substantive representation.
The identification of such instrumental voting rests on a few assumptions: First, within each
treatment, we estimate the relative importance of one attribute assigned to the candidate over
others. Specifically, following Hainmueller, Hopkins and Yamamoto (2014), we estimate the
Average Marginal Component Effect (AMCE). We need to assume that the order of vignettes
shown to respondents and the order of attributes within displayed profiles do not matter for
respondents’ choice. To meet this assumption, we randomize the order of vignettes and attributes
across respondents and control for order in our regressions. Additionally, the randomization of
attributes and realizations of the values of attributes need to be carried out in such a way
that respondents’ choices are statistically independent of the vignette assignment (accomplished
by randomization within the NCP). Second, we assume that the number of attributes does not
change responses; a larger number of attributes per profile should not lead to satisficing, in which
respondents use choice heuristics to break down the complexity of too much information.5 Third,
we assume that respondents interpret the information about candidates’ political preferences as
such and do not make inferences from these preferences about a social marker (e.g., interpreting
candidates’ preferences on income inequality as a reflection of, say, candidates’ social class).
Should we find no evidence to support hypothesis 1, voters may simply not be able to form
beliefs about candidates’ preferences from seeing their social characteristics only. Such an abil-
ity is the prerequisite for the existence of instrumental motivations driving vote choice and for
descriptive representation being a proxy for substantive representation.6 For this reason, in ex-
periment 2, we test whether voters are able to form beliefs about candidates’ political preferences
based on candidates’ social markers (Hypothesis 2).
5Bansak et al. (2017) find that choice tasks with even 18 attributes do not lead to meaningful changes in the
estimates of the relative importance of any one attribute; our number of attributes is well below.6Voters may hold incorrect beliefs but still believe that they achieve substantive representation.
4

●
●
●
●
●
●
●
●
●
●
●
●
●
●
●
●
●
●
●
●
●
●
●
●
●
●
●
●
●
●
●
●
●
●
●
●
●
●
●
●
●
●
●
●
Group−treatment Both−treatment
Age
Gender
Education
Religion
Region
−0.30 −0.15 0.00 0.15 0.30−0.30 −0.15 0.00 0.15 0.30
80 years70 years60 years50 years40 years30 years22 years
FemaleMale
Ph.D.University
High schoolElementary school
IslamChristianityNo religion
Northern NorwayCentral Norway
Western NorwaySouthern Norway
Eastern NorwayOslo
Change in predicted Pr(Respondent prefers candidate)
Figure 1: Change in the predicted probability of preferring a candidate based on informationabout the candidates’ social markers for group and both treatments. In the group treatmentrespondents see candidates’ social marker only while in the both treatment they are showncandidates’ social markers as well as candidates’ policy preferences. For all figures, estimatesare based on an OLS regression of respondents’ choices against a set of dummies for eachattribute realization (omitting a reference category) with clustered standard errors. The dottedline denotes the reference category for each attribute. Bars show one and two standard errorsof the estimates.
3 Results
Experiment 1: Is descriptive representation seen as proxy for substantive represen-
tation? The respondents clearly utilize social markers to choose between candidates and do so
when they also have information about candidates’ issue positions. Figure 1 shows the estimates
of the effects of social markers on the probability of choosing a candidate in the group treatment
(left column) and the both treatment (right column). In the group treatment, all candidate
attributes except for region have statistically significant effects on vote choice (at α < .1). The
strongest relative effect, a decrease in the estimated vote probability of .15 with a 95% confi-
dence interval of .10 to .20, arises for a Muslim candidate versus a candidate with no religious
affiliation. On average, the respondents are more likely to choose a middle-aged candidate than
a young or elderly candidate, a female candidate than a male candidate, a candidate with a
doctorate than one without higher education, and a Christian or non-religious candidate over
a Muslim candidate. When also shown information about the issue positions of the candidates
in the both treatment, the effects of age, religion, and region remain statistically significant but
are smaller. In other words, voters make choices based on candidates’ social markers (Result 1).
5

●
●
●
●
●
●
●
●
●
●
●
●
●
●
●
●
●
●
Issue−treatment Both−treatment
Income inequalityissue
Refugee rightsissue
Emission reductionissue
−0.30 −0.15 0.00 0.15 0.30−0.30 −0.15 0.00 0.15 0.30
Same positionDifference of ±2/3
Difference of ±4/5/6
Same positionDifference of ±2/3
Difference of ±4/5/6
Same positionDifference of ±2/3
Difference of ±4/5/6
Change in predicted Pr(Respondent prefers candidate)
Can
dida
te c
ompa
red
to r
espo
nden
tat
trib
utes
Figure 2: Change in the predicted probability of preferring a candidate when the candidate’sissue positions are the same as or different from the respondents for the issue and both treat-ments. In the issue treatment respondents see candidates’ policy preferences only while in theboth treatment they are shown candidates’ social markers as well as candidates’ issue preferences.
●
●
●
●
●
●
●
●
●
●
●
●
●
●
●
●
●
●
●
●
●
●
●
●
●
●
●
●
●
●
Group−treatment Both−treatment Difference
Age
Gender
Education
Religion
Region
−0.2 −0.1 0.0 0.1 0.2 −0.2 −0.1 0.0 0.1 0.2 −0.2 −0.1 0.0 0.1 0.2
Same (+/− 5 yrs)Different
SameDifferent
SameDifferent
SameDifferent
SameDifferent
Change in predicted Pr(Respondent prefers candidate)
Can
dida
te c
ompa
red
to r
espo
nden
tat
trib
utes
Figure 3: Change in the predicted probability of preferring a candidate when the candidate’ssocial markers are the same as respondents’ for group and both treatments.
Respondents also choose candidates with similar political preferences. Figure 2 shows es-
timates of the effect of the distance between the respondents own and the candidate’s issue
position on vote choice. In the issue treatment, respondents see only the issue positions of
the candidates, and the predicted probability of choosing a candidate significantly increases
as the political distance between the candidate and respondent decreases. On a seven-point
scale, the change from a large distance (±4, 5, 6) to sharing the same preference as the candi-
date increases the vote probability by .21 (.13, .30) on income inequality, .26 (.18, .34) refugees
rights, and .17 (.07, .26) emission reduction. In the both treatment, only the preference distance
on refugee rights is no longer statistically significant; we therefore conclude that voters prefer
candidates with the same political preferences (Result 2) and want substantive representation.
When shown only social markers in the group treatment, respondents sometimes discriminate
in favour of in-group candidates. Figure 3 shows the estimates of the effect of shared vs. different
social markers. In the group treatment, a candidate with the same level of education faces a
6
.04 (−.02, .08) significantly higher probability of being chosen (α < .1). Candidates featuring
the same religious affiliation are significantly more often elected (α < .05) with an estimated
increase in probability of .08 (−.04, .13).7 In sum, voters discriminate in favour of candidates
with whom they share a social marker for some attributes (Result 3).
The main question of this study, however, is whether the decisions of voters who share a social
attribute with a candidate are less likely to be influenced by social markers when voters observe
candidates’ political preferences as well. If this is the case, we argued, descriptive representation
largely serves as proxy for substantive representation. The middle column of Figure 3 shows
estimates of the effects of the respondent and the candidate having the same social marker when
also shown issue positions (both treatment). The right column shows the difference between
the group and both treatments, where a negative effect indicates that social markers were used
as cues for issue positions. We find no statistically significant effect of the both treatment on
the social markers shared between the voter and candidate, which did influence the vote choice
in the group treatment. The effect of the both treatments is .02 (−.08, .04) for shared level of
education and −04, (−.11, .02) for shared religion. The evidence so far suggests that voters do
not to use descriptive representation to facilitate substantive representation (Result 4).
Experiment 2: Do voters link candidates’ social markers and policy preferences?
The results from experiment 1 establish that people do discriminate between candidates based on
their social markers but that they prefer in-group candidates only on some attribute dimensions.
We find a strong preference for candidates who share the same political preferences. However,
we cannot yet clearly identify whether descriptive representation serves as proxy for substantive
representation. These mixed results come as a surprise given that voters differentiate candidates
by their social markers and prefer those who share their political preferences. Why are voters not
using the information embedded in social markers even when no other information is available?
Is it that voters are not able to perceive that there is a correlation between candidates’ social
markers and political preferences?
Experiment 2 tests whether respondents believe that candidates’ preferences on policy issues
are associated with their social backgrounds. If voters form such beliefs, we take this as evi-
dence that instrumental motivations are enabled by descriptive representation, and, therefore,
that descriptive representation has the potential to serve as proxy for substantive representa-
7Note that our sample is too small to measure moderating effects of the respondents’ social markers.
7

●
●
●
●
●
●
●
●
●
●
●
●
●
●
●
●
●
●
●
●
●
●
●
●
●
●
●
●
●
●
●
●
●
●
●
●
●
●
●
●
●
●
●
●
●
●
●
●
●
●
●
●
●
●
●
●
●
●
●
●
●
●
●
●
●
●
Income inequalityissue
Refugee rightsissue
Emission reductionissue
Age
Gender
Education
Religion
Region
−0.30 −0.15 0.00 0.15 0.30−0.30 −0.15 0.00 0.15 0.30−0.30 −0.15 0.00 0.15 0.30
80 years70 years60 years50 years40 years30 years22 years
FemaleMale
Ph.D.University
High schoolElementary school
IslamChristianityNo religion
Northern NorwayCentral Norway
Western NorwaySouthern Norway
Eastern NorwayOslo
Change in predicted Pr(Respondent thinks that candidate agrees with issue statement)
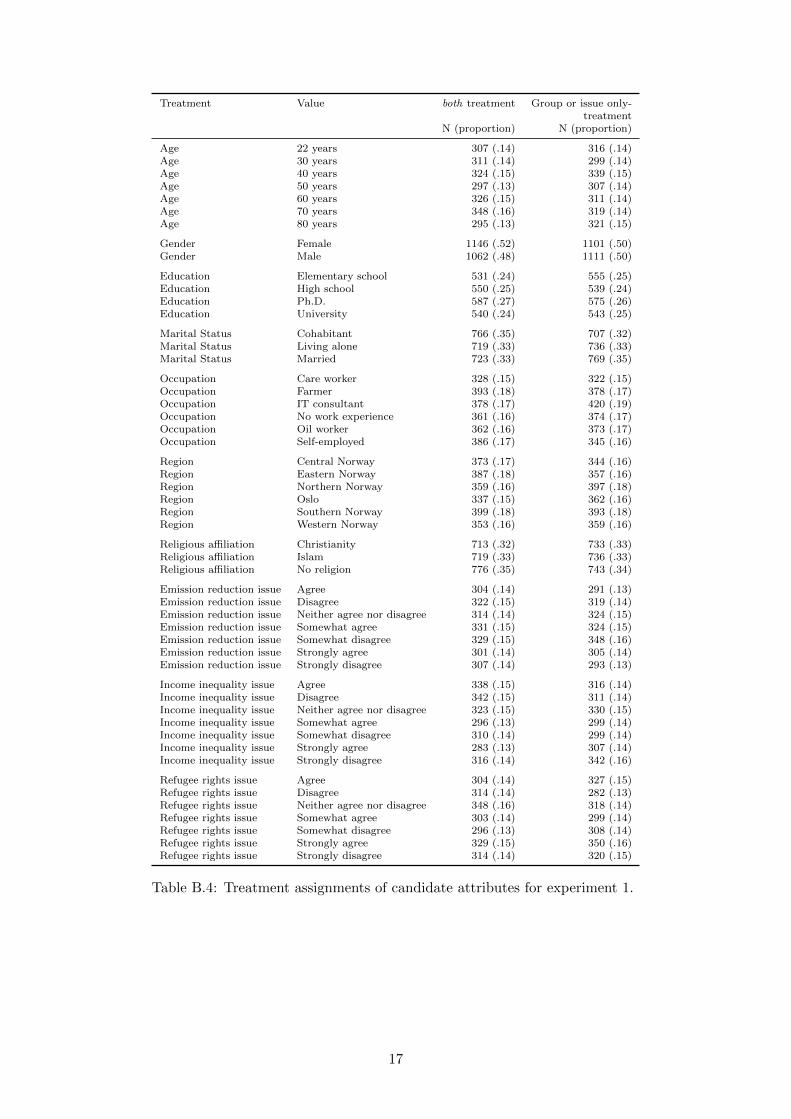
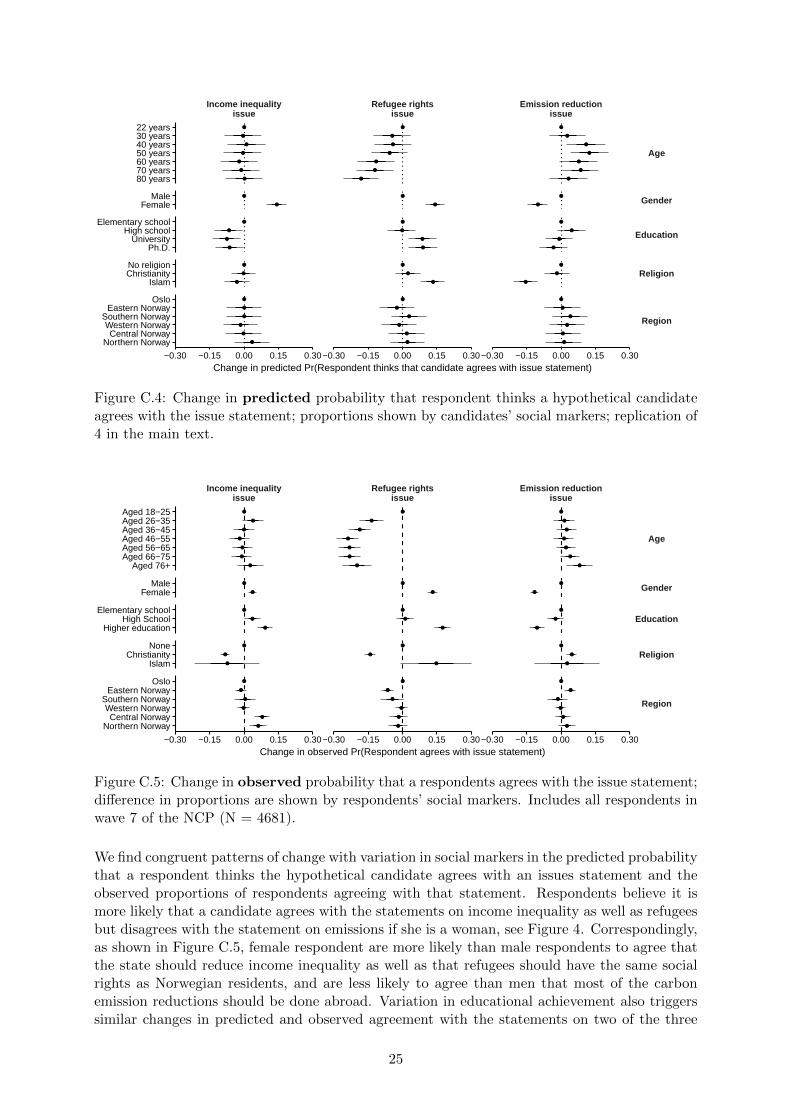
Figure 4: Change in predicted probability that respondent thinks a hypothetical candidateagrees with the issue statement; proportions shown by candidates’ social markers.
tion. Experiment 2 shows that respondents’ beliefs about candidates’ political preferences vary
significantly with variation in candidates’ age, gender, education, and religion (Figure 4). Vot-
ers infer candidates’ issue positions based on only knowing candidates’ social markers (Result
5). Respondents’ beliefs about variation in policy preferences based on difference in candidates’
social markers often align with how actually observed attitudes of respondents’ vary with their
social background (see Figure C.3 in the SI). The congruence is most pronounced for gender but
also mostly exists for education.8
4 Conclusion
We designed two conjoint experiments embedded within the Norwegian Citizen Panel to inves-
tigate the use of descriptive information when choosing between candidates. We argued that
voters have instrumental incentives to choose candidates who share their social markers. The
results of our two experiments reveal that respondents select hypothetical candidates based on
social markers but only prefer their in-group candidate on a few attribute dimensions (educa-
tion and religion). We do not immediately identify the utilization of descriptive information
to achieve substantive representation, even though respondents hold commonly accepted beliefs
about which social characteristics align with particular political preferences of a candidate and,
importantly, clearly desire representatives who share their political preferences. Descriptive
8One should be wary of making too strong inferences when comparing predicted and observed attitudes,
however, given that the underlying probabilities of the experimental data and the observational data are different.
8

representation can serve as proxy for substantive representation given the ability of voters to
form appropriate beliefs about the relationship between candidates’ social markers and their
political preferences as well as voters’ desire to be represented by someone who shares their pref-
erences. Our evidence, however, suggests that there could be more to demand for descriptive
representation than its instrumental benefits from policy matching.
References
Arnesen, Sveinung and Yvette Peters. 2017. “The Legitimacy of Representation. How De-scriptive, Formal, and Responsiveness Representation Affect the Acceptability of PoliticalDecisions.” Comparative Political Studies . Prepublished August 8, 2017.
Auspurg, Katrin, Thomas Hinz and Carsten Sauer. 2017. “Why Should Women Get Less? Evi-dence on the Gender Pay Gap from Multifactorial Survey Experiments.” American SociologicalReview 82(1):179–210.
Bansak, Kirk, Jens Hainmueller, Daniel J. Hopkins and Teppei Yamamoto. 2017. “Beyond theBreaking Point? Survey Satisficing in Conjoint Experiments.” Stanford University GraduateSchool of Business Research Paper No. 17-33 .
Bobo, Lawrence and Franklin D Gilliam. 1990. “Race, sociopolitical participation, and blackempowerment.” American Political Science Review 84(2):377–393.
Bowler, Shaun. 2017. “Trustees, delegates, and responsiveness in comparative perspective.”Comparative Political Studies 50(6):766–793.
Bratton, Kathleen and Leonard Ray. 2002. “Descriptive representation, policy outcomes, andmunicipal day-care coverage in Norway.” American Journal of Political Science pp. 428–437.
Broockman, David E. 2014. “Distorted communication, unequal representation: constituentscommunicate less to representatives not of their race.” American Journal of Political Science58(2):307–321.
Carnes, Nicholas and Noam Lupu. 2016. “Do voters dislike working-class candidates? Voter bi-ases and the descriptive underrepresentation of the working class.” American Political ScienceReview 110(4):832–844.
Casellas, Jason P and Sophia J Wallace. 2015. “The role of race, ethnicity, and party on attitudestoward descriptive representation.” American Politics Research 43(1):144–169.
Chandra, Kanchan. 2004. Why Ethnic Parties Succeed. New York: Cambridge University Press.
Eckstein, Harry. 2000. Case study and theory in political science. In Case Study Method: KeyIssues, Key Texts. London: Sage pp. 119–164.
Eifert, Benn, Edward Miguel and Daniel N Posner. 2010. “Political competition and ethnicidentification in Africa.” American Journal of Political Science 54(2):494–510.
Fenno, Richard F. 1978. Home style: House members in their districts. Boston: Little, Brown.
Franck, Raphael and Ilia Rainer. 2012. “Does the leader’s ethnicity matter? Ethnic favoritism,education, and health in sub-Saharan Africa.” American Political Science Review 106(2):294–325.
9

Gay, Claudine. 2002. “Spirals of trust? The effect of descriptive representation on the re-lationship between citizens and their government.” American Journal of Political Science46(4):717–732.
Hainmueller, Jens, Daniel J Hopkins and Teppei Yamamoto. 2014. “Causal Inference in Con-joint Analysis: Understanding Multidimensional Choices via Stated Preference Experiments.”Political analysis 22(1):1–30.
Hayes, Matthew and Matthew V Hibbing. 2017. “The Symbolic Benefits of Descriptive andSubstantive Representation.” Political Behavior 39(1):31–50.
Henderson, John A, Jasjeet S Sekhon and Rocıo Titiunik. 2016. “Cause or effect? Turnout inhispanic majority-minority districts.” Political Analysis 24(3):404–412.
Ivarsflaten, Elisabeth, Sveinung Arnesen Bjarte Folkestad Endre Tvinnereim Mikael Johannes-son Erik Knudsen Nina Serdarevic Asta Nordø. 2016a. Norwegian Citizen Panel Wave 7.Technical report University of Bergen. University of Bergen and UNI Research Rokkan Cen-tre. Data available at The Norwegian Center for Research Data, first NSD edition.
Ivarsflaten, Elisabeth, Sveinung Arnesen Endre Tvinnereim Mikael Johannesson Erik KnudsenAsta Nordø. 2016b. Norwegian Citizen Panel Wave 6. Technical report University of Bergen.University of Bergen and UNI Research Rokkan Centre. Data available at Norwegian Centerfor Research Data, second NSD edition.
Jones, Philip Edward. 2016. “Constituents’ Responses to Descriptive and Substantive Repre-sentation in Congress.” Social Science Quarterly 97(3):682–698.
Mansbridge, Jane. 1999. “Should blacks represent blacks and women represent women? Acontingent “yes”.” The Journal of Politics 61(03):628–657.
Pantoja, Adrian D and Gary M Segura. 2003. “Does ethnicity matter? Descriptive repre-sentation in legislatures and political alienation among Latinos.” Social Science Quarterly84(2):441–460.
Phillips, Anne. 1995. The Politics of Presence. Oxford: Clarendon Press.
Pitkin, Hanna Fenichel. 1967. The Concept of Representation. Berkeley: Univ of Cal Press.
Rahn, Wendy. 1993. “The Role of Partisan Stereotypes in Information Processing about PoliticalCandidates.” American Journal of Political Science 37:472–96.
Reynolds, Andrew. 2013. “Representation and rights: The impact of LGBT legislators in com-parative perspective.” American Political Science Review 107(02):259–274.
Sanchez, Gabriel R and Jason L Morin. 2011. “The Effect of Descriptive Representation onLatinos’ Views of Government and of Themselves.” Social Science Quarterly 92(2):483–508.
Schwindt-Bayer, Leslie A and William Mishler. 2005. “An integrated model of women’s repre-sentation.” Journal of Politics 67(2):407–428.
Skjervheim and Høgestøl. 2016a. Norwegian Citizen Panel, Fifth Wave Methodology report.Technical report Ideas2Evidence.
Skjervheim and Høgestøl. 2016b. Norwegian Citizen Panel, Sixth Wave Methodology report.Technical report Ideas2Evidence.
West, Emily A. 2017. “Descriptive Representation and Political Efficacy: Evidence from Obamaand Clinton.” The Journal of Politics 79(1):351–355.
10

Supporting information
A Experimental design
A.1 Experiment 1
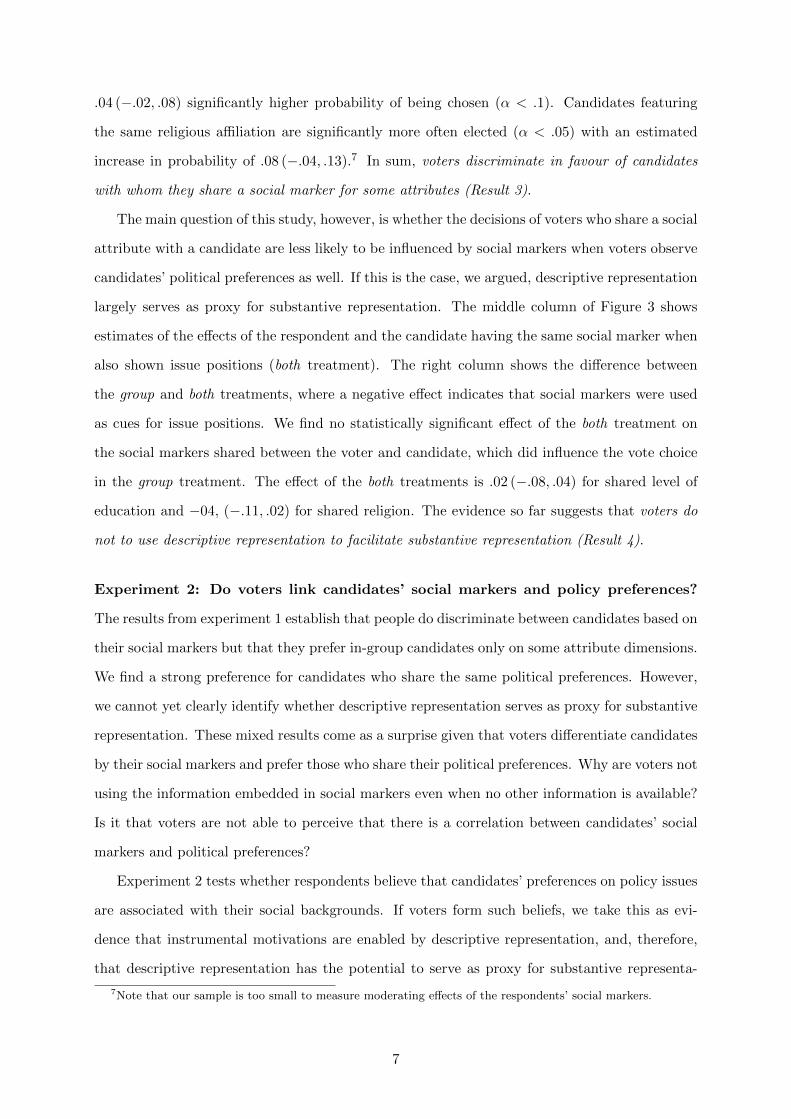
In the first conjoint experiment, the group treatment shows only social background attributes.This experiment has a total of seven attribute dimensions, and given the number of potentialvalues for each attribute, the number of possible candidate profiles is 7x2x4x6x3x3x6 = 18144.The respondents see a randomly drawn sample of two of these variations and are asked tocompare the two. The respondents are then asked to choose which of the two candidates theywould prefer to represent them in the national parliament. The issue treatment shows only thecandidates’ political preferences on three issues, and this treatment has 7x7x7 = 343 possiblecombinations of unique candidate profiles. As in the group treatment, the respondents are askedto choose which candidate they prefer out of the two presented within each decision task. In theboth treatment, the respondents are also asked to make a decision between two candidates butthis time with information about both the social background attributes and political views ofthe candidates. Thus, respondents choose between two profiles that are randomly drawn from auniverse of 7x2x4x6x3x3x6x7x7x7 = 6223392 possible candidate profiles. Clearly, only a fractionof the possible profiles are evaluated by the respondents. Since the profiles are randomly sampledfrom the profile universe with a uniform probability distribution, we can nevertheless estimatethe average likelihood that the respondent chooses a candidate with a certain characteristic oneach dimension.
ID Dimension Values
Social group characteristicsage Age [22 years / 30 years / 40 years / 50 years
/ 60 years / 70 years / 80 years]gender Gender [Male / Female]
education Completed education [Elementary school /High school / Univer-sity degree / Phd
region Region of residence [Oslo area / Eastern Norway / SouthernNorway / Western Norway / Middle Nor-way / Northern Norway]
civil Civil status [Living alone / Cohabitant / Married]religion Religion [Christianity / Islam / No religion]
work Work experience outside of politics [None / Care worker / Farmer / Oil worker/ Self-employed / IT consultant]
Political issue attitudesinequality The state should reduce income in-
equality[Strongly agree / Agree / Somewhat agree/ Neither agree nor disagree / Somewhatdisagree / Disagree / Strongly disagree]
refugee Refugees should have the same rightto social assistance as citizens
[Strongly agree / Agree / Somewhat agree/ Neither agree nor disagree / Somewhatdisagree / Disagree / Strongly disagree]
emissions Most of the carbon emission reduc-tions should be done abroad
[Strongly agree / Agree / Somewhat agree/ Neither agree nor disagree / Somewhatdisagree / Disagree / Strongly disagree]
Table A.1: Attribute dimensions and their corresponding values, Experiment 1
Before each decision task, respondents are shown an introductory text that translates to: “Be-
11

low we have listed two hypothetical representatives for the national parliament with differentattributes. Imagine that you had to choose one of these two to represent you personally inparliament. Please read the description of each candidate carefully. After that, please indicatewhich representative you would prefer to represent you.” Figure A.1 shows an example from theboth treatment as it was presented to the respondents on the screen.
Figure A.1: Screen-shot example of experimental vignette in experiment 1 as it was presentedto the respondents.
A.2 Experiment 2
Figure A.2 shows an example of the task as it was presented to the respondents on the screen.
Figure A.2: Screen-shot example of experimental vignette in experiment 2 as it was presentedto the respondents.
Before each decision task, respondents are shown introductory text that translates to: “Peoplehave differing political opinions, and sometimes these opinions are related to their background.Below, we have made up two imaginary persons/politicians of different background. We wishto know which of these you think would be mostly in agreement with the statement below.”
12

B Data description and summary statistics
B.1 Norwegian Citizen Panel, Waves 6 and 7, 2016
The Norwegian Citizen Panel (NCP) is a research-oriented online panel with about 6000 activeparticipants. The panel members complete a 20-minute online questionnaire approximatelythree times a year. For more details about the response rates or other methodological issues, werefer to the NCP methodology reports (Skjervheim and Høgestøl, 2016a,b). The data are freelyavailable for scholars via the Norwegian Centre for Research Data.
13

B.2 Summary statistics
Variable Value N %
Age Aged 18-25 56 5Age Aged 26-35 126 11Age Aged 36-45 166 15Age Aged 46-55 235 21Age Aged 56-65 273 24Age Aged 66-75 222 19Age Aged 76+ 61 5
Education Elementary school 85 8Education High School 357 32Education Higher education 667 60
Gender Female 568 50Gender Male 571 50
Professional field Agriculture/fishing 34 5Professional field None 341 54Professional field Nursing or care services 169 27Professional field Oil/gas 49 8Professional field Telecommunications/IT 36 6
Marital Status Cohabitant 213 19Marital Status Live alone 281 25Marital Status Married 640 56
Region Central Norway 111 10Region Eastern Norway 285 25Region Northern Norway 88 8Region Oslo 302 27Region Southern Norway 57 5Region Western Norway 296 26
Religious affiliation Christianity 777 72Religious affiliation Islam 6 1Religious affiliation None 286 26Religious affiliation Other 11 1
Emission reduction issue 1 123 11Emission reduction issue 2 279 25Emission reduction issue 3 189 17Emission reduction issue 4 285 25Emission reduction issue 5 151 13Emission reduction issue 6 78 7Emission reduction issue 7 33 3
Income inequality issue 1 11 1Income inequality issue 2 60 5Income inequality issue 3 105 9Income inequality issue 4 100 9Income inequality issue 5 293 26Income inequality issue 6 352 31Income inequality issue 7 218 19
Refugee rights issue 1 134 12Refugee rights issue 2 191 17Refugee rights issue 3 235 21Refugee rights issue 4 123 11Refugee rights issue 5 212 19Refugee rights issue 6 182 16Refugee rights issue 7 62 5
Table B.1: Summary statistics for the respondents participating in experiment 1.
14

Variable Value N %
Age Aged 18-25 63 6Age Aged 26-35 117 11Age Aged 36-45 154 14Age Aged 46-55 207 19Age Aged 56-65 265 25Age Aged 66-75 222 21Age Aged 76+ 49 5
Education Elementary school 88 8Education High School 334 32Education Higher education 626 60
Gender Female 539 50Gender Male 538 50
Professional field Agriculture/fishing 32 5Professional field None 343 59Professional field Nursing or care services 134 23Professional field Oil/gas 42 7Professional field Telecommunications/IT 34 6
Marital Status Cohabitant 176 16Marital Status Live alone 298 28Marital Status Married 600 56
Region Central Norway 89 8Region Eastern Norway 272 25Region Northern Norway 88 8Region Oslo 287 27Region Southern Norway 51 5Region Western Norway 290 27
Religious affiliation Christianity 736 73Religious affiliation Islam 3 0Religious affiliation None 260 26Religious affiliation Other 10 1
Emission reduction issue 1 125 12Emission reduction issue 2 228 23Emission reduction issue 3 171 17Emission reduction issue 4 251 25Emission reduction issue 5 130 13Emission reduction issue 6 72 7Emission reduction issue 7 36 4
Income inequality issue 1 13 1Income inequality issue 2 54 5Income inequality issue 3 106 10Income inequality issue 4 93 9Income inequality issue 5 273 25Income inequality issue 6 328 30Income inequality issue 7 210 19
Refugee rights issue 1 114 11Refugee rights issue 2 186 17Refugee rights issue 3 232 22Refugee rights issue 4 113 10Refugee rights issue 5 197 18Refugee rights issue 6 174 16Refugee rights issue 7 61 6
Table B.2: Summary statistics for the respondents participating in experiment 2.
15

Variable Value N %
Age Aged 18-25 273 0.06Age Aged 26-35 562 0.12Age Aged 36-45 724 0.15Age Aged 46-55 925 0.20Age Aged 56-65 1116 0.24Age Aged 66-75 872 0.19Age Aged 76+ 217 0.05
Gender Male 2355 0.50Gender Female 2334 0.50
Education Elementary school 428 0.09Education High School 1405 0.31Education Higher education 2695 0.60
Religion None 1127 0.26Religion Christianity 3132 0.73Religion Islam 17 0.00
Region Oslo 1335 0.28Region Eastern Norway 1133 0.24Region Southern Norway 216 0.05Region Western Norway 1235 0.26Region Central Norway 425 0.09Region Northern Norway 345 0.07
Emission reductions issue Strongly disagree 502 0.11Emission reductions issue Disagree 1058 0.24Emission reductions issue Somewhat disagree 793 0.18Emission reductions issue Neither agree nor disagree 1027 0.23Emission reductions issue Somewhat agree 552 0.13Emission reductions issue Agree 322 0.07Emission reductions issue Strongly agree 156 0.04
Income inequality issue Strongly disagree 81 0.02Income inequality issue Disagree 249 0.05Income inequality issue Somewhat disagree 432 0.09Income inequality issue Neither agree nor disagree 496 0.11Income inequality issue Somewhat agree 1176 0.25Income inequality issue Agree 1387 0.30Income inequality issue Strongly agree 860 0.18
Refugees rights issue Strongly disagree 545 0.12Refugees rights issue Disagree 811 0.17Refugees rights issue Somewhat disagree 953 0.20Refugees rights issue Neither agree nor disagree 476 0.10Refugees rights issue Somewhat agree 828 0.18Refugees rights issue Agree 772 0.16Refugees rights issue Strongly agree 302 0.06
Table B.3: Summary statistics for the respondents observed in Figure C.5.
16
Treatment Value both treatment Group or issue only-treatment
N (proportion) N (proportion)
Age 22 years 307 (.14) 316 (.14)Age 30 years 311 (.14) 299 (.14)Age 40 years 324 (.15) 339 (.15)Age 50 years 297 (.13) 307 (.14)Age 60 years 326 (.15) 311 (.14)Age 70 years 348 (.16) 319 (.14)Age 80 years 295 (.13) 321 (.15)
Gender Female 1146 (.52) 1101 (.50)Gender Male 1062 (.48) 1111 (.50)
Education Elementary school 531 (.24) 555 (.25)Education High school 550 (.25) 539 (.24)Education Ph.D. 587 (.27) 575 (.26)Education University 540 (.24) 543 (.25)
Marital Status Cohabitant 766 (.35) 707 (.32)Marital Status Living alone 719 (.33) 736 (.33)Marital Status Married 723 (.33) 769 (.35)
Occupation Care worker 328 (.15) 322 (.15)Occupation Farmer 393 (.18) 378 (.17)Occupation IT consultant 378 (.17) 420 (.19)Occupation No work experience 361 (.16) 374 (.17)Occupation Oil worker 362 (.16) 373 (.17)Occupation Self-employed 386 (.17) 345 (.16)
Region Central Norway 373 (.17) 344 (.16)Region Eastern Norway 387 (.18) 357 (.16)Region Northern Norway 359 (.16) 397 (.18)Region Oslo 337 (.15) 362 (.16)Region Southern Norway 399 (.18) 393 (.18)Region Western Norway 353 (.16) 359 (.16)
Religious affiliation Christianity 713 (.32) 733 (.33)Religious affiliation Islam 719 (.33) 736 (.33)Religious affiliation No religion 776 (.35) 743 (.34)
Emission reduction issue Agree 304 (.14) 291 (.13)Emission reduction issue Disagree 322 (.15) 319 (.14)Emission reduction issue Neither agree nor disagree 314 (.14) 324 (.15)Emission reduction issue Somewhat agree 331 (.15) 324 (.15)Emission reduction issue Somewhat disagree 329 (.15) 348 (.16)Emission reduction issue Strongly agree 301 (.14) 305 (.14)Emission reduction issue Strongly disagree 307 (.14) 293 (.13)
Income inequality issue Agree 338 (.15) 316 (.14)Income inequality issue Disagree 342 (.15) 311 (.14)Income inequality issue Neither agree nor disagree 323 (.15) 330 (.15)Income inequality issue Somewhat agree 296 (.13) 299 (.14)Income inequality issue Somewhat disagree 310 (.14) 299 (.14)Income inequality issue Strongly agree 283 (.13) 307 (.14)Income inequality issue Strongly disagree 316 (.14) 342 (.16)
Refugee rights issue Agree 304 (.14) 327 (.15)Refugee rights issue Disagree 314 (.14) 282 (.13)Refugee rights issue Neither agree nor disagree 348 (.16) 318 (.14)Refugee rights issue Somewhat agree 303 (.14) 299 (.14)Refugee rights issue Somewhat disagree 296 (.13) 308 (.14)Refugee rights issue Strongly agree 329 (.15) 350 (.16)Refugee rights issue Strongly disagree 314 (.14) 320 (.15)
Table B.4: Treatment assignments of candidate attributes for experiment 1.
17

Treatment Value N %(Candidate)
Age 22 years 163 15Age 30 years 167 15Age 40 years 166 15Age 50 years 147 13Age 60 years 160 14Age 70 years 163 15Age 80 years 153 14
Gender Female 550 49Gender Male 569 51
Education Elementary school 283 25Education High school 278 25Education Ph.D. 272 24Education University 286 26
Marital Status Cohabitant 341 30Marital Status Living alone 387 35Marital Status Married 391 35
Occupation Care worker 176 16Occupation Farmer 188 17Occupation IT consultant 200 18Occupation No work experience 190 17Occupation Oil worker 191 17Occupation Self-employed 174 16
Region Central Norway 182 16Region Eastern Norway 173 15Region Northern Norway 196 18Region Oslo 179 16Region Southern Norway 208 19Region Western Norway 181 16
Religious affiliation Christianity 369 33Religious affiliation Islam 379 34Religious affiliation No religion 371 33
Emission reduction issue Agree 5 15Emission reduction issue Disagree 3 9Emission reduction issue Neither agree nor disagree 7 21Emission reduction issue Somewhat agree 1 3Emission reduction issue Somewhat disagree 8 24Emission reduction issue Strongly agree 8 24Emission reduction issue Strongly disagree 1 3
Income inequality issue Agree 6 18Income inequality issue Disagree 5 15Income inequality issue Neither agree nor disagree 2 6Income inequality issue Somewhat agree 6 18Income inequality issue Somewhat disagree 4 12Income inequality issue Strongly agree 6 18Income inequality issue Strongly disagree 4 12
Refugee rights issue Agree 7 21Refugee rights issue Disagree 6 18Refugee rights issue Neither agree nor disagree 5 15Refugee rights issue Somewhat agree 5 15Refugee rights issue Somewhat disagree 2 6Refugee rights issue Strongly agree 3 9Refugee rights issue Strongly disagree 5 15
Table B.5: Treatment assignments of candidate attributes for experiment 2.
18

B.3 Tabled results shown in Figures 1-4
Treatment Attribute Attr. level Coef. Std. Error t-value p-value
group treatment Age 22 years (ref.)group treatment Age 30 years 0.097 0.04 2.395 0.017 *group treatment Age 40 years 0.012 0.039 0.318 0.750group treatment Age 50 years 0.105 0.04 2.594 0.010 **group treatment Age 60 years 0.081 0.039 2.076 0.038 *group treatment Age 70 years 0.018 0.04 0.437 0.662group treatment Age 80 years -0.082 0.039 -2.079 0.038 *
group treatment Gender Male (ref.)group treatment Gender Female 0.079 0.021 3.727 0.000 ***
group treatment Education Elementary school (ref.)group treatment Education High school 0.007 0.030 0.222 0.825group treatment Education University 0.047 0.030 1.575 0.115group treatment Education Ph.D. 0.057 0.029 1.938 0.053 .
group treatment Religion No religion (ref.)group treatment Religion Christianity -0.043 0.026 -1.665 0.096 .group treatment Religion Islam -0.150 0.026 -5.727 0.000 ***
group treatment Region Oslo (ref.)group treatment Region Eastern Norway 0.021 0.036 0.585 0.559group treatment Region Southern Norway 0.006 0.035 0.182 0.855group treatment Region Western Norway -0.010 0.037 -0.267 0.790group treatment Region Central Norway -0.026 0.037 -0.709 0.478group treatment Region Northern Norway 0.006 0.036 0.176 0.860
both treatment Age 22 years (ref.)both treatment Age 30 years -0.010 0.04 -0.248 0.804both treatment Age 40 years -0.003 0.04 -0.066 0.948both treatment Age 50 years 0.024 0.041 0.594 0.553both treatment Age 60 years -0.003 0.04 -0.070 0.944both treatment Age 70 years -0.064 0.039 -1.651 0.099 .both treatment Age 80 years -0.091 0.042 -2.182 0.029 *
both treatment Gender Male (ref.)both treatment Gender Female 0.022 0.021 1.054 0.292
both treatment Education Elementary school (ref.)both treatment Education High school 0.005 0.030 0.166 0.868both treatment Education University 0.029 0.030 0.965 0.335both treatment Education Ph.D. 0.022 0.03 0.731 0.465
both treatment Religion No religion (ref.)both treatment Religion Christianity -0.008 0.026 -0.288 0.773both treatment Religion Islam -0.095 0.026 -3.739 0.000 ***
both treatment Region Oslo (ref.)both treatment Region Eastern Norway -0.073 0.038 -1.942 0.052 .both treatment Region Southern Norway -0.062 0.036 -1.708 0.088 .both treatment Region Western Norway -0.025 0.038 -0.659 0.510both treatment Region Central Norway -0.018 0.037 -0.476 0.634both treatment Region Northern Norway -0.092 0.038 -2.425 0.015 *
Note: . p<0.1; ∗p<0.05; ∗∗p<0.01; ∗∗∗p<0.001
Table B.6: Results from an OLS regression of vote choice against a set of dummies for eachattribute realization (omitting a reference category) with clustered standard errors as presentedin Figure 1.
19

Treatment Attribute Attr. level Coef. Std. Error t-value p-value
issue treatment Income inequality issue Difference of ±4/5/6 (ref.)issue treatment Income inequality issue Difference of ±2/3 0.070 0.042 1.656 0.098 .issue treatment Income inequality issue Same position 0.213 0.042 5.072 0.000 ***
issue treatment Refugee rights issue Difference of ±4/5/6 (ref.)issue treatment Refugee rights issue Difference of ±2/3 0.120 0.041 2.945 0.003 **issue treatment Refugee rights issue Same position 0.255 0.040 6.400 0.00 ***
issue treatment Emission reduction issue Difference of ±4/5/6 (ref.)issue treatment Emission reduction issue Difference of ±2/3 0.059 0.046 1.294 0.196issue treatment Emission reduction issue Same position 0.166 0.046 3.595 0.000 ***
both treatment Income inequality issue Difference of ±4/5/6 (ref.)both treatment Income inequality issue Difference of ±2/3 0.131 0.043 3.066 0.002 **both treatment Income inequality issue Same position 0.205 0.042 4.868 0.000 ***
both treatment Refugee rights issue Difference of ±4/5/6 (ref.)both treatment Refugee rights issue Difference of ±2/3 -0.017 0.047 -0.361 0.718both treatment Refugee rights issue Same position 0.032 0.046 0.704 0.482
both treatment Emission reduction issue Difference of ±4/5/6 (ref.)both treatment Emission reduction issue Difference of ±2/3 0.045 0.045 1.009 0.313both treatment Emission reduction issue Same position 0.102 0.043 2.356 0.019 *
Note: . p<0.1; ∗p<0.05; ∗∗p<0.01; ∗∗∗p<0.001
Table B.7: Results from an OLS regression of vote choice against a set of dummies for eachattribute realization (omitting a reference category) with clustered standard errors as presentedin Figure 2.
20

Treatment Attribute Attr. level Coef. Std. Error t-value p-value
group treatment Age Different (ref.)group treatment Age Same (+/- 5 yrs) 0.044 0.029 1.516 0.130
group treatment Gender Different (ref.)group treatment Gender Same -0.003 0.021 -0.128 0.898
group treatment Education Different (ref.)group treatment Education Same 0.041 0.022 1.904 0.057 .
group treatment Religion Different (ref.)group treatment Religion Same 0.082 0.023 3.592 0.000 ***
group treatment Region Different (ref.)group treatment Region Same -0.003 0.029 -0.114 0.909
both treatment Age Different (ref.)both treatment Age Same (+/- 5 yrs) 0.008 0.031 0.242 0.809
both treatment Gender Different (ref.)both treatment Gender Same 0.009 0.021 0.439 0.661
both treatment Education Different (ref.)both treatment Education Same 0.020 0.021 0.965 0.334
both treatment Religion Different (ref.)both treatment Religion Same 0.041 0.023 1.736 0.083 .
both treatment Region Different (ref.)both treatment Region Same 0.024 0.028 0.862 0.389
Difference Age Different (ref.)Difference Age Same (+/- 5 yrs) -0.036 0.044 -0.827 0.408
Difference Gender Different (ref.)Difference Gender Same 0.012 0.029 0.400 0.689
Difference Education Different (ref.)Difference Education Same -0.021 0.030 -0.693 0.488
Difference Religion Different (ref.)Difference Religion Same -0.041 0.032 -1.262 0.207
Difference Region Different (ref.)Difference Region Same 0.028 0.041 0.678 0.498
Note: . p<0.1; ∗p<0.05; ∗∗p<0.01; ∗∗∗p<0.001
Table B.8: Results from an OLS regression of vote choice against a set of dummies for eachattribute realization (omitting a reference category) with clustered standard errors as presentedin Figure 3.
21

Issue Attribute Attr. level Coef. Std. Error t-value p-value
Income inequality issue Age 22 years (ref.)Income inequality issue Age 30 years -0.005 0.041 -0.121 0.903Income inequality issue Age 40 years 0.010 0.042 0.245 0.806Income inequality issue Age 50 years -0.005 0.041 -0.121 0.904Income inequality issue Age 60 years -0.022 0.041 -0.539 0.590Income inequality issue Age 70 years -0.013 0.041 -0.313 0.754Income inequality issue Age 80 years 0.002 0.041 0.042 0.967
Income inequality issue Gender Male (ref.)Income inequality issue Gender Female 0.142 0.021 6.646 0.000 ***
Income inequality issue Education Elementary school (ref.)Income inequality issue Education High school -0.066 0.030 -2.175 0.030 *Income inequality issue Education University -0.075 0.030 -2.488 0.013 *Income inequality issue Education Ph.D. -0.064 0.031 -2.054 0.040 *
Income inequality issue Religion No religion (ref.)Income inequality issue Religion Christianity -0.003 0.027 -0.105 0.916Income inequality issue Religion Islam -0.032 0.027 -1.174 0.241
Income inequality issue Region Oslo (ref.)Income inequality issue Region Eastern Norway 0.000 0.037 0.004 0.997Income inequality issue Region Southern Norway 0.000 0.038 0.002 0.998Income inequality issue Region Western Norway -0.016 0.037 -0.427 0.669Income inequality issue Region Central Norway -0.003 0.039 -0.074 0.941Income inequality issue Region Northern Norway 0.035 0.038 0.911 0.363
Refugee rights issue Age 22 years (ref.)Refugee rights issue Age 30 years -0.045 0.040 -1.127 0.260Refugee rights issue Age 40 years -0.042 0.040 -1.061 0.289Refugee rights issue Age 50 years -0.057 0.040 -1.440 0.150Refugee rights issue Age 60 years -0.116 0.040 -2.926 0.003 **Refugee rights issue Age 70 years -0.121 0.040 -3.004 0.003 **Refugee rights issue Age 80 years -0.181 0.039 -4.655 0.000 ***
Refugee rights issue Gender Male (ref.)Refugee rights issue Gender Female 0.141 0.021 6.606 0.000 ***
Refugee rights issue Education Elementary school (ref.)Refugee rights issue Education High school -0.002 0.031 -0.079 0.937Refugee rights issue Education University 0.086 0.031 2.827 0.005 **Refugee rights issue Education Ph.D. 0.088 0.032 2.787 0.005 **
Refugee rights issue Religion No religion (ref.)Refugee rights issue Religion Christianity 0.023 0.027 0.844 0.399Refugee rights issue Religion Islam 0.132 0.026 5.093 0.000 ***
Refugee rights issue Region Oslo (ref.)Refugee rights issue Region Eastern Norway -0.025 0.038 -0.664 0.507Refugee rights issue Region Southern Norway 0.028 0.039 0.714 0.475Refugee rights issue Region Western Norway -0.015 0.038 -0.398 0.691Refugee rights issue Region Central Norway 0.018 0.039 0.459 0.646Refugee rights issue Region Northern Norway 0.021 0.036 0.571 0.568
Emission reduction issue Age 22 years (ref.)Emission reduction issue Age 30 years 0.026 0.039 0.672 0.501Emission reduction issue Age 40 years 0.109 0.042 2.618 0.009 **Emission reduction issue Age 50 years 0.123 0.041 2.975 0.003 **Emission reduction issue Age 60 years 0.077 0.041 1.881 0.060 .Emission reduction issue Age 70 years 0.085 0.040 2.134 0.033 *Emission reduction issue Age 80 years 0.032 0.041 0.780 0.436
Emission reduction issue Gender Male (ref.)Emission reduction issue Gender Female -0.102 0.022 -4.644 0.000 ***
Emission reduction issue Education Elementary school (ref.)Emission reduction issue Education High school 0.046 0.031 1.495 0.135Emission reduction issue Education University -0.009 0.030 -0.287 0.774Emission reduction issue Education Ph.D. -0.034 0.031 -1.095 0.274
Emission reduction issue Religion No religion (ref.)Emission reduction issue Religion Christianity -0.019 0.027 -0.699 0.485Emission reduction issue Religion Islam -0.155 0.027 -5.716 0.000 ***
Emission reduction issue Region Oslo (ref.)Emission reduction issue Region Eastern Norway 0.006 0.038 0.160 0.873Emission reduction issue Region Southern Norway 0.040 0.039 1.033 0.302Emission reduction issue Region Western Norway 0.026 0.039 0.657 0.511Emission reduction issue Region Central Norway 0.007 0.038 0.196 0.845Emission reduction issue Region Northern Norway 0.013 0.039 0.322 0.748
Note: . p<0.1; ∗p<0.05; ∗∗p<0.01; ∗∗∗p<0.001
Table B.9: Results from an OLS regression of whether voter thinks the candidate agrees withthe issue statement on a set of dummies for each attribute realization (omitting a referencecategory) with clustered standard errors as presented in Figure 4.
22

C Additional results
●
●
●
●
●
●
●
●
●
●
●
●
●
●
●
●
●
●
●
●
●
●
●
●
●
●
●
●
●
●
●
●
●
●
●
●
●
●
●
●
●
●
●
●
●
●
●
●
●
●
●
●
●
●
●
●
●
●
●
●
●
●
Group−treatment Both−treatment
Age
Gender
Relationship
Education
Religion
Occupation
Region
−0.30 −0.15 0.00 0.15 0.30−0.30 −0.15 0.00 0.15 0.30
80 years70 years60 years50 years40 years30 years22 years
FemaleMale
MarriedLiving aloneCohabitant
Ph.D.University
High schoolElementary school
IslamChristianityNo religion
Self−employedOil worker
No work experienceIT−consultant
FarmerCare worker
Northern NorwayCentral Norway
Western NorwaySouthern Norway
Eastern NorwayOslo
Change in predicted Pr(Respondent prefers candidate)
Figure C.1: Figure 1 with all social markers included.
23

●
●
●
●
●
●
●
●
●
●
●
●
●
●
●
●
●
●
●
●
●
●
●
●
●
●
●
●
●
●
●
●
●
●
●
●
●
●
●
●
●
●
●
●
●
●
●
●
●
●
●
●
●
●
●
●
●
●
●
●
●
●
●
●
●
●
●
●
●
●
●
●
●
●
●
●
●
●
●
●
●
●
●
●
●
●
●
●
●
●
●
●
●
Income inequality issue Refugee rights issue Emission reduction issue
Age
Gender
Relationship
Education
Religion
Occupation
Region
−0.4 −0.2 0.0 0.2 0.4 −0.4 −0.2 0.0 0.2 0.4 −0.4 −0.2 0.0 0.2 0.4
80 years70 years60 years50 years40 years30 years22 years
FemaleMale
MarriedLiving aloneCohabitant
Ph.D.University
High schoolElementary school
IslamChristianityNo religion
Self−employedOil worker
No work experienceIT−consultant
FarmerCare worker
Northern NorwayCentral Norway
Western NorwaySouthern Norway
Eastern NorwayOslo
Change in predicted Pr(Respondent thinks that candidate agrees with issue statement)
Figure C.2: Figure 4 with all social markers included.
●
●
●
●
●
●
●
●
●
●
●
●
●
●
●
●
●
●
●
●
●
●
●
●
●
●
●
●
●
●
●
●
●
●
●
●
●
●
●
●
●
●
●
●
●
●
●
●
●
●
●
●
●
●
●
●
●
●
●
●
●
●
●
●
●
●
●
●
●
●
●
●
●
●
●
●
●
●
●
●
●
●
●
●
●
●
●
●
●
●
●
●
●
Income inequality issue Refugee rights issue Emission reduction issue
Age
Gender
Relationship
Education
Religion
Occupation
Region
−0.4 −0.2 0.0 0.2 0.4 −0.4 −0.2 0.0 0.2 0.4 −0.4 −0.2 0.0 0.2 0.4
80 years70 years60 years50 years40 years30 years22 years
MaleFemale
MarriedLiving aloneCohabitant
UniversityPh.D.
High schoolElementary school
No religionIslam
Christianity
Self−employedOil worker
No work experienceIT−consultant
FarmerCare worker
Western NorwaySouthern Norway
OsloNorthern NorwayEastern NorwayCentral Norway
Difference in marginal effect when candidate is politican (vs person),predicting that candidate agree with issue statementFigure C.3: Difference in change in predicted probability that a respondents thinks a candidate
agrees with the issue statement (as shown in Figure 4) and change in predicted probability thata respondents thinks another person agrees with the issue statement.
24
●
●
●
●
●
●
●
●
●
●
●
●
●
●
●
●
●
●
●
●
●
●
●
●
●
●
●
●
●
●
●
●
●
●
●
●
●
●
●
●
●
●
●
●
●
●
●
●
●
●
●
●
●
●
●
●
●
●
●
●
●
●
●
●
●
●
Income inequalityissue
Refugee rightsissue
Emission reductionissue
Age
Gender
Education
Religion
Region
−0.30 −0.15 0.00 0.15 0.30−0.30 −0.15 0.00 0.15 0.30−0.30 −0.15 0.00 0.15 0.30
80 years70 years60 years50 years40 years30 years22 years
FemaleMale
Ph.D.University
High schoolElementary school
IslamChristianityNo religion
Northern NorwayCentral Norway
Western NorwaySouthern Norway
Eastern NorwayOslo
Change in predicted Pr(Respondent thinks that candidate agrees with issue statement)
Figure C.4: Change in predicted probability that respondent thinks a hypothetical candidateagrees with the issue statement; proportions shown by candidates’ social markers; replication of4 in the main text.
●
●
●
●
●
●
●
●
●
●
●
●
●
●
●
●
●
●
●
●
●
●
●
●
●
●
●
●
●
●
●
●
●
●
●
●
●
●
●
●
●
●
●
●
●
●
●
●
●
●
●
●
●
●
●
●
●
●
●
●
●
●
●
Income inequalityissue
Refugee rightsissue
Emission reductionissue
Age
Gender
Education
Religion
Region
−0.30 −0.15 0.00 0.15 0.30−0.30 −0.15 0.00 0.15 0.30−0.30 −0.15 0.00 0.15 0.30
Aged 76+Aged 66−75Aged 56−65Aged 46−55Aged 36−45Aged 26−35Aged 18−25
FemaleMale
Higher educationHigh School
Elementary school
IslamChristianity
None
Northern NorwayCentral Norway
Western NorwaySouthern Norway
Eastern NorwayOslo
Change in observed Pr(Respondent agrees with issue statement)
Figure C.5: Change in observed probability that a respondents agrees with the issue statement;difference in proportions are shown by respondents’ social markers. Includes all respondents inwave 7 of the NCP (N = 4681).
We find congruent patterns of change with variation in social markers in the predicted probabilitythat a respondent thinks the hypothetical candidate agrees with an issues statement and theobserved proportions of respondents agreeing with that statement. Respondents believe it ismore likely that a candidate agrees with the statements on income inequality as well as refugeesbut disagrees with the statement on emissions if she is a woman, see Figure 4. Correspondingly,as shown in Figure C.5, female respondent are more likely than male respondents to agree thatthe state should reduce income inequality as well as that refugees should have the same socialrights as Norwegian residents, and are less likely to agree than men that most of the carbonemission reductions should be done abroad. Variation in educational achievement also triggerssimilar changes in predicted and observed agreement with the statements on two of the three
25

policy issues. We see rather different patterns of change with variation in age, religion, andregion.
26