Is Changing the Minimum Legal Drinking Age an Effective ...
23
Is Changing the Minimum Legal Drinking Age an Effective Policy Tool? Nicolai Brachowicz Centre for Research in Health and Economics Universitat Pompeu Fabra Judit Vall Castello Department of Economics Universitat de Barcelona & IEB & CRES-UPF Abstract In year 1991 regional governments in Spain started a period of implementation of a law that rose the Minimum Legal Drinking Age from 16 to 18 years old. To evaluate the effects of this change on consumption of legal drugs and its related morbidity outcomes, we construct a regional panel dataset on alcohol consumption and hospital entry registers and compare variation in several measures of prevalence between the treatment group (16-18 years old) and the control group (20-22 years old). Our findings show important differences by gender. Our main result regarding overall drinking prevalence shows a reduction of -21.37% for the subsample that includes males and females altogether. This effect on drinking is mainly driven by a reduction of -44.43% in mixed drinks and/or liquors drinking prevalence corresponding to the subsample of males. No causal effects regarding overall smoking prevalence, hospitalizations due to alcohol overdose or motor vehicle traffic accidents were found. To our knowledge, this is the first paper providing evidence on gender-based differences to policies aimed at reducing alcohol consumption. Our results have important policy implications for countries currently considering changes in the Minimum Legal Drinking Age. Keywords: evaluation of public policies; health economics; minimum legal drinking age; triple differences; drug consumption.
Transcript of Is Changing the Minimum Legal Drinking Age an Effective ...
Is Changing the Minimum Legal Drinking Age an
Effective Policy Tool?
Nicolai Brachowicz Centre for Research in Health and Economics
Universitat Pompeu Fabra
Judit Vall Castello Department of Economics Universitat de Barcelona
& IEB & CRES-UPF Abstract In year 1991 regional governments in Spain started a period of implementation of a law that rose the Minimum Legal Drinking Age from 16 to 18 years old. To evaluate the effects of this change on consumption of legal drugs and its related morbidity outcomes, we construct a regional panel dataset on alcohol consumption and hospital entry registers and compare variation in several measures of prevalence between the treatment group (16-18 years old) and the control group (20-22 years old). Our findings show important differences by gender. Our main result regarding overall drinking prevalence shows a reduction of -21.37% for the subsample that includes males and females altogether. This effect on drinking is mainly driven by a reduction of -44.43% in mixed drinks and/or liquors drinking prevalence corresponding to the subsample of males. No causal effects regarding overall smoking prevalence, hospitalizations due to alcohol overdose or motor vehicle traffic accidents were found. To our knowledge, this is the first paper providing evidence on gender-based differences to policies aimed at reducing alcohol consumption. Our results have important policy implications for countries currently considering changes in the Minimum Legal Drinking Age. Keywords: evaluation of public policies; health economics; minimum legal drinking age; triple differences; drug consumption.

1
1 Introduction
Abuse of alcohol consumption and its undesired and fatal consequences have been studied from
multiple perspectives ranging from direct effects on individuals (Carpenter, 2004a; Mann, Smart, & Govoni,
2003; Rosenberg, Ventura, Maurer, Heuser, & Freedman, 1996; Wagenaar & Toomey, 2002) to negative
externalities exerted on the society as a whole (Carpenter, 2005, 2007; Markowitz, 2000, 2005). According
to the latest figures provided by the Report on Survey on Drugs Use in Secondary Schools in Spain
(Observatorio Español de las Drogas y las Adicciones (OEDT). Ministerio de Sanidad y Servicios Sociales e
Igualdad, 2016), corresponding to survey years 2014/2015, the average age at first use of alcohol
considering weekly consumption, has remained almost invariable since year 1996 at around 15 years old.
Moreover, around 48%, 61%, and 74% of youngsters, aged 14, 15, and 16 respectively, declared to have
consumed alcohol during the last 30 days in years 2014/2015. There is a growing body of evidence pointing
at the limitation of access to alcohol consumption as an effective policy tool for preventing unhealthy habits
and fatal consequences (Carpenter, 2004b; Carpenter & Dobkin, 2011; Dee, 1999; Deza, 2015; Yörük &
Yörük, 2011, 2013). In an effort to reduce the prevalence of alcohol consumption and its undesired
outcomes, regional authorities in Spain decided to restrict the access of teenagers to alcohol by increasing
the Minimum Legal Drinking Age (hereafter, MLDA) from 16 to 18 years old. Figure 1 shows a chronological
description of the implementation of the new MLDA in Spain.
Figure 1: Spain - Implementation of the New Minimum Drinking Age (Time Scope)
Source: Official Bulletins.
Having a uniform MLDA threshold at 18 years old in all seventeen regions took more than two decades,
although most of them implemented the legal modification during the period 1994-2002. Until year 1991
the MLDA in all regions was 16 years old. On April 1991 the Region of Navarra was the first to rise the MLDA
to 18 years old. This was followed progressively by Region of Castilla y León in 1994, and Region of Castilla -
La Mancha in 1995. In year 1997 most of the regions, namely Andalucía, Canarias, Cantabria, Comunitat
Valenciana, Extremadura, and Murcia, updated its corresponding law. Region of País Vasco implemented
the new threshold in 1998, Madrid in year 2000, Region of La Rioja and Region of Aragón in 2001, and the
Region of Catalunya in 2002. Late joiners, namely Galicia, Baleares, and Asturias shifted the threshold in
2011, 2014, and 2015, respectively.1 Table C1, in Appendix C provides detailed regional information and
references to official bulletins.
1 Prohibition included all drink types regardless alcoholic degrees for most of the regions. However, Regions of Castilla y León,
and Comunitat Valenciana kept permitting teenagers aged 16 or older to consume alcoholic drinks up to 18o
alcoholic degrees until
year 2007 and 2002, respectively. In order to provide conservative estimates, we consider year of partial ban, when proceeds, as if
it were the case of a full prohibition.
2
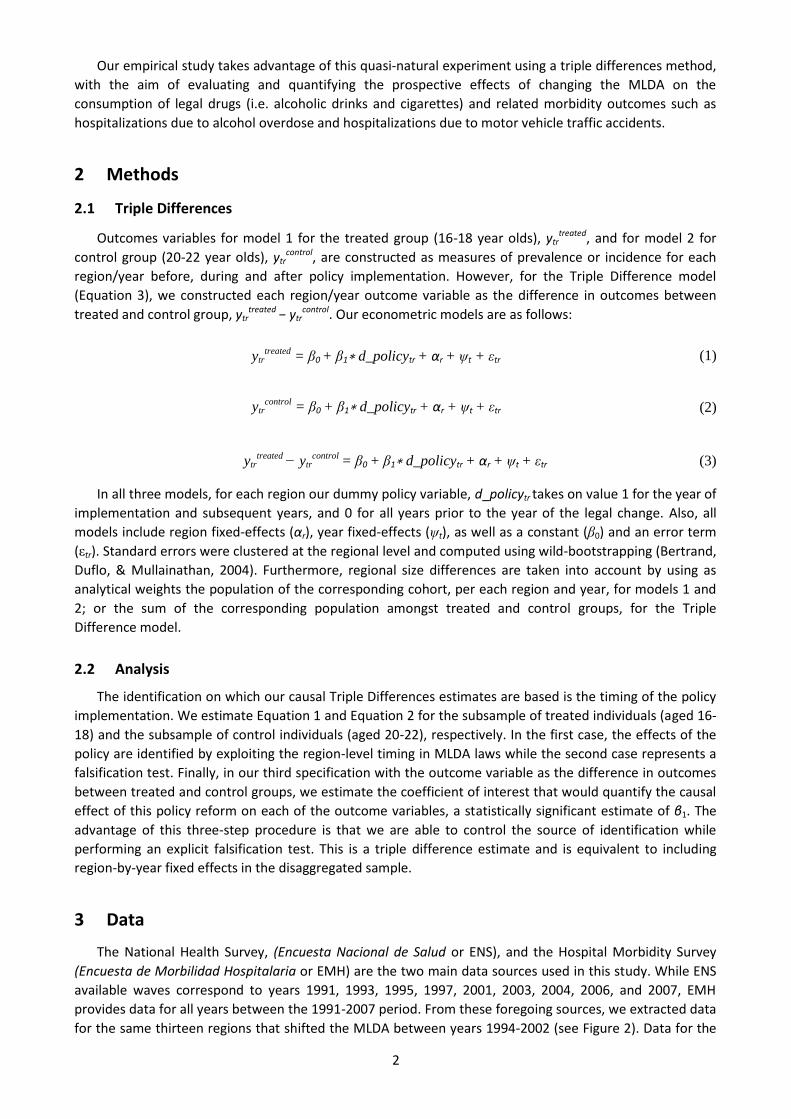
Our empirical study takes advantage of this quasi-natural experiment using a triple differences method,
with the aim of evaluating and quantifying the prospective effects of changing the MLDA on the
consumption of legal drugs (i.e. alcoholic drinks and cigarettes) and related morbidity outcomes such as
hospitalizations due to alcohol overdose and hospitalizations due to motor vehicle traffic accidents.
2 Methods
2.1 Triple Differences
Outcomes variables for model 1 for the treated group (16-18 year olds), ytrtreated, and for model 2 for
control group (20-22 year olds), ytrcontrol, are constructed as measures of prevalence or incidence for each
region/year before, during and after policy implementation. However, for the Triple Difference model
(Equation 3), we constructed each region/year outcome variable as the difference in outcomes between
treated and control group, ytrtreated
− ytrcontrol. Our econometric models are as follows:
ytrtreated
= β0 + β1∗ d_policytr + αr + ψt + εtr (1)
ytrcontrol
= β0 + β1∗ d_policytr + αr + ψt + εtr (2)
ytrtreated
− ytrcontrol
= β0 + β1∗ d_policytr + αr + ψt + εtr (3)
In all three models, for each region our dummy policy variable, d_policytr takes on value 1 for the year of
implementation and subsequent years, and 0 for all years prior to the year of the legal change. Also, all
models include region fixed-effects (αr), year fixed-effects (ψt), as well as a constant (β0) and an error term
(εtr). Standard errors were clustered at the regional level and computed using wild-bootstrapping (Bertrand,
Duflo, & Mullainathan, 2004). Furthermore, regional size differences are taken into account by using as
analytical weights the population of the corresponding cohort, per each region and year, for models 1 and
2; or the sum of the corresponding population amongst treated and control groups, for the Triple
Difference model.
2.2 Analysis
The identification on which our causal Triple Differences estimates are based is the timing of the policy
implementation. We estimate Equation 1 and Equation 2 for the subsample of treated individuals (aged 16-
18) and the subsample of control individuals (aged 20-22), respectively. In the first case, the effects of the
policy are identified by exploiting the region-level timing in MLDA laws while the second case represents a
falsification test. Finally, in our third specification with the outcome variable as the difference in outcomes
between treated and control groups, we estimate the coefficient of interest that would quantify the causal
effect of this policy reform on each of the outcome variables, a statistically significant estimate of β1. The
advantage of this three-step procedure is that we are able to control the source of identification while
performing an explicit falsification test. This is a triple difference estimate and is equivalent to including
region-by-year fixed effects in the disaggregated sample.
3 Data
The National Health Survey, (Encuesta Nacional de Salud or ENS), and the Hospital Morbidity Survey
(Encuesta de Morbilidad Hospitalaria or EMH) are the two main data sources used in this study. While ENS
available waves correspond to years 1991, 1993, 1995, 1997, 2001, 2003, 2004, 2006, and 2007, EMH
provides data for all years between the 1991-2007 period. From these foregoing sources, we extracted data
for the same thirteen regions that shifted the MLDA between years 1994-2002 (see Figure 2). Data for the

3
four remaining regions that shifted the MLDA in years, 1991, 2011, 2014, 2015, were not included due to a
lack of enough pre or post policy survey datasets. Three regional panel datasets were prepared, the first
including males and females altogether, the second considering only males, and the third including just
females. We only considered individuals aged 16-18 or 20-22.
Figure 2: Spain - Implementation of the New Minimum Drinking Legal Age (Regional Scope)
Source: Official Bulletins.
Data regarding regional population was extracted from the Population Statistics Database provided by the
National Statistics Institute (Instituto Nacional de Estadística or INE).2
Regarding ENS, our main outcome variables measure overall drinking prevalence and overall smoking
prevalence. The drinking variable equals 1 if the individual has drunk alcohol during the last 2 weeks and
zero otherwise3. Unfortunately, we cannot measure the incidence of binge drinking as we do not have a
measure of the number of drinks that is consistent throughout the waves included in the analysis. The
smoking variable is 1 if the individual smokes nowadays and zero otherwise.
With regard to EMH datasets, our outcome variables are incidence of hospitalization by main diagnostic
related to alcohol consumption (per 1000 individuals), and incidence of hospitalizations by traffic accidents
(per 1000 individuals)4. It is noteworthy to mention that EMH only includes as observations inpatient
hospital stays cases.
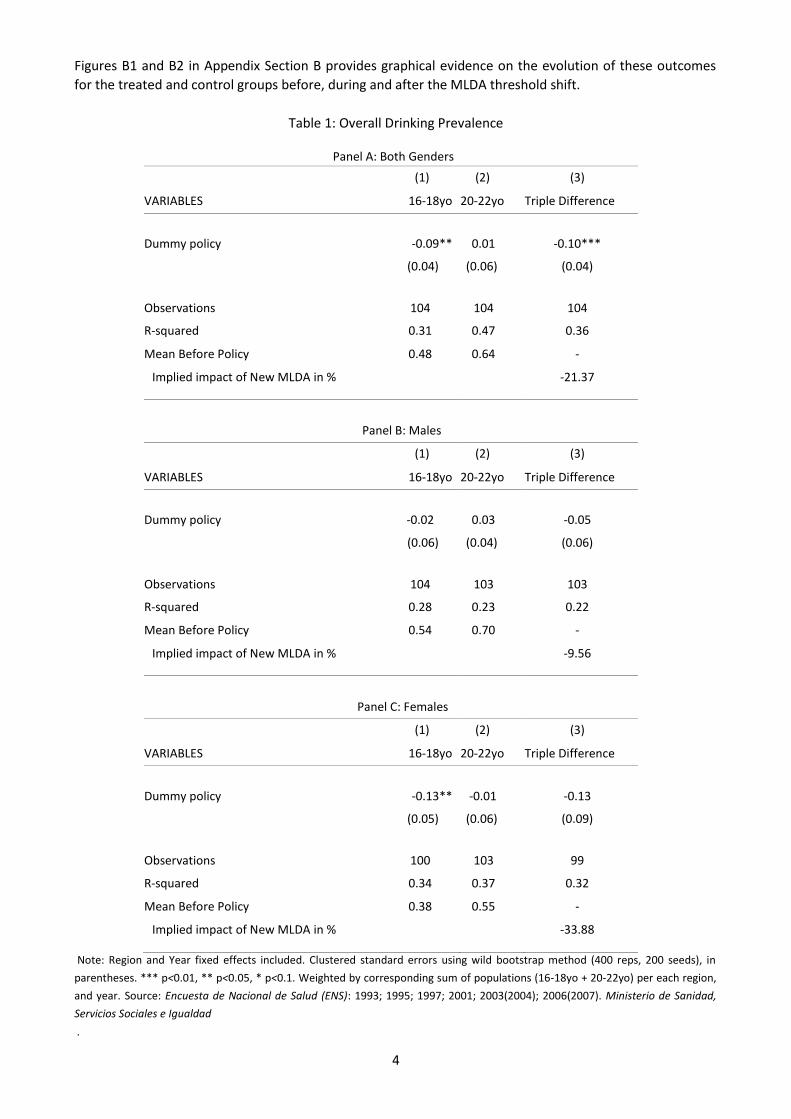
4 Results
4.1 Overall Prevalence
Table 1 shows estimated coefficients for the case of overall drinking prevalence. First column in Panel A
reports a statistically significant reduction corresponding to our first regression model (16-18 year olds) and
null effects for second column corresponding to our falsification test estimated by our second model. For
our third model, third column shows a Triple Difference estimated coefficient of -0.10, statistically
significant at the 1% level, corresponding to a causal effect of -21.37% for the subsample of males and
females altogether.
For the case of overall smoking prevalence, Table A1 in Appendix Section A shows that, although the
impacts for the treated group are negative, none of the estimated coefficients is statistically significant.
2 In Appendix C, Table C1 shows precise implementation dates; Table C2 depicts a summary of descriptive statistics for ENS and
EMH waves; finally, Table C3 lists diseases (diagnoses) considered for the case of morbidity outcomes. 3 For years 2003/2004 the question on overall drinking prevalence asks if the individual has drunk alcohol during the last 12
months instead of during the last 2 weeks. 4 Lack of enough observations for the treated group (16-18 age cohort) prevented us from running analogue analysis for the
case of incidence of hospitalizations by suicides.
4
Figures B1 and B2 in Appendix Section B provides graphical evidence on the evolution of these outcomes
for the treated and control groups before, during and after the MLDA threshold shift.
Table 1: Overall Drinking Prevalence
Panel A: Both Genders
(1) (2) (3)
VARIABLES 16-18yo 20-22yo Triple Difference
Dummy policy -0.09** 0.01 -0.10***
(0.04) (0.06) (0.04)
Observations 104 104 104
R-squared 0.31 0.47 0.36
Mean Before Policy 0.48 0.64 -
Implied impact of New MLDA in % -21.37
Panel B: Males
(1) (2) (3)
VARIABLES 16-18yo 20-22yo Triple Difference
Dummy policy -0.02 0.03 -0.05
(0.06) (0.04) (0.06)
Observations 104 103 103
R-squared 0.28 0.23 0.22
Mean Before Policy 0.54 0.70 -
Implied impact of New MLDA in % -9.56
Panel C: Females
(1) (2) (3)
VARIABLES 16-18yo 20-22yo Triple Difference
Dummy policy -0.13** -0.01 -0.13
(0.05) (0.06) (0.09)
Observations 100 103 99
R-squared 0.34 0.37 0.32
Mean Before Policy 0.38 0.55 -
Implied impact of New MLDA in % -33.88
Note: Region and Year fixed effects included. Clustered standard errors using wild bootstrap method (400 reps, 200 seeds), in
parentheses. *** p<0.01, ** p<0.05, * p<0.1. Weighted by corresponding sum of populations (16-18yo + 20-22yo) per each region,
and year. Source: Encuesta de Nacional de Salud (ENS): 1993; 1995; 1997; 2001; 2003(2004); 2006(2007). Ministerio de Sanidad,
Servicios Sociales e Igualdad
.

5
4.2 Drink type Prevalence
Table 2: Mixed drinks and/or Liquors Drinking Prevalence
Panel A: Both Genders
(1) (2) (3)
VARIABLES 16-18yo 20-22yo Triple Difference
Dummy policy -0.13* 0.00 -0.11
(0.07) (0.08) (0.09)
Observations 90 91 85
R-squared 0.60 0.61 0.25
Mean Before Policy 0.43 0.48 -
Implied impact of New MLDA in % -24.76
Panel B: Males
(1) (2) (3)
VARIABLES 16-18yo 20-22yo Triple Difference
Dummy policy -0.18* 0.06 -0.21**
(0.09) (0.06) (0.09)
Observations 88 85 82
R-squared 0.60 0.71 0.35
Mean Before Policy 0.47 0.53 -
Implied impact of New MLDA in % -44.43
Panel C: Females
(1) (2) (3)
VARIABLES 16-18yo 20-22yo Triple Difference
Dummy policy 0.08 -0.10 0.24
(0.16) (0.09) (0.21)
Observations 78 86 75
R-squared 0.41 0.40 0.42
Mean Before Policy 0.36 0.43 -
Implied impact of New MLDA in % 66.79
Note: Region and Year fixed effects included. Clustered standard errors using wild bootstrap method (400 reps, 200 seeds), in
parentheses. *** p<0.01, ** p<0.05, * p<0.1. Weighted by corresponding sum of populations (16-18yo + 20-22yo) per each region,
and year. Source: Encuesta de Nacional de Salud (ENS): 1993; 1995; 1997; 2001; 2003(2004); 2006(2007). Ministerio de Sanidad,
Servicios Sociales e Igualdad.
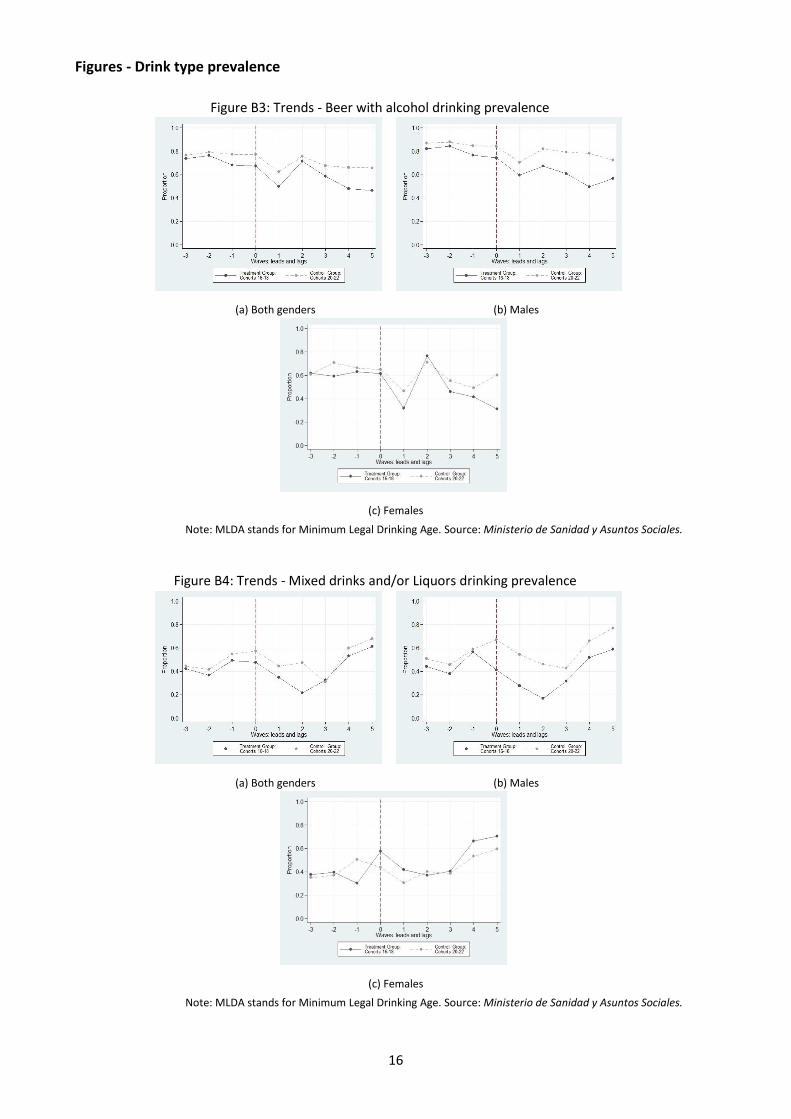
Firstly, Table 2 for the mixed drinks and/or liquors case shows in first column in Panel A and B significant
reductions in the consumption of mixed drinks and liquors as a result of the increase in the MDLA for the
treatment group. Second columns corresponding to our falsification tests show no effect for any control
group. Panels B and C show that this effect is entirely driven by the male subsample with a Triple Difference
estimated coefficient of -0.21, statistically significant at the 5% level, corresponding to a drop in mixed
drinks and/or liquors consumption of 44.43% as a result of the implementation of the policy.
Secondly, for the beer with alcohol case, Table A2 in Appendix Section A, shows no statistically
significant coefficient in any of the panels pointing towards null effects on the probability of drinking beer

6
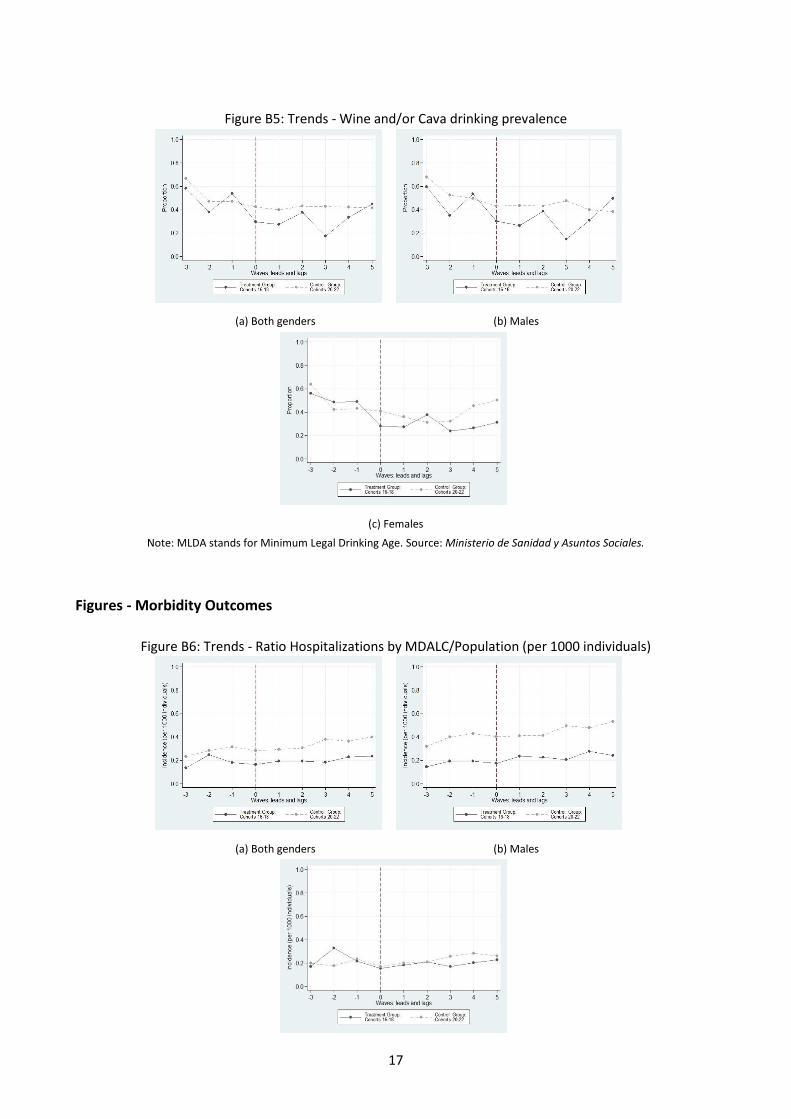
with alcohol due to policy implementation. Thirdly, for the wine and/or cava drinking prevalence case,
although first column of Panels A, B and C in Table A3 included in Appendix Section A, shows significant
reductions in the consumption of these drinks for the three subsamples, and falsification tests for the
subsample of males and the subsamples of females point to null effects for control groups, none of the
Triple Difference estimated coefficients are statistically significant. Figures B3, B4, and B5, in Appendix
Section B, illustrate time trends of the consumption of all drink types studied.
4.3 Morbidity Outcomes
Table 3: Incidence of Hospitalizations by MDALC (per 1000 individuals)
Panel A: Both Genders
(1) (2) (3)
VARIABLES 16-18yo 20-22yo Triple Difference
Dummy policy -0.002 0.059** -0.058**
(0.260) (0.029) (0.029)
Observations 184 191 183
R-squared 0.500 0.494 0.269
Mean Before Policy 0.17 0.31 -
Implied impact of New MLDA in % -34.09
Panel B: Males
(1) (2) (3)
VARIABLES 16-18yo 20-22yo Triple Difference
Dummy policy 0.016 0.098** -0.079*
(0.016) (0.045) (0.043)
Observations 172 187 172
R-squared 0.392 0.438 0.243
Mean Before Policy 0.18 0.43 -
Implied impact of New MLDA in % -44.05
Panel C: Females
(1) (2) (3)
VARIABLES 16-18yo 20-22yo Triple Difference
Dummy policy -0.017 0.018 -0.034
(0.027) (0.021) (0.037)
Observations 170 178 161
R-squared 0.429 0.458 0.136
Mean Before Policy 0.19 0.22 -
Implied impact of New MLDA in % -17.89
Note: MDALC stands for Main diagnostic related to alcohol consumption. Region and Year fixed effects included. Clustered
standard errors using wild bootstrap method (400 reps, 200 seeds), in parentheses. *** p<0.01, ** p<0.05, * p<0.1. Weighted by
corresponding sum of populations (16-18yo + 20-22yo) per each region, and year. Source: Encuesta de Mordilidad Hospitalaria
(EMH): 1993-2007. Ministerio de Sanidad, Servicios Sociales e Igualdad.
7
Firstly, Table 3 shows estimated coefficients for the Incidence of Hospitalization by MDALC (per 1000
individuals) case.
Panel A, on the one hand, shows an insignificant result for the first model corresponding to the treated
group. On the other hand, the second column corresponding to the model regarding the falsification test
shows a positive statistically significant estimated coefficient. Consequently, we cannot interpret the third
column results as evidence of the effect of the policy on our treated group. Similar results can be observed
in Panel B for the subsample of males as the coefficient for the treated group is not significant and the
falsification test is not passed either. Finally, Panel C for the subsample of females shows a negative
coefficient for the treated group suggesting that females reduced the hospitalization incidence as a result of
the implementation of the policy although the coefficient is not significant.
Secondly, regarding the case of incidence of hospitalizations by traffic accidents (per 1000 individuals),
Table A4 in Appendix Section A, shows no statistically significant results for any of our coefficients of
interest shown in third column corresponding to our Triple Difference model. Figures B6 and B7 in Appendix
Section B show the evolution of these morbidity outcomes for years before, during, and after the policy
implementation.
5 Discussion
First of all, we find a causal reduction of 21.37% in overall drinking prevalence for the subsample that
includes males and females. This effect is mainly driven by a reported reduction of 44.43% in mixed drinks
and/or liquors drinking prevalence for the subsample of males. No effects with regard to overall smoking
prevalence were found. These findings point in the same direction as those provided by Carpenter and
Dobkin (2011) and Yörük and Yörük (2011) for drinking related variables, and Carpenter and Dobkin (2009)
regarding null effects on smoking.
Secondly, although we find Triple Difference statistically significant coefficients for hospitalizations due
to alcohol overdose, treated group reported null effects and control groups did not pass the falsification
tests. On these grounds we cannot argue causality. With respect to the reported null effect on traffic
accidents it is noteworthy to bear in mind that in Spain the minimum age for driving is 18.
We argue that the main mechanism of transmission of this policy is closely related to binge drinking in
public spaces, known as “botellón” 5. This practice is quite popular amongst teenagers and young adults,
specially during weekends and holidays with a predominance of consumption of mixed drinks. We suggest
that absence of regulation with respect to drinking on public places for adults during the timespan of this
study6 and budget constraints between these individuals play a key role in consuming alcoholic drinks
outside pubs and clubs where access is strictly restricted for those under 18 and prices per drink are much
higher.
Based on these results, we argue that the enforcement devices accompanying the New MLDA such as
administrative penalties and/or fines on both sides of the market exerted an important effect on
compliance and caused a reduction in alcohol consumption for the target group. These effects can be
considered as a lower bound given the usual limitations of surveys of this sort (i.e. underreporting).
6 Conclusions
Our findings provide evidence to argue that shifting the MLDA from 16 to 18 years old can have
substantial public health benefits. To our knowledge we are the first to provide evidence regarding gender-
based differences related to policies aimed at reducing alcohol consumption. These results suggest that the
inclusion of gender perspectives in the process of policy design can contribute to identify more effective
policy levers. Furthermore, a quite interesting exercise would be to assess the findings of this study to those
that could be obtained from a more focused set of surveys such as the Survey on Alcohol and other Drugs in
5 Also known in some regions as “Hacer litros”, “Botelleo”, or “Comprar un lote”.
6 Nowadays, we can find different kinds of regional regulations for adults drinking in public spaces.

8
Spain (Encuesta sobre alcohol y otras drogas en España, EDADES)7. We believe our results have important
policy implications for countries currently considering changes in the Minimum Legal Drinking Age. If this
reduction had an impact on performance on standardized tests or crime rate, remains as key topics for
future research.
7
Access to these survey-microdata still not granted. See http://www.pnsd.msssi.gob.es/profesionales/
sistemasInformacion/sistemaInformacion/encuestas_EDADES.htm (Last accessed March 27th 2018).
9
References
Bertrand, M., Duflo, E., & Mullainathan, S. (2004). How much should we trust differences-indifferences
estimates? The Quarterly Journal of Economics, 119(1), 249-275. Retrieved from
http://dx.doi.org/10.1162/003355304772839588 doi: 10.1162/003355304772839588
Carpenter, C. (2004a). Heavy alcohol use and youth suicide: evidence from tougher drunk driving laws.
Journal of Policy Analysis and Management, 23(4), 831–842. Retrieved from https://
doi.org/10.1002/pam.20049 doi: 10.1002/pam.20049
Carpenter, C. (2004b). How do zero tolerance drunk driving laws work? Journal of Health Economics,
23(1), 61–83. Retrieved from https://doi.org/10.1016/j.jhealeco.2003.08.005 doi: 10
.1016/j.jhealeco.2003.08.005
Carpenter, C. (2005). Heavy alcohol use and the commission of nuisance crime: Evidence from underage
drunk driving laws. American Economic Review, 95(2), 267-272. Retrieved from
http://www.aeaweb.org/articles?id=10.1257/000282805774670220 doi: 10.1257/
000282805774670220
Carpenter, C. (2007). Heavy alcohol use and crime: evidence from underage drunk-driving laws. The
Journal of Law and Economics, 50(3), 539–557. Retrieved from https://doi.org/10.1086/ 519809 doi:
10.1086/519809
Carpenter, C., & Dobkin, C. (2009). The effect of alcohol consumption on mortality: regression discontinuity
evidence from the minimum drinking age. American Economic Journal: Applied Economics, 1(1), 164–
182.
Carpenter, C., & Dobkin, C. (2011). The minimum legal drinking age and public health. Journal of Economic
Perspectives, 25(2), 133-56. Retrieved from http://www.aeaweb.org/articles?id=
10.1257/jep.25.2.133 doi: 10.1257/jep.25.2.133
Dee, T. S. (1999). State alcohol policies, teen drinking and traffic fatalities. Journal of Public
Economics, 72(2), 289–315. Retrieved from https://doi.org/10.1016/S0047-2727(98)00093 -0 doi:
10.1016/S0047-2727(98)00093-0
Deza, M. (2015). The effects of alcohol on the consumption of hard drugs: regression discontinuity evidence
from the national longitudinal study of youth, 1997. Health economics, 24(4), 419–438.
Retrieved from https://doi.org/10.1002/hec.3027 doi: 10.1002/hec.3027
Mann, R. E., Smart, R. G., & Govoni, R. (2003). The epidemiology of alcoholic liver disease. Alcohol Research
and Health, 27, 209–219.
Markowitz, S. (2000). The price of alcohol, wife abuse, and husband abuse. Southern Economic
Journal, 67(2), 279-303. Retrieved from https://www.jstor.org/stable/1061471 doi: 10
.2307/1061471
Markowitz, S. (2005). Alcohol, drugs and violent crime. International Review of Law and Economics,
25(1), 20-44. Retrieved from https://doi.org/10.1016/j.irle.2005.05.003 doi: 10.1016/
j.irle.2005.05.003
Martín San Juan, C. (2013). Effectiveness of Minimum Drinking Age Laws on Youth Alcohol Consumption.
Spanish Case Study (End of Degree Project). Universidad Carlos III, Madrid - Spain.
Observatorio Español de las Drogas y las Adicciones (OEDT). Ministerio de Sanidad y Servicios Sociales e
Igualdad. (2016). La Encuesta sobre uso de drogas en Enseñanzas Secundarias en España (ESTUDES)
2014/2015. Retrieved from http://www.sepg.pap.minhafp.gob.es/ sitios/sepg/es-
ES/Presupuestos/PresupuestosEjerciciosAnteriores/Paginas/
Ejercicio2016.aspx
Rosenberg, H. M., Ventura, S. J., Maurer, J. D., Heuser, R. L., & Freedman, M. A. (1996). Births and deaths:
United states, 1995. Monthly vital statistics report, 45(3), 2.
Wagenaar, A. C., & Toomey, T. L. (2002). Effects of minimum drinking age laws: review and analyses of the
literature from 1960 to 2000. Journal of Studies on Alcohol, Supplement(s14),
206-225. Retrieved from https://doi.org/10.15288/jsas.2002.s14.206 doi: 10.15288/
jsas.2002.s14.206

10
Yörük, B. K., & Yörük, C. E. (2011). The impact of minimum legal drinking age laws on alcohol consumption,
smoking, and marijuana use: Evidence from a regression discontinuity design using exact date of
birth. Journal of Health Economics, 30(4), 740–752. Retrieved from https://
doi.org/10.1016/j.jhealeco.2011.05.010 doi: 10.1016/j.jhealeco.2011.05.010
Yörük, B. K., & Yörük, C. E. (2013). The impact of minimum legal drinking age laws on alcohol consumption,
smoking, and marijuana use revisited. Journal of Health Economics, 32(2), 477–
479. Retrieved from https://doi.org/10.1016/j.jhealeco.2012.09.007 doi: 10.1016/
j.jhealeco.2012.09.007
11
Appendices [Online]
Appendix A: Auxiliary Results
6.1 Tables - Overall Smoking Prevalence
Table A1: Overall Smoking Prevalence
Panel A: Both Genders
(1) (2) (3)
VARIABLES 16-18yo 20-22yo Triple Difference
Dummy policy -0.05 -0.04 -0.01
(0.05) (0.03) (0.05)
Observations 104 104 104
R-squared 0.40 0.27 0.17
Mean Before Policy 0.35 0.49 -
Implied impact of New MLDA in % -4.05
Panel B: Males
(1) (2) (3)
VARIABLES 16-18yo 20-22yo Triple Difference
Dummy policy -0.04 -0.03 -0.01
(0.04) (0.05) (0.05)
Observations 104 103 103
R-squared 0.35 0.27 0.23
Mean Before Policy 0.35 0.48 -
Implied impact of New MLDA in % -1.96
Panel C: Females
(1) (2) (3)
VARIABLES 16-18yo 20-22yo Triple Difference
Dummy policy -0.06 -0.07 0.01
(0.07) (0.08) (0.11)
Observations 100 103 99
R-squared 0.24 0.20 0.17
Mean Before Policy 0.33 0.50 -
Implied impact of New MLDA in % 3.63
Note: Region and Year fixed effects included. Clustered standard errors using wild bootstrap method (400 reps, 200 seeds), in
parentheses. *** p<0.01, ** p<0.05, * p<0.1. Weighted by corresponding sum of populations (16-18yo + 20-22yo) per each region,
12
and year. Source: Encuesta de Nacional de Salud (ENS): 1993; 1995; 1997; 2001; 2003(2004); 2006(2007). Ministerio de Sanidad,
Servicios Sociales e Igualdad.
Table A2: Beer with alcohol Drinking Prevalence
Panel A: Both Genders
(1) (2) (3)
VARIABLES 16-18yo 20-22yo Triple Difference
Dummy policy 0.03 -0.01 0.05
(0.07) (0.03) (0.08)
Observations 101 103 101
R-squared 0.64 0.47 0.29
Mean Before Policy 0.72 0.77 -
Implied impact of New MLDA in % 7.05
Panel B: Males
(1) (2) (3)
VARIABLES 16-18yo 20-22yo Triple Difference
Dummy policy 0.00 -0.02 0.03
(0.01) (0.07) (0.03)
Observations 101 102 100
R-squared 0.57 0.39 0.29
Mean Before Policy 0.80 0.86 -
Implied impact of New MLDA in % 3.81
Panel C: Females
(1) (2) (3)
VARIABLES 16-18yo 20-22yo Triple Difference
Dummy policy -0.03 -0.09 0.07
(0.14) (0.08) (0.15)
Observations 90 100 89
R-squared 0.45 0.37 0.25
Mean Before Policy 0.61 0.67 -
Implied impact of New MLDA in % 10.88
Note: Region and Year fixed effects included. Clustered standard errors using wild bootstrap method (400 reps, 200 seeds), in
parentheses. *** p<0.01, ** p<0.05, * p<0.1. Weighted by corresponding sum of populations (16-18yo + 20-22yo) per each region,
and year. Source: Encuesta de Nacional de Salud (ENS): 1993; 1995; 1997; 2001; 2003(2004); 2006(2007). Ministerio de Sanidad,
Servicios Sociales e Igualdad.

13
Table A3: Wine and/or Cava Drinking Prevalence
Panel A: Both Genders
(1) (2) (3)
VARIABLES 16-18yo 20-22yo Triple Difference
Dummy policy -0.17*** -0.12* -0.05
(0.06) (0.06) (0.07)
Observations 97 101 96
R-squared 0.56 0.42 0.40
Mean Before Policy 0.49 0.51 -
Implied impact of New MLDA in % -10.55
Panel B: Males
(1) (2) (3)
VARIABLES 16-18yo 20-22yo Triple Difference
Dummy policy -0.15*** -0.10 -0.07
(0.05) (0.09) (0.09)
Observations 96 98 93
R-squared 0.52 0.44 0.28
Mean Before Policy 0.48 0.55 -
Implied impact of New MLDA in % -14.23
Panel C: Females
(1) (2) (3)
VARIABLES 16-18yo 20-22yo Triple Difference
Dummy policy -0.17** -0.13 -0.06
(0.08) (0.12) (0.15)
Observations 89 97 86
R-squared 0.53 0.39 0.30
Mean Before Policy 0.51 0.47 -
Implied impact of New MLDA in % -11.75
Note: Region and Year fixed effects included. Clustered standard errors using wild bootstrap method (400 reps, 200 seeds), in
parentheses. *** p<0.01, ** p<0.05, * p<0.1. Weighted by corresponding sum of populations (16-18yo + 20-22yo) per each region,
and year. Source: Encuesta de Nacional de Salud (ENS): 1993; 1995; 1997; 2001; 2003(2004); 2006(2007). Ministerio de Sanidad,
Servicios Sociales e Igualdad.

14
6.2 Tables - Other Morbidity Outcomes
Table A4: Incidence of Hospitalizations by Traffic Accidents (per 1000 individuals)
Panel A: Both Genders
(1) (2) (3)
VARIABLES 16-18yo 20-22yo Triple Difference
Dummy policy 0.032 0.081** -0.062
(0.030) (0.036) (0.047)
Observations 158 160 154
R-squared 0.786 0.872 0.488
Mean Before Policy 0.35 0.32 -
Implied impact of New MLDA in % -17.81
Panel B: Males
(1) (2) (3)
VARIABLES 16-18yo 20-22yo Triple Difference
Dummy policy 0.007 0.122** -0.116
(0.054) (0.052) (0.098)
Observations 156 156 152
R-squared 0.844 0.853 0.513
Mean Before Policy 0.58 0.52 -
Implied impact of New MLDA in % -19.97
Panel C: Females
(1) (2) (3)
VARIABLES 16-18yo 20-22yo Triple Difference
Dummy policy 0.039 0.041 -0.014
(0.026) (0.027) (0.034)
Observations 137 140 128
R-squared 0.701 0.717 0.313
Mean Before Policy 0.13 0.14 -
Implied impact of New MLDA in % -10.97
Note: MDALC stands for Main diagnostic related to alcohol consumption. Region and Year fixed effects included. Clustered
standard errors using wild bootstrap method (400 reps, 200 seeds), in parentheses. *** p<0.01, ** p<0.05, * p<0.1. Weighted by
corresponding sum of populations (16-18yo + 20-22yo) per each region, and year. Source: Encuesta de Mordilidad Hospitalaria
(EMH): 1993-2007. Ministerio de Sanidad, Servicios Sociales e Igualdad.

15
Appendix B: Auxiliary Figures
Figures - Overall prevalence
Figure B1: Trends - Overall drinking prevalence
(a) Both genders (b) Males
(c) Females
Note: MLDA stands for Minimum Legal Drinking Age. Source: Ministerio de Sanidad y Asuntos Sociales.
Figure B2: Trends - Overall smoking prevalence
(a) Both genders (b) Males
(c) Females
Note: MLDA stands for Minimum Legal Drinking Age. Source: Ministerio de Sanidad y Asuntos Sociales.
16
Figures - Drink type prevalence
Figure B3: Trends - Beer with alcohol drinking prevalence
(a) Both genders (b) Males
(c) Females
Note: MLDA stands for Minimum Legal Drinking Age. Source: Ministerio de Sanidad y Asuntos Sociales.
Figure B4: Trends - Mixed drinks and/or Liquors drinking prevalence
(a) Both genders (b) Males
(c) Females
Note: MLDA stands for Minimum Legal Drinking Age. Source: Ministerio de Sanidad y Asuntos Sociales.
17
Figure B5: Trends - Wine and/or Cava drinking prevalence
(a) Both genders (b) Males
(c) Females
Note: MLDA stands for Minimum Legal Drinking Age. Source: Ministerio de Sanidad y Asuntos Sociales.
Figures - Morbidity Outcomes
Figure B6: Trends - Ratio Hospitalizations by MDALC/Population (per 1000 individuals)
(a) Both genders (b) Males

18
(c) Females
Note: MDALC stands for Mean diagnostic related to alcohol consumption. Source: Ministerio de Sanidad y Asuntos Sociales.
Figure B7: Trends - Ratio Hospitalizations by Traffic Accidents/Population (per 1000 individuals)
(a) Both genders (b) Males
(c) Females
Note: MDALC stands for Mean diagnostic related to alcohol consumption. Source: Ministerio de Sanidad y Asuntos Sociales.
19
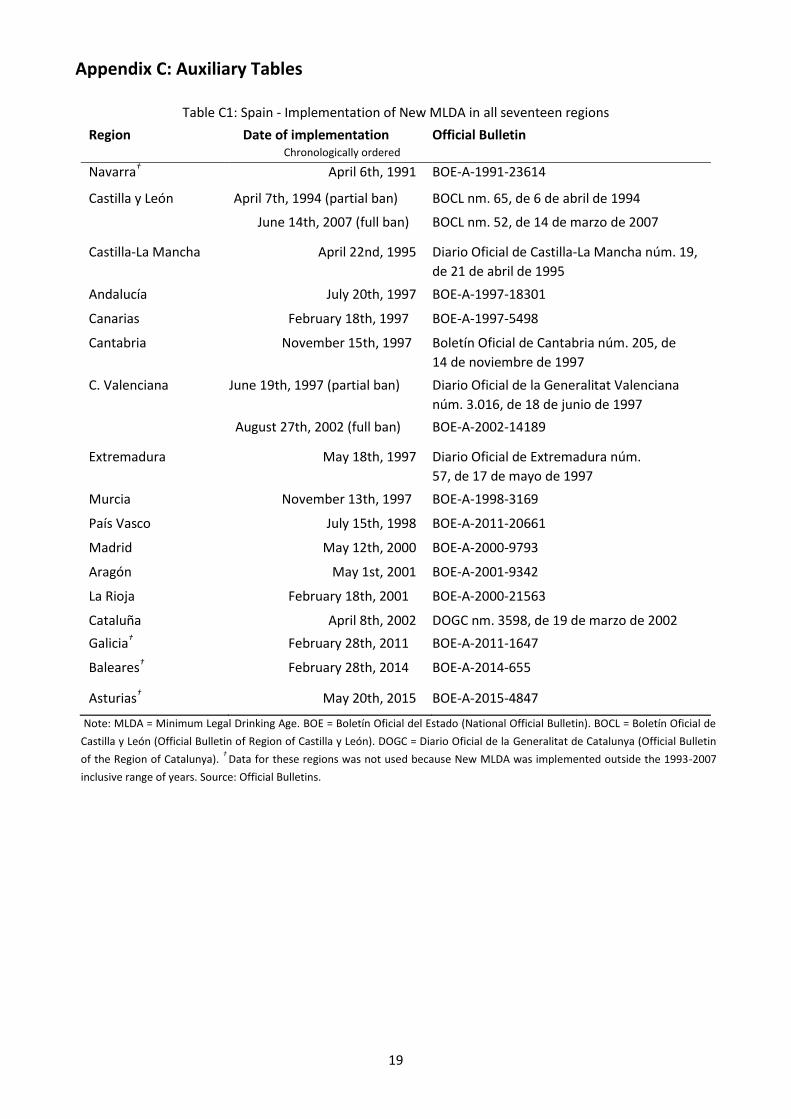
Appendix C: Auxiliary Tables
Table C1: Spain - Implementation of New MLDA in all seventeen regions
Region Date of implementation Chronologically ordered
Official Bulletin
Navarra† April 6th, 1991 BOE-A-1991-23614
Castilla y León April 7th, 1994 (partial ban) BOCL nm. 65, de 6 de abril de 1994
June 14th, 2007 (full ban) BOCL nm. 52, de 14 de marzo de 2007
Castilla-La Mancha April 22nd, 1995 Diario Oficial de Castilla-La Mancha núm. 19,
de 21 de abril de 1995
Andalucía July 20th, 1997 BOE-A-1997-18301
Canarias February 18th, 1997 BOE-A-1997-5498
Cantabria November 15th, 1997 Boletín Oficial de Cantabria núm. 205, de
14 de noviembre de 1997
C. Valenciana June 19th, 1997 (partial ban) Diario Oficial de la Generalitat Valenciana
núm. 3.016, de 18 de junio de 1997
August 27th, 2002 (full ban) BOE-A-2002-14189
Extremadura May 18th, 1997 Diario Oficial de Extremadura núm.
57, de 17 de mayo de 1997
Murcia November 13th, 1997 BOE-A-1998-3169
País Vasco July 15th, 1998 BOE-A-2011-20661
Madrid May 12th, 2000 BOE-A-2000-9793
Aragón May 1st, 2001 BOE-A-2001-9342
La Rioja February 18th, 2001 BOE-A-2000-21563
Cataluña April 8th, 2002 DOGC nm. 3598, de 19 de marzo de 2002
Galicia† February 28th, 2011 BOE-A-2011-1647
Baleares† February 28th, 2014 BOE-A-2014-655
Asturias† May 20th, 2015 BOE-A-2015-4847
Note: MLDA = Minimum Legal Drinking Age. BOE = Boletín Oficial del Estado (National Official Bulletin). BOCL = Boletín Oficial de
Castilla y León (Official Bulletin of Region of Castilla y León). DOGC = Diario Oficial de la Generalitat de Catalunya (Official Bulletin
of the Region of Catalunya). †
Data for these regions was not used because New MLDA was implemented outside the 1993-2007
inclusive range of years. Source: Official Bulletins.

20
Table C2: National Health Survey and Hospital Morbidity Survey Summary of
Descriptive Statistics
Panel A: National Health Survey (ENS) - Prevalence
(8) waves included
count mean min max
Dummy gender: 0=Females; 1= Males 104 0.52 0 1
Have you drunk during the last 2 weeks? 104 0.54 0 1
Do you smoke nowadays? 104 0.36 0 1
Do you drink beer with alcohol? 103 0.67 0 1
Do you drink mixed drinks and/or liquors? 96 0.48 0 1
Do you drink wine and/or cava? 102 0.41 0 1
Panel B: Hospital Morbidity Survey (EMH) - Incidence (per 1000 hab.)
(15) waves included
count mean min max
Hospitalizations due to MDALC 192 0.26 0.02 0.83
Hospitalizations due to Traffic Accidents 164 0.50 0.00 1.40
Note: 13 out 17 regions were included. Excluded (4) regions did not have enough data for waves before or
after policy implementation. Treated and control group included cohorts 16-18 years old and cohorts 20-
22 years old, respectively. Unit of observation at the regional-year level. Panel A: Encuesta Nacional de
Salud (ENS): Waves 1993, 1995, 1997 and 2001 were prepared by the Centre of Sociological Research.
Waves 2003(2004) and 2006(2007) were prepared by the National Institute of Statistics (INE). Panel B:
Encuesta de Morbilidad Hospitalaria (EMH): all waves 1993-2007 were prepared by the National Institute
of Statistics (INE). MDALC stands for Mean Diagnostic Related to Alcohol Overdose.
21
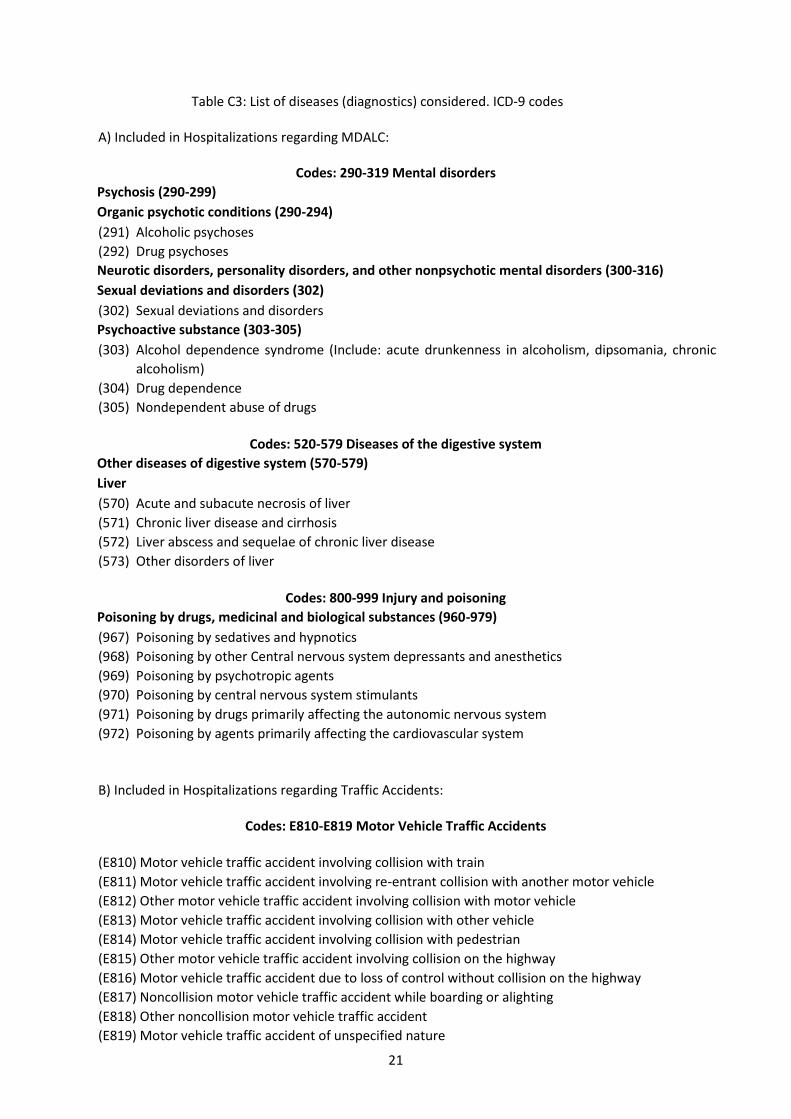
Table C3: List of diseases (diagnostics) considered. ICD-9 codes
A) Included in Hospitalizations regarding MDALC:
Codes: 290-319 Mental disorders
Psychosis (290-299)
Organic psychotic conditions (290-294)
(291) Alcoholic psychoses
(292) Drug psychoses
Neurotic disorders, personality disorders, and other nonpsychotic mental disorders (300-316)
Sexual deviations and disorders (302)
(302) Sexual deviations and disorders
Psychoactive substance (303-305)
(303) Alcohol dependence syndrome (Include: acute drunkenness in alcoholism, dipsomania, chronic
alcoholism)
(304) Drug dependence
(305) Nondependent abuse of drugs
Codes: 520-579 Diseases of the digestive system
Other diseases of digestive system (570-579)
Liver
(570) Acute and subacute necrosis of liver
(571) Chronic liver disease and cirrhosis
(572) Liver abscess and sequelae of chronic liver disease
(573) Other disorders of liver
Codes: 800-999 Injury and poisoning
Poisoning by drugs, medicinal and biological substances (960-979)
(967) Poisoning by sedatives and hypnotics
(968) Poisoning by other Central nervous system depressants and anesthetics
(969) Poisoning by psychotropic agents
(970) Poisoning by central nervous system stimulants
(971) Poisoning by drugs primarily affecting the autonomic nervous system
(972) Poisoning by agents primarily affecting the cardiovascular system
B) Included in Hospitalizations regarding Traffic Accidents:
Codes: E810-E819 Motor Vehicle Traffic Accidents
(E810) Motor vehicle traffic accident involving collision with train
(E811) Motor vehicle traffic accident involving re-entrant collision with another motor vehicle
(E812) Other motor vehicle traffic accident involving collision with motor vehicle
(E813) Motor vehicle traffic accident involving collision with other vehicle
(E814) Motor vehicle traffic accident involving collision with pedestrian
(E815) Other motor vehicle traffic accident involving collision on the highway
(E816) Motor vehicle traffic accident due to loss of control without collision on the highway
(E817) Noncollision motor vehicle traffic accident while boarding or alighting
(E818) Other noncollision motor vehicle traffic accident
(E819) Motor vehicle traffic accident of unspecified nature

22
Note: ICD-9 = International Statistical Classification of Diseases and Related Health Problems - 9th Revision. Source: Ministerio
de Sanidad, Servicios Sociales e Igualdad.