Is Broad Industrialisation Imperative for Development ...
99
Berlin Working Papers on Money, Finance, Trade and Development Incooperationwith Working Paper No. 05/2011 Is Broad Industrialisation Imperative for Development? Case Studies on Uganda and Tanzania Eva Näfe Barbara von Toll August 2011
Transcript of Is Broad Industrialisation Imperative for Development ...

Berlin Working Papers on Money, Finance, Trade and Development��
������In�cooperation�with�
�
�
�
�
�
�
�
�
Working Paper No. 05/2011
Is Broad Industrialisation Imperative for Development? Case Studies on Uganda and Tanzania
Eva Näfe
Barbara von Toll
August 2011

Is Broad Industrialisation Imperative for Development? Case Studies on Uganda and Tanzania
Eva Näfe Barbara von Toll
Hochschule für Technik und Wirtschaft Berlin (HTW) – University of Applied Sciences
Berlin, August 2011

Abstract
On the basis of two case studies viz. Uganda and Tanzania, this paper examines possible paths to development. The traditional one, here called ‘broad’ industrialisation, is contrasted with agricultural-based industrialisation and service sector development as possible alternative routes for countries to improve their situation. It is argued that traditional industrialisation is not an exclusive path towards development; rather there are other options such as industrialisation based on agriculture or service sector development.
For Uganda the importance of all the three sectors has been recognised. However, it is suggested that a focus on agricultural and service sector development could be more promising for the near future as there are fewer obstacles that need to be overcome. Furthermore, prioritisation of subsectors could even lead to more effective results. Within the agricultural sector it is of critical importance to develop the value-adding activities in order to increase the quality of life eventually. In the case of Tanzania, it is not so clear whether broad industrialisation or services are the key. But clearly a diversification of the economy needs to take place. Compared to Uganda, Tanzania has a clear advantage of being situated at the sea shore. Very little focus has been put on policies supporting the service sector. But, growth rates of traditional agricultural exports in Tanzania are low. Thus, there is the need to diversify into service sector exports and non-traditional value-adding activities in order to pursue a path of development.
Key words: Uganda, Tanzania, Development-paths, Agri-business, Industry, Service
Dedication
Thanks to the funding by the German Academic Exchange Service (DAAD), we had been able to visit Uganda and Tanzania to get first hand information as well as conduct valuable interviews.
In Uganda, we would like to thank Prof. Dr. Geoffrey Bakunda as well as professors and academic staffs of the Makerere University Business School and the Makerere University for supporting our research work and helping us out with contacts and interviews. We share our special thanks to Mary Immaculate Mbabazi and Patrick Onen Ezaga who enriched our stay substantially.
In Tanzania, we would like to thank Haji Semboja and the professors and academic staffs of the University of Dar es Salaam for providing us with valuable information and welcoming us in lectures. We would also like to thank Caesar Oweitu and our colleagues as well as house mates of the Mabibo Hostel for welcoming us so nicely into their midst.
Furthermore, we would like to thank Prof. Jan Priewe (HTW Berlin, Germany) and other staffs in HTW who supported us patiently in finalising this paper.
Biographical Note
Eva Näfe holds a dual undergraduate degree, which includes a BA of International Business (Hons) and a degree Diplom-Kauffrau, and a Master of Arts in International and Development Economics. Her studies were completed in Berlin, Germany, and Cambridge, UK. She obtained practical experience in Ecuador, Ireland and Nigeria in the private sector companies, non-profit and federally-owned organisations. Currently, she works for a GIZ-programme for sustainable economic development in Nigeria.
Barbara v. Toll has a Bachelor of Science in International Business and a Master of Arts in International and Development Economics. She has studied in Hamburg, Germany, and Maastricht, Netherlands, as well as in Quito, Ecuador, and Berlin, Germany. Her working experience stretches from the private sector to federally owned enterprises like the GIZ (former GTZ). Currently, she is employed at the German Investment and Development Company (DEG) in Cologne.
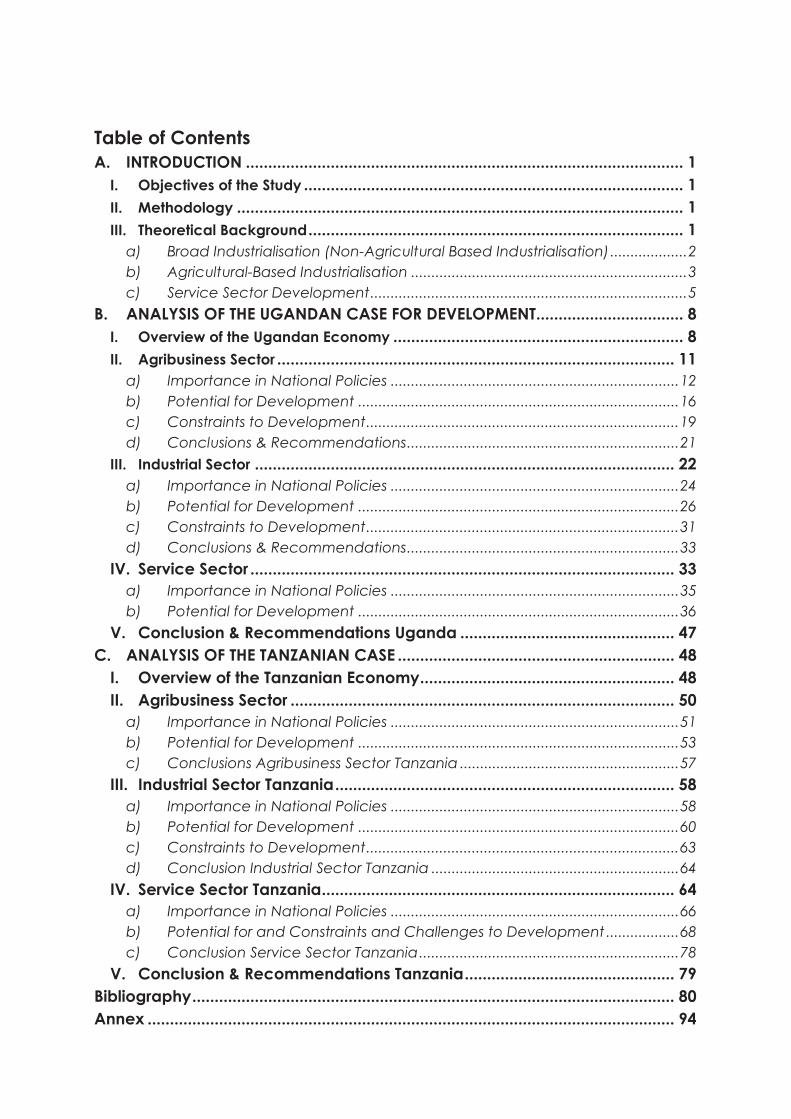
Table of Contents A. INTRODUCTION .................................................................................................. 1
I. Objectives of the Study ..................................................................................... 1 II. Methodology .................................................................................................... 1 III. Theoretical Background .................................................................................... 1
a) Broad Industrialisation (Non-Agricultural Based Industrialisation) ................... 2 b) Agricultural-Based Industrialisation .................................................................... 3 c) Service Sector Development .............................................................................. 5
B. ANALYSIS OF THE UGANDAN CASE FOR DEVELOPMENT ................................. 8 I. Overview of the Ugandan Economy ................................................................. 8 II. Agribusiness Sector ......................................................................................... 11
a) Importance in National Policies ....................................................................... 12 b) Potential for Development ............................................................................... 16 c) Constraints to Development ............................................................................. 19 d) Conclusions & Recommendations ................................................................... 21
III. Industrial Sector .............................................................................................. 22 a) Importance in National Policies ....................................................................... 24 b) Potential for Development ............................................................................... 26 c) Constraints to Development ............................................................................. 31 d) Conclusions & Recommendations ................................................................... 33
IV. Service Sector ............................................................................................... 33 a) Importance in National Policies ....................................................................... 35 b) Potential for Development ............................................................................... 36
V. Conclusion & Recommendations Uganda ................................................ 47 C. ANALYSIS OF THE TANZANIAN CASE .............................................................. 48
I. Overview of the Tanzanian Economy ......................................................... 48 II. Agribusiness Sector ...................................................................................... 50
a) Importance in National Policies ....................................................................... 51 b) Potential for Development ............................................................................... 53 c) Conclusions Agribusiness Sector Tanzania ...................................................... 57
III. Industrial Sector Tanzania ............................................................................ 58 a) Importance in National Policies ....................................................................... 58 b) Potential for Development ............................................................................... 60 c) Constraints to Development ............................................................................. 63 d) Conclusion Industrial Sector Tanzania ............................................................. 64
IV. Service Sector Tanzania ............................................................................... 64 a) Importance in National Policies ....................................................................... 66 b) Potential for and Constraints and Challenges to Development .................. 68 c) Conclusion Service Sector Tanzania ................................................................ 78
V. Conclusion & Recommendations Tanzania ............................................... 79 Bibliography ............................................................................................................ 80 Annex ...................................................................................................................... 94
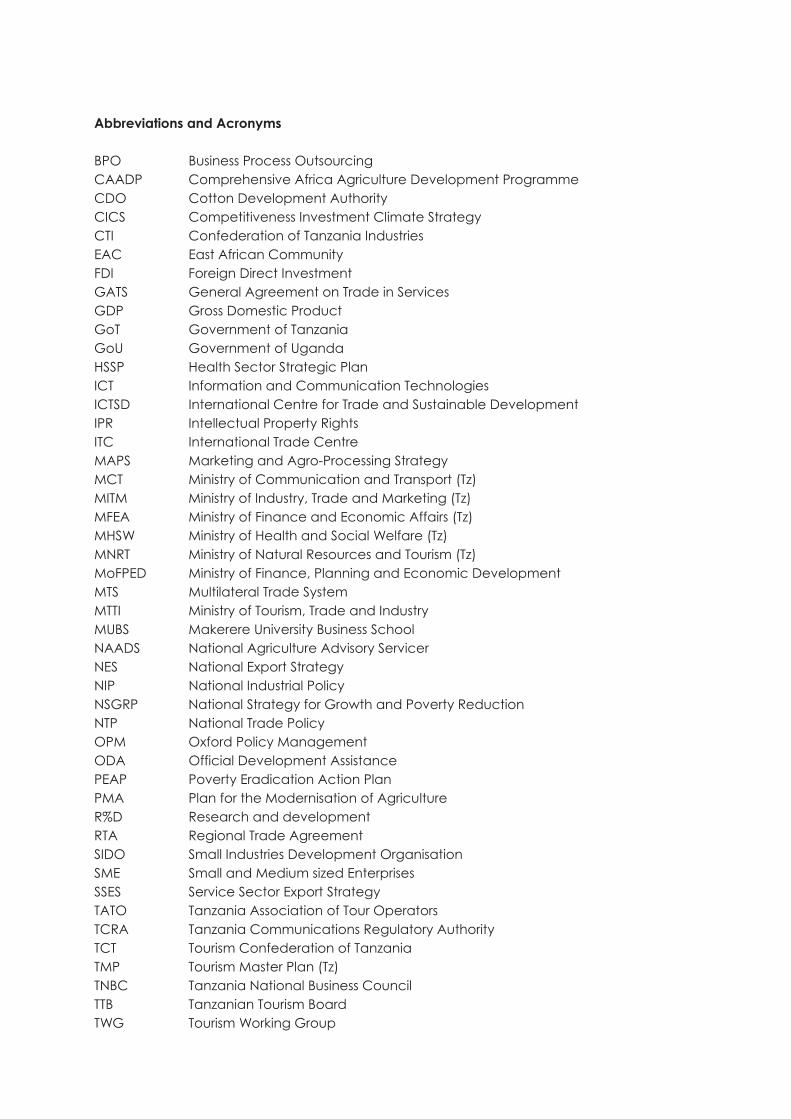
Abbreviations and Acronyms BPO Business Process Outsourcing CAADP Comprehensive Africa Agriculture Development Programme CDO Cotton Development Authority CICS Competitiveness Investment Climate Strategy CTI Confederation of Tanzania Industries EAC East African Community FDI Foreign Direct Investment GATS General Agreement on Trade in Services GDP Gross Domestic Product GoT Government of Tanzania GoU Government of Uganda HSSP Health Sector Strategic Plan ICT Information and Communication Technologies ICTSD International Centre for Trade and Sustainable Development IPR Intellectual Property Rights ITC International Trade Centre MAPS Marketing and Agro-Processing Strategy MCT Ministry of Communication and Transport (Tz) MITM Ministry of Industry, Trade and Marketing (Tz) MFEA Ministry of Finance and Economic Affairs (Tz) MHSW Ministry of Health and Social Welfare (Tz) MNRT Ministry of Natural Resources and Tourism (Tz) MoFPED Ministry of Finance, Planning and Economic Development MTS Multilateral Trade System MTTI Ministry of Tourism, Trade and Industry MUBS Makerere University Business School NAADS National Agriculture Advisory Servicer NES National Export Strategy NIP National Industrial Policy NSGRP National Strategy for Growth and Poverty Reduction NTP National Trade Policy OPM Oxford Policy Management ODA Official Development Assistance PEAP Poverty Eradication Action Plan PMA Plan for the Modernisation of Agriculture R%D Research and development RTA Regional Trade Agreement SIDO Small Industries Development Organisation SME Small and Medium sized Enterprises SSES Service Sector Export Strategy TATO Tanzania Association of Tour Operators TCRA Tanzania Communications Regulatory Authority TCT Tourism Confederation of Tanzania TMP Tourism Master Plan (Tz) TNBC Tanzania National Business Council TTB Tanzanian Tourism Board TWG Tourism Working Group

UBOS Uganda Bureau of Statistics UCC Uganda Communications Commission UCDA Uganda Coffee Development Authority UDSM University of Dar es Salaam UEPB Uganda Export Promotion Board UNBS Uganda National Bureau of Standards UNIDO United Nations Industrial Development Organisation UTDA Uganda Tea Development Authority WB World Bank WTO World Trade Organisation WTTC World Travel and Tourism Council

1
A. INTRODUCTION
I. Objectives of the Study This paper examines, on the basis of case studies for Uganda and Tanzania, whether the only path to development is the traditional, here named as “broad” industrialisation, or if there are other, more promising or even necessary options – relating to agricultural-based industrialisation and service sector development - which one is more appropriate for these countries to follow. The authors argue that traditional industrialisation is not the only or exclusive path towards development. If certain criteria, like reliable infrastructure, available technology, etc, are not met, other paths have to be promoted. The study attempts to answer the following specific questions for the cases of Uganda and Tanzania:
� What is the current situation of the agribusiness, the industrial and the service sector? � What importance is given to each sector in national policies? � What is the potential of each sector for the development of Uganda and Tanzania? � What are the constraints to development in each sector?
II. Methodology Secondary sources including books, journal articles, magazines and presentations have been used to enter the theoretical discussions around the 3 sectors – agribusiness, industry and services – and their importance to development. Furthermore field research has been conducted in both countries which included reviewing a large number of data obtained from the public and the private sector and following up and questioning this information in interviews with representatives of the respective sectors.
III. Theoretical Background In the theories on economic development, industrialisation has always been featured as an integral and fundamental part. Many economists and institutions still consider it to be a precondition for increasing GDP per capita and the livelihood of the people. In its latest Industrialisation Report, the United Nations Industrial Development Organisation (UNIDO) stated: “Industrialisation is integral to economic development; scarcely any country has developed without industrialising” (UNIDO 2009, p.4). A significant argument in this line of reasoning is the structural change which includes the shift of capital and labour from low-productivity to high productivity sectors (UNIDO 2009). In relation to public policy, this means that changes in economic structure lead to development and therefore some policies should be directed at accelerating structural change, which is the approach of new structuralism. Nevertheless, there are authors who are challenging the traditional view of economic development, and doubting that this is also the path for some countries which are still developing. Even UNIDO admits, that the pace of development of China and India offers major challenges to other developing country producers (UNIDO 2009). Although it is stated
2
that an increasing trade in tasks, due to fragmentation and internationalisation of the production process, can show potential for developing countries, there is the challenge of entering and establishing themselves in the existing networks and value chains and avoid getting trapped in low sophistication assembly activities. As UNIDO points out the most difficult part is “…getting on the bottom rung of the global industrial ladder[…], there may be little room for new entrants into global manufacturing because East Asia is firmly established and able to reap economies of scale arising from its clusters while still having low wages.” (UNIDO 2009, p. 62). Szirmai (2009) examines the argument that economies of scale are less available in agriculture and services compared to manufacturing. He found that this is no longer true due to the rise of new Information and Communication Technologies (ICT). Furthermore, he points out, that although manufacturing continues to be significant when it comes to embodied and disembodied technological progress, overall technological progress in service sectors continues to accelerate. He concludes that although the recent literature confirms the fundamental role of manufacturing for economic development, this role has been weakening over the time. On the other hand, the role of services has become increasingly important in advanced economies. In its latest industrialisation report, UNIDO (2009) states that globally efficient geographical distribution of manufacturing is likely to be concentrated in a few places, and these places are chosen according to 3 aspects: transport costs, labour costs and agglomeration of economies. Especially the last factor proves to be difficult for developing countries. The report also shows that, it is difficult to establish new manufacturing locations. On the contrary, if new locations are developed successfully, there can be an explosive growth. In the following paragraphs, the theoretical background of the different paths towards development viz. broad industrialisation, agricultural-based industrialisation and service sector development, have been discussed.
a) Broad Industrialisation (Non-Agricultural Based Industrialisation) One important theory highlighting the significance of industrialisation for development is the structural approach largely based on Kaldor (1966, 67, 68 cited in Dasgupta 2005). In his theory the classical division into agriculture, industry and services is the central factor to explain the growth process. The dynamic interaction between the sectors, each with its distinct characteristics, determines how and how fast a country’s economy would grow. According to Kaldor, there is a shift of labour force from the agricultural sector to the industrial sector. Due to his assumption that there is no efficient resource utilisation, he envisages disguised unemployment in agriculture, which means that this shift leads to simultaneous productivity increases in both sectors. The productivity increase in the industrial sector is brought about by Verdoorn’s law which states that growth of output leads to growth of productivity due to static and dynamic economies of scale (learning by doing) (Dasgupta 2005). Hambrock and Hauptmann (1999) argue for industrialisation as the path to development, because, according to them, international experience has shown that industrial expansion is closely associated with development. Furthermore, they state that a well established

3
industrial sector provides certain spillover effects benefiting other economic activities, which include the enhancement of skills, training of managers and dispersion of technology. Sometimes the question has come up whether or not industrialisation is development-friendly? UNIDO (2009) argues that manufactured exports are often labour-intensive and therefore potentially equalising as low-skilled workers have the opportunity to raise their income. In comparison to resource extraction, it generates more wage employment, while nationalised resource extraction provides larger potential to fund public services (p.6). Nevertheless, it is commonly accepted that the world cannot afford to continue its industrialisation path in the manner it has due to environmental problems it is causing. This does not mean that the trend should be reversed either. UNIDO argues that climate change might even make it more essential to industrialise in order to deal with environmental issues. However the pattern of industrialisation is very important. Potentially industrial development can make a major contribution to the adaptation to climate change. However, incentives need to promote change in industrial composition and technology (UNIDO 2009, p.8). Sheehan (2008), in contrast, argues that it is increasingly difficult for developing countries to achieve significant growth through industrialisation. There are a number of personal, social and environmental costs associated with industrialisation. At the same time, especially the overall impact on human welfare should be carefully considered. One example is China; although being economically successful, it faces immense costs for its current pattern of industrialisation. They include heavy energy use of fossil fuels which adds to the pollution problem, uncontrolled fixed asset investments, limited benefits going to many in the population and therefore growing inequality, limited improvements in living conditions in rural areas and many more. Another serious problem faced by the country is its macroeconomic vulnerability. As growth is driven by exports and FDI, there is a high exposure and therefore vulnerability to trends in the global market. Sheehan (2008) also points out, that there are several constraints to the industrialisation of developing countries. He mentions the intensified competition in world manufacturing trade arising from rapid growth in exports from China and Eastern Europe, which increases pressure on exports coming from other developing countries. Additionally, the fragmentation and increasing technological requirements in manufacturing pose increasing challenges for new entrants of gaining access to the networks that control a rising share of world manufacturing trade. Thus, developing countries, facing too many constraints following this “traditional” path to development, might be more successful by focusing on strategies apart from broad industrialisation, which could be either the promotion of agricultural-based industrialisation or a focus on service sector development. Those other options are discussed in the following two paragraphs.
b) Agricultural-Based Industrialisation When it comes to the theory of economic development, agricultural-based industrialisation is a vertical diversification strategy which means processing of primary goods. For a long time this has been considered the first step towards industrialisation from only reliance on primary goods. And there are a number of arguments supporting this view.
4
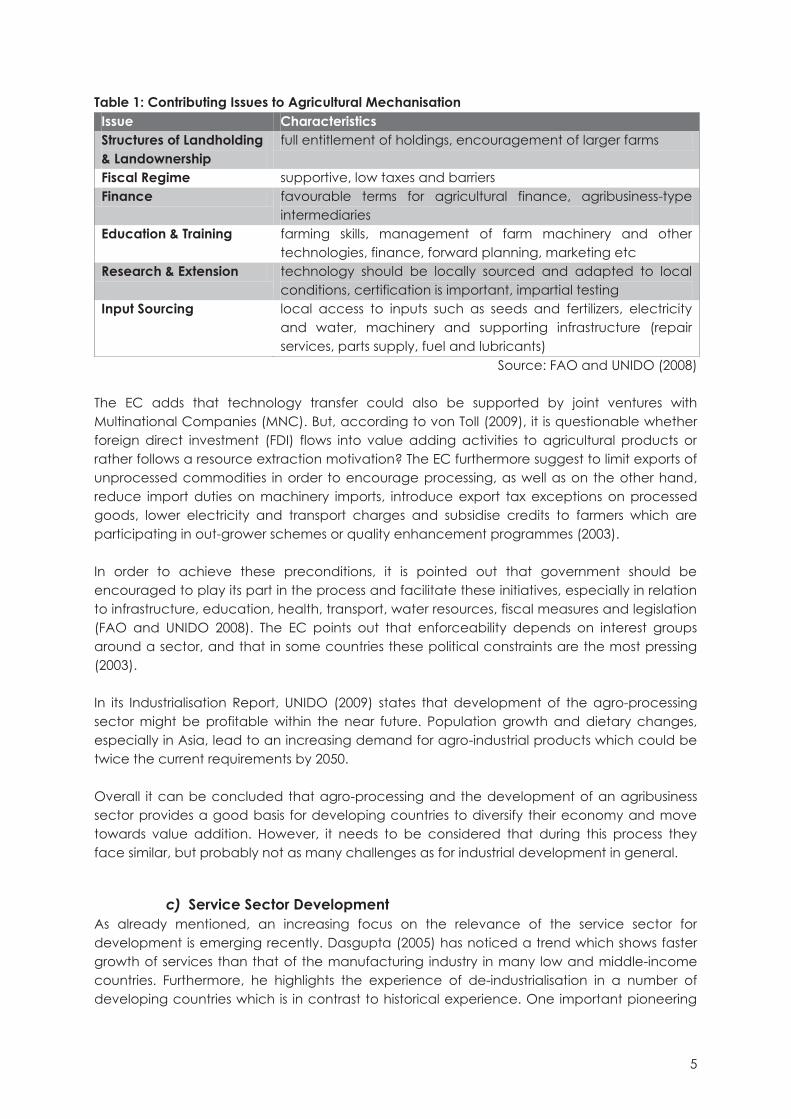
For example, the World Development Report 2008 (World Bank (WB) 2007) focuses on agriculture for development. It stresses that a productive agricultural sector is a vital tool for reducing poverty and creating sustainable economic development. It highlights the success of India and China, which initiated industrialisation by increasing agricultural productivity (p.35). Furthermore, the establishment of a dynamic agribusiness sector is considered to be a major driver of growth (p.135). Furthermore, FAO and UNIDO (2008, p.1) state that: “Agricultural mechanisation is the application of mechanical technology and increased power to agriculture, largely as a means to enhance the productivity of human labour and often to achieve results well beyond the capacity of human labour.” According to FAO and UNIDO (2008) agricultural mechanisation includes the use of tractors, animal-powered and human-powered implements and tools, internal combustion engines, electric motors, solar power and other methods of energy conversion, irrigation systems, food processing and related technologies and equipment. Arguments in favour of agricultural-based industrialisation concentrate on its diversifying role. Primarily, it helps to overcome the vulnerability to the high volatility of commodity prices, which has posed to be an increasing problem to developing countries in recent years. Furthermore it includes the traditional benefits of industrialisation such as greater linkages throughout the economy, greater employment prospects and productivity dynamics (European Commission (EC) 2003). Even though agricultural-based industrialisation is often seen as “light” industrialisation, there are also a number of obstacles that need to be overcome. First and foremost the processing of commodities is not always “light” when it comes to capital intensity. Additionally, it may compromise the efficient allocation of a country’s resources. Most developing countries have internal obstacles such as unstable power supply or other problems of input provision. External challenges are furthermore protective measures by member countries of the Organisation for Economic Co-operation and Development (OECD) as well as tightly controlled commodity chains, which have been dominated by multinational corporations (EC 2003). Furthermore, Bargawi and Oya (2009), have a critical stance towards the potential of corporate agribusiness for the development of a dynamic agricultural sector and small-holders because of the inequitable sharing of risks and profits between companies and smallholders. Also, it is to be investigated whether exports of processed agricultural products can contribute enough foreign exchange earnings, in order to cover the import needs of the country under consideration. Experience in agro-based industrialisation has been mixed. However, research shows that successes have a lot to do with effective policies to promote processing. The EC points out that a good base for entering export markets is a stable home market for processed commodities (EC, 2003). For optimal development of agricultural mechanisation, the FAO and UNIDO see a number of issues as fundamental contributors which are summed up in Table 1.
5
Table 1: Contributing Issues to Agricultural Mechanisation Issue Characteristics Structures of Landholding & Landownership
full entitlement of holdings, encouragement of larger farms
Fiscal Regime supportive, low taxes and barriers Finance favourable terms for agricultural finance, agribusiness-type
intermediaries Education & Training farming skills, management of farm machinery and other
technologies, finance, forward planning, marketing etc Research & Extension technology should be locally sourced and adapted to local
conditions, certification is important, impartial testing Input Sourcing local access to inputs such as seeds and fertilizers, electricity
and water, machinery and supporting infrastructure (repair services, parts supply, fuel and lubricants)
Source: FAO and UNIDO (2008)
The EC adds that technology transfer could also be supported by joint ventures with Multinational Companies (MNC). But, according to von Toll (2009), it is questionable whether foreign direct investment (FDI) flows into value adding activities to agricultural products or rather follows a resource extraction motivation? The EC furthermore suggest to limit exports of unprocessed commodities in order to encourage processing, as well as on the other hand, reduce import duties on machinery imports, introduce export tax exceptions on processed goods, lower electricity and transport charges and subsidise credits to farmers which are participating in out-grower schemes or quality enhancement programmes (2003). In order to achieve these preconditions, it is pointed out that government should be encouraged to play its part in the process and facilitate these initiatives, especially in relation to infrastructure, education, health, transport, water resources, fiscal measures and legislation (FAO and UNIDO 2008). The EC points out that enforceability depends on interest groups around a sector, and that in some countries these political constraints are the most pressing (2003). In its Industrialisation Report, UNIDO (2009) states that development of the agro-processing sector might be profitable within the near future. Population growth and dietary changes, especially in Asia, lead to an increasing demand for agro-industrial products which could be twice the current requirements by 2050. Overall it can be concluded that agro-processing and the development of an agribusiness sector provides a good basis for developing countries to diversify their economy and move towards value addition. However, it needs to be considered that during this process they face similar, but probably not as many challenges as for industrial development in general.
c) Service Sector Development As already mentioned, an increasing focus on the relevance of the service sector for development is emerging recently. Dasgupta (2005) has noticed a trend which shows faster growth of services than that of the manufacturing industry in many low and middle-income countries. Furthermore, he highlights the experience of de-industrialisation in a number of developing countries which is in contrast to historical experience. One important pioneering
6
example is India where the leading sector has increasingly been the service sector rather than the manufacturing sector. Contrary to the traditional view that services-led growth contradicts historical patterns of growth and is therefore unsustainable, the new view takes up the progress of technology and suggests that services may replace industry as the engine of growth. Many of the above arguments for industrialisation are seen to also apply to services nowadays. Especially the ICT sector, for example, has strong spillover effects. It not only leads to new demand for its services products, such as internet connectivity, but can also be used to enhance productivity in existing or new manufacturing goods and processes. Additionally, the tradability of services has increased immensely. Therefore it can provide for a positive influence on the balance of payments. Recent years have shown fast growth of international trade in services, which is reflected for example in the General Agreement on Trade and Services (GATS) and various WTO rounds on services. This is largely due to technical progress which has laid the path for services to be provided from far away. Sheehan (2008) gives the example of India, as opposed to China, which has demonstrated rapid growth largely based on the service sector and domestic consumption as compared to industry and exports. Another difference is that, the growth is driven by local private entrepreneurs and not government agencies or FDI. It has been more important to use high technology and ICT services as well as increasing productivity instead of increasing factors of production. Sheehan argues that the key mechanisms which drive industrial take-off are also applicable to the service sector: increasing internal returns, transfer of labour into higher value activities and pecuniary externalities. Therefore emphasis should be put on strategies which focus on the expansion of agriculture and services and look at opportunities to better reach rural areas with the service sector in order to improve living conditions there. In recent years, services have been the fastest growing component of international trade. An increasing importance of cross-border supply of services has been observed. Also FDI into the services sector has increased: in 2005 services accounted for 2/3 of FDI inflows worldwide and for ½ in developing countries (Karmakar 2008). The most notable service sectors in relation to trade have been transportation, communication, tourism, education, and temporary workers in foreign lands. However, it also needs to be kept in mind that the larger amount of services, around ¾, will remain untradeable as it is difficult to impossible to provide them over a distance (hairstylists, electricians etc.). However, the sector is widely fragmented and difficult to treat as a homogenous group. Trade statistics often understate the actual export figures, and often exporters do not realise they are exporting (Walters 2005). Walters (2005) points out that especially for small, landlocked countries and island economies with limited opportunities for agricultural or industrial diversification, the service sector represents an opportunity for development that should not be underestimated. He states that especially the following sectors show immense potential: professional services, back-office
7
operations and tourism. Furthermore he highlights the importance of looking at the potential for south-south trade. Important social benefits include firstly, that many SME’s are involved as services are easier for small businesses to provide and export. Secondly, worldwide more women are employed in the services sector (Walters 2005). In order to provide optimal preconditions for service exports it is important to provide affordable access to telecommunications, high educational standards and building country’s credibility as a provider of high-quality services (national branding and ‘bundling’ of related services). According to Hernandez (2006) service sector development is key to poverty alleviation and realising the MDG’s: Directly by enhancing the availability and affordability of education, health, energy and ICT services and indirectly by alleviating poverty and empowering women through entrepreneurial and employment creation opportunities. Karmakar (2008) criticises the fact that, the service sector is not featured adequately in research on growth and development. Usually it is being perceived as inducing jobless growth due to the inability to generate opportunities at the lower skills level. However, according to Karmakar (2008) services have become the main source of growth in developed and developing countries. Many services are not stagnant and experience significant labour and total factor productivity growth. As the scenario is changing, a focus on services can lead to cheaper service inputs to all productive activities. Services are contributing upwards of 50% to GDP in many developing countries. World commercial services trade was at 4 trillion dollars in 2006, growing at the rate of 12.5% during the 2 subsequent years. And the McKinsey Quarterly estimation shows that by 2015 global cross-border service trade would reach 30% as compared to 18% in 1990. The service sector clearly demonstrates developmental impact by providing inputs into productive activities and offering cheaper final services to individual and business consumers. This indirectly has an impact on productivity and welfare.
8
B. ANALYSIS OF THE UGANDAN CASE FOR DEVELOPMENT
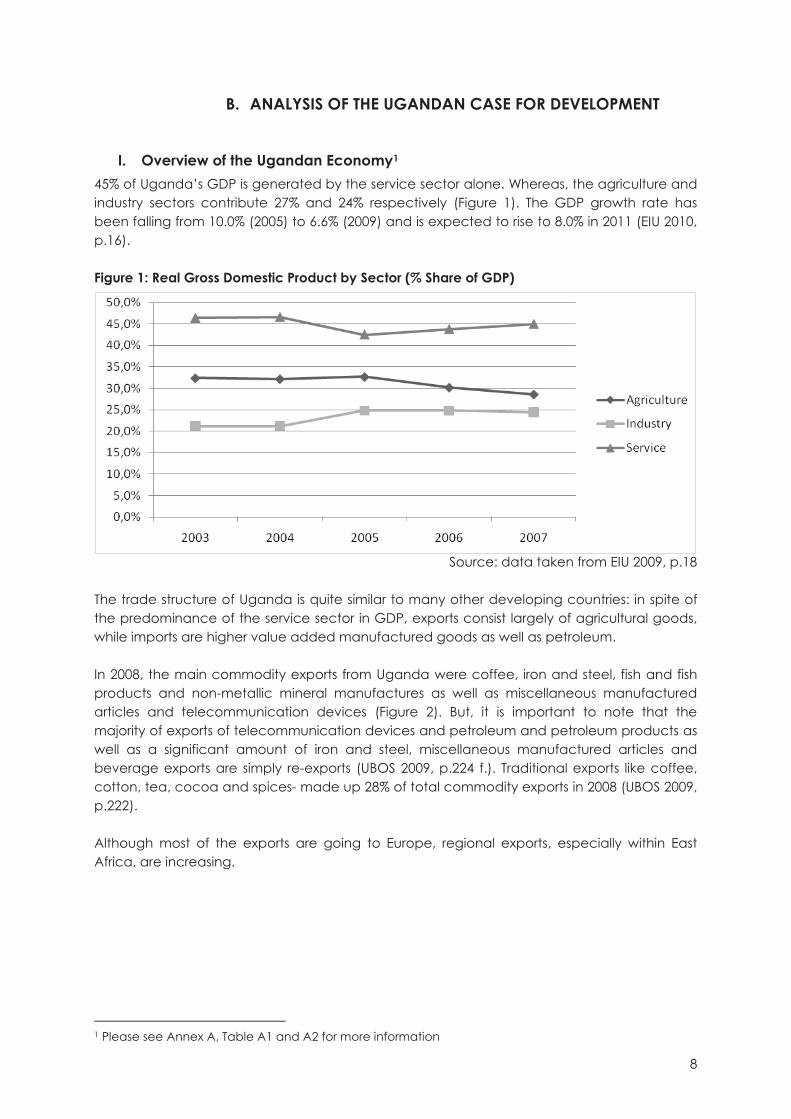
I. Overview of the Ugandan Economy1 45% of Uganda’s GDP is generated by the service sector alone. Whereas, the agriculture and industry sectors contribute 27% and 24% respectively (Figure 1). The GDP growth rate has been falling from 10.0% (2005) to 6.6% (2009) and is expected to rise to 8.0% in 2011 (EIU 2010, p.16). Figure 1: Real Gross Domestic Product by Sector (% Share of GDP)
Source: data taken from EIU 2009, p.18
The trade structure of Uganda is quite similar to many other developing countries: in spite of the predominance of the service sector in GDP, exports consist largely of agricultural goods, while imports are higher value added manufactured goods as well as petroleum. In 2008, the main commodity exports from Uganda were coffee, iron and steel, fish and fish products and non-metallic mineral manufactures as well as miscellaneous manufactured articles and telecommunication devices (Figure 2). But, it is important to note that the majority of exports of telecommunication devices and petroleum and petroleum products as well as a significant amount of iron and steel, miscellaneous manufactured articles and beverage exports are simply re-exports (UBOS 2009, p.224 f.). Traditional exports like coffee, cotton, tea, cocoa and spices- made up 28% of total commodity exports in 2008 (UBOS 2009, p.222). Although most of the exports are going to Europe, regional exports, especially within East Africa, are increasing.
1 Please see Annex A, Table A1 and A2 for more information

9
Figure 2: Structure of Exports from Uganda (2008)
Source: data taken from UBOS 2009, p. 222 f.
Imports to Uganda are dominated by petroleum and petroleum products, road vehicles, iron and steel, telecommunication devices and medical and pharmaceutical products (Figure 3). The largest source for imports - mainly manufactured goods - is Kenya. Furthermore, a large part of Uganda’s trade outside Africa is conducted through the port of Mombasa (EIU 2009). Figure 3: Structure of Imports to Uganda (2008)
Source: data taken from UBOS 2009, p. 215 f. Even though exports have increased considerably, the growth of imports has outpaced them leading to a widening average trade deficit of over 10% of GDP in 2006-2008. This also
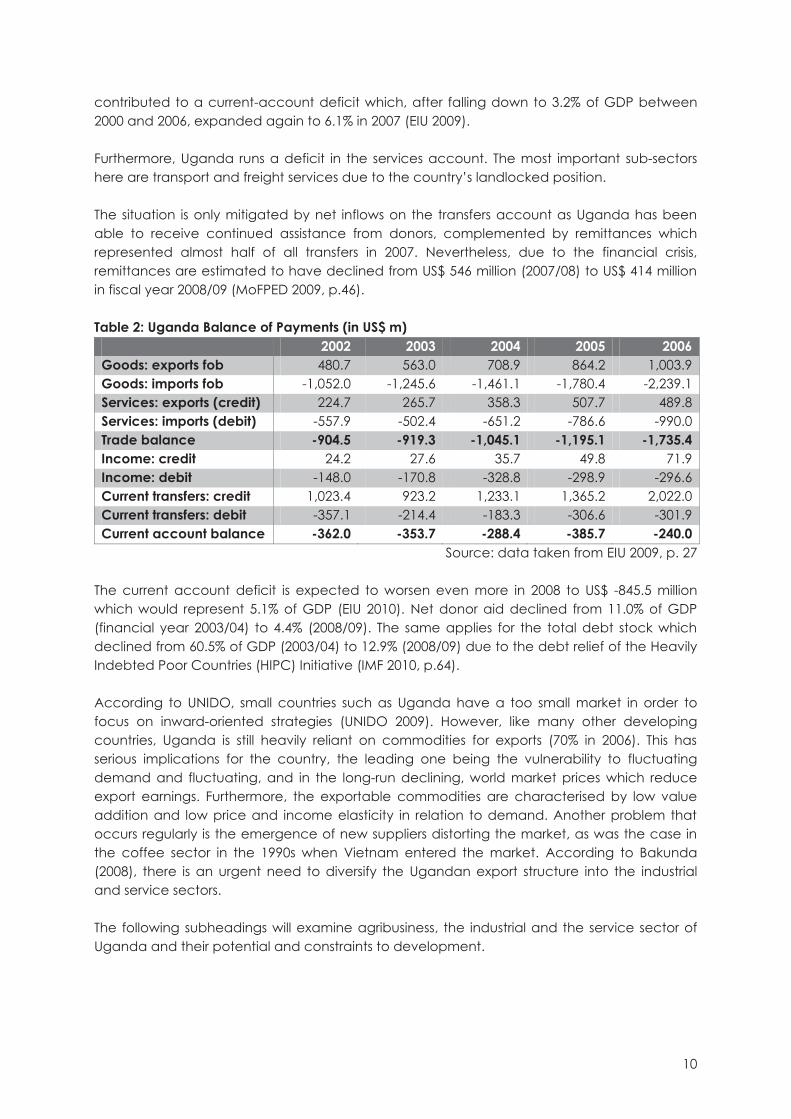
10
contributed to a current-account deficit which, after falling down to 3.2% of GDP between 2000 and 2006, expanded again to 6.1% in 2007 (EIU 2009). Furthermore, Uganda runs a deficit in the services account. The most important sub-sectors here are transport and freight services due to the country’s landlocked position. The situation is only mitigated by net inflows on the transfers account as Uganda has been able to receive continued assistance from donors, complemented by remittances which represented almost half of all transfers in 2007. Nevertheless, due to the financial crisis, remittances are estimated to have declined from US$ 546 million (2007/08) to US$ 414 million in fiscal year 2008/09 (MoFPED 2009, p.46). Table 2: Uganda Balance of Payments (in US$ m) 2002 2003 2004 2005 2006 Goods: exports fob 480.7 563.0 708.9 864.2 1,003.9 Goods: imports fob -1,052.0 -1,245.6 -1,461.1 -1,780.4 -2,239.1 Services: exports (credit) 224.7 265.7 358.3 507.7 489.8 Services: imports (debit) -557.9 -502.4 -651.2 -786.6 -990.0 Trade balance -904.5 -919.3 -1,045.1 -1,195.1 -1,735.4 Income: credit 24.2 27.6 35.7 49.8 71.9 Income: debit -148.0 -170.8 -328.8 -298.9 -296.6 Current transfers: credit 1,023.4 923.2 1,233.1 1,365.2 2,022.0 Current transfers: debit -357.1 -214.4 -183.3 -306.6 -301.9 Current account balance -362.0 -353.7 -288.4 -385.7 -240.0
Source: data taken from EIU 2009, p. 27 The current account deficit is expected to worsen even more in 2008 to US$ -845.5 million which would represent 5.1% of GDP (EIU 2010). Net donor aid declined from 11.0% of GDP (financial year 2003/04) to 4.4% (2008/09). The same applies for the total debt stock which declined from 60.5% of GDP (2003/04) to 12.9% (2008/09) due to the debt relief of the Heavily Indebted Poor Countries (HIPC) Initiative (IMF 2010, p.64). According to UNIDO, small countries such as Uganda have a too small market in order to focus on inward-oriented strategies (UNIDO 2009). However, like many other developing countries, Uganda is still heavily reliant on commodities for exports (70% in 2006). This has serious implications for the country, the leading one being the vulnerability to fluctuating demand and fluctuating, and in the long-run declining, world market prices which reduce export earnings. Furthermore, the exportable commodities are characterised by low value addition and low price and income elasticity in relation to demand. Another problem that occurs regularly is the emergence of new suppliers distorting the market, as was the case in the coffee sector in the 1990s when Vietnam entered the market. According to Bakunda (2008), there is an urgent need to diversify the Ugandan export structure into the industrial and service sectors. The following subheadings will examine agribusiness, the industrial and the service sector of Uganda and their potential and constraints to development.

11
II. Agribusiness Sector Agriculture is still the most important source of employment in the Ugandan economy. In 2005/06 self-employment in agriculture made up almost 70% of the working population (UBOS 2009, p.16). The sector is mainly based on non-commercial smallholder farming. Even though, there has been an increase in the export crop production and monetary agriculture, subsistence farming is estimated to provide almost half of total agricultural output (EIU 2009, p.18). The agricultural sector is the least dynamic sector in the Ugandan economy which manifests itself in the low growth rate of 2.6% as compared to a growth of 3.8% in industrial output and one of 9.4% in the service sector in 2008/09 (MoFPED 2009, p.6)). This lack of dynamism led to a decline of agriculture’s contribution to GDP over the past years (Figure 1) and reflects an ongoing restructuring process of the Ugandan economy. Within agricultural production, food crops make up about 65% of output followed by livestock products. Export crops like the traditional ones coffee, tea, cotton and tobacco as well as the non-traditional products like flowers, cocoa and vanilla contribute about 10% to agricultural output (EIU 2009). Even though agriculture is seen as key to poverty reduction by the government (reflected in the Plan for the Modernisation of Agriculture (PMA)), progress in the eradication of poverty through a profitable, competitive, sustainable and dynamic agricultural and agro-industrial sector thus the transformation from subsistence to commercial agriculture has been rather slow (Oxford Policy Management (OPM) 2005). Profitability in agricultural based activities is lower than average of the Ugandan economy. Only fishing shows a high profitability of 35% which is the same for services (Table 3). Labour productivity in terms of value added per worker is also relatively low. But food processing shows a higher than median labour productivity for all sectors. Table 3: Performance Indicators by Selected Sectors Sector Ratio of value added
to gross output Value added per
worker (UShs ‘000)
Profitability (Operating surplus
/ gross output) Agriculture 45.6% 2,195.0 14.9% Fishing 63.3% 2,372.8 35.0% Food Processing 35.7% 7,585.2 23.0% Other Manufacturing 34.9% 6,185.4 20.4% Median for all sectors (including services, etc)
61.4% 5,952.4 29.0%
Source: authors’ compilation of data from Abuka et al. 2006, p.12f. The structure of exports from Uganda has changed in favour of non-traditional export crops. The traditional exports coffee, tea, cotton and tobacco had a share of 30% in total commodity exports in 2006 as compared to almost 40% just 4 years ago in 2002 (Uganda Bureau of Statistics (UBOS) 2007, p.184). This can on the one hand be attributed to the decline in production output of traditional crops and on the other hand to the increase in the production of non-traditional export crops.

12
Whether past and future developments in the agribusiness sector can be attributed to national policies will be examined in the following paragraph.
a) Importance in National Policies In the Poverty Eradication Action Plan (PEAP) (MoFPED 2004), the modernisation of agriculture is one of the priorities which falls under the second pillar “Production, Competitiveness and Incomes”. It is highlighted that the performance of the agricultural sector has substantial implications for poverty reduction since it is the most important employer in the Ugandan economy (p.51). Furthermore, agricultural incomes need to increase so that non-agricultural products produced in rural areas are sufficiently demanded, leading to the potential expansion in their production. The dependence of the Ugandan agriculture on public goods like research & development, extension services and other supporting measures calls for national policies in order to increase its competitiveness. Thus, under the PEAP, the Plan for the Modernisation of Agriculture (PMA) was developed to focus public intervention on the following supply-side measures: research and technology development, advisory services, rural financial services, rural infrastructure and sustainable natural resource use and management. The PMA is a multi-sectoral policy framework to transform subsistence small-scale to commercial agriculture with the overall aim of reducing poverty. Within the PMA, the Marketing and Agro-Processing Strategy (MAPS) (MTTI 2005) clearly states the importance of linking producers to consumers, locally as well as on an international level, and of adding value to agricultural produce. Its vision is an “increased and sustainable supply of and demand for competitive processed and non-processed agro-products on domestic, regional and international markets” (p.2). Since its implementation, the PMA has not shown the envisaged results (Oxford Policy Management (OPM) 2005). While it states in its evaluation that the “basic conceptualisation” of the Plan is still valid (p.5), significant confusions over the functions of the PMA and the lack of addressing some of the constraints impeding agricultural development (e.g. land policy), could create a downward trend of achievements if they are not sufficiently dealt with. Furthermore, it was mentioned in an interview with Dorothy Nakimbugwe (2009) that the PMA has not made any significant difference on the ground since its implementation. In order to streamline national plans with those of the region, the Government of Uganda (GoU) said that it will abandon the PMA, eight years earlier than its envisaged end date, for the regional programme “Comprehensive Africa Agriculture Development Programme (CAADP)”2 (The East African 2009, p.24). This aims at achieving higher economic growth in African countries through agriculture-led development. It is interesting to note, that the CAADP does not give explicit attention on the value addition to agricultural produce. As stated by Todd Benson (member of the PMA Secretariat) in The East African (2009, p.24) “...the lack of performance [of the PMA] is more due to institutional and resource allocation issues than technical issues”. It is questionable if any other plan would create better results, if those institutional and allocational constraints are not addressed properly.
2 For more information see: www.nepad-caadp.net
13
Whereas the above mentioned strategies do not set the focus on specific commodities, the Ugandan National Export Strategy (NES) (MTTI 2007a) has identified the following priority sectors: coffee, fish, tea, cotton and textiles, flowers and services. Additionally, six other sectors shall be promoted to enhance export diversification: fruits & vegetables, dairy, cereals & pulses, natural ingredients, commercial crafts and manufactures (to advance the value addition goal) (MTTI 2007a, p.34). These sectors were selected according to the following criteria (MTTI 2007a, p.34):
1) Possession or potential to possess a significant competitive advantage 2) Possession or potential to possess high value-addition 3) High contribution or potential to contribute to development 4) High growth in international demand 5) Potential to mainstream gender and vulnerable groups into export trade.
Most of the sectors that were identified are based on agriculture and its produce. By recognising the need for a strong linkage between the agricultural and the industrial sector, the NES includes value addition as one of the key objectives of every agricultural subsector (Table 4).

14
Table 4: Sector-specific Objectives on Value Addition Sector Objective Target Coffee To strive for exportation of soluble coffees
that account for 90% of the final coffee value (p.38)
- 10% of the value of current exports by 2012
- 3 bankable feasibility studies on roasting
- Roaster and extraction tech and pilot in the country in 5 years
Fish To ensure value addition and product range diversification (p.43)
- Range of products: Fillet portions, steaks and skewers and fish oils
Cotton & Textiles
To increase the range of value added products from cotton (p.52)
- Range of products: lint, animal feeds, seed cake and cooking oil
- Garments and apparels exports of US$ 5 million in 5 years
Tea To re-instate tea research (especially for smallholders) and diversify into value addition (p. 58)
- Have the two tea research institutes under control of UTA by 2009
- One demonstration farm in each of the major producing areas
- Herbal and essential oil teas by 2012
Fruits & Vegetables
Widen the export basket to include more packed juices, concentrates and more dried fruits, chutneys etc. (p.90)
- Five product ranges exported - US$ 14 million of exports of
dried fruits Dairy To increase product diversification and
value addition (p.96) - Powdered and UHT milk,
butter, cheese and ghee Cereals, Pulses & Oil Seeds
To widen sector product range especially by encouraging processing To increase application of technology in the sectors (p. 102)
- Edible oils, breakfast cereals, flour, fortified foods etc.
Natural Ingredients
To increase the range of products from a wider base but also from similar bases of raw materials (p. 108)
- 10 product ranges as a minimum
Source: author’s combination of management frameworks from MTTI 2007a

15
The Competitiveness and Investment Climate Strategy (CICS) (MoFPED 2007), like the PMA, focuses on the second pillar of the PEAP “Production, Competitiveness and Income”. It identifies the value addition to export products as one of the main challenges which Uganda should overcome in order to further improve the business environment and promote more competitive productive sectors: “Uganda’s exports remain dominated by low value, undifferentiated primary commodities that are subject to stagnant world demand, price volatility and unpredictable weather conditions. This continued reliance on primary commodities severely constrains Uganda’s ability to define new avenues for competition. The lack of effective strategies for increasing market chain efficiencies makes it more difficult for Uganda to compete with those rivals who find it easier to adjust supply levels to changing market demand” (MoFPED 2007, p.9). According to CICS Uganda’s competitive advantage lies in the production of goods which are based on domestically produced inputs and locally available raw materials (p.7) and which have a high value to weight ratio (taking the high transport costs and the landlocked situation into consideration) (p. 35). Those are particularly high-value agro-based products. CICS ranks the different agricultural commodities according to their potential for poverty reduction, job creation, export earnings and the opportunity to enter new markets (Appendix A, Table A3). According to this ranking the traditional crops coffee, tea and cotton as well as the non-traditional produce from fisheries and beef cattle / hides rank the highest. It is important to note that this ranking does not directly include the potential for value-addition to the products. Also, when CICS gives a detailed analysis of the agricultural priority sectors (p. 64 ff.), the value addition to coffee, flori- and horticulture, tea and cotton is not its main concern. It is first and foremost an increase in production volumes of those products. The recently developed National Industrial Policy (NIP) (MTTI 2008) sets out a framework for Uganda’s transformation, competitiveness and prosperity. Its focus is inter-alia on the development of resource-based agro-industries and the necessary infrastructure which will create an enabling environment to foster those industries as well as agricultural production (NIP 2008, p. 39). It also mentions the value addition by processing of agricultural and mineral resources as an important part to reduce post harvest losses and create higher value exports (p. 1). Within agro-processing, it puts the focus on food processing, leather, textiles and garments, sugar, dairy and niche exports and it adds the promotion of competitive industries that use local raw materials (p.3). It is not mentioned according to which criteria, especially the sub-sector focus areas in agro-processing have been elected and what is understood by niche exports. The National Trade Policy (NTP) (MTTI 2007b) recognises that the Ugandan agricultural sector is still dominated by non-commercial farming (p.5) and that the majority of merchandise exports is made up of primary products which is a major concern due to their price volatility, unstable production levels and considerable inefficiencies (p.7). Furthermore, it is mentioned that the government focus on export-led growth has led to a neglect of domestic trade (p.9) which manifests itself in imbalances of production over the countries regions. Thus the NTP aims to enhance domestic and international trade by enhancing private sector competitiveness and supporting the productive sectors in trading activities (p.11). More detailed envisaged actions that could have an impact on the agricultural sector include the encouragement of bulk marketing and adherence to commodity standards, promotion of value addition and the use of local materials, encouragement of locally produced goods
16
etc. (p.17f.). As compared to other national policies and strategies, the NTP hardly differentiates between agriculture, manufacturing and services sector. It rather sets a generalised framework. Summarising, the Ugandan agribusiness sector receives a substantial role for development in many national policies and strategic frameworks. Nevertheless, some policies focus on value addition to agricultural produce while others put the increase in production volumes at the forefront. The potential for development of the agribusiness sector will be examined in the following paragraph.
b) Potential for Development As recognised by the PEAP, one of the main forms of industrialisation in Uganda will be value addition by processing agricultural products. One argument is that manufacturing growth depends on agricultural development, because it depends on agricultural inputs and on rural (which can be equated with agricultural) incomes (MoFPED 2004, p.1). The other is that it is not expected that Uganda will and can move away from agricultural production altogether, because its natural competitive advantage lies in fertile land and good climate (p.33). Adding value to Uganda’s leading exports like coffee, cotton, fish and livestock products is considered to be the key for increased export earnings (p.68). But the potential of value addition to different agricultural products for development is seen critical and not an overall solution by many authors. In the following paragraphs this will be examined for some traditional crops like coffee, cotton, tea and some of the non-traditional ones like fruits and fisheries.
i. Coffee About 97% of Ugandan coffee is produced by 500,000 smallholder farmers as there are only few large scale coffee producers. The coffee sector employs about 3.5 million families, which makes it the single most important employer in Uganda (Uganda Coffee Development Authority (UCDA) n.d.). In 2007 there were 12 registered coffee roasters. Their number is limited because of the low local coffee consumption (3-5% of production), low promotion as well as inadequate roasting and packaging capacity (UCDA n.d.). Furthermore value addition to coffee, especially roasting and blending, is by its nature (such as proximity to the final customer) and due to its technological processing requirements, not very suitable to be conducted in Uganda given the current infrastructural situation (von Toll, 2009). When it comes to FDI into the coffee sector, von Toll (2009) found that it is basically determined by resource-seeking motivations, which describes the extraction and export of raw material with no substantial value addition within the country of origin. This implies that FDI’s contribution to value chain development and agricultural mechanisation in the coffee sector is very limited. Baffes (2006, p.16 f.) also suggests that putting effort in value addition in the Ugandan coffee sector will only have a limited impact on poverty reduction. According to him, an increase in the production of speciality coffee and instant coffee as well as an expansion of roasting activities will probably not yield higher profits to growers. It might only add some income through the generation of employment. He also argues that the key issue policy makers should focus on is the expansion of production, i.e. the increase in productivity by combating the coffee wilt disease and evaluating the replanting programme. Similarly, the CICS

17
(MoFPED 2007, p.S1) puts a focus on an increase in production volumes and the penetration of premium markets. Nkonya (2002, p.14) found out that prices paid to farmers are not higher for better quality coffee, as they are only based on the weight of the beans. Thus, farmers do not have an incentive to increase the quality of their coffee. Exporters, in contrast receive a higher price for better quality coffee on the international market. So, there is a mismatch of incentives. According to an interview with Paul Nyende (AgriNet, 21/10/2009) this is also true for many other crops.
ii. Cotton It is estimated that the cotton sector provides income to 10% of the country’s population, –which counts for around 2.5 million people (UEPB 2009a, p.2). Uganda exports about 90% of cotton as raw lint. There are only few textile companies in the country. Value addition to increase earnings in this sector is limited not only due to infrastructural as well as reliable power supply problems in Uganda, but also because of the fierce competition it faces from Asia, especially from China. Ugandan textile manufacturers cannot compete with their experienced, productive and low cost workforce (Kaplinsky and Morris 2007, UEPB 2009a). Thus, the CICS (MoFPED 2007, p.S7) identifies the increase in productivity of cotton cultivation as the key to increase raw cotton exports and thus export earnings in this sector.
iii. Tea As opposed to coffee cultivation, about 70% of tea production in Uganda is done on large plantations. The sector employs about 70,000 people (MoFPED 2007, p. S6). Since the minimum size of 200 ha is needed in order to run a processing plant, there are 4 smallholder tea factories to offer processing to their tea production. About 95% of the processed tea is exported mainly in bulk (Uganda Tea Development Authority (UTDA), interview). The value addition to tea in order to get the final output is not as long and complicated as it is for other agricultural products. Thus, the tea which is exported in bulk is already a finished product, apart from the packaging. There are 4 tea packer companies in Uganda, but most of the tea is exported in bulk. The CICS does - also not in this sector - put a focus on value adding activities like packaging. It rather suggests the increase in production and also export by improving tea varieties. Similarly to the coffee sector, FDI inflow to the Ugandan tea sector is also not a facilitator for activities higher up in the value chain of tea and potential technology spillovers. This is not only due to the constraints to investments in higher value adding activities, but also to the nature of tea itself as tea companies need certain proximity to their customers with their individual tastes (von Toll, 2009). According to Purity Mbae (from UTDA) the tea sector faces problems of value addition because of – among others – the lack of an umbrella organisation. There is neither a certification body for the tea sector, nor a recent tea sector strategy. The most recent strategy is from 1996 and has not been adapted to the changing environment so far. Furthermore, the absence of a research centre makes Uganda to have to rely on costly information and improved clones from Kenya.
18
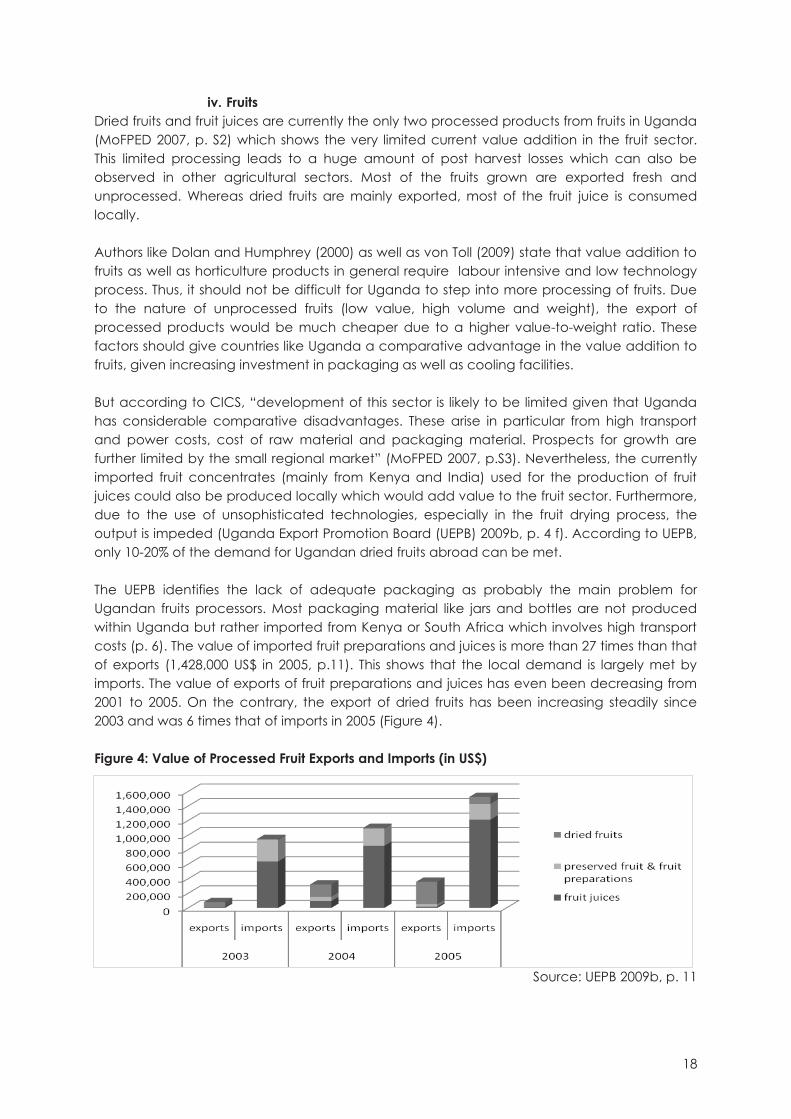
iv. Fruits Dried fruits and fruit juices are currently the only two processed products from fruits in Uganda (MoFPED 2007, p. S2) which shows the very limited current value addition in the fruit sector. This limited processing leads to a huge amount of post harvest losses which can also be observed in other agricultural sectors. Most of the fruits grown are exported fresh and unprocessed. Whereas dried fruits are mainly exported, most of the fruit juice is consumed locally. Authors like Dolan and Humphrey (2000) as well as von Toll (2009) state that value addition to fruits as well as horticulture products in general require labour intensive and low technology process. Thus, it should not be difficult for Uganda to step into more processing of fruits. Due to the nature of unprocessed fruits (low value, high volume and weight), the export of processed products would be much cheaper due to a higher value-to-weight ratio. These factors should give countries like Uganda a comparative advantage in the value addition to fruits, given increasing investment in packaging as well as cooling facilities. But according to CICS, “development of this sector is likely to be limited given that Uganda has considerable comparative disadvantages. These arise in particular from high transport and power costs, cost of raw material and packaging material. Prospects for growth are further limited by the small regional market” (MoFPED 2007, p.S3). Nevertheless, the currently imported fruit concentrates (mainly from Kenya and India) used for the production of fruit juices could also be produced locally which would add value to the fruit sector. Furthermore, due to the use of unsophisticated technologies, especially in the fruit drying process, the output is impeded (Uganda Export Promotion Board (UEPB) 2009b, p. 4 f). According to UEPB, only 10-20% of the demand for Ugandan dried fruits abroad can be met. The UEPB identifies the lack of adequate packaging as probably the main problem for Ugandan fruits processors. Most packaging material like jars and bottles are not produced within Uganda but rather imported from Kenya or South Africa which involves high transport costs (p. 6). The value of imported fruit preparations and juices is more than 27 times than that of exports (1,428,000 US$ in 2005, p.11). This shows that the local demand is largely met by imports. The value of exports of fruit preparations and juices has even been decreasing from 2001 to 2005. On the contrary, the export of dried fruits has been increasing steadily since 2003 and was 6 times that of imports in 2005 (Figure 4). Figure 4: Value of Processed Fruit Exports and Imports (in US$)
Source: UEPB 2009b, p. 11

19
v. Fish Estimations say that the fish sector in Uganda provides the livelihood to over 5.5 million people throughout its value chain (UEPB 2009c, p.1). The 17 fish processing factories operate below their installed capacities, not only due to the limited supply of fish. The fish farming industry is still in its infancy. So, be it for local consumption or export, the larger portion relies on capture fisheries (MoFPED 2007, p.S4). In order to guarantee the sustainability of the fish sector in Uganda, urgent measures like quotas have to be taken to prevent overfishing, especially of Lake Victoria. The UEPB (2009c) identifies an urgent need to diversify the product range from fish processing and its by-products in order to add more value to the sector and increase export earnings.
c) Constraints to Development Currently, the overwhelming agricultural production is for subsistence and does not leave much room for commercial use or value addition. Thus, an increase of productivity is a necessary precondition in order to generate production surpluses which can be considered for processing, commercialisation and thus value addition. Obstacles to value addition in the agribusiness sector are described in the following paragraphs. They were frequently mentioned in interviews with various stakeholders and also analysed in Nkonya (2002) on the Ugandan crop market. A supply side constraint in Uganda, which is always mentioned in relation to all product categories, is the poor infrastructure. This includes on the one hand the inadequate transport and storage infrastructure, badly maintained roads, lack of railways, lack of air transport opportunities and poor shipping facilities on the lakes. Those obstacles trigger high transport costs which, together with Uganda’s landlocked position cause Ugandan exports to lose competitiveness. Furthermore, the price of inputs needed for value addition increases and the level of national and foreign direct investment is reduced (Rudaheranwa n.d., p.14). Additionally, the poor electrical infrastructure causes businesses to not invest in activities which need a reliable power supply. Since many processing operations conducted for value addition need a constant supply of power, investment into them is limited. Another supply side constraint is the current land tenure system which constrains the modernisation of agriculture (Rudaheranwa et al. 2003, p.5). The Land Act of 1998 requires institutions which have still not been implemented. Currently, the area around Kampala is mainly privately owned. In rural areas, land is community owned. This gives rise to problems for larger scale cultivation and soil improvement because of the little ownership. Furthermore, the use of land as collateral for formal credit is restricted (Okidi et al. 2005, p.17). This limited use of land as collateral and high lending interest rates of 19.1% in 2007 (EIU 2009, p.21) lead to a poor access to finance. But, according to the evaluation of the PMA (OPM, p.19 ff.) rural finance has improved. Until 2005 12 new microfinance branches reaching more than 20,000 clients had been established. Nevertheless, this is far from reaching the original aim of covering the whole country by 2006 (Microfinance Outreach Plan). Thus, in 2005 a strategy called the Rural Financial Services Program was launched (MoFPED 2009, p.38). But the ongoing lack of access to finance particularly hinders the development of a local agribusiness sector. Nkonya (2002, p.12) found that local coffee exporters were squeezed out

20
of the market by international coffee houses, because they have better access to cheap finance. This also applies to other sectors. An additional constraint faced by investments into value addition is the availability of inputs. This includes raw materials as well as machinery and equipment. Prices for imports are high and local inputs, if available at all, show a low quality. Packaging material is not commonly available and producers lack the information about where to get it and what type to use for which products. Another problem is the lack of access to education and information. This ranges from academic and scientific schooling to access to extension services and research and development (R&D) as well as market and product information. The Makerere University Business School (MUBS) is planning to offer the first Master programme in Agricultural Marketing. The Makerere University offers a under- and postgraduate programme in food science and technology. But obviously, those courses are only accessible by the upper social stratum of Ugandans. The typical smallholder farmer is not able to take advantage of those educational possibilities. Efforts have been made to develop a National Agricultural Education Policy (NAEP) (2004-2015). Furthermore the National Agricultural Advisory Service (NAADS) was launched in 2001 (NAADS 2010). But this institution which aims to increase farmers’ access to information, knowledge and technology, faces a lot of criticism. For example, the PMA evaluation report (OPM 2005, p.18 ff.) finds out that the traditional extension services were sometimes more responsive to the poorest farmers’ needs and offered a more diverse range of technologies. By targeting the economically active poor which are subsistence and semi-commercial farmers with access to productive assets and some skills and knowledge, the NAADS excludes the poorest farmers. As it is a demand driven institution it only reacts to enunciated needs and does not come up with innovative new approaches itself. Additionally, there are limits on the type of enterprises (sectors) which can be promoted with the help of NAADS (OPM 2005, p.27). This, of course, undermines the demand-driven approach (Rudaheranwa et al. 2003, p.5, interview with J. Muwanga). The Cotton Development Organisation (CDO) has proposed to implement its own extension services independent from NAADS, but it faces the problem of funding (information collected by interview with different persons of the CDO). With regard to information, Nkonya (2002) found that the information asymmetries between producers and traders lead producers to accept prices for their commodities which are far below the terminal market price. Efforts by the CDO and the Uganda Coffee Development Authority (UCDA) to announce prices via radio twice a day might not show improvements in information asymmetry; only a few farmers own a radio and announcements are primarily in English which is not spoken and understood by everybody in Uganda. For the commercialisation of agriculture, the access to regional and international markets is also of importance because of the small size of the domestic market (MoFPED 2004, p.90). This access is constrained by the limited competitiveness of many Ugandan products, due to the above mentioned high transport costs as well as other constrains like standards imposed on imports by the EU. Those standards make the access to international markets, especially for small and medium sized enterprises (SMEs), very difficult. They cannot bear the high costs of certification associated with them. Thus, even though the very limited use of fertilizers in Uganda makes it predestined for organic products, which show a high international demand, this market opportunity cannot be seized, as the favourable support for certification is not

21
given. The Uganda National Bureau of Standards (UNBS 2005) is supposed to develop and promote standardisation as well as laboratory testing. Another problem in accessing international markets can be a too low volume. This has been especially articulated by representatives from the cotton sector where farmers are often not able to meet export demand (interview with Damalie Lubwama, CDO). Another problem to increased marketing and processing of agricultural commodities in Uganda arises from the lack or inefficiency of collective action by producers (MTTI 2005, p.5). Cooperatives are not existing everywhere and often not working properly. Patrick Tibasima (UNIDO) also identifies the lack of cooperation between competing SMEs in food processing as an obstacle towards achieving effective collective action. Economies of scale cannot be reaped, the joint use of larger facilities is not considered and the actors do not learn from each others best practices.
d) Conclusions & Recommendations In spite of the focus that the agribusiness sector receives in national policies, the progress of this sector has been rather slow. Nevertheless, it plays the most important role in the Ugandan economy when employment is considered; 70% of the working population is employed or working in agriculture (UBOS 2009, p. iv). But when it is looked at in terms of contribution to GDP, the agricultural sector is lacking behind. However, it has to be recognised, that agriculture based manufacturing enterprises like food processing, constitute a large share to industrial output (which has been further examined in part III. of this chapter). In order for the agribusiness sector to contribute to Uganda’s development there are many constraints which need to be dealt with or eliminated. The lack of infrastructure is a problem which can be handled, but the landlocked situation of Uganda cannot be changed and thus have to be overcome by focusing on the export of products which show high value-to-weight and / or -volume ratios. To avoid confusion among executing bodies, those products should be clearly identified. Furthermore, national policies and strategies should be aligned. All should recognise that commercialisation and value addition as well as meeting export demand can only be achieved when production volumes exceed the subsistence level. Thus, the GoU should assist the emergence of commercial farming through policies, e.g. supportive land tenure system (Rudaheranwa et al. 2003, p.4). Nevertheless, it is important to consider strategies which do not ignore smallholder farmers but rather include them in the process towards commercialisation, for example by outgrower schemes or contract farming. Furthermore, it has to be identified which agricultural sub-sectors need to focus on increases in productivity and which can explore more value adding activities. There is not the same solution for every crop, as shown above. It is important to align policies also in terms of priority agricultural products. Nkonya (2002, p.3) identifies the following needs which have to be met in order to establish and benefit from a dynamic agribusiness sector. Firstly, local traders have to be encouraged to form associations and cooperatives for marketing their crops in the international market. Secondly, crop quality has to be controlled and regulated effectively. Thirdly, the importance of intermediaries has to be recognised and their brokerage services have to be licensed and
22
facilitated. Fourth, targeted support to women should be given to get them involved in the export sector or other high-value crops. It is important for Uganda to make use of their competitive advantage in agricultural resources. But this can only be done, if constraints to increases in productivity and value addition are overcome. The identification of those constraints has been done by a number of national strategies and researchers. Thus, the next step should be to act and effectively erase them. Summarised Recommendations:
1. Identify priority sectors 2. Identify needs for increases in productivity and value addition 3. Align policies accordingly 4. Effectively implement strategies to overcome constraints
III. Industrial Sector The OECD Glossary of Statistical Terms provides the following definition for this sector: “Industrial production comprises the output of industrial establishments, covering: mining and quarrying, manufacturing, and electricity, gas and water supply.” (OECD 2001) In many countries including Uganda, it also includes the construction sector (MoFPED 2007). As discussed in the first chapter the industrial sector is often seen as the main driver of growth and development. In the following paragraphs we look at the current role of non-agricultural industries in Uganda and assess their potential for future development. Historically, the industrial sector in Uganda was significantly downsized following the expulsion of Asians in 1972; by 1986 manufacturing output was 1/3 of its previous level. Initially, the recovery was slow due to neglected plant and equipment; however in the 1990s output recovered well and obtained an annual growth rate of about 13% during this decade (Okidi et al. 2005). However, according to Abuka et al. (2006, p.7), the level of investment within manufacturing has declined over time compared to investment within agriculture and services. The performance of Uganda’s industrial sector has remained below the sub-Saharan average over the last 15 years. The share of industry in GDP in Uganda has remained between 21% and 25% from 2003 to 2007, and therefore represents the smallest sector of the Ugandan economy (see Figure 1, p.12). The contribution to the GDP growth rate, after a rise of 1.5% in 2001/2 to 2.1% in 2004/5, declined down to 0.9% in 2005/6 (EIU 2009). As can be seen in the following table 5, overall industrial growth has slowed down considerably in 2008/9. The last strong drop especially reflects the slow-down in the construction sector, which has occurred partly as a result of the financial crisis and the thus reduced remittances. The Mining & Quarrying Sector on the other hand shows very fluctuating figures.
23
Table 5: GDP Growth by Industrial Activity (constant 2002 prices, % change) 2004/5 2005/6 2006/7 2007/8 2008/9 Industry 11.6 14.7 9.6 9.1 3.8 Mining & Quarrying 27.2 6.1 19.4 3.0 9.2 Manufacturing 9.5 7.3 5.6 7.6 7.2 - Formal 11.8 7.8 4.9 9.2 8.3 - Informal 3.6 6.0 7.7 3.3 4.0 Electricity Supply 2.1 -6.5 -4.0 5.4 4.2 Water Supply 3.9 2.4 3.5 3.8 4.1 Construction 14.9 23.2 13.2 10.8 2.2
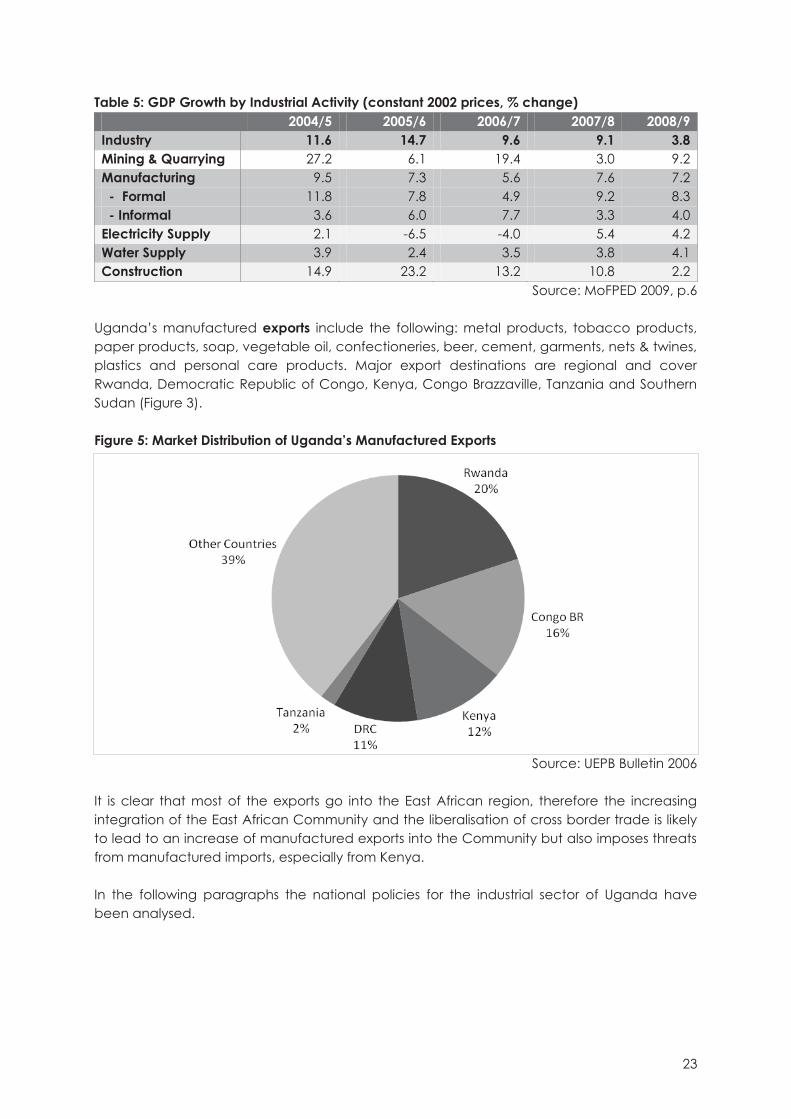
Source: MoFPED 2009, p.6 Uganda’s manufactured exports include the following: metal products, tobacco products, paper products, soap, vegetable oil, confectioneries, beer, cement, garments, nets & twines, plastics and personal care products. Major export destinations are regional and cover Rwanda, Democratic Republic of Congo, Kenya, Congo Brazzaville, Tanzania and Southern Sudan (Figure 3). Figure 5: Market Distribution of Uganda’s Manufactured Exports
Source: UEPB Bulletin 2006 It is clear that most of the exports go into the East African region, therefore the increasing integration of the East African Community and the liberalisation of cross border trade is likely to lead to an increase of manufactured exports into the Community but also imposes threats from manufactured imports, especially from Kenya. In the following paragraphs the national policies for the industrial sector of Uganda have been analysed.
24
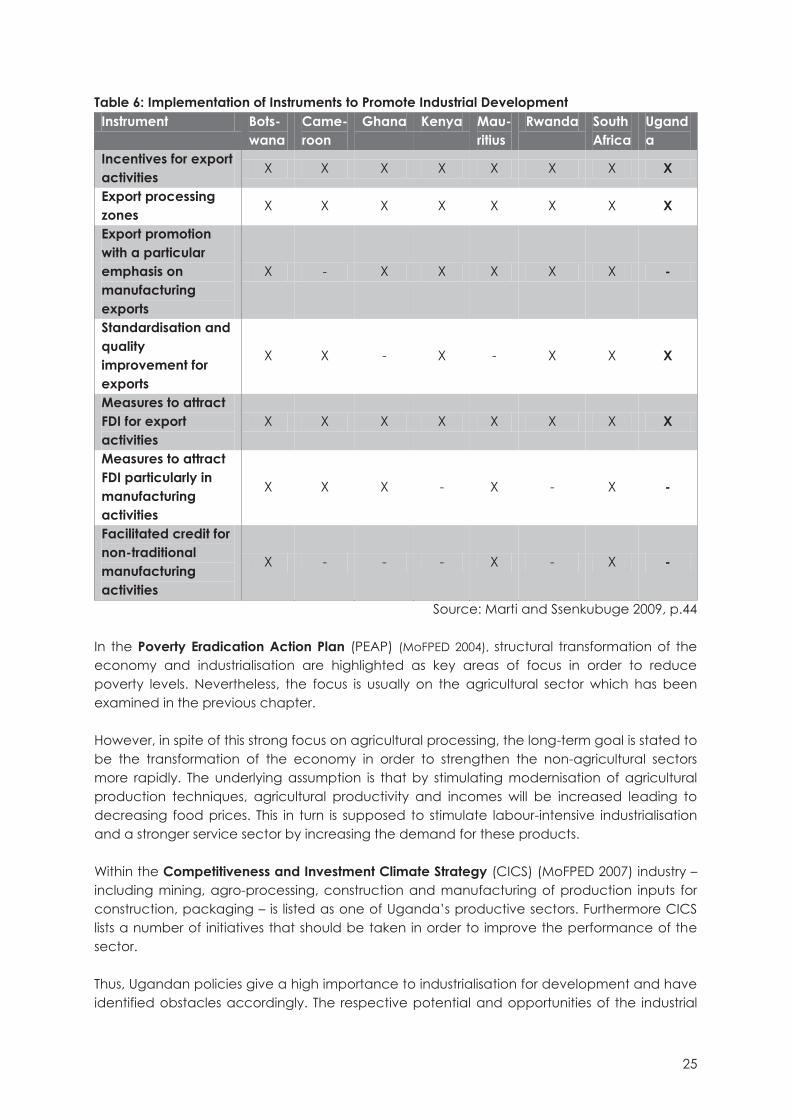
a) Importance in National Policies Looking at its policies and strategies, the GoU considers manufacturing to be important in order to diversify production and to add value to the existing resource base. Uganda’s Vision 2025 underlines the importance of diversification of production patterns as its core objective. However, most strategies that have been developed are basically to focus on the agricultural sector, only some cross-sectoral policies benefit manufacturing directly (Marti and Ssenkubuge 2009). Within the Ministry of Tourism, Trade and Industry, the Department of Industry and Technology is responsible for industrial policies. Furthermore, manufacturing companies are represented by the Uganda Manufacturers Association (UMA), the Uganda Chamber of Commerce and Industry, the Uganda Small-scale Industry Association and the Private Sector Foundation Uganda (PSFU). There are a number of policies which have been particularly helpful for the promotion of the industrial sector. The most important ones will be elaborated in the following paragraphs. In the introduction to the National Industrial Policy (NIP) (MTTI 2008), the Ugandan President Museveni states that “Transformation of Uganda’s economy is one of the fundamental goals and commitment of the […] government.” Later within the document it is explained that this transformation fundamentally relies on industrialisation as a driver for growth in combination with science, technology and innovation (MTTI 2008). A number of policy areas were identified to be implemented immediately: improvement of infrastructure (esp. electricity, water, transport and communications), business support services and better connection to rural areas. Furthermore, the financial sector is supposed to be strengthened in order to ensure improved access to finance. Other important areas for action are the institutional framework for investment and export promotion, skills development and training, business regulation (land reform, competition law), promotion of linkages and value chains and eliminating barriers to private investment (Marti and Ssenkubuge 2009). Finally, the Ugandan government has supported research for increased productivity and innovation through the foundation of the Uganda Industrial Research Institute. Especially, it supports the food science and technology, ceramics, engineering and manufacturing as well as entrepreneurship training. However, as can be seen in the following Table 6, in regional comparison Uganda employs the fewest instruments to initiate industrial development. There is no particular export promotion for manufacturing exports, or to attract FDI especially for manufacturing activities. Furthermore, the authors, Marti and Ssenkubuge (2009), found that there is no facilitation of credit for non-traditional manufacturing activities.
25
Table 6: Implementation of Instruments to Promote Industrial Development Instrument Bots-
wana Came-roon
Ghana Kenya Mau-ritius
Rwanda South Africa
Uganda
Incentives for export activities X X X X X X X X
Export processing zones X X X X X X X X
Export promotion with a particular emphasis on manufacturing exports
X - X X X X X -
Standardisation and quality improvement for exports
X X - X - X X X
Measures to attract FDI for export activities
X X X X X X X X
Measures to attract FDI particularly in manufacturing activities
X X X - X - X -
Facilitated credit for non-traditional manufacturing activities
X - - - X - X -
Source: Marti and Ssenkubuge 2009, p.44 In the Poverty Eradication Action Plan (PEAP) (MoFPED 2004), structural transformation of the economy and industrialisation are highlighted as key areas of focus in order to reduce poverty levels. Nevertheless, the focus is usually on the agricultural sector which has been examined in the previous chapter. However, in spite of this strong focus on agricultural processing, the long-term goal is stated to be the transformation of the economy in order to strengthen the non-agricultural sectors more rapidly. The underlying assumption is that by stimulating modernisation of agricultural production techniques, agricultural productivity and incomes will be increased leading to decreasing food prices. This in turn is supposed to stimulate labour-intensive industrialisation and a stronger service sector by increasing the demand for these products. Within the Competitiveness and Investment Climate Strategy (CICS) (MoFPED 2007) industry – including mining, agro-processing, construction and manufacturing of production inputs for construction, packaging – is listed as one of Uganda’s productive sectors. Furthermore CICS lists a number of initiatives that should be taken in order to improve the performance of the sector. Thus, Ugandan policies give a high importance to industrialisation for development and have identified obstacles accordingly. The respective potential and opportunities of the industrial
26
sector have been examined in the following paragraphs with focus on manufacturing, extraction and construction.
b) Potential for Development Uganda’s labour force in 2009 is estimated to be around 12 million compared to 9.8 million in 2002/3. However, out of this, only 10% are employed in the industrial sector. According to the National Industrial Policy (MTTI, 2008) Uganda’s labour force has been ranked 8th in the world when it comes to flexibility and 1st in Sub-Saharan African in terms of ‘ease of employing workers’. A liberal policy environment is not always considered to be positive. However, Uganda’s structural adjustments in the 1990s have widely been conceived as a major success story in Sub-Saharan Africa (Baffoe 2000). A number of reforms were implemented such as gradual privatisation of public enterprises, reduction of import tariffs, elimination of export taxes, harmonisation of tariffs within the East African Community (EAC) and trade liberalisation in general. According to the MTTI this has lead to increased GDP growth, increased foreign investment and a diversification of the productive and export base. Furthermore, the macro-economy has since then been rated as strong and stable. Inflation has been controlled at single digits since the mid-1990s (MTTI 2008, p.11). Another positive influence on potential growth of the industrial sector is the strong and growing service sector which potentially supports an enabling environment for industrial development, especially in relation to electricity and transport. This sector will be examined in more detail in chapter IV. When it comes to R&D, Uganda is at a relatively high level compared to other developing countries. The rating for innovation in the Global Competitiveness Report is unusually good (72nd in the 2008/2009 report, Porter and Schwab 2008). Another bonus is that the quality of scientific institutions is rated at 41st in the world, ranking Uganda among important nations such as China (37) and Brazil (43) (Porter and Schwab 2008, pp. 115, 135 and 333). However, when it comes to intellectual property protection and utility patents, as well as enrolment in tertiary education the picture looks much worse. For example in 2005, there were no utility and tertiary enrolment was only at 3%. Furthermore, expenditure on R&D is only at 0.8% of GDP. Even though it is at the same level as South Africa, South Africa employs a much larger number of researchers (over 300 per 1 million people) compared to Uganda (24 per 1 million people) (MTTI 2008). The market of East Africa, including 120 million people, offers large opportunities for Uganda due to its geographic position in the middle. In future, in addition to low cost goods and services, higher quality goods and services will be demanded due to increasing incomes. The two regional communities, EAC and COMESA, are potential high growth markets for industrial products of Uganda. Especially bordering countries (Southern Sudan, Eastern Congo, Burundi, Rwanda and Northern Tanzania) have huge market potential for industrial products due to their close proximity, which could give Uganda the opportunity to become the regional hub. However, as awareness about the regional market grows, lower cost suppliers will enter, which will eventually increase the competition. In the following paragraphs we look at the potential of individual industrial sub-sectors, which play an important role within the Ugandan economy.

27
i. Manufacturing The manufacturing sector has grown constantly, with increasing food processing activities as its main driver (Table 7). This agricultural based growth in food processing has also helped to cushion the manufacturing activities from the impact of the global financial crisis. After a decline in 2008, growth was registered in textiles, clothing and footwear as well as chemicals, paint, soap and foam products (MoFPED 2009, p.8). Manufacturing of metals and related products started declining in the second quarter of 2008 and continued this trend, resulting in a stark decline of 20.3% in the 1st quarter of 2009 (MoFPED 2009, p.8). This is accounted for by increased cost of production related to the depreciation of the Ugandan Shilling as well as lower demand after the contraction in the construction sub-sector (MoFPED 2009). Table 7: Index of Manufacturing Production (base 2002) Weight 2005 2006 2007 2008 Food Processing 400.2 110.0 117.0 125.6 137.8 Drinks & Tobacco 201.4 146.2 146.4 179.8 189.9 Textiles, Clothing & Foot Wear
42.5 164.8 135.3 163.3 141.7
Paper Products 35.3 124.7 132.2 149.3 164.6 Chemicals, Paint, Soap & Foam Products
96.6 130.4 131.5 145.3 123.6
Bricks & Cement 75.2 126.0 149.0 156.5 172.7 Metals & Related Products
82.8 124.9 131.6 140.3 129.5
Miscellaneous 66.1 129.5 121.5 137.8 143.6 Source: MoFPED 2009, p.16
As can be seen in the following Figure 6, food processing does not only represent the largest share of manufacturing output, it is also the biggest employer in the manufacturing sector. Employment has been rising steeper than those of other sub-sectors, but it slightly declined in 2006 which could be attributed to a decline in the number of establishments. Figure 6: Average Monthly Employment for Selected Manufacturing Establishments
Source: UBOS 2007, p.110 Furthermore, the manufacturing sector largely employs low-skilled workers and therefore has an income distribution effect towards the poor.

28
According to the trend in exports between 2001 and 2005, all manufactured exports, except exports of electric power, showed a significant growth rate as can be observed in the Table 8 below. The following 5 products were identified as leading growth products: chemicals (193%), furniture and related products (170%), plastic products (99.7%), sugar and sugar preparations (99%) and metal products. Table 8: Manufactured Exports by Product 2001-2005 (nominal, in US$ 000’)
Sitc2 Product 2001 2002 2003 2004 2005
Average annual growth
rate 06 Sugar & Sugar
Preparations 1,733 695 622 1,837 6,884 99.0 %
11 Beverages 2,047 2,248 2,552 2,893 7,228 46.6 % 35 Electric Current 10,554 15,645 13,779 12,074 4,860 -8.9 % 51-52 Chemicals 415 367 3,019 519 1,255 193.0 % 54 Medical &
Pharmaceutical Products
1,335 1,218 2,756 2,078 1,390 15.0 %
55 Essential Oils 4,056 4,529 7,377 10,785 13,172 35.7 % 57-58 Plastic Products 528 360 436 2,303 1,875 99.7 % 59 Chemical
Products 121 382 458 149 655 127.0 %
61 Leather Products
372 393 158 549 505 46.3 %
65 Textile Products 1,490 2,021 1858 2,832 5,258 41.5 % 66-69 Metal Products 6,210 6,911 14,834 23,114 64,461 90.2 % 82 Furniture,
bedding, Mattresses & their Supports
279 92 469 1835 2,730 170 %
Source: UBOS 2007 The manufacturing sector is largely exposed to the constraints common to most of the industrial sector which will be listed below. Especially power shortages and the lack of affordable finance, pose difficulties for production processes. In relation to exports the biggest problems are posed by the lacking infrastructure and the landlockedness.
ii. Extraction The extraction sector comprises mining, quarrying and oil and gas extraction and “establishments that extract naturally occurring mineral solids such as coal and ores, liquid minerals, such as crude petroleum; and gases such as natural gas.” (U.S. Census Bureau, 2007). The significance of mining and quarrying as well as oil extraction sectors have been examined in the following paragraphs.
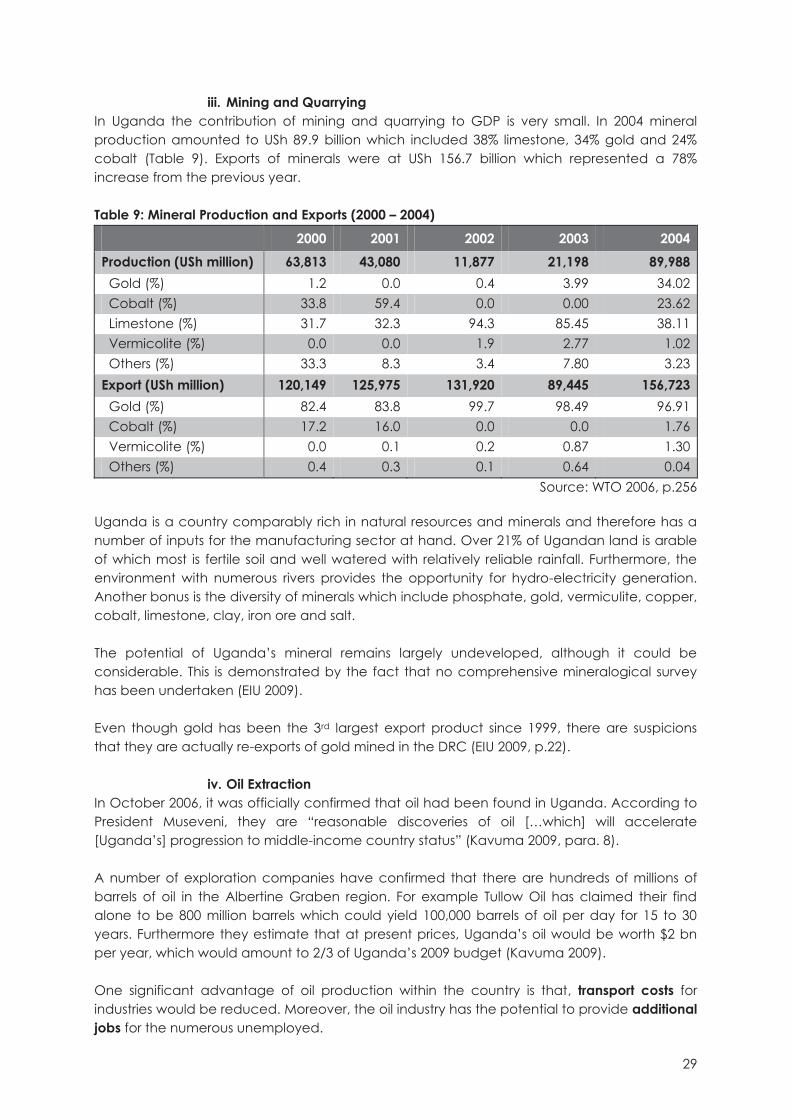
29
iii. Mining and Quarrying In Uganda the contribution of mining and quarrying to GDP is very small. In 2004 mineral production amounted to USh 89.9 billion which included 38% limestone, 34% gold and 24% cobalt (Table 9). Exports of minerals were at USh 156.7 billion which represented a 78% increase from the previous year. Table 9: Mineral Production and Exports (2000 – 2004) 2000 2001 2002 2003 2004 Production (USh million) 63,813 43,080 11,877 21,198 89,988 Gold (%) 1.2 0.0 0.4 3.99 34.02 Cobalt (%) 33.8 59.4 0.0 0.00 23.62 Limestone (%) 31.7 32.3 94.3 85.45 38.11 Vermicolite (%) 0.0 0.0 1.9 2.77 1.02 Others (%) 33.3 8.3 3.4 7.80 3.23 Export (USh million) 120,149 125,975 131,920 89,445 156,723 Gold (%) 82.4 83.8 99.7 98.49 96.91 Cobalt (%) 17.2 16.0 0.0 0.0 1.76 Vermicolite (%) 0.0 0.1 0.2 0.87 1.30 Others (%) 0.4 0.3 0.1 0.64 0.04
Source: WTO 2006, p.256
Uganda is a country comparably rich in natural resources and minerals and therefore has a number of inputs for the manufacturing sector at hand. Over 21% of Ugandan land is arable of which most is fertile soil and well watered with relatively reliable rainfall. Furthermore, the environment with numerous rivers provides the opportunity for hydro-electricity generation. Another bonus is the diversity of minerals which include phosphate, gold, vermiculite, copper, cobalt, limestone, clay, iron ore and salt. The potential of Uganda’s mineral remains largely undeveloped, although it could be considerable. This is demonstrated by the fact that no comprehensive mineralogical survey has been undertaken (EIU 2009). Even though gold has been the 3rd largest export product since 1999, there are suspicions that they are actually re-exports of gold mined in the DRC (EIU 2009, p.22).
iv. Oil Extraction In October 2006, it was officially confirmed that oil had been found in Uganda. According to President Museveni, they are “reasonable discoveries of oil […which] will accelerate [Uganda’s] progression to middle-income country status” (Kavuma 2009, para. 8). A number of exploration companies have confirmed that there are hundreds of millions of barrels of oil in the Albertine Graben region. For example Tullow Oil has claimed their find alone to be 800 million barrels which could yield 100,000 barrels of oil per day for 15 to 30 years. Furthermore they estimate that at present prices, Uganda’s oil would be worth $2 bn per year, which would amount to 2/3 of Uganda’s 2009 budget (Kavuma 2009). One significant advantage of oil production within the country is that, transport costs for industries would be reduced. Moreover, the oil industry has the potential to provide additional jobs for the numerous unemployed.
30
The suggested findings leave Uganda with the opportunity to export considerable amounts, as only 11,000 barrels per day are currently needed within the country (Kavuma 2009). This would improve the trade balance considerably. Museveni has claimed several times that any income from export taxes would be used to fund government programmes aimed for example at improving energy and transport infrastructure (Kavuma 2009). However, currently there is no existing infrastructure in order to extract the oil and even more importantly, to add value through refining it within the country. Considerable investments are needed before it becomes profitable. Also, there have been suggestions to refine the oil in Kenya. However, Museveni has underlined the importance of adding value within the country and announced that a refinery would soon be built. This is also confirmed in the latest Background to the Budget by the government (MoFPED 2009, p.64). A possible threat is that, the Production Sharing Agreements (PSAs) with the oil companies have not been disclosed by the government and Ugandans have demonstrated worries whether the benefits will be distributed fairly.
v. Construction Although local production and exports of inputs (clay and ceramic products including cement) have been on the increase, there is still significant room for growth which is represented by the increasing imports (55% in 2003) demonstrating accelerating demand (Bakunda 2008). Clearly there are close backward and forward linkages of the construction sector to other industries which either rely on the structures built within the sector or provide the input of construction materials. Therefore, a growing and improved construction sector has strong positive spillover effects. Especially through the development of infrastructure, an advanced construction sector would considerably improve conditions for other productive sectors by decreasing the transport costs significantly. There has been a large amount of donor funding for infrastructure works, as well as private transfers, which has lead to a continuously growth in this sector during recent years, an average of 12% between 2003 and 2007 (EIU 2009). Nevertheless, the construction sector in Uganda is relatively underdeveloped when looking at materials production and the capacity to undertake large projects. However, the industry has witnessed a large demand in the recent years. Between 2003 and 2007, the sector showed an average growth rate of 12%, making it one of the most buoyant sectors. However, still the output of local production of the required materials falls far short of demand and imports of these materials (EIU 2009). One important input into the construction sector is the cement industry. The PSFU has voiced concerns over the threat of cheap imports from outside the EAC and recommends a classification as a sensitive product and a CET of 40% (PSFU 2009, p.36).
31
c) Constraints to Development About all sub-sectors in industry face the same constraints to development. The unstable power supply has been identified to be the most important constraint, followed by inadequate infrastructure and finance. Further impediments highlighted at the enterprise level are inadequate managerial skills as well as compliance with international standards (MTTI 2008, p.11). These and other important shortcomings of the economic environment are discussed in the following paragraphs. When it comes to infrastructure Uganda ranks especially low in relation to electricity supply, port and railroad development as well as road quality. The Private Sector Foundation Uganda (PSFU 2009) highlights the problem of intermittent power supplies, high energy costs due to high tariffs, poor supply of power due to overloads and inadequate transmission equipment. This is especially unfortunate since Uganda is among the best energy endowed countries of the continent. Even though there have been a number of projects to bridge the supply shortfalls and give hope for a more stable supply, the situation is not expected to improve significantly until 2011. Uganda, being a landlocked country, has a comparative cost premium when it comes to exports and imports due to higher transport costs compared to coastal countries. The level of these additional costs has been estimated to be 2/3 of the freight costs from Mombasa to Europe by sea (UNCTAD 2001 cited in Bakunda 2008). According to UMA, the cost from Mombasa to Kampala is one of the highest in the world: Whereas transporting palm oil from Indonesia to Mombasa costs around 40 USD per tonne it costs 2 ½ that much from Mombasa to Kampala (PSFU 2009). Therefore, Uganda’s competitive advantage is in the products that use domestic inputs and raw materials and have a high value-weight ratio (MoFPED 2007). However, in relation to other countries in the region, Uganda can also act as a hub to countries with an even longer distance to the next port such as southern Sudan, eastern DRC or Rwanda. UNIDO points out that, even though landlocked low-income countries usually score the worst as they suffer from high transport costs, delays and dependence on the performance of other countries for access to markets, Uganda is among the top 15 performers in SSA. This means that it is served by a fairly efficient logistics industry (UNIDO 2009). In Uganda, there is a shortage of affordable finance, currently it can be obtained from commercial banks at high interest rates and short maturities. The margin between borrowing and lending rates is one of the highest in East Africa (9.8%, compared to Tanzania 6.9% and Kenya 8.2%) which is due to institutional weakness, low depth in the credit market, limited credit information for lenders and inadequate contract enforcement. Even though the Bank of Uganda (BoU) has introduced a number of initiatives, the impact remains limited (MTTI 2008, p.13).
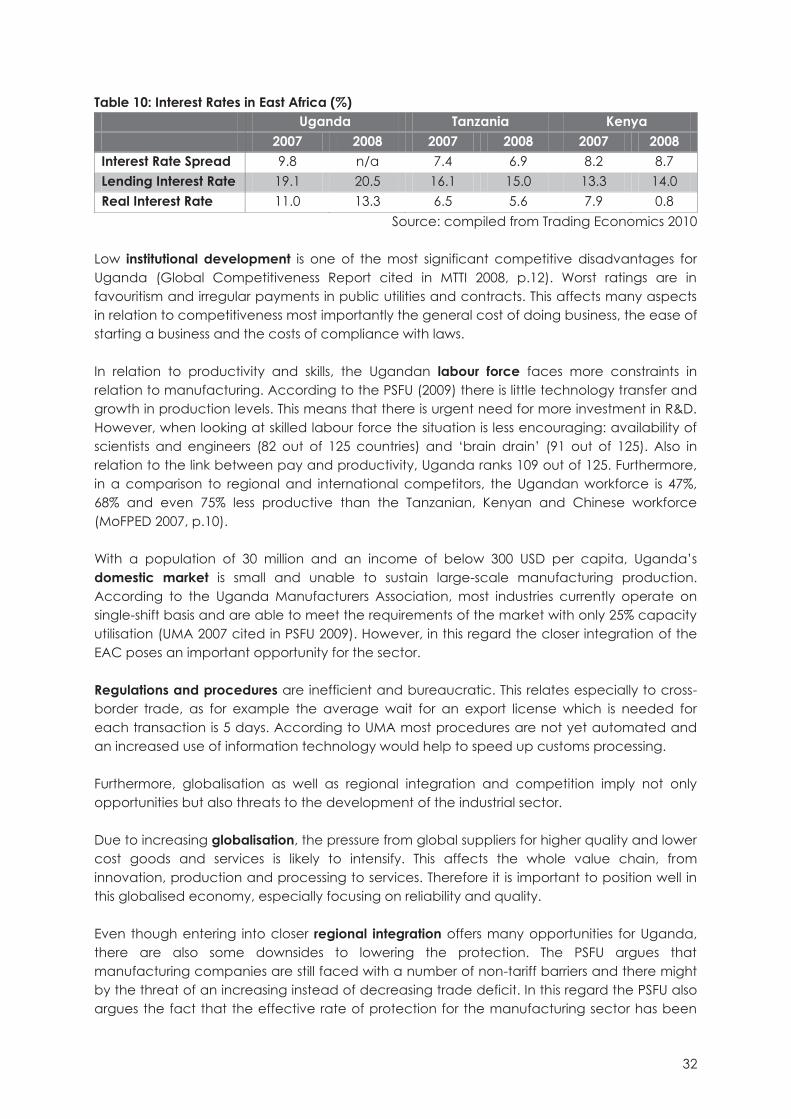
32
Table 10: Interest Rates in East Africa (%) Uganda Tanzania Kenya 2007 2008 2007 2008 2007 2008 Interest Rate Spread 9.8 n/a 7.4 6.9 8.2 8.7 Lending Interest Rate 19.1 20.5 16.1 15.0 13.3 14.0 Real Interest Rate 11.0 13.3 6.5 5.6 7.9 0.8
Source: compiled from Trading Economics 2010 Low institutional development is one of the most significant competitive disadvantages for Uganda (Global Competitiveness Report cited in MTTI 2008, p.12). Worst ratings are in favouritism and irregular payments in public utilities and contracts. This affects many aspects in relation to competitiveness most importantly the general cost of doing business, the ease of starting a business and the costs of compliance with laws. In relation to productivity and skills, the Ugandan labour force faces more constraints in relation to manufacturing. According to the PSFU (2009) there is little technology transfer and growth in production levels. This means that there is urgent need for more investment in R&D. However, when looking at skilled labour force the situation is less encouraging: availability of scientists and engineers (82 out of 125 countries) and ‘brain drain’ (91 out of 125). Also in relation to the link between pay and productivity, Uganda ranks 109 out of 125. Furthermore, in a comparison to regional and international competitors, the Ugandan workforce is 47%, 68% and even 75% less productive than the Tanzanian, Kenyan and Chinese workforce (MoFPED 2007, p.10). With a population of 30 million and an income of below 300 USD per capita, Uganda’s domestic market is small and unable to sustain large-scale manufacturing production. According to the Uganda Manufacturers Association, most industries currently operate on single-shift basis and are able to meet the requirements of the market with only 25% capacity utilisation (UMA 2007 cited in PSFU 2009). However, in this regard the closer integration of the EAC poses an important opportunity for the sector. Regulations and procedures are inefficient and bureaucratic. This relates especially to cross-border trade, as for example the average wait for an export license which is needed for each transaction is 5 days. According to UMA most procedures are not yet automated and an increased use of information technology would help to speed up customs processing. Furthermore, globalisation as well as regional integration and competition imply not only opportunities but also threats to the development of the industrial sector. Due to increasing globalisation, the pressure from global suppliers for higher quality and lower cost goods and services is likely to intensify. This affects the whole value chain, from innovation, production and processing to services. Therefore it is important to position well in this globalised economy, especially focusing on reliability and quality. Even though entering into closer regional integration offers many opportunities for Uganda, there are also some downsides to lowering the protection. The PSFU argues that manufacturing companies are still faced with a number of non-tariff barriers and there might by the threat of an increasing instead of decreasing trade deficit. In this regard the PSFU also argues the fact that the effective rate of protection for the manufacturing sector has been
33
declining since the 1990s and is one of the lowest in the world, poses a significant challenge towards the sector (PSFU 2009). Another challenge posed by the integration process is that, some products were zero-rated (i.e. not taxed) in Uganda in order to boost the manufacturing sector, however, in Kenya or Tanzania those were considered to be finished products and therefore fully taxed. This demonstrates that the necessary adjustment needed for an integration process might have adverse implications on the manufacturing sector of Uganda (MoFPED 2007). Apart from legal competition from other countries, there is also the challenge of dumped and smuggled goods especially from the Far East which largely affects the growth of infant industries as the products are usually sold at cheaper prices. Furthermore, there is the problem of counterfeit products due to weak laws regarding trademark and patent rights infringement.
d) Conclusions & Recommendations National policies articulate the importance of transforming the Ugandan economy towards more industrialisation, but unfortunately the progress has been slow, which can be due to a number of constraints. In Uganda, non-price factors seem to play a significant role in determining sectoral output, export orientation and export supply response of the manufacturing sector as is largely pointed out above. Therefore, it is suggested to focus on non-price factors in order to incentivise growth in the industrial sector. This, most importantly includes, improving infrastructure, supporting training to achieve manufacturing know-how and skills, improvement of international creditworthiness as well as substantial reduction in transport costs to the sea. One very important sub-sector where support lacks behind but has strong potential is the construction sector. Especially its positive spillover effect to other sectors is worth to note here. The reason for the low performance of the industrial sector could also be due to its competitive disadvantage. Many of the factors used for production as well as a favourable production environment and conditions for export do not exist in Uganda. It is therefore at hand to ask whether Uganda should step aside from the traditional path of industrialisation. However, development is hard to achieve with the help of agriculture, as witnessed in our previous paragraphs. Thus, in our next chapter we examine the potential of the service sector for development.
IV. Service Sector As Talemwa (2009) points out, with further integration of the East African Community (EAC), Kenya and Tanzania clearly have a relative advantage to become the manufacturing base due to their significant lower transportation and therefore production costs. Uganda, however, has shown potential for further development in the services sector which will be examined in the following paragraphs. Within trade, services have become increasingly important as pointed out by the General Agreement on Trade in Services (GATS) in the World Trade Organisation (WTO), which

34
provides for mechanisms for negotiating market access. Under GATS, 12 tradable services have been identified (UEPB and ITC 2005):
− Business (including computer and professional) services − Communication services − Construction and engineering services − Distribution services − Educational services − Environmental services − Financial (insurance and banking) services − Health services − Tourism and travel-related services − Recreational, cultural and sporting services − Transport services − Other services not included elsewhere
In Uganda, the service sector has played an important role in driving economic growth in recent years and according to the EIU (2009) it has been the most dynamic part of the economy. Important sub-sectors include trade-related activities, telecommunications, the financial sector and tourism. The service sector employs about 25% of the working population. However, the National Export Strategy states that 8 out of 10 new jobs created are provided by the services sector (UEPB and ITC 2005). The service sector accounted for 51.2% of the total GDP 2008/9 representing a growth of 9.4% per annum during this period (Table 11). The highest growth of 21.1% has been shown by the financial services sector, although commercial banking continued to be the highest contributor. Also the transport and communications sector has shown immense growth of 20% per annum, which has been largely driven by the posts and telecommunication sub-sector which presented a growth rate of 32.2% (MoFPED 2009).

35
Table 11: GDP Growth by Service Sub-Sector (constant 2002 prices, % change) 2004/5 2005/6 2006/7 2007/8 2008/9 Services (All) 6.2 12.2 8.0 10.2 9.4 Wholesale & Retail Trade, Repairs
7.2 12.3 10.4 14.7 7.6
Hotels & Restaurants 6.5 8.7 11.3 10.7 7.9 Transport & Communication
9.8 17.1 17.7 21.3 20.0
- Road, Rail & Water Transport
6.7 12.8 9.5 20.8 12.4
- Air Transport & Support Services
19.4 6.9 13.8 17.8 1.3
- Posts & telecom-munication
11.8 26.2 29.1 22.6 32.2
Financial Services 13.0 31.7 -11.9 24.1 21.1 Real Estate Activities 5.5 5.6 5.6 5.6 5.7 Other Business services
9.2 12.5 10.6 14.3 8.8
Public Administration & Defence
-5.4 15.8 -6.3 13.3 4.7
Education 4.4 9.4 10.6 -6.5 4.8 Health 5.6 12.9 2.7 -4.8 8.1 Other Personal & Community Services
15.0 14.1 13.4 12.8 12.3
Source: MoFPED 2009, p. 6
a) Importance in National Policies Within CICS (MoFPED 2007) the service sector is mentioned as one of the productive sectors of Uganda, particularly services like health, higher education, ICT and labour as well as enabling services such as banking, legal services and others. The tourism sector in Uganda is not included in services, but outlined as its own productive category. Within the PEAP (MoFPED 2004), it is pointed out that the services have the potential to develop a comparative advantage, but it is also warned of stiff competition in that sector. Therefore it is advised to place expenditure priorities in the service sector in order to support its development. The government is giving special emphasis on the planning to promote Uganda as a tourist destination, especially for cultural and domestic tourism (p.xix). The fact that a Uganda Service Sector Export Strategy (SSES) exists, shows the emphasis the government puts on that sector. Within this strategy the five sectors are identified to have export potential, have been examined below, namely Tourism, ICT, Education, Health and Labour Export. The tourism sector has been singled out for particular attention due to its potential as an invisible export. The Tourism Policy (2003) and a Tourism Marketing Strategy (2004-2008) further underline the importance of this sector and outline priority objectives and actions for development in this sector. In 2008 the parliament further approved the Uganda Tourism Bill which was aimed at boosting the sector. In addition to dealing with hotel laws, tourist agents’ law and the
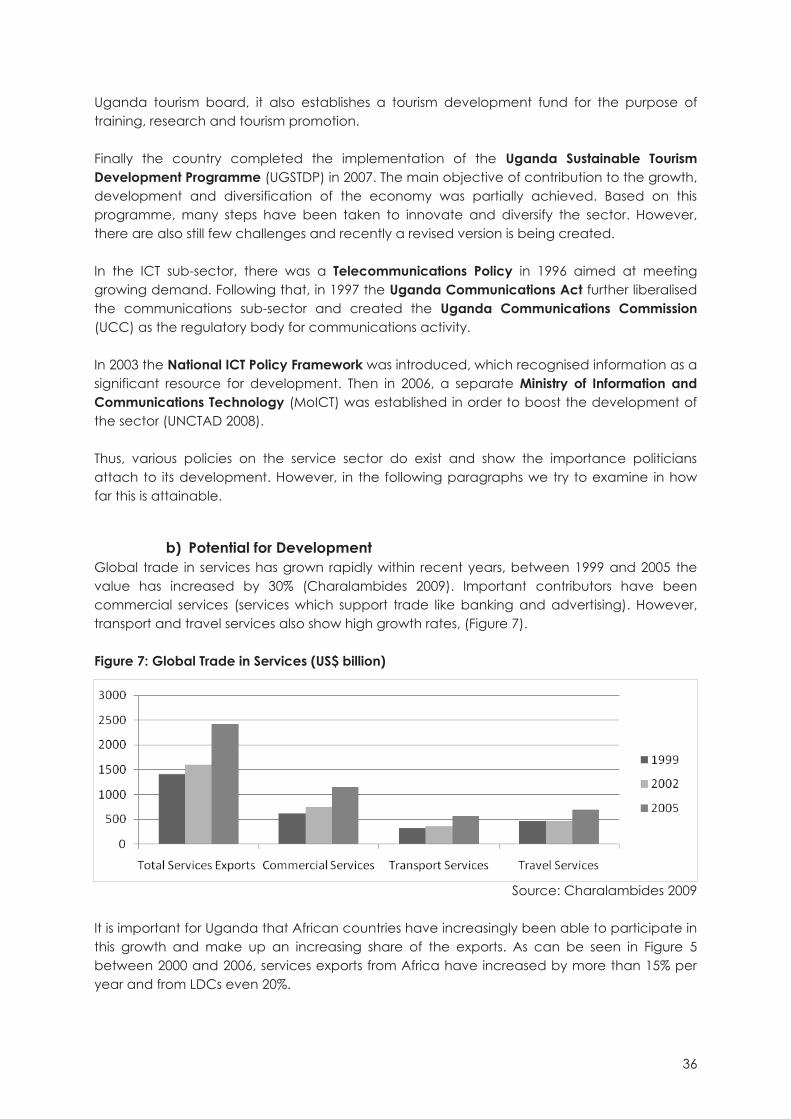
36
Uganda tourism board, it also establishes a tourism development fund for the purpose of training, research and tourism promotion. Finally the country completed the implementation of the Uganda Sustainable Tourism Development Programme (UGSTDP) in 2007. The main objective of contribution to the growth, development and diversification of the economy was partially achieved. Based on this programme, many steps have been taken to innovate and diversify the sector. However, there are also still few challenges and recently a revised version is being created. In the ICT sub-sector, there was a Telecommunications Policy in 1996 aimed at meeting growing demand. Following that, in 1997 the Uganda Communications Act further liberalised the communications sub-sector and created the Uganda Communications Commission (UCC) as the regulatory body for communications activity. In 2003 the National ICT Policy Framework was introduced, which recognised information as a significant resource for development. Then in 2006, a separate Ministry of Information and Communications Technology (MoICT) was established in order to boost the development of the sector (UNCTAD 2008). Thus, various policies on the service sector do exist and show the importance politicians attach to its development. However, in the following paragraphs we try to examine in how far this is attainable.
b) Potential for Development Global trade in services has grown rapidly within recent years, between 1999 and 2005 the value has increased by 30% (Charalambides 2009). Important contributors have been commercial services (services which support trade like banking and advertising). However, transport and travel services also show high growth rates, (Figure 7). Figure 7: Global Trade in Services (US$ billion)
Source: Charalambides 2009 It is important for Uganda that African countries have increasingly been able to participate in this growth and make up an increasing share of the exports. As can be seen in Figure 5 between 2000 and 2006, services exports from Africa have increased by more than 15% per year and from LDCs even 20%.
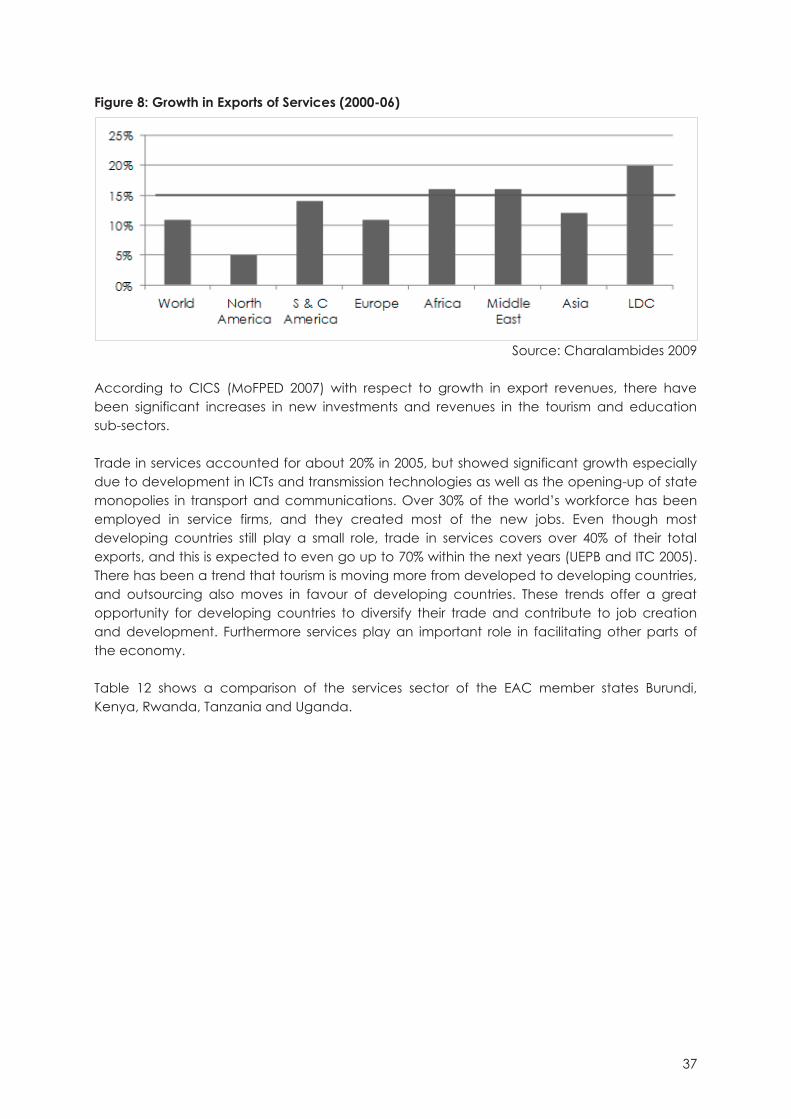
37
Figure 8: Growth in Exports of Services (2000-06)
Source: Charalambides 2009 According to CICS (MoFPED 2007) with respect to growth in export revenues, there have been significant increases in new investments and revenues in the tourism and education sub-sectors. Trade in services accounted for about 20% in 2005, but showed significant growth especially due to development in ICTs and transmission technologies as well as the opening-up of state monopolies in transport and communications. Over 30% of the world’s workforce has been employed in service firms, and they created most of the new jobs. Even though most developing countries still play a small role, trade in services covers over 40% of their total exports, and this is expected to even go up to 70% within the next years (UEPB and ITC 2005). There has been a trend that tourism is moving more from developed to developing countries, and outsourcing also moves in favour of developing countries. These trends offer a great opportunity for developing countries to diversify their trade and contribute to job creation and development. Furthermore services play an important role in facilitating other parts of the economy. Table 12 shows a comparison of the services sector of the EAC member states Burundi, Kenya, Rwanda, Tanzania and Uganda.
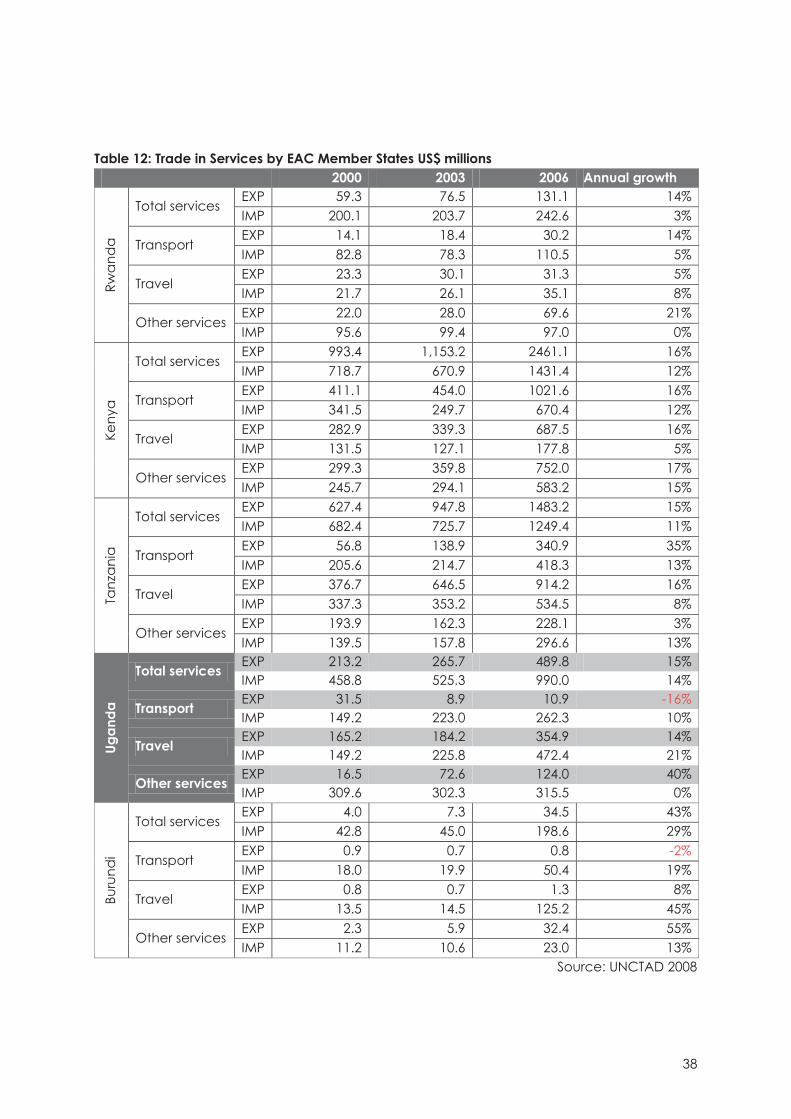
38
Table 12: Trade in Services by EAC Member States US$ millions 2000 2003 2006 Annual growth
Rwan
da
Total services EXP 59.3 76.5 131.1 14% IMP 200.1 203.7 242.6 3%
Transport EXP 14.1 18.4 30.2 14% IMP 82.8 78.3 110.5 5%
Travel EXP 23.3 30.1 31.3 5% IMP 21.7 26.1 35.1 8%
Other services EXP 22.0 28.0 69.6 21% IMP 95.6 99.4 97.0 0%
Keny
a
Total services EXP 993.4 1,153.2 2461.1 16% IMP 718.7 670.9 1431.4 12%
Transport EXP 411.1 454.0 1021.6 16% IMP 341.5 249.7 670.4 12%
Travel EXP 282.9 339.3 687.5 16% IMP 131.5 127.1 177.8 5%
Other services EXP 299.3 359.8 752.0 17% IMP 245.7 294.1 583.2 15%
Tanz
ania
Total services EXP 627.4 947.8 1483.2 15% IMP 682.4 725.7 1249.4 11%
Transport EXP 56.8 138.9 340.9 35% IMP 205.6 214.7 418.3 13%
Travel EXP 376.7 646.5 914.2 16% IMP 337.3 353.2 534.5 8%
Other services EXP 193.9 162.3 228.1 3% IMP 139.5 157.8 296.6 13%
Ugan
da
Total services EXP 213.2 265.7 489.8 15% IMP 458.8 525.3 990.0 14%
Transport EXP 31.5 8.9 10.9 -16% IMP 149.2 223.0 262.3 10%
Travel EXP 165.2 184.2 354.9 14% IMP 149.2 225.8 472.4 21%
Other services EXP 16.5 72.6 124.0 40% IMP 309.6 302.3 315.5 0%
Buru
ndi
Total services EXP 4.0 7.3 34.5 43% IMP 42.8 45.0 198.6 29%
Transport EXP 0.9 0.7 0.8 -2% IMP 18.0 19.9 50.4 19%
Travel EXP 0.8 0.7 1.3 8% IMP 13.5 14.5 125.2 45%
Other services EXP 2.3 5.9 32.4 55% IMP 11.2 10.6 23.0 13%
Source: UNCTAD 2008
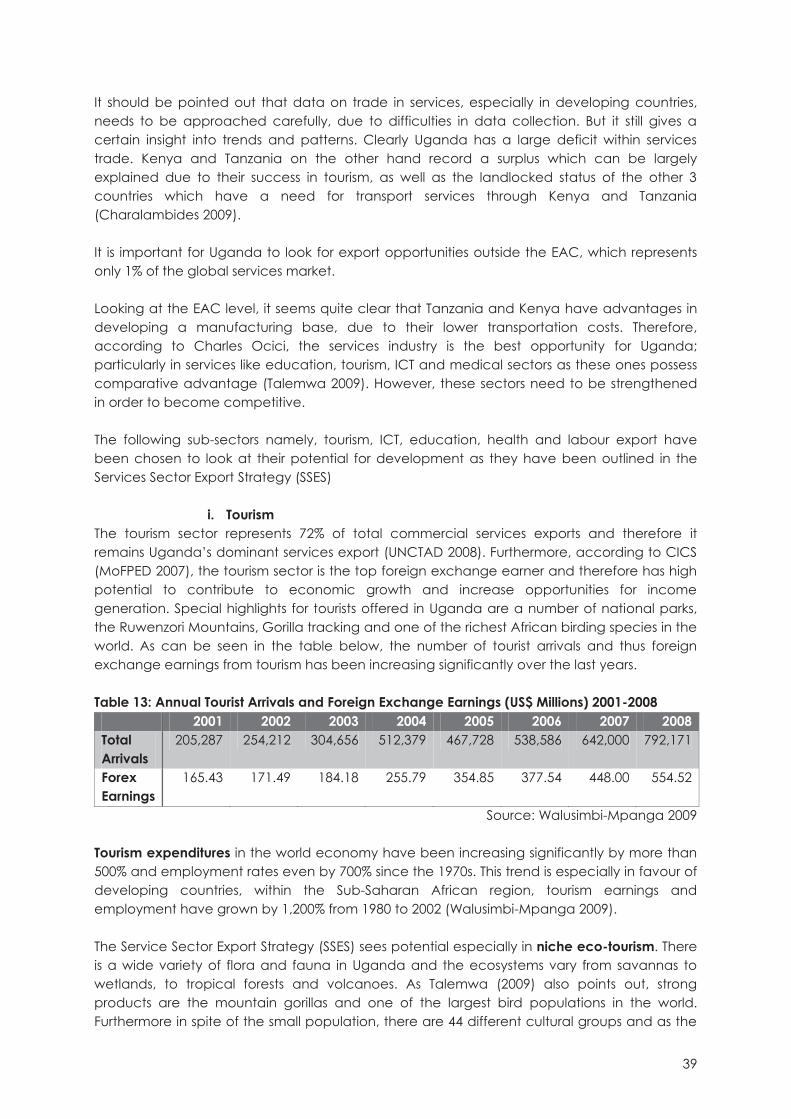
39
It should be pointed out that data on trade in services, especially in developing countries, needs to be approached carefully, due to difficulties in data collection. But it still gives a certain insight into trends and patterns. Clearly Uganda has a large deficit within services trade. Kenya and Tanzania on the other hand record a surplus which can be largely explained due to their success in tourism, as well as the landlocked status of the other 3 countries which have a need for transport services through Kenya and Tanzania (Charalambides 2009). It is important for Uganda to look for export opportunities outside the EAC, which represents only 1% of the global services market. Looking at the EAC level, it seems quite clear that Tanzania and Kenya have advantages in developing a manufacturing base, due to their lower transportation costs. Therefore, according to Charles Ocici, the services industry is the best opportunity for Uganda; particularly in services like education, tourism, ICT and medical sectors as these ones possess comparative advantage (Talemwa 2009). However, these sectors need to be strengthened in order to become competitive. The following sub-sectors namely, tourism, ICT, education, health and labour export have been chosen to look at their potential for development as they have been outlined in the Services Sector Export Strategy (SSES)
i. Tourism The tourism sector represents 72% of total commercial services exports and therefore it remains Uganda’s dominant services export (UNCTAD 2008). Furthermore, according to CICS (MoFPED 2007), the tourism sector is the top foreign exchange earner and therefore has high potential to contribute to economic growth and increase opportunities for income generation. Special highlights for tourists offered in Uganda are a number of national parks, the Ruwenzori Mountains, Gorilla tracking and one of the richest African birding species in the world. As can be seen in the table below, the number of tourist arrivals and thus foreign exchange earnings from tourism has been increasing significantly over the last years. Table 13: Annual Tourist Arrivals and Foreign Exchange Earnings (US$ Millions) 2001-2008 2001 2002 2003 2004 2005 2006 2007 2008 Total Arrivals
205,287 254,212 304,656 512,379 467,728 538,586 642,000 792,171
Forex Earnings
165.43 171.49 184.18 255.79 354.85 377.54 448.00 554.52
Source: Walusimbi-Mpanga 2009 Tourism expenditures in the world economy have been increasing significantly by more than 500% and employment rates even by 700% since the 1970s. This trend is especially in favour of developing countries, within the Sub-Saharan African region, tourism earnings and employment have grown by 1,200% from 1980 to 2002 (Walusimbi-Mpanga 2009). The Service Sector Export Strategy (SSES) sees potential especially in niche eco-tourism. There is a wide variety of flora and fauna in Uganda and the ecosystems vary from savannas to wetlands, to tropical forests and volcanoes. As Talemwa (2009) also points out, strong products are the mountain gorillas and one of the largest bird populations in the world. Furthermore in spite of the small population, there are 44 different cultural groups and as the
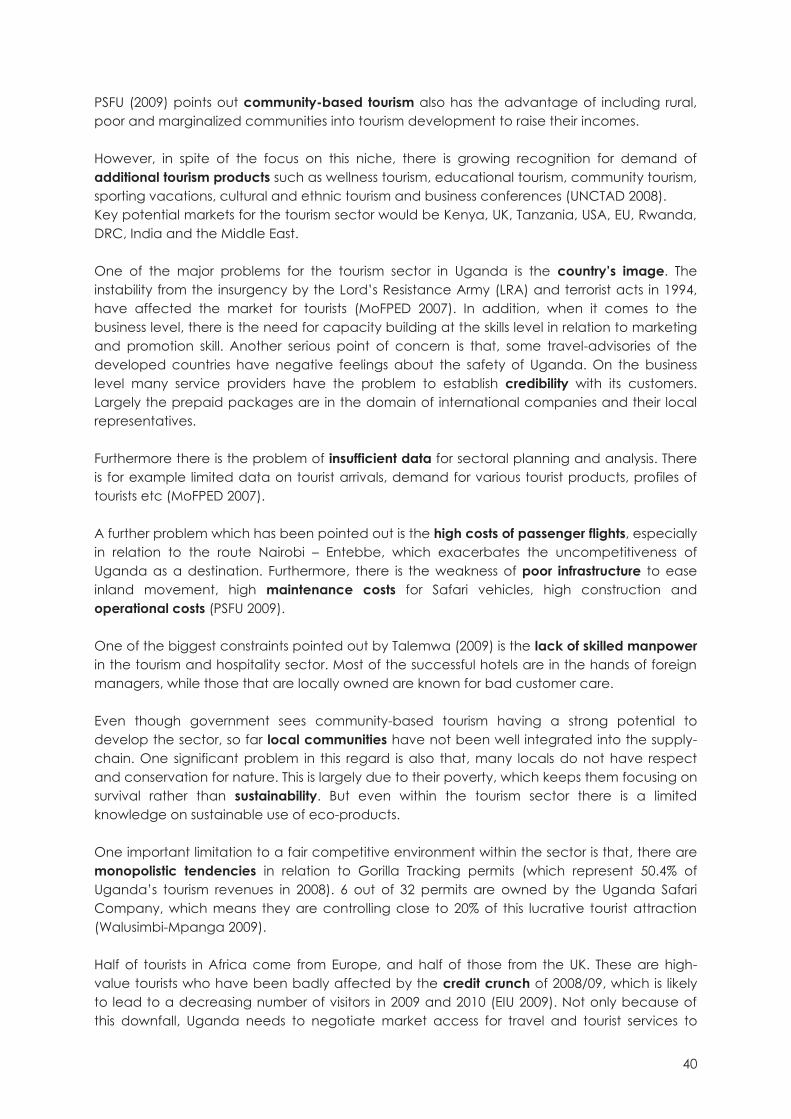
40
PSFU (2009) points out community-based tourism also has the advantage of including rural, poor and marginalized communities into tourism development to raise their incomes. However, in spite of the focus on this niche, there is growing recognition for demand of additional tourism products such as wellness tourism, educational tourism, community tourism, sporting vacations, cultural and ethnic tourism and business conferences (UNCTAD 2008). Key potential markets for the tourism sector would be Kenya, UK, Tanzania, USA, EU, Rwanda, DRC, India and the Middle East. One of the major problems for the tourism sector in Uganda is the country’s image. The instability from the insurgency by the Lord’s Resistance Army (LRA) and terrorist acts in 1994, have affected the market for tourists (MoFPED 2007). In addition, when it comes to the business level, there is the need for capacity building at the skills level in relation to marketing and promotion skill. Another serious point of concern is that, some travel-advisories of the developed countries have negative feelings about the safety of Uganda. On the business level many service providers have the problem to establish credibility with its customers. Largely the prepaid packages are in the domain of international companies and their local representatives. Furthermore there is the problem of insufficient data for sectoral planning and analysis. There is for example limited data on tourist arrivals, demand for various tourist products, profiles of tourists etc (MoFPED 2007). A further problem which has been pointed out is the high costs of passenger flights, especially in relation to the route Nairobi – Entebbe, which exacerbates the uncompetitiveness of Uganda as a destination. Furthermore, there is the weakness of poor infrastructure to ease inland movement, high maintenance costs for Safari vehicles, high construction and operational costs (PSFU 2009). One of the biggest constraints pointed out by Talemwa (2009) is the lack of skilled manpower in the tourism and hospitality sector. Most of the successful hotels are in the hands of foreign managers, while those that are locally owned are known for bad customer care. Even though government sees community-based tourism having a strong potential to develop the sector, so far local communities have not been well integrated into the supply-chain. One significant problem in this regard is also that, many locals do not have respect and conservation for nature. This is largely due to their poverty, which keeps them focusing on survival rather than sustainability. But even within the tourism sector there is a limited knowledge on sustainable use of eco-products. One important limitation to a fair competitive environment within the sector is that, there are monopolistic tendencies in relation to Gorilla Tracking permits (which represent 50.4% of Uganda’s tourism revenues in 2008). 6 out of 32 permits are owned by the Uganda Safari Company, which means they are controlling close to 20% of this lucrative tourist attraction (Walusimbi-Mpanga 2009). Half of tourists in Africa come from Europe, and half of those from the UK. These are high-value tourists who have been badly affected by the credit crunch of 2008/09, which is likely to lead to a decreasing number of visitors in 2009 and 2010 (EIU 2009). Not only because of this downfall, Uganda needs to negotiate market access for travel and tourist services to
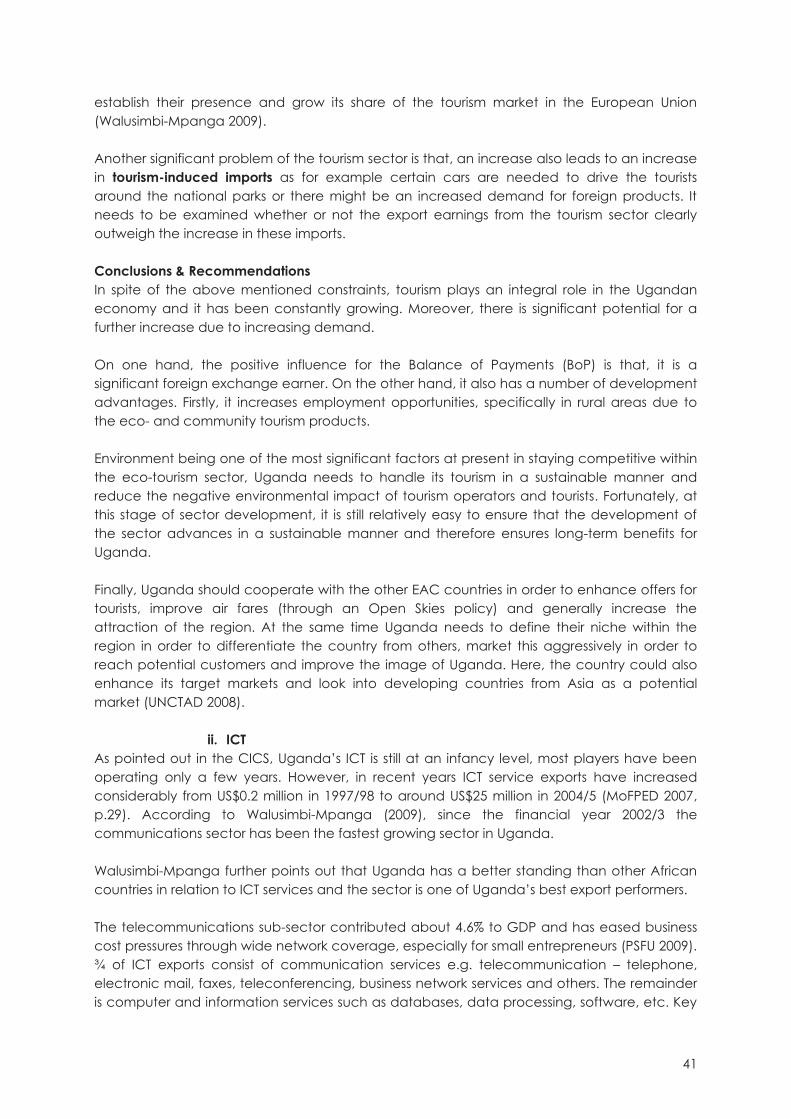
41
establish their presence and grow its share of the tourism market in the European Union (Walusimbi-Mpanga 2009). Another significant problem of the tourism sector is that, an increase also leads to an increase in tourism-induced imports as for example certain cars are needed to drive the tourists around the national parks or there might be an increased demand for foreign products. It needs to be examined whether or not the export earnings from the tourism sector clearly outweigh the increase in these imports. Conclusions & Recommendations In spite of the above mentioned constraints, tourism plays an integral role in the Ugandan economy and it has been constantly growing. Moreover, there is significant potential for a further increase due to increasing demand. On one hand, the positive influence for the Balance of Payments (BoP) is that, it is a significant foreign exchange earner. On the other hand, it also has a number of development advantages. Firstly, it increases employment opportunities, specifically in rural areas due to the eco- and community tourism products. Environment being one of the most significant factors at present in staying competitive within the eco-tourism sector, Uganda needs to handle its tourism in a sustainable manner and reduce the negative environmental impact of tourism operators and tourists. Fortunately, at this stage of sector development, it is still relatively easy to ensure that the development of the sector advances in a sustainable manner and therefore ensures long-term benefits for Uganda. Finally, Uganda should cooperate with the other EAC countries in order to enhance offers for tourists, improve air fares (through an Open Skies policy) and generally increase the attraction of the region. At the same time Uganda needs to define their niche within the region in order to differentiate the country from others, market this aggressively in order to reach potential customers and improve the image of Uganda. Here, the country could also enhance its target markets and look into developing countries from Asia as a potential market (UNCTAD 2008).
ii. ICT As pointed out in the CICS, Uganda’s ICT is still at an infancy level, most players have been operating only a few years. However, in recent years ICT service exports have increased considerably from US$0.2 million in 1997/98 to around US$25 million in 2004/5 (MoFPED 2007, p.29). According to Walusimbi-Mpanga (2009), since the financial year 2002/3 the communications sector has been the fastest growing sector in Uganda. Walusimbi-Mpanga further points out that Uganda has a better standing than other African countries in relation to ICT services and the sector is one of Uganda’s best export performers. The telecommunications sub-sector contributed about 4.6% to GDP and has eased business cost pressures through wide network coverage, especially for small entrepreneurs (PSFU 2009). ¾ of ICT exports consist of communication services e.g. telecommunication – telephone, electronic mail, faxes, teleconferencing, business network services and others. The remainder is computer and information services such as databases, data processing, software, etc. Key
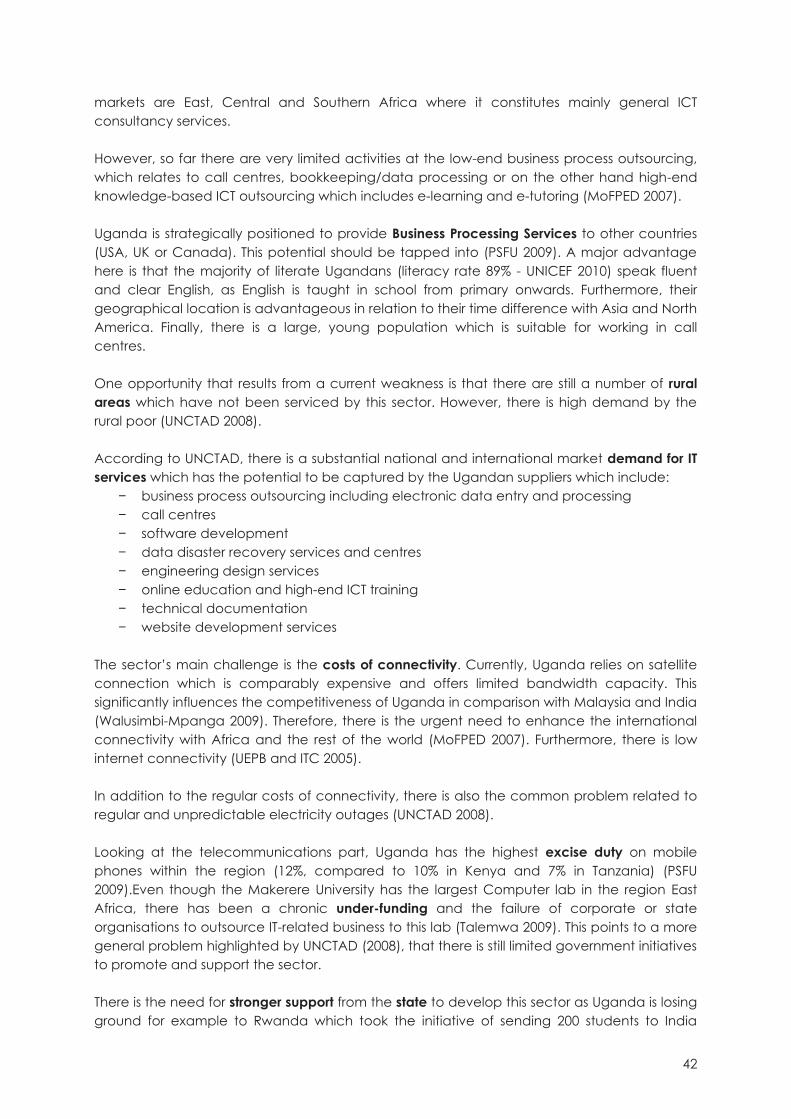
42
markets are East, Central and Southern Africa where it constitutes mainly general ICT consultancy services. However, so far there are very limited activities at the low-end business process outsourcing, which relates to call centres, bookkeeping/data processing or on the other hand high-end knowledge-based ICT outsourcing which includes e-learning and e-tutoring (MoFPED 2007). Uganda is strategically positioned to provide Business Processing Services to other countries (USA, UK or Canada). This potential should be tapped into (PSFU 2009). A major advantage here is that the majority of literate Ugandans (literacy rate 89% - UNICEF 2010) speak fluent and clear English, as English is taught in school from primary onwards. Furthermore, their geographical location is advantageous in relation to their time difference with Asia and North America. Finally, there is a large, young population which is suitable for working in call centres. One opportunity that results from a current weakness is that there are still a number of rural areas which have not been serviced by this sector. However, there is high demand by the rural poor (UNCTAD 2008). According to UNCTAD, there is a substantial national and international market demand for IT services which has the potential to be captured by the Ugandan suppliers which include:
− business process outsourcing including electronic data entry and processing − call centres − software development − data disaster recovery services and centres − engineering design services − online education and high-end ICT training − technical documentation − website development services
The sector’s main challenge is the costs of connectivity. Currently, Uganda relies on satellite connection which is comparably expensive and offers limited bandwidth capacity. This significantly influences the competitiveness of Uganda in comparison with Malaysia and India (Walusimbi-Mpanga 2009). Therefore, there is the urgent need to enhance the international connectivity with Africa and the rest of the world (MoFPED 2007). Furthermore, there is low internet connectivity (UEPB and ITC 2005). In addition to the regular costs of connectivity, there is also the common problem related to regular and unpredictable electricity outages (UNCTAD 2008). Looking at the telecommunications part, Uganda has the highest excise duty on mobile phones within the region (12%, compared to 10% in Kenya and 7% in Tanzania) (PSFU 2009).Even though the Makerere University has the largest Computer lab in the region East Africa, there has been a chronic under-funding and the failure of corporate or state organisations to outsource IT-related business to this lab (Talemwa 2009). This points to a more general problem highlighted by UNCTAD (2008), that there is still limited government initiatives to promote and support the sector. There is the need for stronger support from the state to develop this sector as Uganda is losing ground for example to Rwanda which took the initiative of sending 200 students to India

43
each year to study Computer Science on state scholarships (Talemwa 2009). This is also supported by UNCTAD (2008) who state as a weakness for the sector that there are limited government initiatives to promote and support the sector. Furthermore Walusimbi-Mpanga (2009) criticises that there is a weak institutional, legal and regulatory framework for example on intellectual property. Apart from the telecommunications sector, which has a rather mature regulator in the Uganda Communications Commission, the ICT sector remains without a law or regulator. As demonstrated by the ITC (2007 quoted in Walusimbi-Mpanga 2009) most companies would only offshore to locations with strong legitimate enforcement regimes for Intellectual Property Rights (IPR). Another important constraint of the sector is that many rural areas still lack access, or infrastructure to access, the telecommunications sector. A significant precondition for this is progress in advancing rural electrification (UNCTAD 2008). The Economic Intelligence Unit (EIU 2009) points out that, growth in telecommunication is likely to be lower in the future due to the fact that companies have to move down the value chain in order to attract new customers. Furthermore, it is likely that there will be strong competition from other countries in the region. As already mentioned Rwanda is also trying to establish itself in this sector and so far shows a number of initiatives to strengthen it. Conclusions & Recommendations It is a recognised fact that, the biggest constraints of this sector for further growth are power shortages and high costs of connectivity. Therefore, emphasis should be put on removing these obstacles as soon as possible. On the other hand, the highest growth potential is within Business Process Outsourcing (BPO). In order to advance this sector it is of critical importance to support R&D as well as skills development of IT professionals. The advantage of this sector as explained earlier is the positive effect on the Balance of Payment. At the same time, the sector also positively impacts on nearly all other economic sectors such as health, education, agriculture or the industry. In relation to living conditions the ICT sector has the potential to improve the delivery of social services as well as reduce the isolation of communities.
iii. Education The education sector is the largest employer in the formal employment category, employing about 32% of the workforce (Walusimbi-Mpanga 2009). It has significant importance for the general development of human resources within Uganda, and is featured in national and sectoral strategic investment plans as a key building block in the national development process. Within the SSES, the potential of this sector is pointed out as a key service export. The potential refers mainly to the higher education where institutions of higher learning, mainly universities, have attracted sizeable proportions of international students. Compared to primary and secondary schools where choice often depends on where parents work, students at the tertiary level choose institutions according to quality and competitiveness in the region. Therefore the focus in exports is at this level (UEPB and ITC 2005).
44
The higher education sub-sector comprises universities, polytechnics, teacher training and vocational institutions as well as specialised institutions in areas of health, agriculture, tourism, fisheries, forestry and cooperatives. At present, Uganda hosts over 40,000 international students in secondary schools and higher institutions from the EAC and COMESA (Walusimbi-Mpanga 2009). According to the MoFPED (2007), education has demonstrated significant growth and has considerable prospects for the future. However, it is still at a low level. Due to historical experience, Uganda has developed international recognition for its educational standards although that has faded in recent years (UEPB and ITC 2005). One main advantage is the fact that English is the medium of instruction. Potential for export at the tertiary sector is especially at the regional level to EAC and COMESA markets (UEPB and ITC 2005). There is a growing regional population in addition to an increasing desire of the parents for their children to receive good education. Both of these factors mean that the market size is increasing considerably. It has been criticised that, the sector is chronically underfunded and therefore shows falling standards (Talemwa 2009). Even though competition has increased with a larger number of private universities and declining government funding, the sector has done very little in order to market their services and it is still characterised by low export intensity (% foreign students). The fact that they are mostly inward-looking is because of increasing local demand, but also limited awareness of the potential for export. Furthermore, there is no support for international marketing by government in order to promote the export of education services. Moreover, institutions do not cooperate in order to market Uganda as a location for high quality education. Important statistical information on export is missing as no system has been put in place to find out the exact number of students and their profile. This makes demand analysis as well as future planning quite difficult. There is very poor infrastructure (classrooms, library, accommodation etc.) and facilities (computing facilities, scholastic materials etc.) which limits the opportunity to attract international students. Within Ugandan universities capacities for E-teaching/E-learning are inadequate. Most of the institutions do not have the financial resources in order to subscribe to international electronic libraries or do have any of their own. Computing facilities are being developed, but their capacities are still low (UEPB and ITC 2005). Ugandan service providers in the higher education sector have not embraced the opportunities presented through the internet such as Online Distance Learning, Virtual Universities, E-learning and Open Educational Resources. This poses an important barrier towards increasing exports in this sector (Walusimbi-Mpanga 2009). Especially universities have been disadvantaged by bandwidth limitations and had to rely on obsolete teaching methods.

45
Another important barrier is the lack of credibility of Ugandan education providers (Walusimbi-Mpanga 2009). While there has been historically a good image especially of Makerere University, this is decreasing due to lower quality standards. This has been supported by a weak regulatory regime and an inadequate quality assurance system. A big challenge for students coming to Uganda to study is that they face difficulties in translating their degrees or qualifications when they return home (‘portability of qualifications’). This currently even affects students from other EAC countries (Walusimbi-Mpanga 2009). Developed countries, especially UK, Australia, South Africa and Malaysia, represent important competitors of Uganda at tertiary institutions because they are marketing increasingly aggressively and enticing entry conditions. Conclusions & Recommendations The development potentials of education in general are clear. However, in this paper, we have mainly discussed the export potential. Even though Uganda has a historical potential to build its reputation on, this is dwindling and there needs to be a large effort in order to stop and reverse this process. As Charles Ocici (in Talemwa 2008) highlights, the most important step for government is to enforce good standards in order to keep up credibility. On the other hand there needs to be a lot of awareness and capacity building within educational institutions. A significant opportunity which should not be missed, and also needs to be significantly supported by the government, is the potential involved in integrating IT into the export of education.
iv. Health According to CICS this sector has considerable potential for the future. In the Background to the Budget 2008/9 (MoFPED 2009), it has been outlined as being of strategic importance to the development of Uganda. Especially in relation to its management of HIV/AIDS and other communicable diseases, Uganda has a high international reputation and therefore, there lies a significant potential for increasing the current volume of exports. While the SSES names a number of strengths and opportunities for the sector, there are also a number of constraints to them. For example, although there exists a number of trained and skilled medical personnel, the high migration rate of health professionals is also there. As mentioned above, Uganda has clearly shown important advances in the management of HIV/AIDS and other communicable diseases. And there is a large potential for exporting this within the EAC and COMESA markets as other countries are not at the same level with R&D and the production of medicine (UEPB and ITC 2005). As Talemwa (2009) criticises, Uganda produces the best health professionals in the region, but many leave in search for better pay and better working conditions (brain drain). Therefore there is a need for the government to invest in better facilities in order to improve the sectors potential. UEPC and ITC (2005) point out that the difficulty is especially to attract qualified staff to remote locations in-country.

46
Another weakness is that currently many actors in the sector are not aware of the trade aspects of health. Furthermore, there is inadequate promotion and marketing for the sector internationally as well as at the national level, in order to spread the word about the strengths of this sector in Uganda. Also, often at the institution level there is a lack of marketing skills which further enhances the problem. A significant factor is also that the public sector dominates the health sector and there is a bias for domestic services which limits internationalisation of health services. Finally, probably one of the most important weaknesses of the sector is that there is no patent on the Ugandan health expertise in HIV/AIDS management. Conclusions & Recommendations A qualitative and accessible health sector is of critical importance to the well-being of the people. For economic strength of a country, it is furthermore important to have a healthy and strong workforce. In Africa, and also specifically in East Africa, there is especially the need to deal with the threat of HIV/AIDS and other communicable diseases. Here Uganda has done an important advancement, and can be an important messenger in this regard. In order to be able to do that it is important to strengthen the awareness by promoting and marketing the sector internationally.
v. Kyeyo – Labour Export According to Bakunda and Walusimbi-Mpanga (2009) the export of labour is increasingly recognised as a pro-poor export possibility with positive development impacts. Due to the fact that it has low capital investment and risk, but high returns in forms of remittances, it can be seen as a profitable way of global trading. Its advantages are that it is considered more consistent than FDI or Official Development Assistance (ODA), because it does not depend on foreign government budgets company interests. Furthermore, it has been reported that remittances compensate for the limited spending on social services such as health and education (Bakunda and Walusimbi-Mpanga 2009). Within Uganda, there has been a steady growth of remittances since the 1990s from US$ 109.6 million in 1993 to US$ 1.4 billion in 2008 (Bakunda and Walusimbi-Mpanga 2009). The main reason for workers to leave the country is that the private sector in Uganda does not attract certain skills and that there is more gainful employment abroad. While Bakunda and Walusimbi-Mpanga criticise the fact that, there are no appropriate policies and procedures for successful management of the international labour migration system and that the National Employment Policy does not explicitly recognise export of labour, there has been a Labour Externalisation Unit established. Conclusions and Recommendations In regards to this sector the debate about potential for development of Uganda is particularly important. Labour export is highly critical; one of the most important and most quoted threats is brain drain. For the long-term development of a country, it cannot be a positive government strategy to encourage low- or high-skilled people to leave the country. Even though the employee of the Labour Externalisation Unit stated that until 2006 no money has flown into its promotion and since then very little, there must be more important areas of investment.
47
V. Conclusion & Recommendations: Uganda Throughout this analysis of the Ugandan case for development, it has been shown that the GoU puts emphasis on all three sectors of the economy; agriculture, industry and services. Nevertheless, there are huge constraints towards development faced by all these sectors. One of the most commonly mentioned constraint is the lack of infrastructure. For the agribusiness and the manufacturing sector this is relevant with respect to especially transport and power supply. In the service sector, the problem of transport infrastructure is not as pressing, but the lack of reliable and fast internet connectivity is hampering development in this sector as well. Moreover, the landlocked situation of Uganda gives rise to a relative advantage particularly to the products with a high value-to-volume and -weight ratio and the export of services. Realising the fact, the GoU has articulated it in various policies. Nevertheless, progress in any of the sectors is still hampered. According to the authors, this does not lie in false or lacking identification of obstacles to development, it rather comes from the lack of alignment of policies with respect to prioritise the sub-sectors as well as their effective implementation. With regard to Uganda’s competitive advantage in agricultural products and the most important source of employment, the agribusiness sector has to be promoted in the country’s path towards development. Agricultural mechanisation in Africa is a viable economic activity and the missing link in efficient utilisation, preservation and value addition in exploiting natural resources for improved quality of life; therefore agricultural mechanisation is a priority area requiring urgent and strategic investments by the GoU. Furthermore, the most dynamic sector, the services sector, which contributes the bulk of GDP and has the potential to generate significant foreign exchange earnings, has yet not reached its limit. It also needs to be considered, that a well functioning services sector can create a lot of important spillover effects to other sectors including the export potential of the goods sector. In addition, the service sector can increase local capacity and firm level development of competitiveness and innovation. It can create ‘clean jobs’ in relation to the environment and helps SME development (as low start-up capital is required). The industrial sector faces probably the most severe constraints towards its development. Nevertheless, the country can hardly afford to ignore the contribution which manufacturing can make to meet domestic demand and to support the balance of payments. With regards to exports and thus foreign exchange earnings, the prioritisation of export sectors by the GoU (MTTI 2007, p.34) seems to be insufficient. It differentiates between certain agricultural products, including coffee, fish, tea quite in detail, but treats the service and the manufacturing sector rather superficially. It might be important to reconsider this prioritisation in order to achieve better performance of the export sector. Thus, it is straightforward to argue, as several authors have done, that manufacturing, services and agriculture are all important, and broad policy steps to improve growth and employment across the economy are desirable (Singh 2006). But it is important to keep in mind that certain services sub-sectors, such as trade, transportation and communication, as well as the prioritisation of certain agricultural products may be particularly important. A focus on agricultural and service sector development could be more promising for the near future as fewer obstacles have to be overcome.
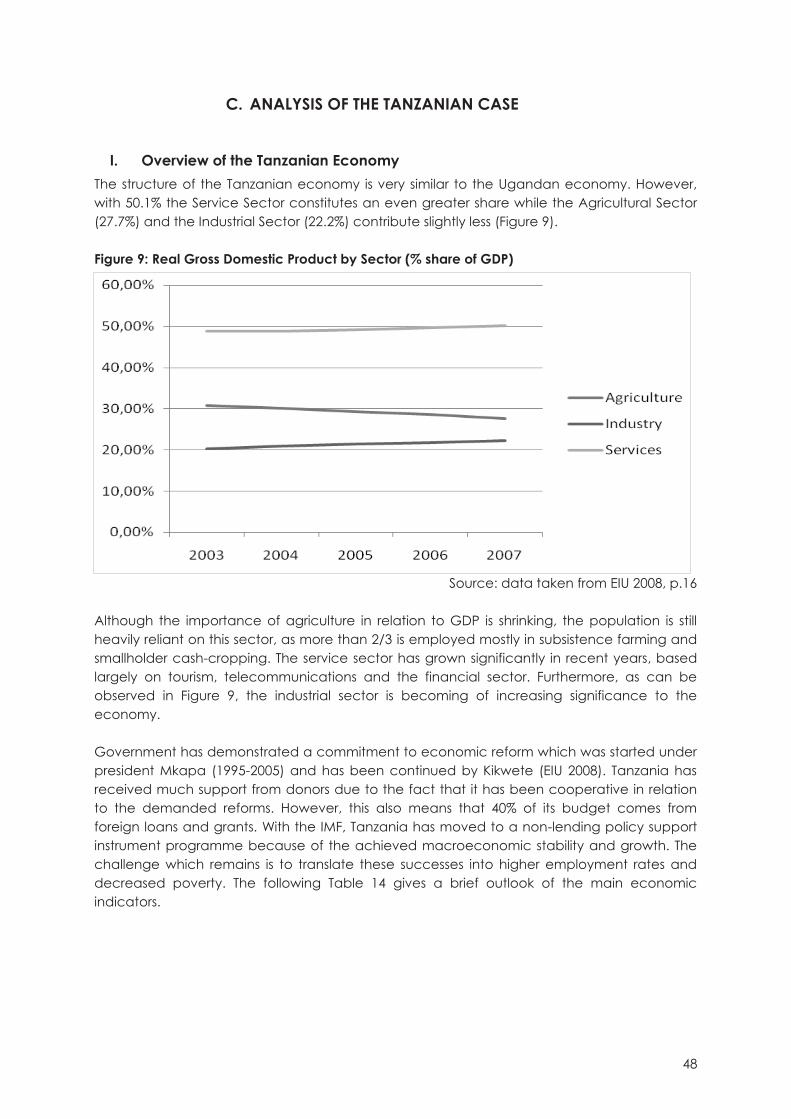
48
C. ANALYSIS OF THE TANZANIAN CASE
I. Overview of the Tanzanian Economy The structure of the Tanzanian economy is very similar to the Ugandan economy. However, with 50.1% the Service Sector constitutes an even greater share while the Agricultural Sector (27.7%) and the Industrial Sector (22.2%) contribute slightly less (Figure 9). Figure 9: Real Gross Domestic Product by Sector (% share of GDP)
Source: data taken from EIU 2008, p.16
Although the importance of agriculture in relation to GDP is shrinking, the population is still heavily reliant on this sector, as more than 2/3 is employed mostly in subsistence farming and smallholder cash-cropping. The service sector has grown significantly in recent years, based largely on tourism, telecommunications and the financial sector. Furthermore, as can be observed in Figure 9, the industrial sector is becoming of increasing significance to the economy. Government has demonstrated a commitment to economic reform which was started under president Mkapa (1995-2005) and has been continued by Kikwete (EIU 2008). Tanzania has received much support from donors due to the fact that it has been cooperative in relation to the demanded reforms. However, this also means that 40% of its budget comes from foreign loans and grants. With the IMF, Tanzania has moved to a non-lending policy support instrument programme because of the achieved macroeconomic stability and growth. The challenge which remains is to translate these successes into higher employment rates and decreased poverty. The following Table 14 gives a brief outlook of the main economic indicators.

49
Table 14: Main Economic Indicators 2003 2004 2005 2006 2007 Real GDP growth (%) 6.9 7.8 7.4 6.7 7.1 Consumer Price Inflation 3.5 4.1 4.4 6.2 7.0 Current Account Balance (US$ m) -118 -362 -862 -1,172 -1,856 External Debt (year end, US$ m) 6,991 7,805 7,780 4,198 4,382
Source: EIU 2008, p. 19 According to GDP growth rates, Tanzania has performed as one of the best countries in Sub-Saharan Africa in recent years. This growth was largely driven by the industrial and the services sectors, while the agricultural sector only grew at an average of 4.2% during the last 10 years. However, one problem here is that real GDP per head did not increase significantly due to the high population growth (EIU 2008). Another concern has been inflation, which rose up to its peak of 13.3% in February 2010 and although it has dropped back down to 7.9% in May 2010 it is not clear whether or not it will stay at that level (The East African 2010). Since the 1990s, when Tanzania started to liberalise trade, it has run a large structural trade deficit. Even though exports have shown an increase in recent years (largely due to hike in the gold price as this represents a large part of the export, see Table 15), this growth has not been able to keep up with the growth of imports. Between 2004 and 2007 the trade deficit has widened from 9% of GDP to 18% of GDP. According to the Economist Intelligence Unit (EIU 2008, p.24) a substantial increase in traditional exports will be needed if there is to be any major reduction in the trade deficit. Table 15: Main composition of trade (US$ m) 2002 2003 2004 2005 2006 Exports fob Gold 341.1 502.8 629.4 655.5 786.4 Cotton 28.0 47.5 82.5 111.5 55.8 Coffee 34.3 49.9 49.6 74.3 61.4 Cashew 49.0 39.1 69.4 46.6 39.4 Total exports including others 904.0 1,131.3 1,603.3 1,875.5 1,736.0 Imports cif Industrial Raw Materials 207.7 247.8 249.9 370.6 481.8 Consumer Goods 369.5 448.6 549.0 758.8 1,003.9 Machinery 367.2 415.9 449.6 676.5 931.1 Petroleum Products 195.6 404.7 415.1 516.2 728.9 Total imports including others 1,660.4 2,128.5 2,721.0 3,300.6 4,261.8
Source: Bank of Tanzania as cited in EIU 2008 This trend is further mirrored in the Current Account deficit, which also has increased significantly in recent years from 3.2% (2004) to 13% (2007). On the contrary, the capital account recorded a substantial surplus between 2002 and 2005 which is due to the fact that government borrowing has been at a rather high level and there have been increasing FDI inflows (though largely related to the gold sector) (EIU 2008). Tanzania has participated in the HIPC Initiative from multilateral institutions and debt relief has amounted to $1,391 million (HIPC) and $3,094 million (MDRI) in 2008 (Semboja 2009). Tanzania’s exports largely consist of unprocessed agro-based commodities. In 1990, cotton, coffee, sisal, tea, tobacco and cashew nuts accounted for over 62% of Tanzania´s export

50
earnings. However, this has significantly changed since then. In 2003 these traditional exports only contributed 20% to Tanzania’s export earnings. While this could represent a significant trend to processed goods, in Tanzania, this largely represents an increase in mineral exports (FAO 2006).
II. Agribusiness Sector “Because of the importance of agriculture in our development, one would expect that agriculture and the needs of the agricultural producers would be the beginning and the central reference point of all our economic planning. Instead, we have treated agriculture as if it was something peripheral, or just another activity in the country, to be treated at par with all the others, and used by the others without having any special claim upon them […]. We are neglecting agriculture. If we are not, every ministry without exception, and every parastatal and every party meeting would be working on the direct and indirect needs of the agricultural producers …We must now stop this neglect of agriculture. We must now give it the central place in all our development planning. For, agriculture is indeed the foundation of all our progress.”
Baba wa Taifa, the late Mwalimu Julius K. Nyerere In one of his speeches in 1982 (TNBC 2009, p.1)
The following Figure 9 highlights the development of selected major commodities in Tanzania during the time frame 1976 – 2008. Figure 10: Development of Major Commodities Production (1976 – 2008, in tons)
Source: TNBC 2009, p.4 It can be seen from the above table that, production (measured in tons) in these major crops has been relatively stable during the represented time period. When we look at the significant increase of population, however, this actually represents an important drop in production per capita. The agricultural sector is of significant importance because it provides more than 95% of food requirement as well as giving employment to about 70% of the population (MoAFSC 2008).
51
Due to this fact, the sector is of fundamental importance to the country, especially for poverty reduction and food security. There is a large number of subsistence farmers and therefore it is especially vulnerable to external shocks, which demonstrates the importance of diversifying the sector. At the same time, this also means that the agricultural sector is of significant importance when it comes to the country’s objectives in relation to growth and poverty reduction (FAO 2006, p.3). One of the major problems is that, agricultural production is very sensitive to fluctuations in weather conditions. This is relevant in Tanzania due to the fact that, agriculture largely relies on rain. Furthermore, there is considerable under-utilised land, largely cultivated by small-scale farmers. The main subsistence crops are maize, sorghum, millet, cassava, rice, plantains, wheat and pulses. On the other hand major cash crops are coffee, cotton, tobacco, cashew nuts, sisal and tea (EIU 2008).
a) Importance in National Policies There have been a number of policies and programmes initiated in order to improve the country’s agriculture, the most important ones are featured in the following paragraphs. Within the National Strategy for Growth and Poverty Reduction (2005), the importance of the agricultural sector is recognised. 18.7% of the population are below the national food poverty line, even 35.7% below the national basic needs poverty line. And this poverty is overwhelming in the rural areas (87%). In relation to this food security is of fundamental importance. The National Trade Policy (2003) points out the variety of natural resources that Tanzania has, as well as the positive strategic geographical location with regards to international and regional markets. In its objectives it does not clearly refer to the importance of agriculture. However, under the 5th and last objective the ‘ultimate target’ is said to be “…to enhance income generation and the people’s earning power at the grass-roots level as the key to poverty reduction in fulfilment of the fundamental human right of equal opportunity for all citizens” (Ministry of Industry and Trade 2003, p.17). This clearly points to the significance of dealing with the agricultural sector since most of the population (especially the poor population) is employed in this sector. Furthermore the third objective aims at “…the stimulation and encouragement of value-adding activities on primary exports” (p.17). Although this does not exclusively refer to agricultural products, cotton, coffee and cashew are the most important export products after gold. Within the implementation strategy, agriculture is called as one of the priority sectors, in relation to how this sector is supposed to be strengthened. However, the paper remains rather vague. The Budget Guidelines of the MFEA (2009) refer to the problem of rain-fed agriculture and state as one of the main strategies to rehabilitate and develop a new irrigation infrastructure, in order to attain self-sufficiency in food, as well as making Tanzania a grain reserve and source of industrial feedstock in the region.

52
Within the Tanzania Development Vision 2025, one of the main goals is to achieve food self-sufficiency and food security for its citizens. Furthermore, it is stated that, the economy should become more competitive with an increased productivity in all sectors. “The strategy to be adopted is that of transforming the economy from a predominantly agricultural one with low productivity to a diversified and semi-industrialised economy with a modern rural sector and high productivity in agricultural production which generates reasonably high incomes and ensures food security and food self-sufficiency” (p.13). It is recognised that, this change should be based on local resources and agro-industries (GoT 2000). Based on the Development Vision and the PRSP, an Agricultural Sector Development Strategy and an Agricultural Sector Development Programme were developed. The main objective is pointed out to be to “...create an enabling and conducive environment for improving profitability of the sector as the basis for improved farm incomes and rural poverty reduction...” (United Republic of Tanzania 2001, p. 4). The strategy points out the following as critical areas for improvement: the role of the government, improving the delivery of support services, boosting public and private investment, reforming the agricultural marketing system and reforming the legal framework, the land tenure system and taxation. However, according to the EIU these are likely to make little difference, as long as the sector still relies on rain-fed agriculture (EIU 2008). In 2009 the initiative “Kilimo Kwanza” (2009) – “agriculture first” – was launched in order to emphasise once again the importance of this sector and improve its development. The ten pillars in Table 16 represent the key issues, discussed in the context of Tanzania’s ‘Green Revolution’. Here are especially important pillars VII – IX as they refer to agricultural transformation and industrialisation of the sector. This resolution initiated a large debate within the country, it is to be seen whether or not the implementation will be successful. Table 16: Ten Pillars of Kilimo Kwanza
I. Political will to push our agricultural transformation II. Enhanced financing for agriculture III. Institutional reorganisation and management of agriculture IV. Paradigm shift to strategic agricultural production V. Land availability for agriculture VI. Incentives to stimulate investments in agriculture VII. Industrialisation for agricultural transformation VIII. Science, technology and human resources to support agricultural transformation IX. Infrastructure development to support agricultural transformation X. Mobilisation of Tanzanians to support and participate in the implementation of KILIMO KWANZA
Source: Agricultural Council of Tanzania (ACT) 2009 Thus, it can be seen that the government has a number of initiatives prioritising agriculture and its development. However, the Economist Intelligence Unit points out some criticism of the progress. According to them, while the government has launched a number of support programmes for the sector, fundamental reforms are missing as for example in relation to land ownership. Furthermore, there seems to be a problem of different interests within the government. While the president demonstrates support, some members of the parliament and the civil servants are still closely connected to Tanzania`s socialist past and therefore try to circumvent reforms (EIU 2008).

53
b) Potential for Development As mentioned earlier, the agriculture of a country is of significant importance for a number of reasons: as source of food, as source of income, as source of exchange earnings or as source of industrial raw material. Therefore, when looking at its potential for development, there are also a number of factors to consider. The TNBC has chosen a number of strategic agricultural products as part of its agricultural development effort, which we present in the following Table 17: Table 17: Strategic Crops for Agricultural Transformation
Category of Crops Selected Crops in order of Priority Country’s Food self-sufficiency Maize, Beans, Wheat, Paddy and Cassava Meat and Meat Products’, Fish and other marine products
Beef, Fish and Fish Fillet, other marine products including Prawns
Crops involving the least financial technology and minimal rain requirements; short gestation; a growing domestic/external demand; an important source of industrial raw material; large scale job creation; potential for participation by the largest possible number of farmers
Oil seeds – Safflower, Sunflower; Cotton and Palm Oil
Crops in which Tanzania retains comparative advantage in terms of domestic and/or export market demand
Sisal, Sugar cane and Cashew nuts
Other crops which are currently a source of livelihood of the many Tanzanians and for which they are familiar with the production conditions and methods
Lead Tea, Coffee and Pyrethrum
Source: TNBC 2009, p.15-16 From these, we have chosen to examine the potential for development of maize, wheat, fish and fish products, cotton, cashew and coffee. As elaborated above, and as has been recognised by the Tanzanian government as well, value addition of the primary products is of critical importance to the development of the country. Therefore, we discuss the potential with this focus.
i. Maize In Tanzania, maize is the most widely produced as well as consumed grain. The importance of this crop has been recognised and increasing investment has lead to increasing production (as can be seen in Table 18). However, this increase has still fallen short of its demand. This is predicted to continue for the next 5 years by Business Monitor International. While the expected expansion of the production is 27% until 2013/14, the consumption is also expected to increase 26.8% during the same time frame. Therefore, Tanzania still needs to rely on imports of maize in order to meet the demand (Companies and markets 2010).
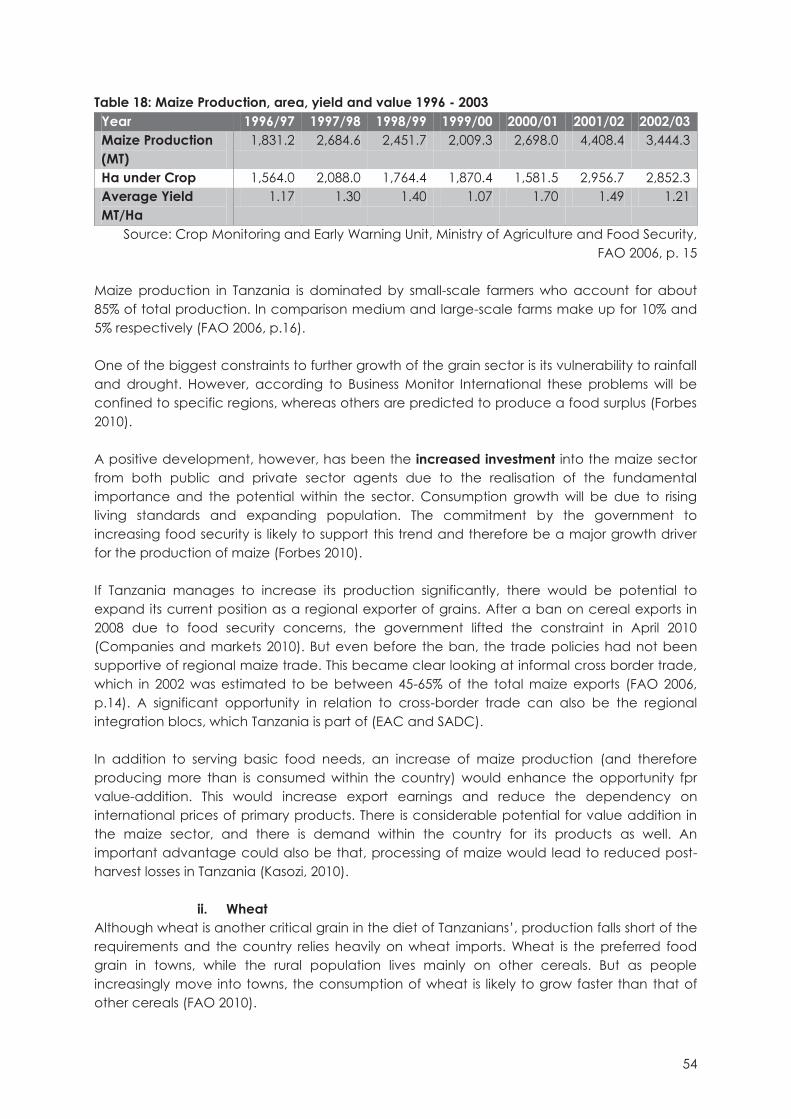
54
Table 18: Maize Production, area, yield and value 1996 - 2003 Year 1996/97 1997/98 1998/99 1999/00 2000/01 2001/02 2002/03 Maize Production (MT)
1,831.2 2,684.6 2,451.7 2,009.3 2,698.0 4,408.4 3,444.3
Ha under Crop 1,564.0 2,088.0 1,764.4 1,870.4 1,581.5 2,956.7 2,852.3 Average Yield MT/Ha
1.17 1.30 1.40 1.07 1.70 1.49 1.21
Source: Crop Monitoring and Early Warning Unit, Ministry of Agriculture and Food Security, FAO 2006, p. 15
Maize production in Tanzania is dominated by small-scale farmers who account for about 85% of total production. In comparison medium and large-scale farms make up for 10% and 5% respectively (FAO 2006, p.16). One of the biggest constraints to further growth of the grain sector is its vulnerability to rainfall and drought. However, according to Business Monitor International these problems will be confined to specific regions, whereas others are predicted to produce a food surplus (Forbes 2010). A positive development, however, has been the increased investment into the maize sector from both public and private sector agents due to the realisation of the fundamental importance and the potential within the sector. Consumption growth will be due to rising living standards and expanding population. The commitment by the government to increasing food security is likely to support this trend and therefore be a major growth driver for the production of maize (Forbes 2010). If Tanzania manages to increase its production significantly, there would be potential to expand its current position as a regional exporter of grains. After a ban on cereal exports in 2008 due to food security concerns, the government lifted the constraint in April 2010 (Companies and markets 2010). But even before the ban, the trade policies had not been supportive of regional maize trade. This became clear looking at informal cross border trade, which in 2002 was estimated to be between 45-65% of the total maize exports (FAO 2006, p.14). A significant opportunity in relation to cross-border trade can also be the regional integration blocs, which Tanzania is part of (EAC and SADC). In addition to serving basic food needs, an increase of maize production (and therefore producing more than is consumed within the country) would enhance the opportunity fpr value-addition. This would increase export earnings and reduce the dependency on international prices of primary products. There is considerable potential for value addition in the maize sector, and there is demand within the country for its products as well. An important advantage could also be that, processing of maize would lead to reduced post-harvest losses in Tanzania (Kasozi, 2010).
ii. Wheat Although wheat is another critical grain in the diet of Tanzanians’, production falls short of the requirements and the country relies heavily on wheat imports. Wheat is the preferred food grain in towns, while the rural population lives mainly on other cereals. But as people increasingly move into towns, the consumption of wheat is likely to grow faster than that of other cereals (FAO 2010).
55
One significant constraint of the wheat sector is that, production depends almost entirely on the rainfall. Of the potential 933,000 ha irrigable land, at present only 144,000 ha are under partial or full irrigation. (FAO 2010) Opportunities, on the contrary, are demonstrated by the large international demand which has been demonstrated by the high price in the international market. In July of 2010 the prices soared 42 %, which has been called the highest monthly increase in the last 51 years. However, as with other unprocessed products, Tanzania’s wheat exports are very vulnerable to possible price decreases in the international market (The Citizen 2010). Also, in order to profit from the increasing prices, Tanzania needs to increase overall production considerably. This year the situation looked quite the opposite, as food and foodstuff imports increased by 21.5% during 2010 (up to August). According to the Bank of Tanzania, this is largely due to rising wheat imports. As with Maize, there is considerable potential for further processing of Wheat within the country. However, little encouragement has been provided specifically for this sector.
iii. Fish and Fish Products Of Tanzania’s total area (886,037 km²), a considerable share (276,920 km²) is water. In 2005, the fisheries comprised 324.21 million US$ of the GDP. Employment within the primary sector was rather low (171,793 workers) compared to the secondary sector (2,000,000 workers). The sector has a positive trade balance, with the value of imports at 540,000 US$ while the exports are at 145,244,000 US$ (FAO 2007). Until now there is a little value addition in the fish sector in Tanzania; fish and fishery products are mainly exported in a fresh, chilled or frozen state. A small amount of Tanzania’s exports are sun-dried or smoked fish, but those only go to the neighbouring countries. Opportunities for value addition in this sector are numerous, including fish products such as ready-to-eat fish, fish fingers, fish balls, marinated fish, fish sausages and many more (FAO 2007). According to the EIU, there is considerable potential within this sector. Studies by the Tanzanian government indicate that the country still has a lot of offshore potential which could be exploited in a sustainable manner. Furthermore, in the Lake Victoria 650,000 tonnes of Nile perch are seen as sustainable without risking a depletion (EIU 2008). However, there are a number of constraints still prevailing for the sector, which is elaborated in the following paragraph. Constraints There is a significant shortage of modern fishing equipment in order to facilitate improved fishing practices (EIU 2008). Another problem in this regard is that, an increased use of illegal fishing gears as well as methods has been observed. Therefore, there are certain species of fish that are very close to depletion (eg. Prawns and Nile perch) and their consumption needs to be controlled. In this regard it is important to improve human and financial capacity infrastructure in order to achieve sustainable management of the resources (MFEA 2009, p.18).
56
iv. Cotton Tanzania is Africa’s 5th-largest lint cotton producer by volume (Ojambo 2010), most of which is exported. In 2008, cotton was Tanzania’s 3rd-largest export earner just after tobacco and coffee. Major input being labour, about 500,000 rural farmers are growing cotton on about 485,000 hectares of land. According to Karega (2010), cotton can play an important role in raising incomes and organic cotton production by smallholder farmers can ensure long-term returns without having to reinvest. Until 1994, cooperative unions and the Tanzanian Cotton Board had a monopoly on marketing and trade. Although reforms lead to an increased producer share in export prices, official statistics show no evidence of a supply response. Even worse, the quality of cotton showed considerable deterioration (Baffes, 2002, p.1). In August 2010, the Tanzania Cotton Board announced that, Tanzania would start growing genetically modified cotton and offer a better support system to farmers in order to increase the output significantly. Access to credit is supposed to be improved. According to the board, commercial banks had agreed to offer loans for contract farming and the government has finalised plans to set up an agricultural bank. Furthermore, more reliable extension services are supposed to be provided in a collaboration of the private sector and government. The lint cotton output is expected to rise 26,000 metric tons by 2014-15 in addition to the current production (90,000 metric tons) (Ojambo, 2010). Another positive trend is the popularisation of organic cotton farming. It is planned for an organic cotton production training centre for the farmers, in the Central Corridor. In addition to that, the centre is supposed to provide market information (Karega, 2010). As described above, value addition in this sector is limited, especially due to the strong competition from Asia. In the following paragraphs we provide an overview of the constraints to the cotton sector. Constraints According to Karega (2010), there are crop-marketing problems, processing inefficiency and the shortage of inputs. Another problem that has been mentioned is the lack of private sector investments in the region. Unfortunately, quite similar to many other raw materials, the prices are very instable, particularly after the global financial crunch in 2008, when cotton prices plummeted (Karega 2010). This hit the cotton sector badly and according to the Tanzania Cotton Board it might have only survived due to an economic stimulus package, as it helped raising the prices for farmers. At the end of 2010, the prices became stable once again and even were expected to rise considerably due to Pakistan’s flooding and subsequent reduction in the harvests. This is expected to push the country’s major foreign exchange earner to a record high towards the end of the season (Hamisi, 2010). In 2002, the World Bank economist Baffes pointed to the inadequate infrastructure in Tanzania and called it “… one of the poorest in the region” (Baffes 2002, p.9). He points out that it is not sector-specific, but an economy-wide problem, which is critical to address. However, in the cotton sector especially the quality of the rail system is of critical importance. Furthermore, improvement of the road network in the Mwanza region would reduce transportation costs considerably.

57
Another problem pointed out by Baffes is that there is no functioning taxation of the sector. The system is too complex with a number of taxes, levies and fees on district and central government levels.
v. Coffee Coffee is a major cash crop and key export of the Tanzanian economy. According to the Business Monitor International, strong production growth is expected for the Tanzanian coffee sector, an average 37% up to 2013/14 (PRLog 2010). The basis for this is the increasing export demand and various efforts to boost production. However, domestic consumption is also anticipated to grow by 39%, but from a much smaller base which still leaves the larger share for export. The benefits arising from rising incomes and marketing efforts aimed at increasing domestic consumption (Companiesandmarkets 2010). As elaborated above and earlier also by von Toll (2009), value addition potential in the coffee sector within East Africa is rather limited. Especially the impact on farmers’ incomes is not likely to increase. The constraints of the sector are elaborated in the following paragraphs. Constraints According to the Managing Director of Amimza, Coffee Production Company in Tanzania, the major constraints of the coffee industry are the coffee auctions, which are run with very bureaucratic procedures (Amir 2009). Secondly, the lack of good transport infrastructure, lead to high transport costs. This point is also underlined by Business Monitor International, who point out the need for infrastructure improvement (Companiesandmarkets 2010). For exports, a significant problem is poor shipping administration. And finally the Managing Director points out the cumbersome process of licensing which includes going to the Coffee Board of every District every year (Amir 2009). However, the most important threat for the coffee sector is the fluctuating commodity prices in the world market. However, according to the Business Monitor International, the coffee industry will introduce increasingly measures in order to protect producers from fluctuating prices. In July 2010, indicative prices were launched in order to prevent the private buyers and middlemen to cheat the farmers. Therefore it should also encourage farmers to raise quantity and quality of coffee production for export (Companiesandmarkets 2010).
c) Conclusions for the Agribusiness Sector: Tanzania The Tanzanian government has put an important focus on the agricultural sector and has implemented a number of supporting programmes and policies. Several sectors have benefited due to the reforms. However there are still significant limitations hindering the development of the sector. Important food crops such as wheat and maize still show trade deficits, though there is considerable potential. On the other hand, their frequent mention of the importance of value addition is not reflected in the choice of strategic crops by the Tanzania National Business Council (see p. 15-16). The crops that have been examined in this paper were chosen to support the Tanzanian development effort. However, within the coffee and cotton sectors there is little

58
room for value addition in Tanzania. Moreover, the maize and wheat sectors are far behind local and international demand, which currently leaves little encouragement for processing of these two crops.
III. Industrial Sector: Tanzania Between the 1960s and mid 1980s, industrialisation in Tanzania was hampered by governmental focus on parastatal firms which were usually highly unprofitable and indebted. Since 1986, reforms for the development of private entrepreneurship were put in place. The Parastatal Sector Reform Commission (PSRC) divestiture programme (1996) aimed at reducing the unprofitable parastatal enterprises and foster private investment and participation. Since then, the sector has been increasingly liberalised and the private sector has been encouraged to invest in all industry activities (Semboja 2002). Nevertheless, as can be seen in Table 19 below, the industrial sector remains the smallest contributor to GDP in Tanzania with a share between 20.2% and 22.2% from 2003 to 2007. Table 19: Real GDP by sector 2003 2004 2005 2006 2007 Agriculture 30.8 30.2 29.4 28.6 27.7 Industry 20.2 20.8 21.4 21.7 22.2 Services 48.9 48.9 49.2 49.7 50.1
Source: EIU 2008, p.16 The industrial sector of Tanzania is characterised by low but increasing capacity utilisation (MITM 2007, p.24). Furthermore, the sector shows a strong inward orientation, with most of the production being used as import substitution (MITM 2007, p.28). As can been seen in Table 14 (I. Overview of the Tanzanian economy), industry does not play a major role in exports if gold is handled as a separate sector. In this paper, the gold sector is considered to be a part of the industrial sector. Agricultural exports and gold generate most of the foreign exchange. However, in contrast to the agricultural sector, the industrial sector has been growing at an average rate of 10% per year between 2003 and 2007. This growth is mainly attributed to increasing economic activity in construction, manufacturing and mining (EIU 2008, p.21). Thus, our paper focuses on these activities. Other industrial sub-sectors include electricity and water which will not be examined in detail in this paper.
a) Importance in National Policies The main policy governing the development of the industrial sector in Tanzania is the Sustainable Industries Development Policy (SIDP) 1996-2020 (MIT 1996). Its emphasis is on the promotion of the so called “agro-allied” industries, comprising amongst others food, textiles, building materials as well as leather and leather products (MIT 1996, p.4). The first objective of SIDP is to achieve human development and create employment. Under the second objective, namely economic transformation, all industrial sectors shall be geared to increase their contribution to GDP. Nevertheless, special emphasis is given to the manufacturing sectors which produce intermediate and capital goods (MIT 1996, p.5).
59
The SIDP is split into 3 phases. The top priority of the first phase (which covered the years 1996-2000) was given to agro-allied industries, which are resource based and show the potential for Tanzania to develop a competitive advantage. The second phase (2000-2010) focuses on the creation of new capacities, with emphasis on manufacturing for exports and the production of intermediate and light capital goods. Furthermore, this phase also focuses on the development of machinery and technology for the exploitation of Tanzania’s iron ore deposits (MIT 1996, p.10). These short and medium term phases shall pave the way for the third phase (2010-2020) which is envisaged to attract full-fledged investment in basic capital goods as well as develop the iron and steel industry. It is clear that, this industrialisation strategy is based on the traditional view of the path for development. The first two phases clearly emphasise easy import substitution and easy export promotion (import substitution industrialisation) and the third phase leads towards heavy industrialisation (these terms are taken from Cypher/Dietz 2009, pp. 271 ff.). This becomes even more obvious when looking at the fiscal measures taken in the SIDP (MIT 1996, p. 16 f.): clear distinction between input and finished product imports and the preference given to local vs. imported inputs. However, it should be mentioned that there is no implementation strategy existing for SIDP. According to the Development Vision 2025 (GoT 2000), the economy is expected to be diversified and semi-industrialised with a substantial industrial sector comparable to typical middle-income countries (p.12). This diversification of the economy “must be based on a dynamic industrialisation programme focused on local resource-based industries (agro-industries) and capable of meeting the needs of other sectors whilst continuously developing activities that have dynamic comparative advantages” (p.17). Thus, also the Development Vision focuses on agro-allied industries. The Budget Guidelines (MFEA 2009, p.79) explicitly refer to the Vision 2025, regarding industrial transformation. This goal shall be achieved by the development of industrial parks and creating a favourable environment for the inflow of investment into the sector as well as increasing its international competitiveness, thereby focussing on the provision of supportive infrastructure. It is important to note that, since the Tanzanian industrial sector is mainly comprised of small and medium sized enterprises (SME), a supporting organisation for this part of the economy is in place but has a strong focus on agro-related businesses. The Small Industries Development Organisation (SIDO) is under the Ministry of Industry, Trade and Marketing. SIDO provides training and other support activities for mainly agro-based small industries. Nevertheless, it also supports the local production of machinery for agro-processing like incubator machines, automatic poultry keeping shed and wind mills for power generation (SIDO 2009, p.3). Even though these machines are of basic technology, they represent a first step towards non agriculture-based industrialisation. To conclude, the government of Tanzania clearly wants industry to play a major role in the development of Tanzania. Although at present, the primary focus is on agro-allied industries, further development is expected to be gradually implemented through deeper
60
industrialisation. Whether these expectations can be met by the industrial sector will be examined in the following part of this chapter.
b) Potential for Development In general, Tanzania is equipped with a lot of abundant resources functioning as inputs for the industrial sector. Furthermore, the abundant labour force is cheap but rather unskilled. With regard to trade, Tanzania can make use of many preferential market accesses regionally as well as internationally: e.g. African Growth and Opportunity Act (AGOA) with the US, Preferential Access for Capacity Building in Trade (PACT) with Canada, Everything but Arms (EBA) with the EU, Generalized Schemes of Preferences (GSTP) with Japan and it belongs to the Southern African Development Community (SADC) and of course the East African Community (EAC) (TNBC 2009, p.14). Semboja (2002, p.27) emphasises the need for the industrial sector to become the leading sector to fuel growth of the Tanzanian economy and thus generate income and contribute to the alleviation of poverty. As the industrial sector of Tanzania comprises very different sub-sectors, regarding labour intensity, resource utilisation, export potential etc. its analysis concerning the potential for development is different for the manufacturing, extraction and mining and construction sub-sectors, as elaborated in the following paragraphs.
i. Manufacturing The Tanzanian manufacturing sector is still one of the least developed and stagnating industry sectors in Sub-Saharan Africa as stated by the Economic Research Bureau of the University of Dar es Salaam (UDSM 2006, p.3). Its contribution to GDP has been stagnating, at around 8% over the last years. The UDSM (2006, p.20) suggests this as an indicator that Tanzania has not a high potential to take off and transform its economy towards more industrialisation. Furthermore, per capita manufacturing value added is USD 14 and thus one of the lowest in SSA (TNBC 2009, p.2, 10). The Tanzanian manufacturing sector is characterised by a heavy dependence on agricultural raw materials, low levels of FDI into the sector, a concentration of small and medium enterprises (SME) and a high labour intensity (TNBC 2009, p.12). As can be derived from Figure 11 below, the structure of employment by manufacturing sub-sector has not changed significantly since 1995. Food, beverages & tobacco contribute 33% to manufacturing employment, followed by textile, wearing and leather production with 24% in 2004. Total employment in manufacturing has increased by 8% from 1995 to 2004.

61
Figure 11: Employment in the Manufacturing Sector by Sub-Sector
Source: UDSM 2006, p.23 While agricultural products contributed to more than 70% of merchandise exports in 2000, manufactured exports made up only 15% (MIT 2003, p. 13). The agro-based sub-sector food processing, beverages and tobacco makes up 65% of manufacturing production (UDSM 2006, p.20). Non agro-based including chemical industries (petroleum, rubber and plastic etc.), make up 12% of manufacturing output. This clearly shows that the Tanzanian manufacturing sector is not well diversified making it vulnerable to fluctuations in agricultural conditions and commodity prices. Furthermore, most of the production is conducted for import substitution and there are no activities in the areas of frontier technologies or scientific products (UDSM 2006, p.23). It is perhaps unavoidable and absolutely necessary, that because of its importance in the Tanzanian economy employment wise as well as in terms of its contribution to GDP, the manufacturing sector has a huge potential to contribute to the development of Tanzania. But in order to reap its full potential, certain framework conditions to foster investment into the sector and thus its productivity will have to be implemented. Those constraints to development will be described in detail in part c).
ii. Extraction and Mining A lot of growth in the industrial sector over the past years has come from the mining sector, driven almost entirely by gold, which grew at an average rate of 15% between 2000 and 2007 (EIU 2008, p.20). This sector is not labour intensive and thus does not create important employment opportunities. Nevertheless, it improves the current account of Tanzania as most of its products are exported. Gold actually accounted for not less than 44% of exports in 2007 (EIU 2008, p.24). Tanzania has been the third largest Sub-Saharan African gold exporter in recent times; however, the value of its exports accrued to little more than a third of that of Ghana’s, the
62
regional leader in gold exctraction (Magai and Marquez-Velazquez, 2011, pp. 2 ff.). Moreover, if there are no new discoveries of gold, production is expected to peak around 2015 and drastically decline after 2020 (Roe and Essex, 2009, p. 28). If we add the lack of ability of the Tanzanian government to capture the rents generated by this sector (Magai and Marquez-Velazquez, 2011), and the implausibility for a change in this situation in the short run, the gold sector’s potential to help improve Tanzania’s development path seem minimal.
iii. Construction The construction sector in Tanzania includes a variety of players ranging from contractors and sub-contractors to input suppliers including materials and equipment as well as builders and others. It contributed 6.3% to GDP in 2007 and created 10% of employment while it grew at an average rate of 10.2% between 2003 and 2007 (MITM 2008, p.21 and EIU 2008, p.21). This growth was fuelled by increasing government and donor investment as well as huge infrastructure projects. Governmental involvement as a client, financier, regulator and operator is huge in this part of the Tanzanian economy. While the construction sector in Tanzania is dominated (number wise) by local companies (95%) which are SMEs, 90% of the construction projects in terms of their monetary value are done by foreign firms which account for only 5% of total registered firms. Additionally, the informal construction sector plays a substantial role especially for housing and infrastructure in the rural Tanzanian economy. It is important to note that, there is no export of construction materials and services from Tanzania (MITM 2008, p.20). Opportunities for the construction sector lie substantially in the increasing demand for its products and services. Construction, through its role in the infrastructure sector can have important spillover effects to other sectors of the economy including those examined in the chapter below, like tourism, transport and transit trade as well as productive sectors including manufacturing and agriculture. However, the development of the local construction industry is constraint by its low capacity and capability in order to become competitive to foreign firms. Furthermore, the sector faces an unfavourable tax regime, low working standards, especially regarding safety issues, a weak and non-facilitative regulatory framework, lack of good governance fostering corruption and a lack of supportive institutions regarding financing and the hire of equipment (MITM 2008, p.23 f.). The competition from and prevalence of foreign construction firms in Tanzania poses possibly the biggest challenge to the construction sector. Tanzania could make use of it for the transfer of know-how and technology in order to develop the local construction sector. Supporting measures would have to be implemented in order to establish a co-operation working environment. Furthermore, the export of construction products and services to neighbouring countries could be considered. However, industrial sector in Tanzania faces some important constraints which are addressed in the next paragraph

63
c) Constraints to Development Constraints to development of the Tanzanian industry are diverse and similar to the Ugandan as well as other developing countries’ cases. Possibly the most frequently mentioned constraint is the lack of sufficient infrastructure in Tanzania (MITM 2007, Semboja 2002, TNBC 2009). This includes for example the lack of stable electricity which is especially important for industry to develop as it involves a certain amount of technology and mechanisation relying on electricity. Furthermore, the delivery of inputs as well as their distribution, including the export of outputs of the industrial sector has to cope with a poor economic infrastructure. This delays delivery, leading to losses due to decay as well as leakages in transport facilities and raises the price of industrial goods. Important issues include the inefficiency of the Dar es Salaam port which will be examined in more detail in the part on the Tanzanian service sector. Unsuitable framework conditions in Tanzania further constitute an obstacle for the development of the industrial sector, even though the government has developed relevant policies like the SIDP. Ten years ago, many rules and regulations were outdated and left over from colonial, post colonial and socialist times. Inconsistencies and contradictions were common due to piece-meal changes to some laws and the uncoordinated introduction of new ones. The Confederation of Tanzania Industries (CTI) had thus embarked on a study and made a number of recommendations. Nevertheless, the industrial environment has not changed significantly since then. The legal, regulatory and judiciary framework is still considered to be inadequate (MITM 2007, p.43). Policy recommendations exist, but there is a problem of not implementing them accordingly. Reasons for which are diverse, including their time consuming nature, lack of government capacity, difficulty as well as their potential discrepancies with the government’s ideological commitment (UDSM 2006). Furthermore, a weak coordination of government strategies and policies also leads to the lack of efficient implementation (TNBC 2009, p.18). Another serious problem concerning the framework for industry activities is the difficulty to access credit, especially long-term credit at an acceptable price. Companies are thus hampered to embark on medium and long-term financial planning concerning normal day to day business activities as well as expansion of them (Semboja 2002, TNBC 2009, UDSM 2006). With regard to human resources studies often emphasise the lack of domestic skills (MITM 2007). These include general management competence as well as industry specific skills. This lack is on the one hand due to the absence of qualified human resources and on the other hand due to the low quality of relevant education in Tanzania. Those people, who are well educated, often leave the country to work where they receive better pay and working conditions making brain drain a serious problem for Tanzania. The other human resources related constraint is the low labour productivity of the Tanzanian work force. With regards to the domestic markets there are also several constraints often mentioned. This includes the lack of domestic demand (Semboja 2002), which is especially relevant due to the inward oriented nature of the industrial sector. Furthermore, industrial development is hindered by a limited access to raw materials, basic inputs and services which show the importance of and the dependence on other sectors of the economy. The MITM (2007) also

64
mentions the limited linkages between SMEs and large firms which, if established, could have a positive impact on SME development in Tanzania. Other setbacks for SMEs include the lack of a vision and the lack of quality awareness (Interview with Christopher, Marketing Manager SIDO, 17.11.2009, Karimjee Hall). Furthermore, the technology base of the Tanzanian industry is inadequate (MITM 2007) and only limited use is made of it. All these factors lead to a lack of international competitiveness of most of the Tanzanian industrial sub-sectors (MITM 2007, p.47).
d) Conclusion Industrial Sector Tanzania
To conclude, the industrial sector is supported by government policies to play an important role in the development of Tanzania. Nevertheless, it has not taken off so far. On the one hand, most of industrial growth in recent years came from the extraction and mining sector, whose contribution to development is disputed. On the other hand, the manufacturing sector, which bears a substantial role for development experienced a rather stagnating period, is not well diversified and does not contribute much to export generation. Reasons for this development might lie in the insufficient implementation and alignment of promising visions and policies to overcome the constraints to development. Tanzania is favourably located for regional as well as international trade of industrial goods, but it has yet not been able to make use of it. Whether, apart from the above mentioned constraints, a lack of service sector development has been hampering progress of the industrial sector will be examined in the following chapter.
IV. Service Sector Tanzania As already examined for the case of Uganda, the service sector bears a huge potential as a directly traded and GDP generating “product”. Furthermore, services constitute important inputs to the production of agricultural as well as industrial goods. According to ICTSD (2007, p.xii) 70% of value addition in the production process is generated through services. Within this chapter, the role of the service sector first in general and later on of its sub-sectors tourism, transport / transit trade, ICT, education, health and financial services for the development of the Tanzanian economy have been examined as along with its potential and challenges for development. In developed countries 70% of the working population is employed in services contributing 71% to GDP. In developing countries the respective figures are 40% and 48% (ICTSD 2007). Thus, the services sector contributes about half of GDP in many developing countries. As can be seen from the table below, in Tanzania this contribution has been around 43% during the last years which is below average for developing countries and has not changed significantly. Nevertheless, it is expected to follow a growth path in the coming years. This growth in contribution will especially be attributed to the sub-sectors trade and repairs, communications and real estate and business services.

65
Table 20: Contribution to GDP in % (2002-2012) 2002 2003 2004 2005 2006 2007 2008 2009 2010 2011 2012 Services 44.2 42.7 42.0 42.5 43.3 43.3 43.3 43.7 44.2 44.5 44.8 Trade and repairs 12.4 12.0 11.4 11.0 11.4 11.5 11.8 12.1 12.3 12.6 12.8 Hotels and restaurants
2.6 2.4 2.3 2.5 2.6 2.7 2.8 2.6 2.4 2.3 2.2
Transport 5.0 4.8 4.6 4.4 4.3 4.2 4.2 4.2 4.2 4.1 4.1 Communications 1.2 1.3 1.5 1.7 2.1 2.3 2.4 2.6 2.9 3.2 3.5 Financial intermediation
1.7 1.7 1.6 1.7 1.7 1.6 1.6 1.6 1.6 1.7 1.7
Real estate and business services
9.7 9.4 9.1 9.5 9.6 9.5 9.3 9.4 9.6 9.7 9.9
Public administration
7.2 7.2 7.7 8.0 8.0 7.9 7.8 7.8 7.9 7.7 7.5
Education 2.0 1.8 1.7 1.6 1.5 1.4 1.3 1.3 1.2 1.2 1.2 Health 1.5 1.4 1.4 1.5 1.5 1.6 1.6 1.6 1.6 1.5 1.5 Other social and personal services
0.8 0.7 0.7 0.7 0.7 0.6 0.6 0.5 0.5 0.5 0.5
Source: MFEA 2009, p.88 In developing countries, the share of services in trade is only very small because most services are generated and supplied domestically (ICTSD 2007, p. viii). This is also the case in Tanzania, where the services sector contributes substantially to GDP, but fails to participate in international trade. The export of services from Tanzania has been increasing by 15%, similar to Ugandan statistics (Table 21 below). Nevertheless, it is important to note that, while the service trade deficit of Tanzania in 2006 (USD 233.8 m) is only half as big as the one of Uganda (USD 500.2 m), the Tanzanian volume of total service export is the triple of the same volume of Uganda. The biggest differences appear in the export of transport and travel services where Tanzania seems to possess an advantage because of its status as a transit country and major tourist destination. Uganda on the other hand has been able to export only a small amount of transport services which has even decreased since 2000.

66
Table 21: Trade in services (in USD m) 2000 2003 2006 Annual growth
Tanz
ania
Total services EXP 627.4 947.8 1483.2 15% IMP 682.4 725.7 1249.4 11%
Transport EXP 56.8 138.9 340.9 35% IMP 205.6 214.7 418.3 13%
Travel EXP 376.7 646.5 914.2 16% IMP 337.3 353.2 534.5 8%
Other services EXP 193.9 162.3 228.1 3% IMP 139.5 157.8 296.6 13%
Ugan
da
Total services EXP 213.2 265.7 489.8 15% IMP 458.8 525.3 990.0 14%
Transport EXP 31.5 8.9 10.9 -16% IMP 149.2 223.0 262.3 10%
Travel EXP 165.2 184.2 354.9 14% IMP 149.2 225.8 472.4 21%
Other services EXP 16.5 72.6 124.0 40% IMP 309.6 302.3 315.5 0%
Source: UNCTAD 2008 In 2001, trade in services accounted for 73% of total employment including public employment. The employment in the service sector is split in the following way: (construction 4%, commerce 11%, finance 7%, transport & communication 8%, community services 43% (ICTSD 2007, p.8).
a) Importance in National Policies In the foreword to the National Trade Policy (MIT 2003), the Minister of Industry and Trade, mentions the export of first class services next to higher quality products at lower prices as a necessity for Tanzania to achieve export-led growth (p. ii). Nevertheless, the rest of the National Trade Policy does not focus on the trade of services. When talking about services, it just addresses tourism and transit trade which it defines as priority service sectors (p.29), leaving aside other service sectors. Service areas like finance, health and education are just considered to facilitate trade in other sectors (p.30, 62). When talking about high potential sectors for growth, it is often just the tourism sector which is mentioned as part of services:
“High growth potential lies in mining, tourism, agriculture and industry. Specific high potential products include gemstones and minerals, fish and fish products, horticultural products and spices, cotton and textiles, handicrafts and tourism services.” (p.4)
Strategies, which involve the services sector to make sure that Tanzania profits from the membership in RTA and the MTS are the promotion of value adding activities in tourism and the “expansion and modernisation of the services industry with priority on tourism and transit trade sectors” (p.34 f). The National Strategy for Growth and Reduction of Poverty (NSGRP) or “MKUKUTA” (GoT 2005) states that income poverty (as opposed to non-income poverty) is closely related with growth in productive as well as service sectors (p. 5). But growth in tourism has not directly led
67
to a reduction in income poverty (p. 7). Furthermore, apart from the promotion of social services provided mainly by the state, like health and education, the promotion of other service sectors is not directly addressed by the NSGRP. While operational targets for the promotion of broad-based growth include increased growth rates of manufacturing and agriculture, there is no such target for the service sector (p.37). Nevertheless, the envisaged actions of the NSGRP in sectors like infrastructure, governance and also the social services will most likely have positive spillover effects on other service sectors. Concerning the health and education services, the NSGRP just provides for the internal service delivery and does not consider the export of those services. It furthermore does not mention to stimulate private investment in those sectors. Whereas, the Development Vision 2025 (GoT 2000) recognises the role of the industrial sector transforming the country from a least developed country to a middle income country, it does not regard the service sector – especially private investment in it – as crucial. Social services like health and education are mentioned, but not the service sector as a motor for development and an income generator by itself. Opportunities Opportunities from the service sector include a huge extend of spillover effects to other parts of the economy. It is stated that 70% of value addition to the production of goods is generated through services (ICTSD 2007, p.xii). Furthermore, the service sector can function as a direct employer and thus income generator. A study by ICTSD (2007, p.6) advocates for the opening of the service sector as it could attract more FDI (7.9% in 1999). Nevertheless, as will be shown below in the examination of the construction sector, the presence of foreign firms can crowd out local businesses. But Jensen et al. (2008, p.21) found that multinational service providers use only a few expatriates and employ mainly local labour as well as use local primary factor inputs to their services. This implies that even when multinational services providers would increase their market share in Tanzania after regulatory barriers have been removed, local employment of skilled, semi-skilled and unskilled people will be created and the demand for inputs will be stimulated (p. 29). Challenges and obstacles to services sector development in general For most of the service sub-sectors there is an inadequate legal and regulatory framework (ICTSD 2007), which leads to serious development constraints in those sectors. Jensen et al. (2008) found that a business services reform3 could increase Tanzania’s GDP by 4.5% in the medium term and 14.1% in the long term. The largest gains can be expected from regulatory reforms in the water and road transport as well as banking sector (p.4). The study advocates for a reduction of regulatory barriers against domestic as well as foreign service providers. He argues that, the gains from liberalisation to local services providers will be higher than those to foreign services providers because of the larger share of domestic actors in this market. Furthermore, an increase in the variety of services available in Tanzania will promote an increase in total factor productivity amongst other sectors using business services where regulatory barriers will be abolished or substantially diminished. Since the tourism sector is an intensive user of business services, Jensen et al. (2008, p.26) estimate that due to the removal of regulatory barriers to business services, it will double in size and quality and cost
3 Business services in Jensen et al. (2008) comprise water, road, air and rail transport, banking, insurance, telecommunication and professional services.

68
improvements can be achieved. This will then lead to an increase in export earnings since tourism is one of the most important sectors in Tanzania to generate foreign exchange (p. 27). However, due to the businesses sector regulatory reform other sectors of the economy, which do not heavily rely on business services, are expected to decline. Those sectors include the traditional export commodities like coffee and cashew nuts. In the long run, service sectors and non-agricultural (including manufacturing) sectors are expected to expand substantially. When agricultural output does not expand in the same rate (maybe due to other measures taken favouring the expansion of the agricultural sectors), the share of agriculture to GDP will decrease and those of services will increase. A study by the ICTSD (2007) found that, key actors in many of the service sectors under study (communication, construction, tourism) lack knowledge of the GATS which hinders them to make use of any possible opportunities arising from their proper application. Another typical constraint in the service sector is the lack of skilled personnel due to inadequate human resource development measures and brain drain. In the following paragraphs the opportunities and challenges for each sub-sector under consideration have been examined in detail.
b) Potential for and Constraints and Challenges to Development
i. Tourism The tourism sector shows a great potential within Tanzania, as the country offers many interesting sights like Mount Kilimanjaro, the Serengeti, Zanzibar, etc. to its visitors. In 2008, the travel and tourism sector was the second largest foreign exchange earner with 31.7% of total export earnings after gold. It is estimated that this service sub-sector employs about 300,000 people directly and up to 400,000 indirectly (WTTC 2008, p.6). Moreover, it is expected to have contributed 4.2% to GDP in 2008 directly and 9.7% including indirect contribution (WTTC 2008, p.6). In 2008, more than 770,000 people visited Tanzania and spent more than USD 1,200 m (MNRT 2009, p.8). Most of the visitors were coming from other African countries (48%), especially Kenya and South Africa, as well as Europe (32%), especially France, Germany, Italy, Netherlands, Sweden and the UK (p.17, 20). The Tanzania Tourist Board (TTB), a parastatal organisation, is responsible for marketing tourism in Tanzania locally as well as abroad and to provide an up-to-date tourism database. Nevertheless, tourism data and statistics from different sources are contradictory (TWG 2003, p.13), which makes the analysis of the sector more complex and leads us to focus more on the qualitative than quantitative aspects of tourism. As can be seen from the discussion of the importance of the services sector in national policies, tourism has been give an important role, if not the most important role within the services sector, for contributing to GDP, foreign exchange earnings, employment creation and development in general.

69
The Tourism Master Plan 1996-2006 and its update from 2002 (MNRT 2002) guides strategies for the development of this sector. Within it, the Ministry of Natural Resources and Tourism (2002, p.7) regards the potential of tourism as key for Tanzania’s development and names the following opportunities: tourism generates hard currency foreign exchange (leading to an improvement of the balance of payments) and tax revenues, it creates jobs as it is attractive for small and medium sized enterprises, it has an important impact on regional economic activity and can bring economic benefits to local communities, it has strong linkages to other sectors of the economy which can generate positive spillover effects. In addition, the National Tourism Policy of 1991 has been amended in 1999 (MNRT 1999) to changed circumstances, which include especially the changed role of the government from being directly involved in commercial activities to become a facilitator for private sector investment. The Tourism Policy 1999 includes economic, social, environmental and cultural objectives which shall be achieved by employing among others the following strategies: development of eco-tourism, enhance cultural aspects of tourism, promote domestic tourism, international and regional co-operation, infrastructure development, employment and human resource development, increase community participation, promote investment and provide financial assistance, environmental protection. The government is said to act as regulator, promoter, facilitator and service provider in those regards. The overall mission is to attract high-yield and low-volume tourism. Constraints to tourism development In 1999, the MNRT defined certain obstacles in its National Tourism Policy, many of which still prevail today and are addressed in recent studies. The inadequate quality of hotels and services as well as tour guiding offered for an overpriced value does not effectively attract tourists, neither wealthy, as they want a better service, nor low budget tourists, as they cannot afford the price. This lack of quality can be attributed on the one hand to poor infrastructure, including access to and within the country (note that roads have been improved considerably during the past years). On the other hand, lack of proper human resources policy and thus suitable training institutions for the tourism sector. High prices are generated by costly access to water, power, transportation and communication. Furthermore, park entrance fees as well as visa charges are significant. Progress is being made in attracting local tourism by decreasing those fees for regional tourists. Other obstacles to the development of tourism include security aspects including frequent attacks/raids on tourists (ICTSD 2007, p.15 and MNRT 2002, p.18ff). Investment in the tourism business is not yet promoted sufficiently. The regulatory licensing system on aspects like hunting, photography, access to national parks, conservation areas and marine parks as well as general business licences are one of the major constraints to investment, local or foreign. Associations in various fields of tourism have been formed and operate under the umbrella association TCT to advocate between private businesses and the government (ICTSD 2007). The Tourism Working Group (TWG 2003, p.30 ff.) identified several issues impeding investment in the tourism industry including VAT and other tax issues. Regulatory aspects hindering investment include: the complexity of business licences and fees, inadequate land management for tourism, lack of a hotel classification and grading system on mainland Tanzania, lack of specific regulations licensing tour operators and travel agents with emphasis on safety of passengers and aircraft transportation within the country. Administrative issues regarding marketing, visas, data and statistics, human resource development and training add their part to distract investment. Another important issue,
70
which runs through most of the sectors under study when it comes to investment, is the lack of adequate finance (MNRT 2002, p.36). This amount of regulatory issues restricting private investment has led to the emergence of some private sector associations combined under the umbrella organisation TATO. Challenges If government wants to make tourism the vehicle for development of the Tanzanian economy, it is important to overcome certain challenges, which could if not sufficiently addressed have adverse effects for development in certain aspects. For example, tourism can create direct income to local communities and empower them when their participation in the decision-making process is taken care of (MNRT 1999, p.4). Furthermore, a balance between commercialisation and environmental sustainability has to be reached (ICTSD 2007, p.15). Currently, tourism in Tanzania is mainly attracted to the northern part of the country which creates pressure on those resource while leaving others aisle. Measures have to be taken to divert tourism away from the Northern Circuit to other areas of Tanzania making tourism development more equally dispersed over the country. Since the Islamic culture of most of the local population (especially on Zanzibar) and those of the tourists often clashes, it is important to create a peaceful and harmonious co-existence between those two, each respecting the other one. For the local population to welcome tourists, it is important to create awareness for local manners and customs among tourists. Conclusion & Recommendations Key to the fruitful development of the tourism industry is the promotion of private sector investment. This should be done by easing the regulatory framework on the one hand while not neglecting environmental sustainability as well as positive effects for local employment and living standards. If this is done in a suitable manner, the tourism sector can have a huge impact on the development of the country by being an employer and income generator itself, but also by supporting spillover effects to other parts of the economy, e.g. improved infrastructure, education, quality of products and services, etc. As compared to Uganda, Tanzania has already made more out of its tourist attractions. Nevertheless, there is still a huge potential which is untapped and good be used for the betterment of the country.
ii. Transport and Transit Trade The contribution of the transport sector to GDP has been slightly declining from 5.0% (2002) to 4.2% (2008). Nevertheless, it grew at a constant rate of around 6.2% per year from 2002 to 2008 (MITM 2008, p.30). Especially transit trade offers a sizeable revenue generation for the Tanzanian economy if the potential service delivery is done to eight neighbouring countries (Mozambique, Malawi, Zambia, DR Congo, Burundi, Rwanda, Uganda, Kenya), six of which are land-locked, would be fully tapped. Thus, a well functioning and maintained transport system is not only a catalyst for Tanzanian products and their trade, but also for regional transports, especially the land-locked neighbouring countries of Tanzania. This means that the development of the
71
Tanzanian transport and transit trade sector can have a huge positive impact on the economies of those countries as well. The sector is governed by the National Transport Policy (MCT 2003), which aims to develop an efficient, well integrated and coordinated transport system. Constraints Nevertheless, all the four modes of transport, ground (road, railway), air, maritime and pipeline transport, face severe constrains which hinder reaping their full potential. These constraints include the lack of coordination between the various institutions which share the responsibilities of transport services. Additionally, inadequacy of the regulatory framework leads to poor governance, including corruption and limited enforcement. Furthermore, there is a lack of adequately skilled human resources which leads to inappropriate maintenance of infrastructure and transport facilities contributing to their deterioration (ICTSD 2007, p.14, 30). Maritime transport is dependent on four major Tanzanian ports (Dar es Salaam, Mtwara, Tanga and Zanzibar). The congestion and inefficiency of the container terminal of the port of Dar es Salaam is one of the main challenges in the transport sector to export growth (Jansen et al. 2008, p.9). Efficient operation is impeded amongst others by the structure of tariffs which does not incentivise the quick removal of containers and an underdeveloped container tracking system. Furthermore, foreign companies are not allowed to operate in the port and can only do so via an agent. Investment is thus significantly hindered. The development of transport corridors which intends to attract export driven investments is one of the main focuses of the government in order to facilitate transit trade (MCT 2003, p.33 ff). Those export corridors link ports (mainly the port of Dar es Salaam) with the hinterland of the landlocked countries neighbouring Tanzania. They include road as well as railway infrastructure. The railway system is to 2/3 operated by the Tanzania Railways Corporation (TRC) which is fully owned by the Tanzanian government and to 1/3 by the Tanzania – Zambia Railway Authority (TAZARA), which is jointly owned by the Tanzanian and Zambian Government. The necessity of involvement of private sector investment in the railway system is emphasised by the National Transport Policy (MCT 2003, p.5). Potentials are numerous, but can unfortunately not be reaped, because of the diverse obstacles, including competition with other corridors connecting the hinterlands with for example the South African, Mozambican or Kenyan ports. Furthermore, the trade pattern is unbalanced due to higher volume exports than imports which lead to a lack of return cargo. Moreover, the interfaces between different modes of transport lack adequate facilities and railways as well as roads are poorly maintained. Tanzania has three international airports situated in Dar es Salaam, near Kilimanjaro and on Zanzibar and a number of local airports and airstrips. Poor runways, aprons and terminal buildings as well as a poor state of navigational aids, fire fighting equipment and safety measures characterise them. Pipeline transport is limited to one pipeline, channelling crude oil from Dar es Salaam to a refinery in Zambia. The port of Dar es Salaam has a single buoy mooring for the delivery of crude oil. Besides that a pipeline for natural gas is under construction (MCT 2003, p.6).

72
Challenges The challenges in the development of a profitable trade system for the Tanzanian economy lie in the attraction of private investment as well as public private partnerships. The investments needed are substantial and require a holistic approach. The National Transport Policy clearly states the need for private investment and the limitation of governmental tasks to policy formulation, strategic target setting, regulation and monitoring (MCT 2003, p.8). Nevertheless, for private investment to be attracted, the sector needs to be profitable which is partly not easy to achieve in an economy with low income of the population. Another challenge lies in the development of the transport corridors, which could foster rural growth and the connectivity of rather remote areas to trade hubs. Air transport faces the challenges of harmonisation of national air transport policies to smoothen the flow of goods and services among the region and of catering for high-standard tourism as well as the transport of non-traditional commodities. When regarding public transport, there is an immense challenge in safety issues for passengers and other involved people. At the same time, there are environmental issues as well. Although regulations exist, their enforcement is rather lax. Conclusion & Recommendation While there is substantial investment needed to clear the congestion in the port of Dar es Salaam, Jensen et al (2008, p.9) also propose various regulatory reforms which will improve the situation. Those include the creation of tariff incentives, to move containers out of the port as well as increase incentives for shippers to pre-clear containers, improvement of the container tracking system, review of the regulation that containers from a ship need to arrive at a single inland container terminal before they can be released and improvement in bureaucratic procedures. Furthermore, foreigners are prohibited from offering shipping services in Tanzania which hampers investment.
iii. ICT Communication services have shown a steady rise in their contribution to GDP over the last six years (2003 - 2009) while their share in GDP still remains quite small in total with 2.6% in 2009 (MFEA 2009, p.87). Quite similar to Uganda, the communications sector has been the fastest growing also in Tanzania. The liberalisation of the mobile telecommunication sector in 2001 contributed to that growth. In 2007 about 19.4% of the population had subscribed to a mobile phone which shows a huge increase as compared to 2003 when only 4.1% had a mobile phone (MITM 2008, p.15). The registration of websites has also increased substantially from 98 in 2003 to 400 in 2006 (MITM 2008, p.16). With the Information and Communication Technology (ICT) Policy of 2003 (MCT 2003a) as well as policies and acts for its sub-sectors4, the importance of ICT for economic development has been acknowledged. Nevertheless, the ICT sector in Tanzania is still in its infancy, which is partly due to lack of infrastructure as well as skilled personnel (p.18 ff.). Thus, ICT solutions have not yet been a driving force neither in the productive nor in the private or public services sector where it could enhance processes substantially (p.21 f).
4 Namely: Information Broadcasting Policy (2004), Communications Regulatory Act (2003), The Universal Communication Services Act 2006, Postal Policy (2003), Tanzania Postal Regulation(2005), Telecommunication Policy (1997), The Patent (Registration) Act Cap 217 R.E 2002, Broadcasting Services Act R.E 2002

73
The objectives of the ICT Policy are to provide a framework that enables ICT to contribute to national development and the transfer of Tanzania into a knowledge-based society (p.14). The focus clearly lies on the internal provision of ICT products and services and only one reference is made to the export of them (p.18). Furthermore, the ICT Policy differentiates between “enabling sectors” which are the ICT sub-sectors and “enabled sectors” like education, health, agriculture, etc. for which ICT services are needed for a better operation of them (p.1). Opportunities for ICT services include an increasing demand, the expanded market of the East African Community, government initiative for a Universal Communications Access Fund and the existence of a strategy for enhancing technology transfer in Public Private Partnerships (MITM 2008, p.18). The ICT Policy underlines the sector’s importance for the production and supply chains at national and international levels. ICT thus inherits and important linkage function through the economy and its proper functioning could increase efficiency and performance. There is a huge potential for electronic commerce (marketing, sale and distribution of products & services) which is mainly constrained by a lack of credit cards as well as an appropriate legal and regulatory framework to ensure users safety. The Budget Guidelines 2009 (MFEA 2009, p. 86) point out that the ICT sector possesses a huge potential for generating revenues for Tanzania as it could serve its neighbouring inland countries with connectivity access. Constraints Constraints to further growth in communication services include the high tariffs, outdated equipment and inadequate maintenance of facilities (ICTSD 2007, p.18). The high costs of ICT connectivity are mainly due to the fact that they are provided by satellite services because there is no access to a fiber-optic cable network for the East African coast line (Jensen et al 2008, p. 8). However, there are several cable systems under construction currently. Another important constraint worth mentioning is that, there are no local manufactures of ICT equipment. All necessary hardware and software is imported and does not underlie any standards guiding them. This also imposes a burden on the current account of the Tanzanian economy. The development of ICT is also constrained by a lack of sufficiently qualified personnel. Investments in the ICT sector face the challenges of unreliable power supply and regional differences in regulation and licensing requirements (MITM 2008, p.18). Challenges One of the major challenges which should be overcome is the urban focus of investment which undermines rural accessibility to ICT services. Furthermore, stiff competition from foreign investors might crowd out weaker local operators (MITM 2008, p.18). Another challenge is the implementation of ICT into educational systems. Children and students who are used to applying ICT for teaching and learning purposes from an early stage in their lives will be familiar with those also for their later career.

74
To make use of the trade with ICT decision maker have to know the rule of the international market, which means that the limited knowledge of GATS needs to be upgraded. The alignment of local regulations with international standards should also be mentioned in this regard. Conclusion & Recommendations While in Uganda ICT is focused on as a foreign exchange earner, for example the development of call centres or business process outsourcing, Tanzania’s ICT policy puts the focus on the spillover effects the ICT sector created for other parts of the economy. In order to increase investment in this sector and thus the development of it, it will be necessary to implement a regional or even international viable legal framework, to overcome infrastructural challenges and to provide for qualified personnel.
iv. Education The Tanzanian educational sector contributed 1.3% to GDP in 2008. It is not only key to the development of the economy by supplying skilled personnel to the private and the public sector, but it also plays a major role in determining Tanzania’s position in international trade in service being a net importer or exporter of services. It is necessary that a policy reorientation towards promoting foreign investment into Tanzania’s education sector needs to take place in order to become a net exporter of this service. Currently substantial numbers of students and post-secondary school attendants are sent abroad and thus constitute part of service imports (ICTSD 2007, p.28 ff.). Nevertheless, the temporary migration of students abroad increases their knowledge base and should be encouraged. Since the education sector, together with the health sector differ from other service sectors as they are mainly provided by public institutions, policies defined by governmental institutions and their implementation play a larger role in these sectors. Currently the educational sector is governed by the following policies and acts, which are partly outdated: � Education Act (1962, 1969, 1978) � Education and Training Sector Development Programme (2001) � National Higher Education Policy (1999) � Technical Education Policy � Science and Technology Policy � National Examinations Council Act (1973) � Universal Primary Education Act (1974) � The Institute of Adult Education Act (1975) The Education Act of 1962 is the principle document and was last updated in 1978. Tanzania’s Development Vision 2025 includes the goal of a well educated and learning society. It advocates for education as a strategic change agent and the restructuring of the qualitative transformation of the educational sector, focusing on the promotion of creativity and problem solving (GoT 2000, p. 15). The NSGRP (GoT 2005) clearly brings the level of education in connection with the level of poverty (p.11). Investment in human capital is listed first among the major sources of growth, on which Tanzania needs to focus (p.28). Therein, resources should be channelled to expand and improve the quality of secondary, higher and technical education. Furthermore, specific
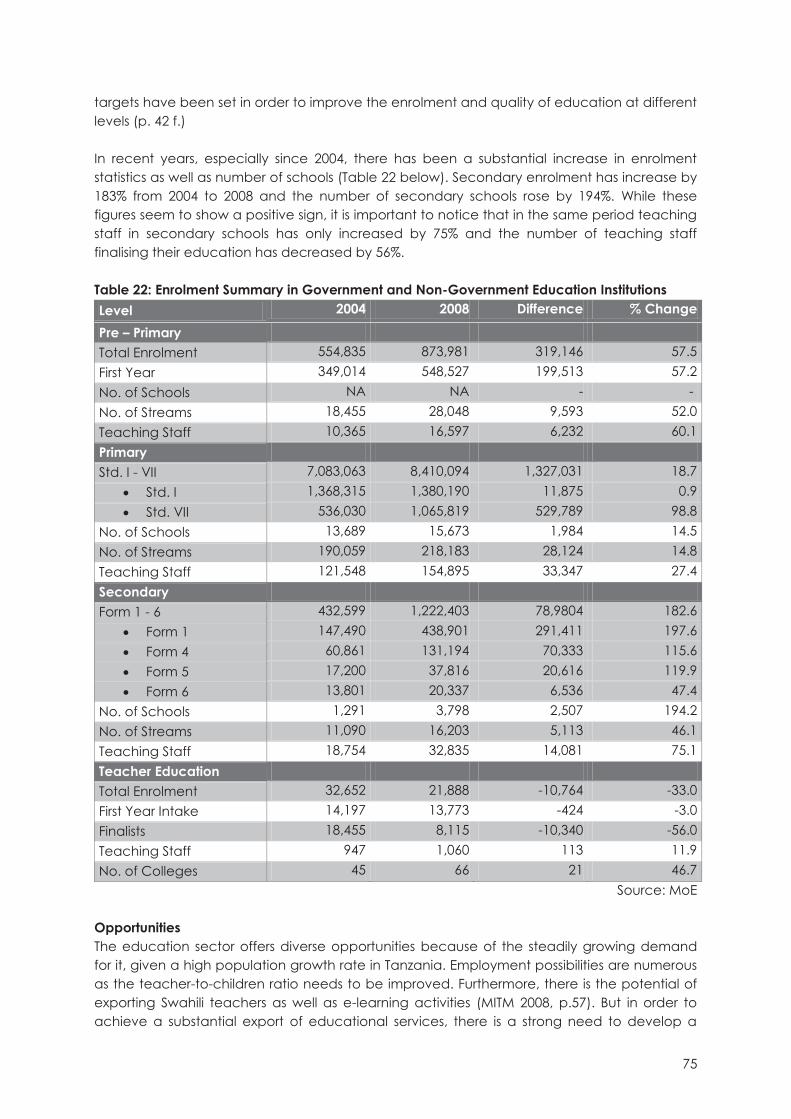
75
targets have been set in order to improve the enrolment and quality of education at different levels (p. 42 f.) In recent years, especially since 2004, there has been a substantial increase in enrolment statistics as well as number of schools (Table 22 below). Secondary enrolment has increase by 183% from 2004 to 2008 and the number of secondary schools rose by 194%. While these figures seem to show a positive sign, it is important to notice that in the same period teaching staff in secondary schools has only increased by 75% and the number of teaching staff finalising their education has decreased by 56%. Table 22: Enrolment Summary in Government and Non-Government Education Institutions Level 2004 2008 Difference % Change
Pre – Primary Total Enrolment 554,835 873,981 319,146 57.5 First Year 349,014 548,527 199,513 57.2 No. of Schools NA NA - - No. of Streams 18,455 28,048 9,593 52.0 Teaching Staff 10,365 16,597 6,232 60.1 Primary Std. I - VII 7,083,063 8,410,094 1,327,031 18.7
� Std. I 1,368,315 1,380,190 11,875 0.9 � Std. VII 536,030 1,065,819 529,789 98.8
No. of Schools 13,689 15,673 1,984 14.5 No. of Streams 190,059 218,183 28,124 14.8 Teaching Staff 121,548 154,895 33,347 27.4 Secondary Form 1 - 6 432,599 1,222,403 78,9804 182.6
� Form 1 147,490 438,901 291,411 197.6 � Form 4 60,861 131,194 70,333 115.6 � Form 5 17,200 37,816 20,616 119.9 � Form 6 13,801 20,337 6,536 47.4
No. of Schools 1,291 3,798 2,507 194.2 No. of Streams 11,090 16,203 5,113 46.1 Teaching Staff 18,754 32,835 14,081 75.1 Teacher Education Total Enrolment 32,652 21,888 -10,764 -33.0 First Year Intake 14,197 13,773 -424 -3.0 Finalists 18,455 8,115 -10,340 -56.0 Teaching Staff 947 1,060 113 11.9 No. of Colleges 45 66 21 46.7
Source: MoE Opportunities The education sector offers diverse opportunities because of the steadily growing demand for it, given a high population growth rate in Tanzania. Employment possibilities are numerous as the teacher-to-children ratio needs to be improved. Furthermore, there is the potential of exporting Swahili teachers as well as e-learning activities (MITM 2008, p.57). But in order to achieve a substantial export of educational services, there is a strong need to develop a
76
sector specific strategy for it, like the one which has been done in Uganda. Niche markets as well as the necessary means to tap them need to be identified within such a strategy. Constraints Constraints to the education sector include the lack of skilled personnel, insufficient coordination between the key actors, a regulatory regime that does not promote competition, budget constraints as well as brain drain (ICTSD 2007, p.30, MITM 2008, p.57). Another issue is the centralisation of the education planning institutions, mainly at the ministerial level. This ignores specific peculiarities of different areas. A well implemented process of decentralisation, which the Education and Training Sector Development Programme (GoT 2001, p.8 ff.) aims for, would increase community participation and thus integrate their peculiarities into educational programs. Furthermore, the quality of education is also a concern as students who are not permitted to university courses due to their low grades, have the option to become teachers. Challenges A major challenge to development is the fact that private schools are not accessible by the majority of Tanzanians and thus do not contribute to equal development. Furthermore, it is essential for Tanzanian policy makers to look at the educational sector from a regional or even global rather than only national viewpoint in order to make the Tanzanian educational sector competitive to those of other countries. In order to become a well educated economy, Tanzania needs to find a balance between stopping brain drain on the one hand and encouraging temporary migration of skilled workers and ensuring their return in order to make use of their knowledge acquired abroad on the other hand. Conclusion & Recommendations While the educational sector is given high importance in national policies, a policy shift from not only improving the quantity of education, but also its quality needs to be implemented. The sector offers a vast range of opportunities as an income and foreign exchange generator itself, but also as a facilitator of other sector in the economy. These opportunities need to be clearly defined and policies set accordingly.
v. Health Infectious diseases like malaria, HIV/AIDS, pneumonia and tuberculosis are wide spread in Tanzania. Malaria still accounts for most of deaths. Health facilities in Tanzania are dominated by government owned hospitals, health centres and dispensaries. In 2006 they made up 54% of all facilities, whereas parastatals accounted for 3%, religious & NGO facilities for 15% and private services for 28% (GoT 2008, p.24 f.). Interestingly, none of the eight special or referral hospitals were privately owned, nor any of the 21 regional or 119 district hospitals in 2006. A study by the MITM (2008) found that there is a shortage of more than 90,000 health professionals to fully utilise the existing public and private health facilities in Tanzania. The Primary Health Services Development Plan (PHSDP) aims at establishing and staffing more than 5,200 additional health facilities, which doubles the staff shortage to 180,000.
77
The Tanzanian health sector is governed by the following framework policies: � National Health Policy (1990 updated in 2007) � Health Sector Reform Programme � Primary Health Service Development Programme � Human Resources for Health Plan � Health Sector Strategic Plan III (2009 -2015) (HSSP III)
Relevant laws include:
� Occupational Health and Safety Act (2003) � Community Health Fund Act (2001) � National Health Insurance Fund Act (1999) � Health Laboratory Technologists Registration Act (1997) � Private Health Laboratories Regulation Act (1997) � Muhimbili University College of Health Sciences Act (1991)
The NSGRP 2005 (GoT 2005) as well as the National Development Vision 2025 (GoT 2000), stress the importance of the health sector and the government clearly sees its role as the service provider in this sector. Together with education, the provision of quality health services is emphasised as a source of growth. Even the Education and Training Sector Development Programme, sets its 4th priority on the control of the spread of HIV/AIDS and STI through the education system at all levels (GoT 2001, p.25). This shows that health (especially HIV/AIDS) is regarded as a cross cutting issue and efforts are made to tackle it as such. The Health Sector Strategic Plan (HSSP) III (MHSW 2009) sees the importance of close and improved collaboration with the private sector in delivering health services to Tanzania’s population. It mentions the importance of Public Private Partnerships and the fact that possibilities for those have not been used optimally as there is a lack of understanding of PPPs and advocates for an improvement in this field of collaboration by ensuring a conductive policy and legal environment, effective operationalisation and enhancing PPPs in the health sector (p.33). But in the HSSP III no reference is given to the possibility of exporting health services. It is clearly not taken into consideration. For countries to develop, it is important to have a healthy workforce, facilitated through well functioning health services. Furthermore, the public as well as private health sector can serve as a considerable employer for many people and can produce services contributing directly and indirectly to the economic growth as well as social wellbeing of a country. But Tanzania faces several constraints and challenges which are outline in the following. Constraints The Tanzanian health sector lacks skilled and specialised personnel and an adequate regulatory regime. Furthermore, sufficient dialogue between public and private institutions is missing, funds are mismanaged and the working environment is poor. This leads to the fact that many cases have to be referred abroad for specialised as well as pretty ordinary treatment (ICTSD 2007, p.26). In addition to that, where health centres and hospitals do exist, their availability of services is undermined by a lack of communication as well as transport facilities in case of emergency. The Annual Health Statistical Abstract 2008 (GoT 2008, p.13 ff.) defines the following constraints in the public health sector: low human resource management capacity, no clear
78
mechanism (also in private sector) of staff recruitment, retention, pension arrangements or promotion which leads to the lack of motivation for staffs, 66% deficit in health professional staffing and 25% deficit in supportive health staff. Interestingly, it also states the oversupply of health graduates between 1995 and 2005 as a constraint since only 16% were employed in public facilities. Thus, there is clearly a lack of motivation of graduates to work for public facilities; they rather prefer private employers. Challenges Challenges include a serious brain drain of health professional due to the low salary and benefits they receive in Tanzania as well as the poor working environment e.g. due to overloaded facilities. It is not possible to quantify the amount of brain drain, because there are no formal records on the outflow of health professionals. Conclusion & Recommendations First and foremost, more investment in the development of human resources and their retention is needed to stop the brain drain as well as close the lack of skilled personnel. The health sector is already given importance in national policies but measures must be taken more effectively to do justice to its importance for development.
Short Abstract on Financial Services Financial intermediation as a sub-sector of services shows the second highest growth over the last 6 years: 11% in 2008 (MFEA 2009, p.94). Financial sector reforms have been initiated in 1991 which led to an increase in banking activities in the country as well as the establishment of the Dar es Salaam Stock Exchange. Since the lack of adequate financial services is considered as one of the most important constraints to economic development, its promotion is vital for other sectors of the Tanzanian economy. Challenges are amongst others to avoid foreign dominance in the financial sector – similar to the construction sector and to include rural households and businesses in financial sector service delivery (MITM 2008, p.62). There is an almost total absence of a mortgage market which shows the uncertainty concerning land titles as well as the inability of enforcing contracts (Jensen et al 2008, p.12). Furthermore, regulations impede the growth of the insurance sector (Jensen et al 2008, p. 12).
c) Conclusion for Service Sector: Tanzania The Tanzanian service sector in general has not been given such an important role for development as compared to the one in Uganda. Its promotion is in many strategies considered to be a means for developing other sectors, but not to improve economic growth and employment directly by itself. This might arise from the fact that Tanzania is often given a comparative advantage in developing a manufacturing base because of lower transportation costs thus easier exporting opportunities as compared to Uganda.

79
V. Conclusion & Recommendations: Tanzania The analysis of the Tanzanian economy and its sectors has shown that most emphasis has been given to the agricultural sector in recent years through the policy of “Kilimo Kwanza” Nevertheless, industry and services are regarded to play fundamental roles for development. Constraints are diverse and very similar to those in Uganda. But, Tanzania has a particular competitive advantage as it is not landlocked. This landlockedness of Uganda and other factors had led the GoU to put a special focus on the service sector. Tanzania on the other hand has better opportunities to build a competitive industrial sector. However, very little facilitation has been provided to the industrial sector. In addition, there is no particular focus on services visible in Tanzania. Rather they are regarded as facilitators of other sectors, but not as income and foreign exchange generating activities by themselves – apart from the tourism sector. Furthermore, the Tanzanian service sector is regarded as a public sector neglecting possible fruitful private investment into this sector. In the case of Tanzania, it is not so clear whether broad industrialisation or services are the key. But clearly a diversification of the economy needs to take place. As examined above, the growth rates of the market of traditional agricultural exports in Tanzania like coffee and other products are low. Thus, there is the need to diversify into service sector exports and non-traditional products as well in order to pursue a path of development.
80
V. Bibliography Abuka, C., et al., 2006. Firm Level Investment: Trends, Determinants and Constraints. Economic Policy Research Centre, Makerere University. Research Series No. 47. Kampala. Agricultural Council Tanzania (ACT), 2009. Kilimo Kwanza Resolution. Dar es Salaam. Available online at: http://www.actanzania.org/index.php?option=com_content&task=view&id=121&Itemid=39 [accessed 27 Nov 2010]. All Africa, 2010. Wheat Imports increase amid Global Uncertainties. 18 November 2010. Dar es Salaam. Available online at: http://allafrica.com/stories/201011190845.html (accessed 27 November 2010). Amir, Mr., 2009. Managing Director Amimza. Interviewed 11 Dec 2009. Baffes, J., 2002. Tanzania’s Cotton Sector: Constraints and Challenges in a Global Environment. Africa Region Working Paper Series No. 42. The World Bank. Washington D.C. Baffes, J., 2006. Restructuring Uganda’s Coffee Industry: Why Going Back to the Basics Matters. Development Prospects Group. The World Bank. Washington D.C. Baffoe, J.K., 2000. Structural adjustment and agriculture in Uganda. Working Paper – WP.149. International Labour Office. Geneva. Bakunda, G., 2008. Diagnostic Study of Uganda’s Manufacturing Sector. The African Centre for Trade and Development. Kampala. Bakunda, G. and Walusimbi-Mpanga, G., 2009. Labour Export as Government Policy – An Assessment of Uganda’s Potential for Export of Labour in the Framework of Regional and Multilateral Agreements. ICBE and PSFU. Kampala. Bargawi, H. and Oya, C., 2009. ‘Agribusiness for Development’: Who Really Gains? Development Viewpoint, Number 36. Centre for Development Policy and Research. London. Charalambides, N., 2009. EAC-GTZ Programme ‘Support to Regional Integration in the EAC’. The Regional Integration Committee; Ministry of East African Community. Kigali, Rwanda. Companies and Markets, 2010. Tanzania Agribusiness Report Q3 2010. Dar es Salaam. Available online at: http://www.companiesandmarkets.com/Summary-Market-Report/tanzania-agribusiness-report-q3-2010-328840.asp (accessed 16 Nov 2010). Cypher, J.M., Dietz, J.L., 2009. The Process of Economic Development. 3rd edition. Routledge: London and New York. Dasgupta, S., 2005. Will Services be the new engine of economic growth in India? University of Cambridge. Centre for Business Research. Working Paper No. 310. Cambridge.
81
Doland, C. and Humphrey, J., 2000. Governance and Trade in Fresh Vegetables: The Impact of UK Supermarkets on the African Industry, Journal of Development Studies, Vol. 37, No. 2, pp. 147-176, Available online at http://www.hubrural.org/pdf/dolan_humphrey.pdf (accessed 10 November 2010) EIU (Economic Intelligence Unit), 2008. Country Profile: Tanzania. The Economic Intelligence Unit Limited. London. www.eiu.com. EIU (Economist Intelligence Unit), 2009. Country Report: Uganda. The Economist Intelligence Unit Limited. London. www.eiu.com. EIU (Economist Intelligence Unit), 2010. Country Profile: Uganda. The Economist Intelligence Unit Limited. London. www.eiu.com. EC (European Commission), 2003. Should developing country industrialisation policies encourage processing of primary commodities? European Commission ACP-EU. No. 196 Jan-Feb 2003. Brussels. Available online at: http://ec.europa.eu/development/body/publications/courier/courier196/en/en_030_ni.pdf (accessed 20 February 2010). FAO, 2006. FAO Umbrella II Project – Strengthening National Capacity in Agricultural Trade and Trade Negotiations. GVP/URT/056/IRE United Republic of Tanzania.
FAO, 2007. National Fishery Sector Overview United Republic of Tanzania. Available online at: http://www.fao.org/countryProfiles/water/default.asp?lang=en&ISO3=TZA (accessed 27 November 2010). FAO, 2010. Wheat Production Potential in Tanzania. Available online at: http://www.fao.org/ag/AGP/agpc/doc/field/Wheat/africa/tanzania/tanzaniaagec.htm (accessed 27 November 2010). FAO and UNIDO, 2008. Agricultural Mechanization in Africa…Time for action – Planning investment for enhanced agricultural productivity. Report of an Export Group Meeting in Vienna Austria. Available online at: http://www.unido.org/fileadmin/user_media/Publications/Pub_free/agricultural_mechanization_in_Africa.pdf (accessed 19 February 2010). Forbes, 2010. Research and Markets: Sugar Consumption in Tanzania Will Grow By 32% to 2014. New York. Available online at: http://www.forbes.com/feeds/businesswire/2010/08/26/businesswire144426283.html (accessed 16 Nov 2010). GoT (The Government of Tanzania), 2000. The Tanzania Development Vision 2025. Dar es Salaam. Available online at: http://www.tanzania.go.tz/vision.htm (accessed 13 August 2010). GoT (The Government of Tanzania), 2001. The Education and Training Sector Development Programme Document. The United Republic of Tanzania. Dar es Salaam.
82
GoT (The Government of Tanzania), 2005. National Strategy for Growth and Reduction of Poverty (NSGRP). The United Republic of Tanzania. Dar es Salaam. GoT (The Government of Tanzania), 2008. Health Statistical Abstract. The United Republic of Tanzania. Dar es Salaam. Hambrock, J. and Hauptmann, S., 1999. Industrialisation in India. University of Dublin. Dublin. Hamisi, A., 2010. Tanzania cotton prices soar as demand rises. East African Business Week. Dar es Salaam. Available online at: http://www.busiweek.com/10/page.php?aid=1138 (accessed 28 November 2010). Hernandez, C., 2006. Services Sector: its importance for development and potential impacts of its liberalization – Lessons learned from Vietnam’s experience. CIS Regional Workshop on WTO Accession. UNDP/SURF-WCA. Dakar. ICTSD (International Centre for Trade and Sustainable Development), 2007. Opportunities and Risks of Liberalizing Trade in Services in Tanzania. ICTSD, Issue Paper No. 4. Geneva. Available online at: http://ictsd.net/downloads/2008/06/ip_4_tanzanie_dec071.pdf (accessed 29 January 2011). IMF (international Monetary Fund), 2010. The Republic of Uganda: National Development Plan 2010/11 – 2014/15, International Monetary Fund, Washington, D.C. Available online at: http://www.imf.org/external/pubs/ft/scr/2010/cr10141.pdf (accessed 28 November 2010). Jensen, J. et al., 2008. Modelling Service Liberalization – The Case of Tanzania. Policy Research Working Paper 4801. The World Bank. Washington D.C. Kaplinsky, R. and Morris, M., 2007. Do the Asian Drivers Undermine Export-Oriented Industrialisation in SSA? The Open University. Milton Keynes. Available online at: http://asiandrivers.open.ac.uk/documents/Kaplinsky_Morris_WD_ADs_Special_Issue_April_07_final.pdf (accessed 20 February 2010). Karega, V., 2010. Measures Undertaken to raise cotton production in six regions. The Citizen. Dar es Salaam. Available online at: http://allafrica.com/stories/201010170052.html (accessed 29 November 2010). Karmakar, S., 2008. An Open Services Regime – Recipe for Jobless Growth? Indian Council for Research on International Economic Relations. New Delhi Working Papers No 210. New Delhi. Available online at: http://ideas.repec.org/p/ind/icrier/210.html (accessed 20 February 2010). Kasozi, J., 2010. Maize Grade Worst in East Africa. AllAfrica. Kampala. Available online at: http://allafrica.com/stories/201004280317.html (accessed 30 November 2010). Kavuma, R., 2009. Great Expectations in Uganda over Oil Discovery. Guardian.co.uk. Available online at: http://www.guardian.co.uk/katine/2009/dec/02/oil-benefits-rural-uganda (accessed 26 July 2010). Lubwama, D., 2009. Uganda Cotton Development Organisation (CDO). Interviewed 3 November 2009. Kampala.

83
Magai, P., and Marquez-Velazquez, A., 2011. Tanzania’s Mining Sector and Its Implications for the Country’s Development. Mimeo. Berlin. DAAD Partnership on Economic Development Studies (forthcoming). Marti, D., and Ssenkubuge, I., 2009. Industrialisation and Industrial Policy in Africa: Is it a policy priority? Research Papers 20. South Centre. Geneva. Available online at http://www.southcentre.org/index.php?option=com_docman&task=doc_download&gid=1354 (accessed 20 February 2010). Mbae, P., 2009. Uganda Tea Development Agency (UTDA). Interviewed 27 October 2009. Kampala. MCT (Ministry of Communication and Transport), 2003. National Transport Policy. The United Republic of Tanzania. Dar es Salaam. MCT (Ministry of Communication and Transport), 2003a. National Information and Communications Technology Policy. The United Republic of Tanzania. Dar es Salaam. MFEA (Ministry of Finance and Economic Affairs), 2009. Guidelines for the preparation of medium term plan and budget framework for 2009/10 – 2011/12. The United Republic of Tanzania. Dar es Salaam. MHSW (Ministry of Health and Social Welfare), 2009. Health Sector Strategic Plan III. The United Republic of Tanzania, Dar es Salaam. MIT (Ministry of Industries and Trade), 1996. Sustainable Industries Development Policy. The United Republic of Tanzania. Dar es Salaam. MIT (Ministry of Industries and Trade), 2003. National Trade Policy – Trade Policy for a competitive economy and export-led growth. The United Republic of Tanzania. Dar es Salaam. MITM (Ministry of Industry, Trade and Marketing), 2007. Industrial Survey Report for Participatory Monitoring and Evaluation of Industrial Sector Performance in Tanzania. The United Republic of Tanzania. Dar es Salaam. MITM (Ministry of Industry, Trade and Marketing), 2008. Analysis of the Services Sector with a view to making commitments in the context of trade liberalization at bilateral, regional and multilateral trade negotiations. The Case of Tanzania. The United Republic of Tanzania. Dar es Salaam. MNRT (Ministry of Natural Resources and Tourism), 1999. National Tourism Policy. The United Republic of Tanzania. Dar es Salaam. MNRT (Ministry of Natural Resources and Tourism), 2002. Tourism Master Plan. The United Republic of Tanzania. Dar es Salaam. MNRT (Ministry of Natural Resources and Tourism), 2009. Tourism Statistical Bulletin. The United Republic of Tanzania. Dar es Salaam.

84
MoAFSC (Ministry of Agriculture Food Security and Cooperatives), 2008. Agricultural Sector Review and Public Expenditure Report. The United Republic of Tanzania. Dar es Salaam. MoE (Ministry of Education and Vocational Training of the United Republic of Tanzania): homepage http://www.moe.go.tz/ MoFPED (Ministry of Finance, Planning and Economic Development of the Republic of Uganda), 2009. Background to the Budget 2009/10 – Enhancing strategic interventions to improve business climate and revitalize production to achieve prosperity for all. The Republic of Uganda. Kampala. MoFPED (Ministry of Finance, Planning and Economic Development of the Republic of Uganda), 2007. Competitive and Investment Climate Strategy 2006-2010 – Enhancing Competitiveness through Public-Private Partnerships. The Republic of Uganda. Kampala. MoFPED (Ministry of Finance, Planning and Economic Development), 2004. Poverty Eradication Action Plan 2004/05 – 2007/08. The Republic of Uganda. Kampala. MTTI (Ministry of Tourism, Trade and Industry), 2005. Plan for Modernisation of Agriculture, the Marketing and Agro-Processing Strategy. The Republic of Uganda. Kampala. MTTI (Ministry of Tourism, Trade and Industry), 2007a. The Uganda National Export Strategy 2008 -2012. The Republic of Uganda. Kampala. MTTI (Ministry of Tourism, Trade and Industry), 2007b. National Trade Policy, Trading Out of Poverty, Into Wealth and Prosperity. The Republic of Uganda. Kampala. MTTI (Ministry of Tourism, Trade and Industry), 2008. National Industrial Policy – A Framework for Uganda’s Transformation, Competitiveness and Prosperity. The Republic of Uganda. Kampala. NAADS (National Agricultural Advisory Services), 2010. Kampala. Information available online at: www.naads.or.ug . Nakimbugwe, D. (2009). Makerere University Department of Food Science and Technology. Interviewed October 2009. Kampala. Nkonya, E., 2002. Uganda Crop Market Characteristics, Constraints and Opportunities. The International Food Policy Research Institute. Washington D.C. OECD, 2001. Glossary of Statistical Terms – Industrial Production. Available online at: http://stats.oecd.org/glossary/detail.asp?ID=1338 (accessed 20 February 2010). Ojambo, F., 2010. Tanzania to grow genetically modified cotton. Tripe Output, Board says. Bloomberg. Johannesburg. Available online at: http://www.bloomberg.com/news/2010-08-16/tanzania-to-grow-genetically-modified-cotton-triple-output-board-says.html (accessed 29 November 2010).
85
Okidi, J. et al., 2005. Growth Strategies and Conditions for Pro-Poor Growth: Uganda’s Experience. Economic Policy Research Centre, Makerere University. Research Series No. 45. Kampala. OPM (Oxford Policy Management), 2005. Evaluation of the Plan for Modernisation of Agriculture. Oxford. PRLog, 2010. Recently Released Market Study: Tanzania Agribusiness Report Q4 2010. Available online at: http://www.prlog.org/11046146-recently-released-market-study-tanzania-agribusiness-report-q4-2010.html (accessed 16 Nov 2010). PSFU (Private Sector Foundation Uganda), 2009. Private Sector Platform for Action – A Synopsis of Private Sector Policy Concerns and Suggestions for Policy Reforms. Kampala. Online Available at: http://www.ugandainvest.com/admin/docs/PSFU%20Platform%20for%20action%202009.pdf (accessed 20 February 2010). Roe, A. and Essex, M., 2009. Mining in Tanzania – What future can we expect? The Challenge of Mineral wealth: Using resource endowments to foster sustainable development. Oxford Policy Management. London. Available online at: http://www.opml.co.uk/document.rm?id=1360 (accessed 3 May 2010). Rudaheranwa, N. et al., 2003. Supply Response of Selected Export Commodities in Uganda. Economic Policy Research Centre, Makerere University. Research Series No. 36. Kampala. Rudaheranwa, N., (no date). Trade Costs Relating to Transport Barriers in Uganda. Economic Policy Research Centre, Makerere University. Research Series No. 42. Kampala. Porter, M. and Schwab, K., 2008. The Global Competitiveness Report 2008-2009. World Economic Forum. Geneva. Available online at: http://www.weforum.org/pdf/GCR08/GCR08.pdf (accessed 20 February 2010). Semboja, H., 2002. Industrialisation of Tanzania. Confederation of Tanzania Industries. Dar es Salaam. Semboja, H., 2009. Review of Recent Economic Developments in Tanzania. Dar es Salaam. Sheehan, P., 2008. Beyond Industrialisation – New Approaches to Development Based on the Service Sector, UNU WIDER. SIDO (Small Industries Development Organisation), 2009. Newsletter Issue 28, July-September 2009. Dar es Salaam. Singh, N., 2006. Services-Led Industrialisation in India: Assessment and Lessons. MPRA Paper No. 1446, posted 07. November 2007. University of California. Santa Cruz. Available online at: http://www.un.org/esa/sustdev/publications/industrial_development/2_3.pdf (accessed 29 November 2010). Szirmai, A., 2009. Is Manufacturing still the main engine of growth in developing countries? United Nations University – World Institute for Development Economics Research. Available
86
online at: http://www.wider.unu.edu/publications/newsletter/articles/en_GB/05-09-Szirmai/ (accessed 20 February 2010). Talemwa, M., 2009. Where is Uganda’s Competitive Edge? The Observer. Kampala. von Toll, B., 2009. Foreign Direct Investment in the East Africa Community: The Effects of FDI on Agribusiness and Development. Hochschule für Technik und Wirtschaft. Berlin. Tanzania Invest, 2010. Tanzania Cotton Sector Saved by Stimulus Package. Available online at: http://www.tanzaniainvest.com/tanzania-agriculture/tanzania-agriculture-news/373-tanzania-cotton-sector-saved-by-stimulus-package (accessed 29 November 2010). Tanzania National Business Council (TNBC), 2009. 6th TNBC Meeting. Dar es Salaam. Available online at: www.tnbctz.com (accessed 29 November 2010). The Citizen, 2010. Wheat prices expected to remain stable in 3 months. 30th Dec 2010. Dar es Salaam. Available online at: http://www.thecitizen.co.tz/business/13-local-business/4469-wheat-prices-expected-to-remain-stable-in-3-months.html (accessed 27 November 2010). The East African, 2009. October 19-25, 2009. Kampala. The East African, 2010. Now Tanzania’s Inflation Rate at lowest point in over two years. July 5th. Kampala. Available online at: http://www.theeastafrican.co.ke/news/-/2558/951786/-/pcrddmz/-/index.html (accessed on August 4 2010). TNBC (Tanzania National Business Council), 2009. Strategy for Revitalizing the Manufacturing, Agribusiness and Export Development Sub-Sectors in Tanzania. March, 2009. Dar es Salaam. Trading Economics, 2010. Kenya, Tanzania and Uganda. New York. Available online at: http://www.tradingeconomics.com/ (accessed 28 July 2010). TWG (Tourism Working Group), 2003. Report by the Tourism Working Group on Issues Affecting Tourism Investments in Tanzania and Recommended Action. April 2003. Dar es Salaam. UBOS (Uganda Bureau of Statistics), 2007. Statistical Abstract 2007. Kampala. Available online at: http://www.ubos.org (accessed 20 February 2010). UBOS (Uganda Bureau of Statistics), 2009. Statistical Abstract 2009. Kampala. Available online at: http://www.ubos.org/onlinefiles/uploads/ubos/pdf%20documents/2009Statistical_%20Abstract.pdf (accessed 20 February 2010). UCDA (Uganda Coffee Development Authority) n.d. Kampala. Information available online at: http://www.ugandacoffee.org (accessed 20 February 2010). UDSM (University of Dar es Salaam), 2006. A Review of Legal, Regulatory and Judicial Framework for Manufacturing and Business in Tanzania. Report prepared for the Confederation of Tanzania Industries, May 2006. Dar es Salaam.

87
UEPB (Uganda Export Promotion Board) and ITC (International Trade Centre), 2005. Uganda Service Sector Export Strategy. UEPB. Kampala. UEPB (Uganda Export Promotion Board), 2009a. Cotton and Textiles Sector Profile. UEPB. Kampala. Available online at: http://www.ugandaexportsonline.com/2009/documents.php (accessed 20 February 2010). UEPB (Uganda Export Promotion Board), 2009b. Processed Fruits Profile. UEPB. Kampala. Available online at: http://www.ugandaexportsonline.com/2009/documents.php (accessed 20 February 2010). UEPB (Uganda Export Promotion Board), 2009c. Fish Sector Profile. UEPB. Kampala. Available online at: http://www.ugandaexportsonline.com/2009/documents.php (accessed 20 February 2010). UNBS (Uganda National Bureau of Standards), 2005. Kampala. Information available online at: http://www.unbs.go.ug. UNCTAD (United Nations Conference on Trade and Development), 2008. Strategies for Advancing the development of the services sector of Uganda – A Concept Note by UNCTAD. Draft Version 08 September 2008. UNCTAD. Geneva. UNICEF (United Nations International Children’s Emergency Fund), 2010. Uganda Statistics. Available online at: http://www.unicef.org/infobycountry/uganda_statistics.html#77 (accessed 22 October 2010). UNIDO (United Nations Industrial Development Organisation), 2009. Industrial Development Report – Breaking In and Moving Up: New Industrial Challenges for the Bottom Billion and the Middle-Income Countries. Vienna. Available online at: www.unido.org/fileadmin/user_media/Publications/IDR_2009_print.PDF (accessed 22 February 2010) United Republic of Tanzania, 2001. Agricultural Sector Development Strategy. The United Republic of Tanzania. Dar es Salaam. Available online: http://www.tzonline.org/pdf/agriculturalsectordevelopmentstrategy.pdf (accessed 13 August 2010). U.S. Census Bureau, 2007. 21 Mining, Quarrying, and Oil and Gas Extraction. Washington D.C. Available online at: http://www.census.gov/naics/2007/def/NDEF21.HTM (accessed 26 July 2010). Walters, P., 2005. Why Services Matter to Development – A path to growth. International Trade Forum. International Trade Centre. Geneva. Walusimbi-Mpanga, G., 2009. Proposals Towards an EAC Request to the EC in the EAC-EC EPA Negotiations – Draft Version. The International Lawyers and Economists Against Poverty (ILEAP). Toronto. WB (World Bank) (2007). World Development Report 2008: Agriculture for Development, Washington, DC: The World Bank, Available online at

88
http://siteresources.worldbank.org/INTWDR2008/Resources/WDR_00_book.pdf (accessed 20 February 2010). WTO (World Trade Organization), 2006. Trade Policy Review EAC – Uganda. World Trade Organisation. Geneva. WTTC (World Travel and Tourism Council), 2008. Tanzania. Dar es Salaam. Available online at http://www.wttc.org/eng/Home/ (accessed 29 January 2011).

89
Annex: Selected data for Uganda and Tanzania Figure A1
Figure A2
Figure A3
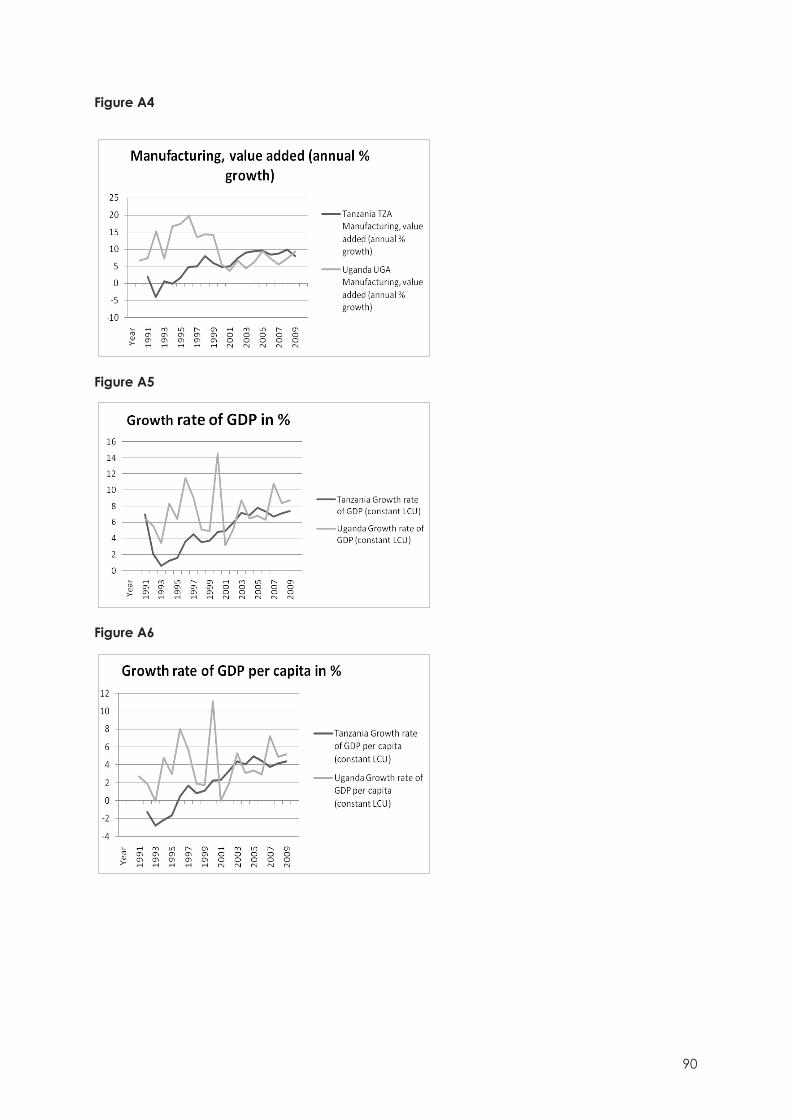
90
Figure A4
Figure A5
Figure A6
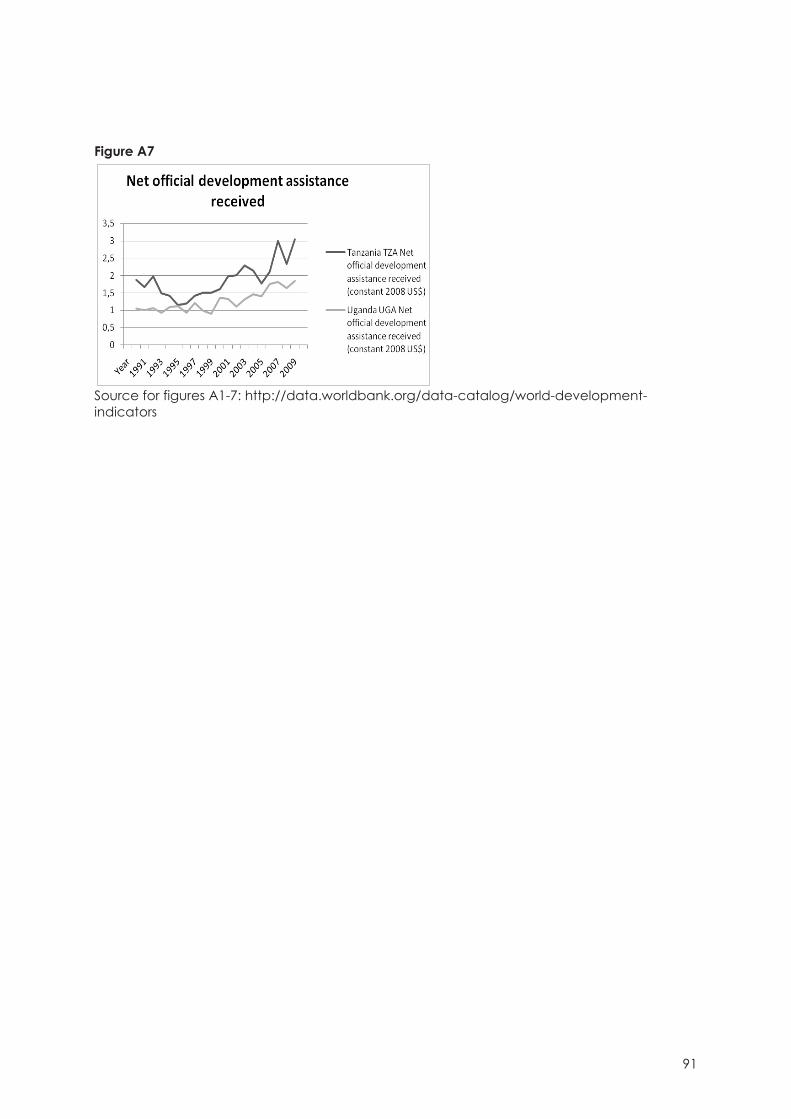
91
Figure A7
Source for figures A1-7: http://data.worldbank.org/data-catalog/world-development-indicators

�
�
�
�
�
Publisher: Competence Center “Money, Finance, Trade and Development�“� HTW-Berlin – Treskowallee 8, 10318 Berlin Prof. Dr. Sebastian Dullien, Prof. Dr. Jan Priewe http://finance-and-trade.htw-berlin.de
ISSN: 2192-7790
© All rights reserved. Reproduction for educational and non- commercial purposes is permitted provided that the source is acknowledged.