IS BIGGER BETTER? AN ANALYSIS OF ECONOMIES OF SCALE …
69
IS BIGGER BETTER? AN ANALYSIS OF ECONOMIES OF SCALE AND MARKET POWER IN IDAHO POLICE DEPARTMENTS by Tate Jayden Fegley A thesis submitted in partial fulfillment of the requirements for the degree of Master of Arts in Criminal Justice Boise State University May 2016
Transcript of IS BIGGER BETTER? AN ANALYSIS OF ECONOMIES OF SCALE …

IS BIGGER BETTER? AN ANALYSIS OF ECONOMIES OF SCALE AND MARKET
POWER IN IDAHO POLICE DEPARTMENTS
by
Tate Jayden Fegley
A thesis
submitted in partial fulfillment
of the requirements for the degree of
Master of Arts in Criminal Justice
Boise State University
May 2016

© 2016
Tate Jayden Fegley
NO RIGHTS RESERVED

BOISE STATE UNIVERSITY GRADUATE COLLEGE
DEFENSE COMMITTEE AND FINAL READING APPROVALS
of the thesis submitted by
Tate Jayden Fegley
Thesis Title: Is Bigger Better? An Analysis of Economies of Scale and Market Power in Idaho Police Departments
Date of Final Oral Examination: 02 March 2016 The following individuals read and discussed the thesis submitted by student Tate Jayden Fegley, and they evaluated his presentation and response to questions during the final oral examination. They found that the student passed the final oral examination. Lisa Growette Bostaph, Ph.D. Chair, Supervisory Committee Andrew Giacomazzi, Ph.D. Member, Supervisory Committee Geoffrey Black, Ph.D. Member, Supervisory Committee The final reading approval of the thesis was granted by Lisa Growette Bostaph, Ph.D., Chair of the Supervisory Committee. The thesis was approved for the Graduate College by John R. Pelton, Ph.D., Dean of the Graduate College.

iv
DEDICATION
This thesis is dedicated to D. Allen Dalton, whose generosity helped make it
possible.

v
ACKNOWLEDGEMENTS
I would like to thank Dr. Lisa Growette Bostaph, whose comments made this
thesis several times better than what it would have been, Lea Johnson for her help
organizing the data, and Dr. Don Holley and Dr. Cody Jorgensen for their econometric
guidance. I would also like to thank Allen Dalton for leading me to this research topic
and his editorial input.

vi
ABSTRACT
Whether the nature of policing services allows for economies of scale to be
realized is an important question for police departments for reasons of both cost and
efficiency. This study replicates the methodology used by Southwick (2005) to estimate
police production and demand in order to determine whether there are economies of scale
among police departments in Idaho. Southwick's (2005) method is unique in that it
incorporates measures of market power to predict police efficiency. The present study is
unique in that it involves data from a low density, low population western state.
Southwick's results for New York State are markedly different from the results found for
Idaho, thus the external validity of Southwick's model as applied to a relatively low
population state is questionable. The findings also indicate that, controlling for relevant
variables, crime in Idaho is highly correlated with population, suggesting that Idaho
police departments would not achieve efficiency gains through consolidation.

vii
TABLE OF CONTENTS
DEDICATION ......................................................................................................................... iv
ACKNOWLEDGEMENTS ...................................................................................................... v
ABSTRACT ............................................................................................................................. vi
LIST OF TABLES ................................................................................................................... ix
LIST OF ABBREVIATIONS ................................................................................................... x
CHAPTER ONE: INTRODUCTION ....................................................................................... 1
CHAPTER TWO: LITERATURE REVIEW ........................................................................... 3
The Purpose of American Policing and Measuring Police Output ............................... 3
The Police Department as an Organization .................................................................. 7
Determination of the Effectiveness of Policing .......................................................... 11
Economies of Scale in Municipal Services ................................................................. 14
Economies of Scale and Policing Services ................................................................. 16
CHAPTER THREE: METHODOLOGY ............................................................................... 24
Sample and Sampling Design ..................................................................................... 24
Model .......................................................................................................................... 24
Data Sources and Variables ........................................................................................ 25
Internal and External Validity ..................................................................................... 28
Explication of Two Stage Least Squares Model ......................................................... 29
CHAPTER FOUR: RESULTS ............................................................................................... 31

viii
CHAPTER FIVE: DISCUSSION ........................................................................................... 39
Study Limitations ........................................................................................................ 42
Policy Implications ..................................................................................................... 44
Recommendations for Further Research ..................................................................... 45
CONCLUSION ....................................................................................................................... 49
REFERENCES ....................................................................................................................... 51

ix
LIST OF TABLES
Table 1. Variables ................................................................................................... 27
Table 2. Variable Descriptions (with Boise) ........................................................... 32
Table 3. Variable Descriptions (without Boise) ...................................................... 32
Table 4. Correlation Matrix (with Boise)................................................................ 34
Table 5. Correlation Matrix (without Boise) .......................................................... 35
Table 6. Regression Results – Production Function ............................................... 37
Table 7. Regression Results – Demand Function ................................................... 38
Table 8. Comparison of New York and Idaho Datasets and Regressions .............. 39

x
LIST OF ABBREVIATIONS
A Assets
C4 Measure of the 4 FBI Index Violent Crimes
C7 Measure of all 7 FBI Index Crimes
COP Community-Oriented Policing
D Density
HH Herfindahl-Hirschman Index
LEMAS Law Enforcement Management and Administrative Statistics
NIBRS National Incident Based Reporting System
POLPOP Number of Police per 1,000 Population
POP Population
POP1 Inverse of Population
WPOL Total Expenditures on Police Divided by Number of Police

1
CHAPTER ONE: INTRODUCTION
Issues of cost and efficiency are important for local governments. Despite their
ability to tax, there is a limit to how much revenue they can collect and allocate to certain
uses. Policing is a service that many municipalities provide, though some choose to
contract it out to private companies or neighboring governments, citing economies of
scale as a cost savings justification. This is an efficient approach for services such as
garbage collection, which many cities contract out instead of providing 'in-house', but
does it work for policing?
The purpose of this study is to shed further light on the question, to what extent
are there economies (or diseconomies) of scale in policing? This is an important question
as public safety is one of the most crucial services that cities provide. Since all cities have
a limited supply of funds, producing services in the most efficient way possible will
allow them to maintain more or better quality services. In terms of policing, some smaller
municipalities contract their policing services to county sheriffs' offices, justifying such a
measure based on cost savings, assuming that larger county sheriffs' offices enjoy
economies of scale over smaller municipal police departments (Finney, 1997). While
there are intuitive reasons to expect that larger police departments enjoy cost savings in
some areas, such as through the elimination of duplicate layers of management
(Southwick, 2005), there are ways in which they may be less efficient in providing public
safety. One example is that larger departments devote a smaller percentage of personnel
to street patrol (Lithopoulos, 2015). Knowing at which point economies of scale are
2
maximized, or having an idea of when mergers incur diminishing (or even negative)
returns to public safety, can help ensure that municipal governments have more optimal
levels of policing subject to their budgetary constraints.
Another reason this research question is important is that, just like any other
resource, public services are scarce and must be allocated to their most highly valued
uses in order to achieve the efficient level of public safety. Police departments face an
economic knowledge problem that most other industries deal with to a lesser extent.
Although police departments are able to calculate the costs of providing their services,
they do not receive revenue based on the type or number of services they provide, and,
therefore, lack market feedback on which services are most highly valued by citizens in
terms of what they are willing to pay. In other words, police departments do not have the
benefit of the information profits and losses provide in making decisions on
organizational size (Mises, 1998). They do not have the informational benefits provided
by competition and market prices; rather, the scale of police departments is a bureaucratic
decision made without the benefit of this information. Thus, due to the institutional
framework in which they operate, police departments face greater hurdles than private
industry in achieving the most efficient size.1 This research intends to address, but not
necessarily serve as a substitute for, this lack of knowledge.
1Due to the nature of policing and the local differences in expectations of police, the ideal scale for policing may be different depending on the location. Indeed, the International Association of the Chiefs of Police (2007) discourages using figures such as officers per thousand population to make staffing decisions.

3
CHAPTER TWO: LITERATURE REVIEW
The Purpose of American Policing and Measuring Police Output
In order to test whether there are economies of scale in policing, it is necessary to
define the purpose of modern American policing. This section contains an extended
discussion of how the role of the police has changed over time and, thus, how measures
of their performance have (or have not) changed as well. This discussion is included in
order to explain the complexities of the policing role and the corresponding difficulty of
finding an accurate measure of police output for the purpose of measuring economies of
scale.
Though scholars differ in the specifics of what police should do, there is
widespread agreement on defining who the police are. Bittner (1979) describes the
modern Western police force as arising during an era (in the late 19th century) in which
“the quest for peace by peaceful means is one of the cultur[al] traits” (p. 36) of
civilization. Instead of the police simply being the means by which kings or other heads
of state enforce their will upon the governed, the police are to serve the function of
maintaining the peace in a neutral manner so as to minimize the amount of violence in
society. However, Bittner also describes the police in less lofty terms: “...police are
nothing else than a mechanism for the distribution of situationally justified force in
society” (1979, p. 39). In other words, police still serve as the arm of the state that fulfills
its claim as a “monopoly on the legitimate use of physical force within a given territory”
(Weber, Mills, & Gerth, 1965, p. 1).

4
Although this definition appears limited, the hope is that the police will play a
wider public service role rather than strictly a law enforcement one. Indeed, Bayley
(1979) argues that the scope of the police function is more than guarding life and
property and enforcing laws. Despite attempts to neatly categorize all police functions,
Bayley (1979) denies that these descriptions capture the full range of what police actually
do, especially when considering the far greater number of administrative functions
undertaken by police in continental Europe compared to the United States. In his “nearly
exhaustive list of police functions, specifying at least one country where each is
performed,” Bailey (1979, p.111) includes “advising about crime prevention
(Canada)...conducting prosecutions (Britain)...gathering information about political and
social life (France)...[and] counseling juveniles (Netherlands)” (p.111-112) among a host
of other activities. In order to accommodate all of these diverse responsibilities, Bayley
confers upon police a rather elastic definition: “Police are a group authorized in the name
of territorial communities to utilize force within the community to handle whatever needs
doing” (1979, p. 113, emphasis added). This is consistent with Dunham and Alpert
(2001), who note that the complexity of the role of the modern police officer has
expanded, but the justification for the police remains largely the same: to ensure a
civilized society, provide domestic safety, and to make sure people contribute to paying
for public goods (though it is no longer the local police who enforce tax laws).
Eck and Rosenbaum (1994) describe four main traditional functions of police.
The first function is crime control, even though most police activities are not directly
related to crime control. The second is to provide emergency services to people in need.
The third function, which most other scholars do not mention, is to serve justice; that is,

5
to enforce the law even in situations where it is unclear that enforcement will serve a
crime control function. Even if the efficacy of arrest in terms of serving the crime control
function is questionable, it demonstrates that there are consequences for those who break
the law, thus also serving a legitimizing function for the institution of the police. The
fourth function is a catch-all: providing non-emergency services. In community-oriented
policing2 (discussed below), all four of these traditional functions remain important,
though with greater priority placed on the non-emergency service function. Some
examples of these non-emergency service functions, according to Goldstein (1977),
include ensuring individual constitutional protections such as the freedom of speech,
facilitating flows of traffic, assisting individuals who cannot care for themselves (such as
the intoxicated and the mentally ill), providing conflict resolution (between individuals as
well as between individuals and the government), and identifying and solving problems
that have the potential to grow into more serious issues.
As will be discussed below, the role of the police is intimately connected with
both how police performance is measured and how a police organization is structured and
managed. Many American police departments claim to have made the transition between
the professional era of policing (with its emphasis on crime control, rapid response, and
random patrol) to community-oriented policing (COP). Under COP, police are expected
to do more than simply engage in preventive patrols, investigate crimes, and respond to
calls for service. They are to take a more active, problem-solving approach, preventing
the conditions in communities that can lead to more serious crime (Wilson & Kelling,
1982; Goldstein, 1979). But is this actually a change in the role of the police or merely a
2 Community-oriented policing (COP) is used here as a broad term to describe a number of distinct, yet similar, approaches to policing, including the Community Partnership Model (see Correia, 2000) and Problem-Oriented Policing (Goldstein, 1990).

6
different and (hopefully) more effective method for the traditional goal of reducing
crime? Bittner (1979) notes that the role of the police always has been primarily
associated with law enforcement such that when they engage in other activities, they have
had to justify it by connecting it to serving the law enforcement function. Moore (1994, p.
292-293) describes community policing as establishing new goals, such as reducing fear
of crime, 'enhancing security,' building police-community partnerships, and helping to
provide communities with knowledge and resources in order for them to be involved in
providing for their own safety. However, he says it is unclear from the community
policing philosophy whether these are independent goals or whether they are primarily
for the purpose of reducing crime (Moore, 1994).
Indeed, despite the claim that COP became the dominant strategy in American
policing in the 1990s, and the fact that the 100,000 police officers hired as a result of the
1994 Crime Bill are legally required to be engaged in community policing, its lack of a
precise definition has complicated measuring to what extent police departments have
implemented community-oriented policing, as well as evaluation of its effectiveness
(Cordner, 2015). While many police departments have utilized an assortment of
innovations that they have labeled as community-oriented policing, it is unclear that the
philosophical orientation of police departments has been radically altered, or that their
assessments of performance have changed from the traditional measures of crime rates
and arrests (Cordner, 2015).
It is clear that most policing scholars see a greater role for police than simply
controlling crime, as do most citizens. Indeed, most calls to police are for non-crime
related matters (Dunham & Alpert, 2015). Police are expected to maintain order, provide

7
a very wide range of services, and engage in actions that reduce fear of crime in
neighborhoods. Regardless, crime control remains a primary function of the police.
The Police Department as an Organization
Whether economies of scale exist can depend on technology and the
organizational structure of a production unit. For example, organizations that are
excessively bureaucratic or hierarchical can suffer from diseconomies of scale due to too
many layers placed between upper-level management and front-line workers (Cowen and
Tabarrok, 2015). Therefore, the issue of police organization is relevant to the question of
economies of scale and will be considered in this section.
The traditional organizational model of policing in the professional era was
characterized by a hierarchical structure used in an attempt to control and coordinate
police efforts and standardize police procedure (Wilson & McLaren, 1963). Though this
approach may seem outdated today, it was developed in response to the patronage era of
policing, when police personnel were far more subject to the whims of elected officials.
Thus, insulating police decision-making and policy from short-term political influence
was at least partially responsible for police departments adopting a closed model of
organization (Cordner, 1978). The closed model (also called bureaucratic, formal,
rational and mechanistic) has some of the following characteristics:
Routine tasks occurring in stable conditions, task specialization, means (or the proper way to do a job) are emphasized, conflict within the organization is adjudicated from the top...one's primary sense of responsibility and loyalty are to the bureaucratic subunit to which one is assigned, knowledge is inclusive only at the top of the hierarchy. (Cordner, 1978, p. 23)
According to Cordner (1978), all of these aspects of the closed organizational model
describe the typical police department, except for “routine tasks occurring in stable

8
conditions” (p. 23), and this exception is quite important. Most police labor is allocated to
the patrol function, which often requires officers to face non-routine situations in unstable
conditions (Cordner, 1978). Furthermore, police officers in these situations often do not
have the benefit of managerial oversight and no procedural manual could possibly be
developed to guide officers based on the contingencies of the variety of situations they
encounter. Thus, if the closed organizational model is to be maintained or useful, the
police function has to be narrow enough so that it is amenable to bureaucratic
management. However, as previously discussed, such a narrow mission (crime control
and order maintenance), a mission which in practice is often not narrow, falls short of
what people expect from the police.
This leads Cordner (1978) to consider whether the open model of organizations
would be more appropriate to the modern police function. The characteristics of the open
model are:
Nonroutine tasks occurring in unstable conditions, specialized knowledge contributing to common tasks, ends (or getting the job done) are emphasized, conflict within the organization is adjusted by interaction with peers, one's sense of responsibility and loyalty are to the organization as a whole... (p. 29)
Police departments have embraced certain facets of the open model, such as utilizing
knowledge at all levels of their organization, problem solving and conflict resolution as
much as possible without direction from higher ranks (and thus encouraging horizontal
interaction and not relying upon vertical interaction), and allowing for more discretion
among the lower ranks (Cordner, 1978). Also, the open model's compatibility with non-
routine tasks taking place in unstable conditions is consistent with what police officers
experience: a wide variety of situations that requires them to use their discretion in
resolving a situation. However, there are certain aspects of policing that stand in the way

9
of a full embrace of the open model. One of these is the legalistic emphasis on means,
such as procedural due process. Although the goal of crime control may be hindered by
adherence to procedural due process, these means are considered to serve more important
ends (such as civil liberty) [Cordner, 1978]. There are dilemmas in what is expected of
the police that leave full embrace of either model untenable. We cannot create a
handbook of standardized responses to every situation the police encounter, though we
desire high standards and equity. And although police are considered the primary party
for controlling crime, there are limits placed on their power to do so. Despite this,
Cordner (1978) concludes that there are management approaches associated with the
open model (job enrichment, participatory management, and Theory Y)3 that are
applicable to police management, particularly strategies like team policing. The nature of
policing does not necessarily require a closed model.
Langworthy (1992) argues that the organizational structures in American policing
arose in such a way to serve the ends that local governments had for the police. Early
American policing organizations were much more decentralized than in the professional
era,
reflecting their close ties to political machines and ward politics. The agenda for these police organizations was to do a minimum amount of law enforcement, keep the neighborhood relatively quiet, and serve the needs of entrenched political interests. (1992, p. 89)
This style of policing existed in an era before the widespread use of civil service
protection laws and police department positions were patronage jobs to be distributed by
3Theory Y style of management was developed by Douglas McGregor (1957). In contrast to Theory X, which assumes employees dislike work and will try to avoid it and therefore must be managed in an authoritarian style, Theory Y sees employees as self-motivated and generally enjoying work that allows them to be creative.

10
the successfully elected. Thus, the role of the police was to do whatever (up to and
including election rigging) to ensure that the incumbent maintained power. Furthermore,
due to the cultural diversity of American cities where municipal police departments first
arose, as well as the constraints of communication technology, a decentralized
organizational structure was more appropriate for serving the police role at the time
(Langworthy, 1992).
However, part of Progressive Era reform was to attack this intimate connection
between politicians and the police (Langworthy, 1992). It was thought that a more
bureaucratic orientation would sever this inappropriate tie between politicians and police
officers, and that a narrower focus on law enforcement would better regulate police
activities. These reforms led to the 'professional era' of policing, during which American
police departments embraced the closed model of policing described above (Dunham &
Alpert, 2015).
This model of police organization that characterizes the professional era,
however, has since been found to be inadequate in serving all of the functions that are
expected of police, including crime control (Thurman, Zhao, & Giacomazzi, 2001). The
paramilitary structure and closed nature of the professional model are not ideal for
fostering collaboration with communities to solve problems (Thurman, Zhao, &
Giacomazzi, 2001). Due to the limitations of the closed, bureaucratic model, a number of
policing scholars (Cordner, 1978; Langworthy, 1992; Brogden & Nijher, 2013) argue that
police organizations would be better able to achieve their goals and solve unique
problems by having a more flexible and less mechanistic organizational structure.

11
However, despite the promises of having a more open organizational structure,
there is a lack of empirical evidence that such changes will improve policing services
(Cordner, 2015). As well, it is unclear how successful police organizations have been in
reforming themselves. In a study assessing whether changes in policing have reduced
violent crime, Eck and Maguire (1999) state that,
Although some police organizations have undoubtedly changed their structures, cultures, and management styles, evidence suggests that overall, such shifts are occurring glacially. Changes in structure are just now starting to occur nationally. Evidence suggests that changes in culture, if they are occurring at all, are probably not widespread. (p. 220-221)
And despite many police departments’ claims to have implemented COP (which often
goes no further than initiating a single community-oriented tactic), police performance is
still heavily evaluated upon what can easily be measured: crime rates, clearance rates,
tickets issued, and arrests (Dunham & Alpert, 2015).
The following section discusses how police performance has traditionally been
measured, the shortcomings of these measures, and the data currently available.
Determination of the Effectiveness of Policing
In this section, we arrive at the point of our extended discussion about the role of
policing and police organizations: producing a measure of police performance (or output)
in order to assess whether economies of scale exist. As discussed above, the role of
American police goes beyond crime control and law enforcement. Regardless, police are
still expected to reduce crime. Chaiken (1976) writes that the control of crime, both to the
public and police administrators, is a dominant goal of the police. Despite the fact that
officers spend most of their time dealing with issues that are not crime-related, police
would have difficulty in defending their budgets in terms of benefits not related to crime

12
reduction (Chaiken, 1976). Police departments themselves are not free from blame for
this perception. In budget negotiations, police unions have used arrest numbers and crime
rates in order to argue for higher budgets (Benson, Rasmussen, & Sollars, 1995). And
even if crime rates were a conceptually accurate measure of police performance, they
have serious validity issues:
Some crimes occur but are not reported to the police, while other crimes are reported to the police but are ignored or reclassified as to time, location, or crime type. When the police officers know that the crime counts will or may be used to evaluate the effectiveness of a particular activity, the incentives for discretionary alteration of the crime counts may be great. (Chaiken, 1976, p. 5)
Perversely, reported crime rates may increase if police are more effective; that is, if
victims perceive that alerting the police could have a positive effect, they will be more
likely to report than if they expected that police involvement would have a neutral or
negative result (Kelling, 1999).
Arrest rates also present difficulties in terms of measuring police performance.
Kelling (1999) offers an empirical example of this, comparing two types of responses to
graffiti issues in the New York City subways. One strategy involved greater amounts of
patrol during certain hours of the day and more arrests for those engaged in graffiti. The
other strategy conducted by the Transportation Authority involved quickly painting over
graffiti after it was discovered. Despite the latter strategy leading to fewer arrests, it was
more effective in lowering the instances of unwanted graffiti (Kelling, 1999). Likewise,
situations where an officer can intervene and resolve a conflict before a crime occurs will
not show up in arrest statistics. Thus, traditional measures of police performance (crime
rates, arrest rates, clearance rates) leave much to be desired.

13
Issues such as these have led researchers to propose radically different methods of
measuring police performance. In their report for the National Institute of Justice,
Whitaker, Mastrofski, Ostrom, Parks, and Percy (1982) describe many of the issues with
proposed alternative measurements of police performance and offer their own
recommendations. Problems that must be avoided are: collecting certain kinds of data
simply because they are easier to collect, conflating service quality with quantity, failure
to scrutinize the data collection process, and trying to develop one measure of output (or
indexes of variables) despite the wide-ranging mandates of police departments that
cannot be measured in a single output. Instead, Whitaker et al. (1982) suggest that
performance measurement should be a learning process where problems are identified,
programs are developed, and theories are formulated. Although this may not provide us
with an objective, cardinal measure of police performance, it may be more realistic and
helpful in informing police departments about how they can improve. Whitaker et al.
(1982) comment,
Some observers, like Lipsky, believe that all attempts to measure police performance are misleading. We do not share this pessimism. We may not be able to say that one agency is twice as good at reducing burglary than another, and a single performance measure may be too little a basis for policy decision, but carefully constructed measures which are based on explicit, tested theories can provide useful knowledge about service quality as well as service quantity. To abandon measurement of police services, despite the many obstacles, would be to abandon a very essential component to the necessary and never-ending debate about what constitutes good police service. (p. 22)
Unfortunately, most departments have not radically changed the way they
measure and evaluate their performance. According to the most recent Law Enforcement
Management and Administrative Statistics (LEMAS) survey, less than a third of law
enforcement agencies even bother to assess the community's opinion of the police

14
department's efforts (Davis et al., 2015).4 Consider, for example, how important of a role
'fear of crime' plays as a component of quality of life outcomes the police are expected to
improve under COP (Cordner, 2015). The fact that a sizable majority of police agencies
do not attempt to collect even this relatively simple type of data strongly suggests that
obtaining other alternative measures of performance is not a priority. Therefore, those
attempting to measure police efficiency and economies of scale have to rely on data that
is collected, such as crime rates, arrest rates, and clearance rates.
Economies of Scale in Municipal Services
Economies of scale describe a situation in which an enterprise has increasing
returns to scale; that is, an increase in inputs leads to a proportionately larger increase in
output, and as a result, per unit costs fall (Cowen & Tabarrok, 2015). This can be the case
in a firm where, say, a merger with a similar firm allows them to reduce duplicate inputs
and yet maintain or increase their collective output. Diseconomies of scale describe the
opposite situation: growth in inputs leads to a proportionately smaller increase in output.
Considerations of economies of scale can apply to public as well as private enterprises
(Cowen & Tabarrok, 2015).
At the turn of the twentieth century, several British scholars tested the relationship
between a city's size and per capita municipal expenditures. Baker (1910) analyzed 72
English cities and discovered that the per capita expenditures minimized at around a
90,000 population. Beyond that size, all city services except for electricity and gas
increased in cost per capita. Likewise, a study by Oxford University (1938) found
diseconomies of scale for urban services in cities surpassing 250,000. The National
4Davis et al. (2015) note that this figure includes not only agencies conducting large mail or telephone surveys, but also those doing nothing more than simply soliciting comments from visitors to their department websites.

15
Resources Committee (1939) observed an increase in per capita costs in city expenditures
for municipalities greater than 275,000 population. Duncan (1956) analyzed municipal
budget data for 1942 and noticed that per capita costs were minimized in cities with
populations between 50,000 and 100,000. Hirsch (1959) tested 149 governmental units in
the St. Louis metropolitan area and in Massachusetts to analyze what effects urban
growth and municipal consolidation have on city service expenditures. His results
indicated a $1.24 decrease in per capita expenditures as population increased from 1,000
to 110,000. However, they also indicated a $3.62 increase in per capita expenditures
when population increases from 110,000 to 300,000 and a $12.26 increase for 300,000 to
500,000. Thus, diseconomies of scale started at 110,000 and grew with additional
population increases. In analyzing different types of services specifically, Hirsch (1959)
concluded that the per capita costs of public education, fire and police protection, and
garbage collection were unrelated to the size of the population, while government
administrative costs tended to be minimized in a 'medium-sized' community, and water
and sewage services have such large economies of scale that few cities have reached a
point at which diseconomies start to occur.
Further studies continue to suggest that diseconomies of scale in municipalities
exist. Ostrom (1972) considered thirteen studies of American cities; the primary
conclusion was that there is no association between the size of the city and the average
cost of city services. Derksen (1988) analyzed studies of Dutch consolidation, concluding
that they resulted in no efficiency gains. Boyne's (1995) survey of studies in the United
Kingdom found diseconomies of scale. Martin (1995) analyzed research in a variety of
European cities that had mixed results and were therefore considered inconclusive. In

16
reviewing studies of American and Canadian cities, Bish (2001) reported that most
government activities at the local level do not have economies of scale beyond a small
service area. Byrnes and Dollery (2002) found mixed results in their survey of thirty-two
studies in America, the United Kingdom, and Australia. The weight of the evidence
suggests that, overall, most municipal services are not subject to economies of scale and
that municipalities minimize their per capita costs in populations less than 100,000.
Assuming this figure is accurate for policing, precisely where economies of scale
are maximized is an important question for police agencies. The next section will further
discuss police services and economies of scale.
Economies of Scale and Policing Services
In addition to analyzing municipal services more generally, researchers have also
examined police departments specifically for economies (or diseconomies) of scale. As
mentioned above, Hirsch (1959) included policing in his study of municipal services.
Using 1955-1956 data from 64 St. Louis police departments, Hirsch (1959) estimated the
total per capita cost of police protection as a function of night-time population, night-time
population density, total miles of streets, percentage of population that was non-white,
percentage of population under 25, income of business establishments, measurements of
the scope and quality of police protection (based on independent ratings by a panel of
police experts), and the assessed value of real estate. Despite variations in night-time
populations,5 per capita expenditures did not vary much. Hirsch (1959, p.238) concluded:
“it can be said that in this case relatively poor police services were offered at about equal
5That is, populations that resided in the communities studied, as areas zoned solely for business do not have residential populations at night, and therefore lack the supervision that non-zoned or mixed use areas have (Jacobs, 1961).

17
per capita expenditures regardless of the size of the community, partialling out the effect
of other factors”. Thus, Hirsch claims to have found no economies of scale in policing.
Walzer (1972) used a linear regression equation to estimate the presence of
economies of scale in Illinois police departments. In contrast to Hirsch (1959), he
operationalized policing quality with an 'index of service' based on number of offenses
cleared, number of accidents investigated, and the number of miles traveled by police
vehicles as a proxy for general police services. In order to make these components of the
index comparable, Walzer (1972) used a weighting system based on the amount of time
required to complete these tasks.6 Although this methodology attempted to incorporate a
measure of police service beyond that of only crime control, it is unclear that accidents
investigated and miles traveled provide an accurate measure. Indeed, several community
policing strategies, which involve police officers getting out of their vehicles and
interacting with the community in a non-enforcement context, would not be measured by
Walzer's methodology, and would actually result in a lower index of service due to the
opportunity cost of logging miles traveled. Therefore, it is doubtful that Walzer's (1972)
index of service provides a superior measure of police performance to more popular
measures such as crime rates (Davis et al, 2015).
Like Hirsch (1959), Walzer (1972) used a cost function. He found a positive
relationship between average cost of police protection and city size, as well as average
cost of police protection and population density, suggesting that diseconomies of scale
exist. Walzer (1972) attributed this latter relationship to the idea that these areas contain
6Walzer's (1972) estimated average time to investigate and resolve a traffic accident is 80 minutes. Converting miles traveled into an approximated time involved calculating average speed and then dividing total miles traveled by that figure to estimate a time. However, Walzer (1972) is not clear on how he produced a figure for average time involved in clearing criminal offenses.

18
closely tied minority groups who make it easier for suspects to disappear as well as
higher density areas having greater traffic congestion, leading to slower police response
times. A concern he had with this methodology is that some police activities, such as
record keeping, may be more conducive to centralization than others, such as
neighborhood patrol. He recommended studying what happens to specific service costs
individually as scale expands (Walzer, 1972).
Beaton (1974), similar to Hirsch (1959), investigated the effect population has on
per capita police expenditures. His data were from New Jersey cities, and he controlled
for rate of population change, per capita tax base, density, crime rate, per capita debt
service, per capita municipal pension costs, population employed as blue collar craftsmen
versus service occupations versus professional/managerial, age of population, and level
of commercial and industrial activity. Using a single equation least squares multiple
regression analysis, he found economies of scale for populations below 2,000 and
diseconomies for larger populations. However, Beaton stated that,
The purpose of this report is to show that the use of the model employing a single equation least squares estimation of the determinants of per capita police expenditures for intrastate systems of cities is likely to lead to incorrect results. (1974, p. 346)
If his results appear unlikely (i.e., the size for which the per capita costs of running a
municipal police department is minimized in a service area of about 2,000 population),
that is the point. Beaton (1974) was trying to demonstrate that use of a single equation
least squares estimation is inappropriate for this research question. One reason is that, in
his analysis, cities with over 2,000 population had widely disparate patterns of regression
estimates between cities growing and declining in population. Thus, his results do not

19
shed much light on the question of economies of scale in policing, but do pose questions
of the validity of the previous results using this method (Beaton, 1974).
Criticizing earlier studies for using a single output aggregate, including Walzer
(1972), Darrough and Heineke (1979) estimated a multiple output function, calculating
the average and marginal costs of solving burglary, larceny, robbery, auto theft, and
crimes against the person, the marginal rates of transformation between these outputs,
and determined an estimate of economies of scale based on how these various police
activities affect total cost. They used a translog cost function model7 with a sample of
approximately 30 cities nationwide. Their results suggested that scale economies vary
widely over the sample cities, which ranged in population from around one third of a
million to just over one million, with decreasing, then constant, then increasing returns to
scale with increasing output. This suggests that larger cities (of around 1 million
population) have economies of scale in the provision of police services (Darrough &
Heineke, 1979). The conclusions drawn from their findings, however, are questionable
since the smallest city in their dataset – Birmingham, AL – had a population of 300,000,
therefore excluding the possibility of finding economies of scale being maximized at a
smaller city size.
Using data from Florida police departments, Gyimah-Brempong (1987) based his
methodology on Darrough and Heineke's (1979), using a translog cost function.
However, he defined slightly different measures of police performance: five of the
outputs are based on the seven FBI index crimes with all personal crimes consolidated
into one output, property crimes into four outputs, and the remaining output used
7Darrough and Heineke's (1979) reason for employing a translog function was “due primarily to the fact that most past studies of law enforcement agency production technology have adopted linear logarithmic functions which are special cases of the translog function” (p. 182).

20
population as a proxy to represent all other police activities unrelated to arrest. Gyimah-
Brempong (1987) found that economies of scale were maximized in cities with
populations between 25,000 and 50,000.
Finney (1997) analyzed Los Angeles County, which is characterized by a
relatively large degree of intergovernmental integration, where over 45% of jurisdictions
are provided police services by other governments. Finney used a single product translog
cost function, modeling police departments as maximizing output (which Finney defined
as the inverse of the crime rate and arrests) subject to cost constraints. Results indicated
that the average cost of producing more of these outputs grows at an increasingly faster
rate. Whereas the average per capita expenditure for the 14 police departments in the
sample was $177.36, Finney (1997) estimated that consolidating them into one
department (with their arrest output remaining the same) would result in a per capita cost
of $472.78.
Drake and Simper (2002) determined that there are significant scale effects in
policing among departments in England and Wales. They used a multiple output translog
cost function with the output being defined in terms of clearance rates for each police
force, traffic offenses that resulted in prosecutions, warnings or fines, and total
breathalyzer tests administered (the issue of drunk driving being an increasing priority for
the English and Welsh police). Drake and Simper (2002) acknowledged that, though less
than half of what police do in the community can be modeled based on quantifiable data,
they can still estimate a production function. They argued that since the probability of
arrest is linked to number of arrests (and convictions), clearance rate should serve as a
good proxy for crime prevention and repression activities. They found that the largest

21
police forces (with over 4,500 employees) displayed significant diseconomies of scale,
while those departments with under 3,000 employees had economies of scale (Drake &
Simper, 2002).8
Southwick (2005) examined cities in New York (excluding New York City) that
choose to provide police services on their own (i.e., did not contract out). Unique to
Southwick's study is a measure of market power, wherein he tried to determine whether
market power affects costs. While firms in the private sector with sufficient market power
will tend to have higher prices, municipal police do not charge prices and do not try to
maximize profits. Rather, the effect of greater market power is likely to be realized in the
form of slacking, or reduced effort towards efficiency (Wyckoff, 1990). Also
differentiating Southwick's study is that he took the number of police personnel, both
sworn and non-sworn, into account. This was to test the question of whether mergers of
police service areas lead to cost savings due to elimination of duplicate positions
(Southwick, 2005).
Southwick (2005) used a two stage least squares simultaneous equations model of
production and demand functions. The production function models the production of
safety (in terms of absence of crime), while the demand function models demand for
policing services. Southwick's (2005) sample included 150 communities in New York
state who provide their own policing services. His data are from the years 1995 through
2000. Each observation in his dataset (n = 669) describes a city during a particular year,
i.e. one city can serve as six observations in the dataset. His findings indicate that, at
8Having under 3,000 employees includes a very wide range of police department sizes and gives little guidance as to what the optimum-sized police department is, especially in the American context. According to the most recent Census of State and Local Law Enforcement Agencies, 49% of American police agencies employed fewer than 10 full-time officers (Reaves, 2011).

22
population levels below 22,350, both crime rates and police per population are higher
than they could be at a larger community size and therefore could benefit from mergers
with nearby communities. The same applies to populations above 36,000, implying that
they may realize efficiency gains by separating into smaller communities. Southwick also
found a positive relationship between market power and crime, as well as between market
power and size of police department. Southwick concluded that, if the goal is to save
money, police mergers should not take place if the resulting police organization would be
protecting a population greater than 50,000. If the goal is to minimize crime, the resulting
community subsequent to a police merger should not be much larger than 35,000
(Southwick, 2005). Southwick (2005) also concluded that the cost savings from mergers
due to eliminated redundant job positions are outweighed by the greater costs of
management. Lithopoulos (2015) suggested that a reason why this may be the case is that
the ratio of officers assigned to patrol decreases as agency size increases.
As mentioned in the introduction, and as is evident from this review of the
literature, research on scale economies in policing has neglected considering police
departments in low population, low density states. This is somewhat ironic, considering
the fact that the majority of American police departments are small, with almost half
employing ten or fewer full-time officers (Reaves, 2011). It is precisely these types of
cities for which research on scale economies in policing is most relevant, as police
departments of major cities are the least likely to have their departments replaced by
outside contractors based on economies of scale justifications. Furthermore, their lower
population levels (and the consequently fewer opportunities available to attract incoming
residents) mean that these cities face comparatively greater competition and must

23
maintain efficiency in their services in order to retain residents. High tax burdens can
create a vicious cycle in which the taxes contribute to some residents choosing to
emigrate, leaving the remaining residents to shoulder a proportionally greater burden,
which, along with deteriorating city services, may cause even further emigration. Among
Idaho cities that have their own municipal police department, the average population they
serve is 16,753, whereas the average population of the counties in which those cities are
located is 64,582 (U.S. Census Bureau, 2015). This means that, even if diseconomies of
scale occur at a relatively small population, as long as that figure is significantly larger
than 16,325, some Idaho municipalities may benefit from contracting out their services to
their county sheriffs. Therefore, this research is important for those cities that wish to
provide quality services in an efficient manner.

24
CHAPTER THREE: METHODOLOGY
In order to further explore the question of economies of scale in policing, this
study proposes to test a sample of municipal policing agencies in less populated, rural
areas. The bulk of the literature suggests that the optimally-sized police department, in
terms of minimizing per capita cost, serves a population between 20,000 and 50,000
citizens. The present study replicates the method used by Southwick (2005),9 whose
methodology is described above.
Sample and Sampling Design
The dataset for the current study consists of all cities in Idaho that produce
policing services on their own, i.e., do not contract their services from the county sheriff,
and had the pertinent data available (n = 57).10 The unit of analysis is cities – there are
five observations (one observation per year for 2010-2014) for each city in the dataset,
resulting in 285 total observations.11
Model
This method uses the following simultaneous equation model, where the police's
production of safety, or production function, (based on crime rate), is modeled as
9That is, with one exception: race. Whereas one of Southwick's (2005) variables – percentage of population that is non-white – is used as a proxy to represent likelihood of criminal victimization, such a proxy is not likely to be very helpful in a relatively racially homogeneous state such as Idaho. Therefore, this variable is replaced with an index of socioeconomic status (SES) based on poverty rates. Criminal victimization is correlated with SES (Shaw & McKay, 1942; Chilton, 1964; Bursik & Webb, 1982; Bunch, Clay-Warner, & Lei, 2015); therefore, SES is an appropriate substitute. 10Some cities in the dataset either did not provide their report crimes to the FBI in certain years or did not have budget data available upon request.
11 The actual number of observations for particular estimations will be fewer than the total because some of the observations have incomplete data for certain variables.

25
Crime = f(police, density, socioeconomic status, population, HH)
where HH is the Herfindahl-Hirschman Index of market power (defined in more detail
below). The demand for police services, or demand function, is defined as
Police = f(crime, assets, unit cost, population, HH)
where unit cost is the wage rate of police personnel (both sworn and non-sworn) and
assets are assessed (taxable) property values. Crime is defined by the FBI's Index Crimes:
murder, rape, robbery, aggravated assault, burglary, larceny, and motor vehicle theft.12
Since the total number of incidences for these various crimes varies widely, an averaging
method is used to better estimate the above equations. The averaging method employed
operates as follows: the average number of incidences of each crime across all
municipalities in the study will be calculated for each year. Each city’s percentage of that
average will be used as a measure of that type of crime for that city. This will be
calculated for each type of crime in each city. Then, the average of each city's
percentages of each type of crime will be calculated to create a single measure for the
relative crime level in that city. This is to make each type of crime equal in terms of its
relative effect on the overall average, so that a more serious but rarer crime, such as
murder, has a greater effect on a city's average than a robbery.
Data Sources and Variables
The equations will be estimated based on data for the five year period of 2010-
2014. The National Incident Based Reporting System (NIBRS) provides the data on
crime rates. Number of police employees is from Crime in Idaho (Idaho State Police,
12 Although the limitations of using crime rates to evaluate police performance was noted in the previous chapter, they are used here to remain a faithful replication of Southwick (2005), who states, “There are traffic control objectives and service objectives as well, but the focus here will be on crime as the leading measure of success or failure by the police” (p. 462).
26
2011, 2012, 2013, 2014, 2015). The data regarding police expenditures was collected
through public records requests to individual cities. The data for variables regarding
population, density, socioeconomic status are from the 2010 U.S. Census. Data from the
Idaho Tax Commission is used for the assets variable.
The dependent variables are levels of crime and police population. The
independent variables tested for their effect on levels of crime are population density,
socioeconomic status, population, and police market power. The independent variables
tested for their effect on levels of police are crime, wage rate for police personnel (both
sworn and unsworn), total property value per population, population, and police market
power.
Thus, the equations to be estimated are
C = a0 + a1D + a2SES + a3P + a4POP + a5/POP + a6HH
and
P = b0 + b1C + b2W + b3A + b4POP + b5/POP + b6HH
where the variables are defined as
a) C4 or C7 = crime = a community's average percentage of the average
number of crimes for all communities for that year. Computed respectively for
violent crimes and for all seven index crimes.
b) P = POLPOP = police = number of police divided by the city's population
in thousands.
c) D = DENSITY = city's population in thousands per square mile.
d) SES = Socioeconomic status, based on the poverty rate of each
community

27
e) W = WPOL = wage rate = total real (inflation adjusted) expenditures for
police personnel, divided by the number of police.
f) A = ASSETS = real (inflation adjusted) full property value divided by the
population in thousands.
g) POP = population = total population protected by the particular police
department.
h) 1/POP = POP1 = inverse of population, added to make the equation
quadratic (the equation is made quadratic to estimate optimal size).
i) HH = Herfindahl-Hirschman Index = the market share of a police
department is calculated by dividing the city population protected by a police
department by the total population in the county and squaring this figure. This is
done for all the cities with municipal police departments in a particular county, as
well as for the county sheriff. These figures are then added together to estimate
the market power city police departments have in each county.
Table 1. Variables
Variable Source Reported As Level of Analysis
Level of Measurement
Variable Type
C4/C7 NIBRS Rate City Ratio Independent & Dependent
POLPOP Crime in Idaho
Rate City Ratio Independent & Dependent
DENSITY 2010 U.S. Census
Rate City Ratio Independent
SES 2010 U.S. Census
Rate City Ratio Independent
28
WPOL Public Records Requests
Rate City Ratio Independent
ASSETS Idaho Tax Commission
Rate City Ratio Independent
POP 2010 U.S. Census
Raw Number
City Ratio Independent
HH 2010 U.S. Census/ Crime In Idaho
Raw Number
County Interval Independent
Internal and External Validity
The internal validity of a research design is concerned with questions of how
confident we can be regarding the causal effect the independent variables have upon the
dependent variable (Crano, Brewer, & Lac, 2014). There are issues with the causality
implicitly theorized by the production function since variation in crime rates over time
has a wide range of theoretical causes, from immigration (Bell, Fasani, & Machin, 2013)
to the demographic changes resulting from court decisions regarding abortion (Levitt &
Dubner, 2006), that are not accounted for in the model. It is possible that outside
variables other than changes in the numbers of police, population, population density,
poverty rates, or police department market power affect crime rates. Similar
considerations apply to the demand for police services equation. Another issue is the
implicit assumption that police departments do not differ in terms of their culture and
service orientation, or that these differences are irrelevant in terms of their ability to

29
prevent crime. Given the assumption that a police department's market power can affect
its performance, one would expect that its policing strategies would as well.
The external validity of this Southwick’s (2005) methodology is actually the
question at hand in this study. The source of Southwick’s (2005) dataset is New York, a
state that is far more populous and dense than Idaho. Although Southwick’s (2005)
results suggest that the optimal size of a population protected by a city police department
in terms of lowest cost is between 25,000 and 50,000, and between 17,500 and 22,000 for
lowest levels of crime, it is unclear whether these population sizes are optimal for
policing in Idaho. The simultaneous equations model fails to explain much of the
variance in crime and numbers of police in Idaho cities, and thus is of doubtful use in
estimating optimal population sizes a sparsely populated state. The purpose of this study
is to test the applicability of Southwick’s (2005) model in a state that is much different
than New York.
Explication of Two Stage Least Squares Model
Two stage least squares (2SLS) regression is used in this model because of the
assumed bidirectional relationship between crime (C4 and C7) and number of police per
population (POLPOP) [Southwick, 2005]. 2SLS uses instrumental variables that are
uncorrelated with the error term in order to compute estimates for endogenous predictor
variables and requires at least as many instrumental variables as there are predictor
variables (Wooldridge, 2015). For each regression, the following were used as
instrumental variables: population (POP), socioeconomic status (SES), density (D), assets
(A), police wage rate (WPOL), and Herfindahl-Hirschman Index rating (HH).
30
The raw data presented a number of issues for running the regressions. One of
them was the outlier of the city of Boise, which in 2014 had a population of 216,282
whereas the median population in the dataset is 3,979 citizens. To see how this biased the
model, the regression was run both with and without Boise in the data set. Even without
Boise, a histogram of the data showed that population in Idaho is severely skewed to a
few outlier cities. Since linear regression assumes that the data being tested is normally
distributed (Blalock, 1979; Berry & Feldmen, 1985), the natural log of the population
variable was used in the regression. Similarly, there were concerns about skewness for
the measures of crime. Because of Southwick's (2005) averaging method for calculating
an index of crime, greater variability in crime figures between cities was created than
would exist using standard crime rates. To correct for this, the natural log of C4 and C7
were calculated and used in the regression analysis.

31
CHAPTER FOUR: RESULTS
This section includes tables of the descriptive statistics of the dataset, correlations
between the variables, and the results of the two stage least squares regressions. The
value ranges for the variables are provided in Tables 2 (with Boise) and 3 (without
Boise). The highest crime community, Boise, has a crime rating 13,999 times the lowest,
using the seven index crimes. Eleven communities in the dataset experienced years where
no index violent crimes were reported. The population ranges from a low of 895 in
Cascade to a high of 216,282 in Boise, with Nampa being the second largest city in the
dataset at 88,211 citizens. Taxable property values divided by the population ranged from
$11,708.80 in Wilder to $1,825,347.51 in Sun Valley.
The average HH value is 4769 (4784 without Boise), whereas in Southwick's
(2005) New York dataset, the average was 2786.13 This much higher number is likely due
to just how relatively sparsely populated Idaho is. Due to the fact that a police
department's 'market share' is calculated based on the ratio of population they serve
relative to the county's total population and that most of the counties in the dataset have
only two or three police agencies in the entire county, their HH value is quite high. The
way HH is calculated, a county with one municipal police department and a county
sheriff would be considered a duopoly. This is the modal type of county in the dataset.
13According to the U.S. Department of Justice (2015), markets with an HH index rating greater than 2,500 are considered highly concentrated.

32
Table 2. Variable Descriptions (with Boise)
Variable Mean Std. Dev. Minimum Maximum Cases
C4 1.00002 2.3 0.000 16.36 270
C7 1.00004 2.15 0.001 13.99 270
POLPOP 2.41 1.24 0.618 7.9 283
SES 0.038 0.01 0.016 0.0853 285
DENSITY 1805.29 795.44 140.6 3615.62 285
ASSETS 86756.48 200515.84 11708.18 1825347.51 285
WPOL 65004.80 17094.89 26828.5 106781.05 276
HH 4769 1021 3165 7458 285
POP 16325.13 32664.94 895 216282 285
Table 3. Variable Descriptions (without Boise)
Variable Mean Std. Dev. Minimum Maximum Cases
C4 1.00002 1.89 0.000 10.44 265 C7 0.99998 1.79 0.002 9.53 265 POLPOP 2.42 1.24 0.618 7.9 278 SES 0.038205 0.01 0.016 0.09 280 DENSITY 1790.26 794.43 140.61 3615.62 280 ASSETS 86740.78 202303.02 11708.18 1825347.51 280 WPOL 64299.77 16432.5 26828.5 106672.07 271 HH 4784 1023 3165 7458 280 POP 12836.74 19743.04 895 88211 280
Table 4 provides the correlation across the variables for the whole dataset (Table
5 for the dataset without Boise). The two measures of crime, C4 and C7, are highly

33
correlated at 0.99, which is to be expected. Crime is highly correlated with population at
0.95 and 0.96 for C4 and C7, respectively, with Boise. Even without Boise, however, the
correlation remains high at 0.88 and 0.91. Berry and Feldman (1985) state that
multicollinearity can be considered minor until it reaches 0.8. But, if the purpose of the
model is prediction, rather than explanation, multicollinearity is not problematic for the
model as a whole, but only for individual variables. Regardless, the relationship between
crime and population is addressed through the two stage least squares process. As well,
the collinearity between C4 and C7 poses no problem because they are always used in
separate regressions.
The next highest correlation is between assets and number of police per
population at 0.66. Police protection appears to be a normal good.14 There is also a
relatively high negative correlation between density and number of police (-0.60).
Apparently, populations living in greater densities require (or are perceived to require)
fewer police officers per person to maintain public safety. When communities are more
densely populated, police have to cover less ground to respond to calls. Other than
population, there were no further collinearity concerns.
14 In economics, a 'normal good' is defined as a good for which the quantity demanded increases as one's income increases (Cowen & Tabarrok, 2015).

34
Table 4. Correlation Matrix (with Boise)
C4 C7 P SES D A W HH POP
C4 1.00 0.99* (.000)
-0.15* (.014)
-0.14* (.025)
0.33* (.000)
-0.04 (.554)
0.49* (.000)
0.30* (.000)
0.95* (.000)
C7 0.99* (.000)
1.00 -0.16* (.010)
-0.14* (.018)
0.35* (.000)
-0.04 (.510)
0.50* (.000)
0.33* (.000)
0.96* (.000)
P -0.15* (.014)
-0.16* (.010)
1.00 -0.19* (.002)
-0.60* (.000)
0.66* (.000)
-0.05 (.384)
-0.20* (.001)
-0.19* (.001)
SES -0.14* (.025)
-0.14* (.018)
-0.19* (.002)
1.00 0.12 (.050)
-0.26* (.000)
-0.39* (.000)
-0.45* (.012)
-0.19* (.002)
D 0.33* (.000)
0.35* (.000)
-0.60* (.000)
0.12 (.050)
1.00 -0.34* (.000)
0.11 (.071)
0.48* (.000)
0.39* (.000)
A -0.04 (.554)
-0.04 (.510)
0.66* (.000)
-0.26* (.000)
-0.34* (.000)
1.00 0.23* (.000)
-0.06 (.281)
-0.04 (.481)
W 0.49* (.000)
0.50* (.000)
-0.05 (.384)
-0.39* (.000)
0.11 (.071)
0.23* (.000)
1.00 0.24* (.000)
0.49* (.000)
HH 0.30* (.000)
0.33* (.000)
-0.20* (.001)
-0.15* (.012)
0.48* (.000)
-0.06 (.281)
0.24* (.000)
1.00 0.38* (.000)
POP 0.95* (.000)
0.96* (.000)
-0.19* (.001)
-0.19* (.002)
0.39* (.000)
-0.04 (.481)
0.49* (.000)
0.38* (.000)
1.00
*Correlation is significant at the 0.05 level (2-tailed)

35
Table 5. Correlation Matrix (without Boise)
C4 C7 P SES D A W HH POP
C4 1.00 .99* (.000)
-0.15* (.017)
-0.01 (.901)
0.37* (.000)
-0.06 (.335)
0.41* (.000)
0.33* (.000)
0.88* (.000)
C7 0.99* (.000)
1.00 -0.15* (.013)
-0.02 (.705)
0.39* (.000)
-0.06 (.307)
*0.43 (.000)
0.37* (.000)
0.91* (.000)
P -0.15* (.017)
-0.15* (.013)
1.00 -0.20* (.001)
-0.60* (.000)
0.66* (.000)
-0.03 (.618)
-0.19* (.001)
-0.22* (.000)
SES -0.01 (.901)
-0.02 (.705)
-0.20* (.001)
1.00 0.14* (.017)
-0.26* (.000)
-0.37* (.000)
-0.13* (.028)
-0.09 (.122)
D 0.37* (.000)
0.39* (.000)
-0.60* (.000)
0.14* (.017)
1.00 -0.35* (.000)
0.07 (.258)
0.47* (.000)
0.47* (.000)
A -0.06 (.335)
-0.06 (.307)
0.66* (.000)
-0.26* (.000)
-0.35* (.000)
1.00 0.24* (.000)
-0.07 (.281)
-0.07 (.238)
W 0.41* (.000)
0.43* (.000)
-0.03 (.618)
-0.37* (.000)
0.07 (.258)
0.24* (.000)
1.00 0.21* (.000)
0.43* (.000)
HH 0.31* (.000)
0.37* (.000)
-0.19* (.001)
-0.13* (.028)
0.47* (.000)
-0.07 (.281)
0.21* (.000)
1.00 0.48* (.000)
POP 0.88* (.000)
0.91* (.000)
-.215* (.000)
-0.09 (.122)
0.47* (.000)
-0.07 (.238)
0.43* (.000)
0.48* (.000)
1
*Correlation is significant at the 0.05 level (2-tailed).
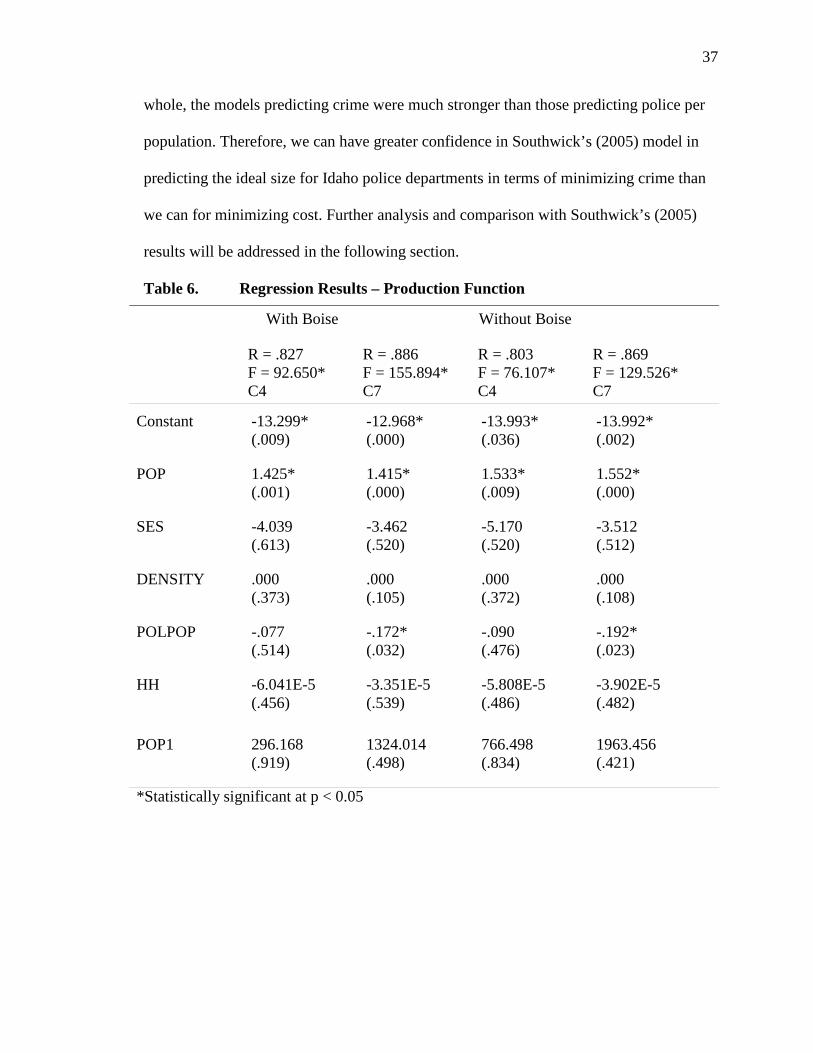
Tables 6 and 7 list the regression results, with the production function (crime)
being provided in Table 6, demand function (police per population) shown in Table 7,
results with Boise displayed on the left, and results without Boise listed on the right. Each
column represents one of the systems of equations, with the production function on the
upper half and the corresponding demand function on the bottom half. The only
statistically significant predictor variable for crime across all regressions was population,
indicating that in Idaho, as population grows, so does crime. In the model with Boise, the
36
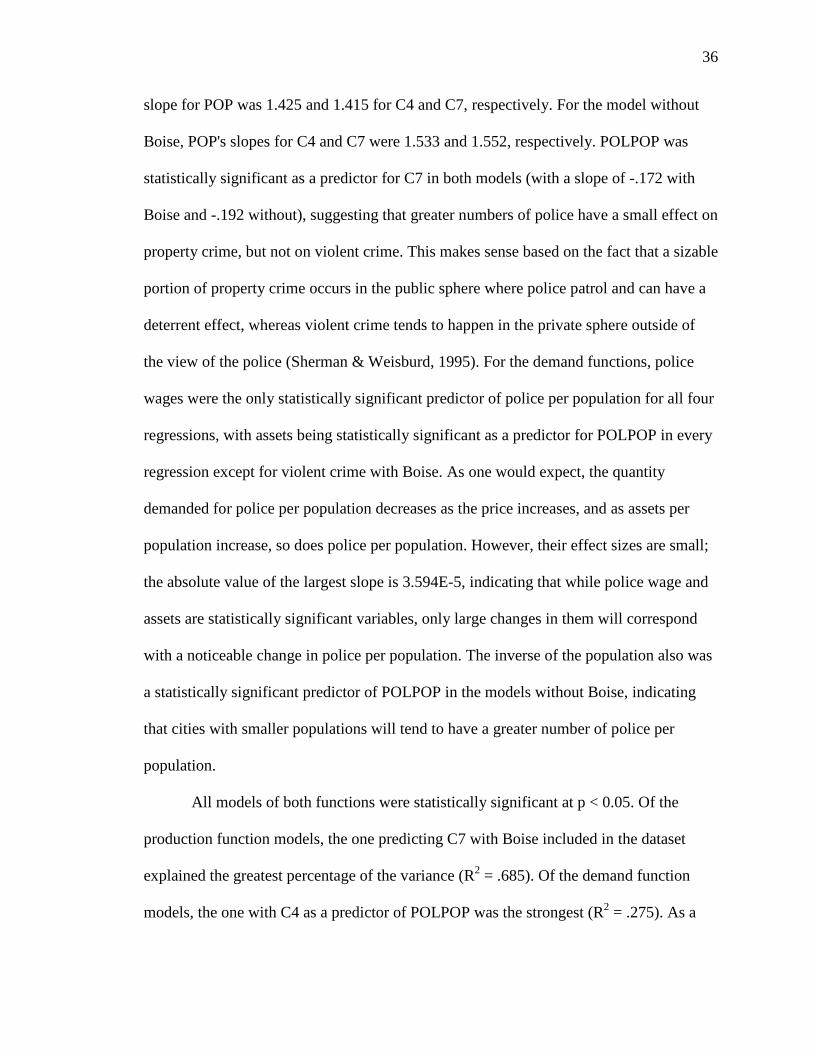
slope for POP was 1.425 and 1.415 for C4 and C7, respectively. For the model without
Boise, POP's slopes for C4 and C7 were 1.533 and 1.552, respectively. POLPOP was
statistically significant as a predictor for C7 in both models (with a slope of -.172 with
Boise and -.192 without), suggesting that greater numbers of police have a small effect on
property crime, but not on violent crime. This makes sense based on the fact that a sizable
portion of property crime occurs in the public sphere where police patrol and can have a
deterrent effect, whereas violent crime tends to happen in the private sphere outside of
the view of the police (Sherman & Weisburd, 1995). For the demand functions, police
wages were the only statistically significant predictor of police per population for all four
regressions, with assets being statistically significant as a predictor for POLPOP in every
regression except for violent crime with Boise. As one would expect, the quantity
demanded for police per population decreases as the price increases, and as assets per
population increase, so does police per population. However, their effect sizes are small;
the absolute value of the largest slope is 3.594E-5, indicating that while police wage and
assets are statistically significant variables, only large changes in them will correspond
with a noticeable change in police per population. The inverse of the population also was
a statistically significant predictor of POLPOP in the models without Boise, indicating
that cities with smaller populations will tend to have a greater number of police per
population.
All models of both functions were statistically significant at p < 0.05. Of the
production function models, the one predicting C7 with Boise included in the dataset
explained the greatest percentage of the variance (R2 = .685). Of the demand function
models, the one with C4 as a predictor of POLPOP was the strongest (R2 = .275). As a
37
whole, the models predicting crime were much stronger than those predicting police per
population. Therefore, we can have greater confidence in Southwick’s (2005) model in
predicting the ideal size for Idaho police departments in terms of minimizing crime than
we can for minimizing cost. Further analysis and comparison with Southwick’s (2005)
results will be addressed in the following section.
Table 6. Regression Results – Production Function
With Boise Without Boise
R = .827 F = 92.650* C4
R = .886 F = 155.894* C7
R = .803 F = 76.107* C4
R = .869 F = 129.526* C7
Constant -13.299* (.009)
-12.968* (.000)
-13.993* (.036)
-13.992* (.002)
POP 1.425* (.001)
1.415* (.000)
1.533* (.009)
1.552* (.000)
SES -4.039 (.613)
-3.462 (.520)
-5.170 (.520)
-3.512 (.512)
DENSITY .000 (.373)
.000 (.105)
.000 (.372)
.000 (.108)
POLPOP -.077 (.514)
-.172* (.032)
-.090 (.476)
-.192* (.023)
HH -6.041E-5 (.456)
-3.351E-5 (.539)
-5.808E-5 (.486)
-3.902E-5 (.482)
POP1 296.168 (.919)
1324.014 (.498)
766.498 (.834)
1963.456 (.421)
*Statistically significant at p < 0.05

38
Table 7. Regression Results – Demand Function
With Boise Without Boise
R = .525 F = 16.223* POLPOP
R = .492 F = 16.456* POLPOP
R = .447 F = 10.433* POLPOP
R = .446 F = 10.380* POLPOP
Constant -12.000 (.871)
-4.805 (-.083)
-24.994 (.086)
-25.268 (.105)
POP 1.500 (.839)
0.809 (.139)
2.833 (.073)
2.861 (.090)
C4 .296 (.939)
-.112 (.815)
C7 0.717 (0.219)
-.124 (.815)
ASSETS 3.043E-6 (.050)
3.321E-6* (.000)
2.686E-6* (.001)
2.681E-6* (.002)
WPOL -3.467E-5* (.034)
-3.594E-5* (.001)
-3.278E-5* (.004)
-3.268E-5* (.004)
HH 9.154E-5 (.576)
8.561E-5 (.238)
5.404E-5 (.737)
5.762E-5 (.705)
POP1 11736.641 (.389)
10543.905 (.919)
15652.617* (.014)
15730.252* (.017)
*Statistically significant at p < 0.05
39
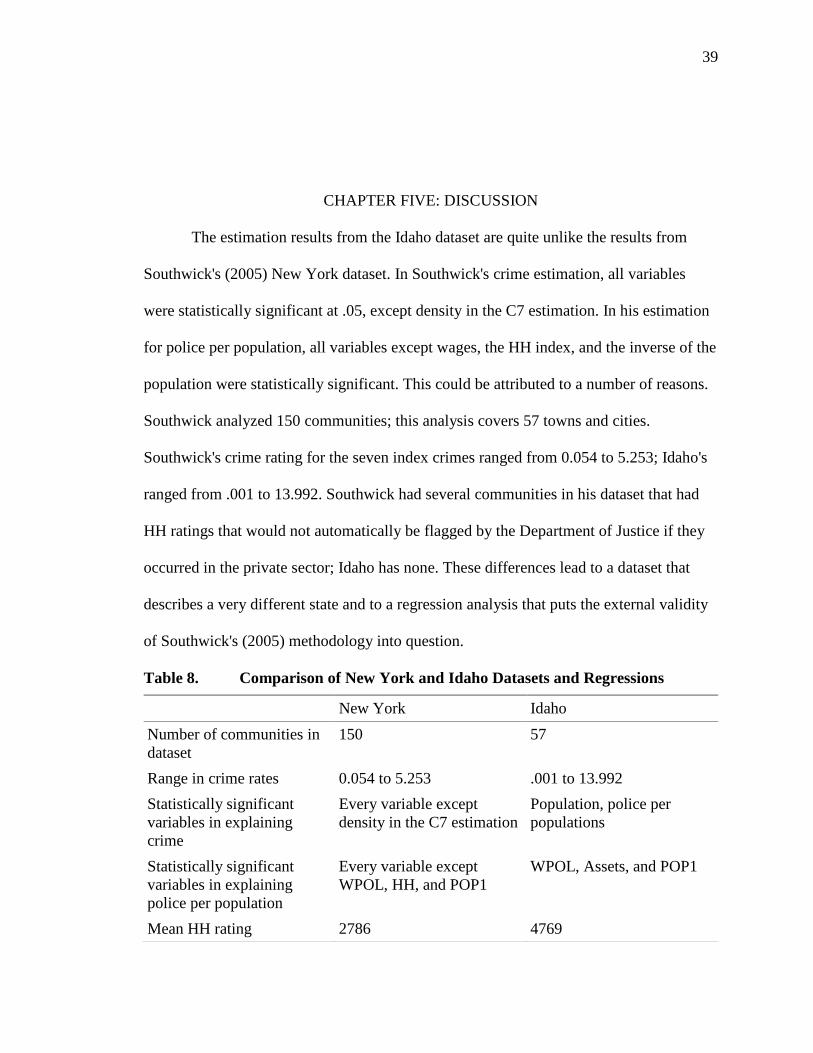
CHAPTER FIVE: DISCUSSION
The estimation results from the Idaho dataset are quite unlike the results from
Southwick's (2005) New York dataset. In Southwick's crime estimation, all variables
were statistically significant at .05, except density in the C7 estimation. In his estimation
for police per population, all variables except wages, the HH index, and the inverse of the
population were statistically significant. This could be attributed to a number of reasons.
Southwick analyzed 150 communities; this analysis covers 57 towns and cities.
Southwick's crime rating for the seven index crimes ranged from 0.054 to 5.253; Idaho's
ranged from .001 to 13.992. Southwick had several communities in his dataset that had
HH ratings that would not automatically be flagged by the Department of Justice if they
occurred in the private sector; Idaho has none. These differences lead to a dataset that
describes a very different state and to a regression analysis that puts the external validity
of Southwick's (2005) methodology into question.
Table 8. Comparison of New York and Idaho Datasets and Regressions
New York Idaho Number of communities in dataset
150 57
Range in crime rates 0.054 to 5.253 .001 to 13.992 Statistically significant variables in explaining crime
Every variable except density in the C7 estimation
Population, police per populations
Statistically significant variables in explaining police per population
Every variable except WPOL, HH, and POP1
WPOL, Assets, and POP1
Mean HH rating 2786 4769
40
In Idaho, levels of crime largely appear to be a function of population as
evidenced by it being the only statistically significant predictor of crime rates in all
regressions. Smaller communities tend to be more ethnically and culturally homogeneous
and less transitory and therefore have lower levels of crime regardless of the efficiency of
the local police force (Rapoport, 1982; Unger & Wandersman, 1985; Bursik, 1999).
Idaho is mostly a collection of small, relatively homogeneous communities; it is likely
that these characteristics outweigh any effects police per population, density, or
socioeconomic status may have on serious crime.
The utility of the Herfindahl-Hirschman Index in this context is also questionable,
both at the theoretical level and in Idaho's case specifically. That is, what competition can
exist between public police agencies that are funded by taxation rather than through
voluntary purchases in a market setting? This author can conceive of only two possible
sources of competition for a police agency and both are remote and comparatively weak
when compared with competition in a market setting.
The first is the threat of losing revenue from citizens who choose to leave a
community and settle elsewhere. Some may choose to do this because they find the
neighborhood in which they live unsafe; however, the amenities offered by residing in a
community are a package-deal and level of safety is just one consideration among
several. As well, it is unlikely that one will be able to pay incrementally to reach the
optimal level of policing according to their budget constraint. By moving to a community
with a higher level of safety, one will likely have to pay for the entire package of public
services that come with the new community (e.g., public schools, infrastructure) rather

41
than just policing itself. Thus, this package-deal is part of an institutional framework that
further protects public police agencies from competition.
The second source of potential competition is the threat of having one's municipal
police department shut down and replaced by a contract with the county sheriff. This
threat is particularly relevant to the present study due to the implications economies of
scale may have for small municipal police departments. At the same time, cities with a
population that would be considered relatively large in Idaho do contract out their
policing services. The largest city in Idaho that contracts its policing services is Eagle
(Ada County Sheriff, 2016), which is home to 19,908 people (U.S. Census, 2015). By
contrast, Compton, California, which previously had its own police department and now
contracts with the L.A. County Sheriff's Department (L.A. County Sheriff's Department,
2009), has a population of over 90,000 (U.S. Census Bureau, 2010), more than any city in
Idaho except Boise. This threat of competition, however, is also quite remote. The size of
most county sheriffs' offices outside of Ada and Canyon county are not much larger than
the municipal police departments with which they supposedly compete (Idaho State
Police, 2015), thereby rendering them less able to subsume the duties of city departments.
The method by which Southwick (2005) operationalizes market power implies
that counties with a higher number of police departments will be more competitive than
counties with a smaller number. This may apply in terms of the first source of
competition if municipalities are close enough together such that an individual can
change police departments without having to also change jobs, but regardless of how
geographically proximate the next police jurisdiction is, addresses and the school that
children attend will have to change. Furthermore, police departments do not have data on

42
citizens leaving their jurisdiction due to dissatisfaction with police. Ultimately, it is very
unlikely that any individuals in the police department have an incentive to be efficient
due to competition.
In Idaho, the majority of counties have three or fewer police agencies. None have
more than five. Based on how the U.S. Department of Justice (2015) classifies the
intervals of the HH Index, the market power variable in Idaho operates more like a
constant: there are no police departments in Idaho that operate in any environment other
than a highly concentrated one. Therefore, Southwick's (2005) modeling of market power
may not apply in Idaho, or potentially in other sparsely populated, highly rural states.
Southwick (2005) used his model to estimate the population at which crime and
police per capita are minimized. He found that the range between which both are
minimized (but face trade-offs between one another) is 22,350 to 36,000 people. Based
on the fact that this model serves as a poor predictor of crime and police per population in
Idaho, it is inappropriate to use it to predict populations at which crime and police per
population are minimized.
Study Limitations
Perhaps the greatest weakness of this methodology is the use of crime rates as a
proxy for police performance. The majority of police time is not spent dealing with FBI
Index crimes (Marvell & Moody, 1996), only a large increase in police presence can
actually deter crime (Cameron, 1988), and the most common police strategies are not
effective in crime prevention (Bayley, 1994; Benson, Kim, & Rasmussen, 1994). As
mentioned above, reported crime rates have validity issues as measures of crime, as not
all crime is reported to the police. Until police departments collect more valid statistical

43
measures of their performance, such as those suggested by Whitaker et al. (1982), Alpert
and Moore (1993), or Davis (2012) few other options are available.
A related issue is that using crime rates as a measure of police performance
assumes that the proportion of crime reported to the police is equal across all
communities (Maltz, 1975). This may not be the case; a community whose victims
believe that calling the police is not worth the hassle will have a lower proportion of
reported crime compared to a community that has confidence in its police protection. If it
is the case that smaller communities tend to have less effective policing that leads to
fewer crimes being reported, as argued in Kelling (1999), then false diseconomies of
scale may be produced using this technique. This is unlikely, however, as Ostrom, Parks,
and Whitaker's (1978) extensive study of 1,159 police departments in the United States
and Loveday's (1990) analysis of police service amalgamations in England and Wales
both found that smaller police departments make more efficient use of their employees
and assign them in greater proportion to functions that actually reduce crime and increase
public safety. Furthermore, local community control of police is found to be more
effective in meeting the needs of citizens than large police departments under city-wide
control (Ostrom & Whitaker, 1973). Thus, it is more likely that residents of larger cities
will be less inclined to call the police due to the belief that police will be less responsive
to their needs.
Further limitations of this study include the relatively small number of
observations (n = 285) compared to Southwick (2005) [n = 669], which may bias the
results. As well, the model does not take different styles of policing into account,
implicitly assuming that the only difference between police departments in this respect is

44
their market power. Although operationalizing a measure of a department's policing style
would likely be a convoluted (and possibly unfruitful) task in trying to control for this
factor, this limitation should be acknowledged.
Policy Implications
On their face, the results of this study provide no evidence that larger police
departments display greater efficiency than smaller departments, and thus do not lend
support to the justification of department consolidation on such grounds. However, due to
the limitations of the dependent variable of crime rates, the implications of the results
should be taken with a grain of salt. While this study and most of the studies cited in the
literature review rely upon crime rates, arrests, citations, expenditures, or inputs (such as
miles traveled) as measures of police output, Ostrom et al. (1973) consider such measures
to be fundamentally flawed. Rather, Ostrom et al. (1973, p. 424) argue that “the
measurement of output of services received by and evaluated by citizens provides the
appropriate means for assessing the quality of a public service.” What is left out of most
measures of output is the perception of the recipient of police services.
As noted previously, the majority of police departments make little or no effort to
obtain feedback from citizens about their opinions and evaluations of the services they
receive from the police (Davis et al., 2015). While such a disregard for consumer
preferences may be the norm for police organizations, who do not depend on voluntary
financial contributions to remain in operation, it is hard to imagine the same behavior
lasting long within organizations that do depend on voluntary exchange. A police
department that evaluates its performance solely using crime rates and arrests is akin to
an auto manufacturer evaluating its cars purely based on their horsepower and fuel
45
efficiency. In the latter case, consumers desire more from their cars than simply power
and high gas mileage and are willing to make trade-offs for other attributes, such as
comfort, reliability, price, and storage capacity. In the same way, citizens desire more
from their police, including more open communication (Grinc, 1994) and serious
consideration of citizen input (Lyons, 2002).
Furthermore, American police departments are currently facing a 'crisis' of
legitimacy (Cook, 2015) due to highly publicized incidences of the use of lethal force
against minorities.15 This is particularly true in minority neighborhoods in which police
are seen as an occupying force and treated with suspicion (Peck, 2015). By not
considering citizen perceptions of the police as part of their performance, the police are
communicating to these neighborhoods that their opinions do not matter. In addition,
police are undermining their effectiveness in their traditional goals of law enforcement
and order maintenance since community support and cooperation is crucial for their
mission (Glensor et al., 1999) Without citizen feedback, police departments lack an
essential component of evaluating their performance and studies of their efficiency will
be marred by the methodological issues of the data that they do collect. Therefore, the
strongest policy implication of this study is for police to obtain more valid measures of
their performance, especially from those receiving their services.
Recommendations for Further Research
Despite the lack of alternative measures of police output, there are still methods
with the potential to answer questions about the relationship between police organization
15 Although the percentage of people reporting that they have 'quite a lot' or 'a great deal' of confidence in the police has dropped five percentage points since 2013 (Cook, 2015), police remain one of the most supported of public institutions. So while the 'crisis' may be exaggerated, especially regarding the so-called 'war on cops' and the frequency at which violent officer deaths occur (Officer Down Memorial Page, 2016), police legitimacy is becoming more questionable.

46
size and efficiency. Serving as a good example is Ostrom et al.'s (1973) study of police
performance within an urban area where police services had been consolidated in some
neighborhoods and not in others. Their measurement of police output involved surveying
citizens about both their direct interactions with police and their evaluation of services
provided to their neighborhood. Among other observations of the general tendency for
citizens in those neighborhoods with independent police forces to be more satisfied with
their police, a higher proportion of that group rated police-citizen relations as good, the
job being done by police in their neighborhood as good or outstanding, and the police
response as being very rapid (Ostrom et al., 1973). Although surveys of citizens about
their perceptions of police are not methodologically flawless, they appear, in comparison
to crime rates, to be a more valid measure of police performance. And, although Ostrom
et al.'s (1973) study was of only six neighborhoods and therefore speculative in terms of
its wider applicability, its utility should not be discounted.
While case studies and field studies are often seen as methodologically inferior to
using aggregated data and sophisticated statistical and econometric models, Elinor
Ostrom's theoretical contributions to policing were only possible through the former
methods (Boettke et al., 2013). Commenting on Ostrom's penchant for using multiple
methods, including case studies and fieldwork, Boettke et al. (2013) note,
In complex social environments, the so-called qualitative methods can often illuminate consequences and motivations that are disguised by more aggregative methods. The most obvious way in which this is true is that in-depth fieldwork or case study may reveal a factor to be at play that the researchers would never have considered if they were less familiar with their subject. (p. 411)
A suggestion for further research, therefore, is to use multiple methods, including field
research and case studies, for evaluating the efficiency of police departments and other
47
organizations whose output is not easily captured in single quantifiable outputs.
Questions that should be answered include: What do citizens want from the police? Is
there a correlation between citizen satisfaction with police and crime rates? Are citizens
more satisfied with the police after contracting with the county sheriff? These are
important questions for research of police organization efficiency.
Additionally, a worthy question for further research is why small communities
choose to have their own municipal police departments, especially given the widespread
perception that police officers in larger police departments are better trained (Sandy &
Devine, 1978; Oliver & Meier, 2004) and more efficient (Finney, 1997). King (2014), in
a study of Ohio police departments that disbanded in the 1990s, found that crime is
essentially irrelevant both in terms of being a causal factor in the reasons for disbanding
and in how rural police are evaluated by their constituents. Rather, police departments
were primarily disbanded for reasons of budgetary issues, misconduct, or rancor with
town sovereigns. In addition, small communities may choose to have their own police
departments for reasons of greater local control or pride (King, 2014), rather than for
reasons of efficiency. This suggests that, for small departments, it might be even more
crucial to take citizen perceptions into account, as their very existence may be at stake.
As well, further research on why police departments disband would be useful. To
understand police departments as organizations, they must be analyzed over their full life
course, from conception to death (King, 2009). As King (2014) notes, excluding
disbanded departments from our observations is akin to studying the effects cholesterol
has on one's health while excluding those who have died from heart disease. Assessing
the reasons for disbanding gives us knowledge of other reasons, besides efficiency, why

48
communities choose to contract their policing services and what police departments can
do to provide citizens greater satisfaction.
Further research of police departments serving smaller, rural areas is necessary in
order to have a richer understanding of the effects of size on police performance and
operation. Rural police face unique challenges in terms of stress and working conditions
(Sandy & Devine, 1978; Oliver & Meier, 2004) and 71 percent of police departments
serve populations of less than 10,000 residents (Reaves, 2015). As previously noted, the
vast majority of research of economies of scale in policing analyzes urban areas with
large police departments. Unfortunately, this research may not be applicable to most
American police departments. Furthermore, a methodology that takes the idiosyncrasies
of both rural policing and individual departments into account may be necessary. Despite
the fact that Southwick's (2005) methodology is unique in terms of including a measure
of economies of scale and in employing a simultaneous equations model, it is unlikely
that the methodologies used by the other researchers mentioned in this study would lead
to vastly different results. For the most part, they use crime and arrests as measures of
police performance and similar control variables.

49
CONCLUSION
This study investigated the question of what extent economies of scale exist
among police departments in a rural, low-density state. Previous research tended to find
either no economies of scale or diminishing returns to scale after a city reached a fairly
modest size, typically between 20,000 and 50,000 residents (Hirsch 1959; Walzer, 1972;
Gyimah-Brempong, 1987; Finney, 1997; Southwick, 2005). The results of the present
study showed that, in Idaho, crime is largely a function of population. Since the median
population among the cities in the dataset is about 4,000, it appears that crime is
minimized at a much lower population than is suggested by other studies. The present
study also showed that a higher number of police per population had a negative effect on
property crime, but not violent crime.
This study performed a replication of one of the most recent papers published in
the literature about this topic. It found that the methodology that served as a good
predictor of crime and police per capita in a relatively populous, high density state was a
poor predictor of those variables in a low population, low density state. Furthermore, it
questions the validity of some of the measures used, particularly crime rates as a measure
of police performance and the Herfindahl-Hirschman Index as a measure of market
power among police departments. Police are expected to do much more than fight crime
and the effect of their efforts on crime rates may be modest. Police are also a public
institution funded by taxation; it is not clear that they face competition that can affect
their revenues. It is recommended that both police departments and policing researchers

50
use more accurate and meaningful measures of their performance, as well as citizen
satisfaction. Suggestions for further research include studying questions regarding why
small communities choose to start and fund their own municipal police departments and
why some of them are disbanded. Finally, additional research of rural areas and
economies of scale in policing is needed to more fully answer this research question.

51
REFERENCES
Ada County Sheriff. (2016). City of Eagle Police. Retrieved February 22, 2016, from
https://adasheriff.org/About-Us/Eagle-Police
Alpert, G. P., & Moore, M. H. (1993). Measuring police performance in the new
paradigm of policing. In J. J. Dilulio, G. P. Alpert, M. H. Moore, G. F. Cole, & J.
Petersilia (Eds.) Performance Measures for the Criminal Justice System, (pp.
109–142.) Washington, DC: U.S. Department of Justice, Office of Justice
Programs, Bureau of Justice Statistics.
Baker, C. A. (1910). Population and costs in relation to city management. Journal of the
Royal Statistical Society, 73–79.
Bayley, D. H. (1979). Police function, structure, and control in Western Europe and
North America: Comparative and historical studies. Crime and Justice, 109–143.
Bayley, D. H. (1994). Policing for the future. New York, NY: Oxford University Press.
Beaton, W. P. (1974). The determinants of police protection expenditures. National Tax
Journal, 335–349.
Benson, B. L. (1998). To serve and protect: Privatization and community in criminal
justice. New York, NY: NYU Press.
Benson, B. L., Rasmussen, D. W., & Sollars, D. L. (1995). Police bureaucracies, their
incentives, and the war on drugs. Public Choice, 83(1-2), 21-45.
Bell, B., Fasani, F., & Machin, S. (2013). Crime and immigration: Evidence from large
immigrant waves. Review of Economics and Statistics, 21(3), 1278–1290.
Berry, W. D., & Feldman, S. (1985). Multiple regression in practice. New York, NY:
Sage Publications.
52
Bish, R. L. (2001). Local government amalgamations: Discredited nineteenth century
ideals alive in the twenty-first. CD Howe Institute Commentary, (150).
Bittner, E. (1979). The functions of the police in modern society. Washington, DC:
National Institute of Mental Health, Center for Studies of Crime and Delinquency.
Blalock, H. M. (1972). Social statistics (2nd Ed). New York, NY: McGraw-Hill.
Boettke, P., Palagashvili, L., & Lemke, J. (2013). Riding in cars with boys: Elinor
Ostrom’s adventures with the police. Journal of Institutional Economics, 9(04),
407–425.
Boyne, G. (1995). Population size and economies of scale in local government. Policy &
Politics, 23(3), 213–222.
Bunch, J., Clay-Warner, J., & Lei, M.-K. (2015). Demographic characteristics and
victimization risk testing the mediating effects of routine activities. Crime &
Delinquency, 61(9), 1181–1205.
Bursik Jr, R. J., & Webb, J. (1982). Community change and patterns of delinquency.
American Journal of Sociology, 24-42.
Bursik, Jr., R. J. (1999). The informal control of crime through neighborhood networks.
Sociological Focus, 32(1), 85–97.
Byrnes, J., & Dollery, B. (2002). Do economies of scale exist in Australian local
government? A review of the research evidence. Urban Policy and Research,
20(4), 391–414.
Chaiken, J. M. (1976). What’s known about deterrent effects of police activities. Santa
Monica, CA: Rand Corporation
Chilton, R. J. (1964). Continuity in delinquency area research: A comparison of studies
for Baltimore, Detroit, and Indianapolis. American Sociological Review, 71-83.
Cook, P. J. (2015). Will the current crisis in police legitimacy increase crime? Research
offers a way forward. Psychological Science in the Public Interest, 16(3), 71–74.

53
Cordner, G. W. (1978). Open and closed models of police organizations: Traditions,
dilemmas, and practical considerations. Journal of Police Science and
Administration, 6(1), 22–34.
Cordner, G. W. (2015). Community policing: Elements and effects. In R. F. Dunham &
G. P. Alpert (Eds.), Critical issues in policing: Contemporary readings (7th Ed.)
(pp. 481-511). Long Grove, IL: Waveland Press.
Cowen, T., & Tabarrok, A. (2015). Modern principles of microeconomics (4th Ed.).
London, UK: Palgrave Macmillan.
Correia, M. E. (2000). Social capital and sense of community building: Building social
cohesion. In R. W. Gelnsor, M. E. Correia, & K. J. Peak (Eds.), Policing
communities: Understanding crime and solving problems – An anthology. Los
Angeles, CA: Roxbury Publishing Company.
Crank, J., & Langworthy, R. (1996). Fragmented centralization and the organization of
the police. Policing and Society: An International Journal, 6(3), 213–229.
Crano, W. D., Brewer, M. B., & Lac, A. (2015). Principles and methods of social
research (4th ed.). London, UK: Routledge.
Darrough, M. N., & Heineke, J. (1979). Law enforcement agencies as multi-product
firms: An econometric investigation of production costs. Public Finance, 34(2).
Davis, R. C. (2012). Selected international best practices in police performance
measurement. Santa Monica, CA: Rand Corporation. Retrieved February 22,
2016, from http://www.rand.org/pubs/technical_reports/TR1153
Davis, R. C., Ortiz, C. W., Euler, S., & Kuykendall, L. (2015). Revisiting “measuring
what matters”: Developing a suite of standardized performance measures for
policing. Police Quarterly, 18(4), 469-495.
Drake, L., & Simper, R. (2002). X-efficiency and scale economies in policing: A
comparative study using the distribution free approach and DEA. Applied
Economics, 34(15), 1859–1870.

54
Derksen, W. (1988). Municipal amalgamation and the doubtful relation between size and
performance. Local Government Studies, 14(6), 31–47.
Duncan, O. D. (1956). Optimum size of cities. Demographic Analysis. New York, NY:
Free Press.
Dunham, R. G., & Alpert, G. P. (2001). Critical issues in policing: Contemporary
readings (4th Ed.). Long Grove, IL: Waveland Press.
Dunham, R. G., & Alpert, G. P. (2015). Critical issues in policing: Contemporary
readings (7th Ed.). Long Grove, IL: Waveland Press.
Eck, J. E., & Rosenbaum, D. (1994). The new police order: Effectiveness, equity, and
efficiency in community policing. In D. P. Rosenbaum (Ed.), The challenge of
community policing: Testing the promises, (pp. 3–23). New York, NY: Sage
Publications.
Eck, J. E., & Maguire, E. R. (2000). Have changes in policing reduced violent crime? An
assessment of the evidence. In A. Blumstein & J. Wallman (Eds.) The crime drop
in America (pp. 207-228). Cambridge, UK: Cambridge University Press.
Finney, M. (1997). Scale economies and police department consolidation: Evidence from
Los Angeles. Contemporary Economic Policy, 15(1), 121–127.
Glensor, R. W., Correia, M. E., & Peak, K. J. (1999). Policing communities:
Understanding crime and solving problems: An anthology (1st edition). Oxford,
UK: Oxford University Press.
Goldstein, H. (1977). Policing a free society. Cambridge, MA: Ballinger Publishing
Company.
Goldstein, H. (1979). Improving policing: A problem-oriented approach. Crime &
Delinquency, 25(2), 236–258.
Goldstein, H. (1987). Toward community-oriented policing: Potential, basic
requirements, and threshold questions. Crime & Delinquency, 33(1), 6–30.
Goldstein, H. (1990). Problem-oriented policing. Philadelphia, PA: Temple University
Press.

55
Grinc, R. M. (1994). “Angels in marble”: Problems in stimulating community
involvement in community policing. Crime & Delinquency, 40(3), 437–468.
Gyimah-Brempong, K. (1987). Economies of scale in municipal police departments: The
case of Florida. The Review of Economics and Statistics, 69(2), 352–356.
Hirsch, W. Z. (1959). Expenditure implications of metropolitan growth and
consolidation. The Review of Economics and Statistics, 41(3), 232–241
Jacobs, J. (1961). The death and life of great American cities. New York, NY: Random
House.
Idaho State Police (2011). Crime in Idaho 2010. Retrieved February 22, 2016, from
https://www.isp.idaho.gov/BCI/ucr/crimeinidaho2010.html
Idaho State Police (2012). Crime in Idaho 2011. Retrieved February 22, 2016, from
https://www.isp.idaho.gov/BCI/ucr/crimeinidaho2011.html
Idaho State Police (2013). Crime in Idaho 2012. Retrieved February 22, 2016, from
https://www.isp.idaho.gov/BCI/ucr/crimeinidaho2012.html
Idaho State Police (2014). Crime in Idaho 2013. Retrieved February 22, 2016, from
https://www.isp.idaho.gov/BCI/ucr/crimeinidaho2013.html
Idaho State Police (2015). Crime in Idaho 2014. Retrieved February 22, 2016, from
https://www.isp.idaho.gov/BCI/ucr/crimeinidaho2014.html
International Association of Chiefs of Police. (2007). Police officer to population ratios:
Bureau of justice statistics data. Perspectives, 1(1). Retrieved February 22, 2016,
from http://www.theiacp.org/Portals/0/pdfs/Officer-to-Population-Ratios.pdf
Kelling, G. (1999). Measuring what matters: A new way of thinking about crime and
public order. Measuring What Matters, 27. Washington, DC: National Institute of
Justice and the Office of Community Oriented Policing Services.
Kelling, G. L., & Moore, M. H. (1988). The evolving strategy of policing. Washington,
DC: U.S. Department of Justice, Office of Justice Programs, National Institute of
Justice . Retrieved February 22, 2016, from
http://www.innovations.harvard.edu/sites/default/files/114213.pdf
56
King, W. R. (2009). Toward a life-course perspective of police organizations. Journal of
Research in Crime and Delinquency,46(2), 213-244.
King, W. R. (2014). Organizational failure and the disbanding of local police agencies.
Crime & Delinquency, 60(5), 667-692.
L.A. County Sheriff's Department (2009). A decade of leadership, 1998-2008. Retrieved
February 22, 2016, from http://file.lacounty.gov/lasd/cms1_143218.pdf
Langworthy, R. H. (1992). Organizational structure. In G. W. Cordner & D. C. Hale
(Eds.) What Works in Policing? Operations and Administration Examined (pp.
87–105).Cincinnati, OH: Anderson Publishing Company.
Levitt, S. D., & Dubner, S. J. (2006). Freakonomics: A rogue economist explores the
hidden side of everything. New York, NY: William Morrow.
Lithopoulos, S. (2015). A literature review on the amalgamation of police services in
Canada. Retrieved February 22, 2016, from
https://www.publicsafety.gc.ca/cnt/rsrcs/pblctns/2015-s014-rprt/2015-s014-rprt-
eng.pdf
Loveday, B. (1990). Road to regionalization. Policing, 6(4), 637–65.
Lyons, W. (2002). Partnerships, information and public safety: Community policing in a
time of terror. Policing: An International Journal of Police Strategies &
Management, 25(3), 530–542.
Maltz, M. D. (1975). Measures of effectiveness for crime reduction programs. Operations
Research, 23(3), 452–474.
Martins, M. R. (1995). Size of municipalities, efficiency, and citizen participation: A
cross-European perspective. Environment and Planning C: Government and
Policy, 13(4), 441–458.
McGregor, D. (1957). The human side of enterprise. Management Review, November
1957.
Mises, L. V. (1998). Human action. Auburn, AL: Ludwig von Mises Institute.

57
Moore, M. H. (1994). Research synthesis and policy implications. In D. P. Rosenbaum
(Ed.), The Challenge of Community Policing: Testing the Promises, (pp. 285-
299). New York, NY: Sage Publications.
National Resources Committee (1939). Urban government. Washington, D.C.:
Government Printing Office.
Officer Down Memorial Page. (2016). The Officer Down Memorial Page (ODMP).
Retrieved February 22, 2016, from https://www.odmp.org/
Oliver, W. M., & Meier, C. A. (2004). The four stress factors unique to rural patrol
revisited. The Police Chief, 71(11).
Ostrom, E. (1972). Metropolitan reform: Propositions derived from two traditions. Social
Science Quarterly, 53(3), 474–493.
Ostrom, E., & Whitaker, G. (1973). Does local community control of police make a
difference? Some preliminary findings. American Journal of Political Science,
48–76.
Ostrom, E., Parks, R. B., & Whitaker, G. P. (1973). Do we really want to consolidate
urban police forces? A reappraisal of some old assertions. Public Administration
Review, 423–432.
Ostrom, E., Parks, R. B., & Whitaker, G. P. (1978). Patterns of metropolitan policing.
Cambridge, MA: Ballinger.
Oxford University. (1938). A survey of the social services in the Oxford district (Vol. 2).
Oxford, UK: Oxford University Press.
Peck, J. H. (2015). Minority perceptions of the police: A state-of-the-art review.
Policing: An International Journal of Police Strategies & Management, 38(1),
173–203.
Rapoport, A. (1982). The meaning of the built environment: A nonverbal communication
approach. Tucson, AZ: University of Arizona Press.

58
Reaves, B. A. (2011). Census of state and local law enforcement agencies, 2008.
Washington, DC: U.S. Department of Justice, Office of Justice Programs, Bureau
of Justice Statistics.
Reaves, B. A. (2015). Local police departments, 2013: Personnel, policies, and
practices. Washington, DC: U.S. Department of Justice, Office of Justice
Programs, Bureau of Justice Statistics.
Sandy, J. P., & Devine, D. A. (1978). Four stress factors unique to rural patrol. The
Police Chief, 45(9), 42–44.
Shaw, C. R., & McKay, H. D. (1942). Juvenile delinquency and urban areas. Chicago,
IL: University of Chicago Press.
Sherman, L. W., & Weisburd, D. (1995). General deterrent effects of police patrol in
crime “hot spots”: A randomized, controlled trial. Justice Quarterly, 12(4), 625–
648.
Southwick, L. (2005). Economies of scale and market power in policing. Managerial and
Decision Economics, 26(8), 461.
Thurman, Q., Zhao, J., & Giacomazzi, A. L. (2001). Community policing in a community
era: An introduction and exploration. Los Angeles, CA: Roxbury Publishing
Company.
Trojanowicz, R., & Bucqueroux, B. (1990). Community policing: A contemporary
perspective. Cincinnati, OH: Anderson Publishing Co.
Unger, D. G., & Wandersman, A. (1985). The importance of neighbors: The social,
cognitive, and affective components of neighboring. American Journal of
Community Psychology, 13(2), 139–169.
U.S. Census Bureau (2010). Profile of general population and housing characteristics:
2010 demographic profile data. Washington, DC: U.S. Department of Commerce.
Retrieved February 22, 2016, from
http://factfinder.census.gov/faces/tableservices/jsf/pages/productview.xhtml?src=
bkmk

59
U.S. Census Bureau (2015). Annual estimates of the resident population: April 1, 2010 to
July 1, 2014. Washington, DC: U.S. Department of Commerce. Retrieved
February 22, 2016, from
http://factfinder.census.gov/faces/tableservices/jsf/pages/productview.xhtml?src=
bkmk
U.S. Department of Justice (2009). Community policing defined. Washington, DC: U.S.
Department of Justice, Office of Community Oriented Policing Services.
Retrieved February 22, 2016, from http://www.cops.usdoj.gov/pdf/vets-to-
cops/e030917193-CP-Defined.pdf
U.S. Department of Justice (2015). Herfindahl-Hirschman index. Washington, DC: U.S.
Department of Justice, Antitrust Division. Retrieved February 22, 2016,
fromhttp://www.justice.gov/atr/herfindahl-hirschman-index
Walzer, N. (1972). Economies of scale and municipal police services: The Illinois
experience. The Review of Economics and Statistics, 431–438.
Weber, M., Mills, C. W., & Gerth, H. H. (1965). Politics as a vocation. Philadelphia, PA:
Fortress Press.
Whitaker, G. P., Mastrofski, S., Ostrom, E., Parks, R. B., & Percy, S. L. (1982). Basic
issues in police performance. Washington, DC: U.S. Department of Justice,
National Institute of Justice.
Wilson, J. Q., & Kelling, G. L. (1982). Broken windows. Atlantic Monthly, 249(3), 29–
38.
Wilson, O. W., & McLaren, R. C. (1963). Police administration. New York, NY:
McGraw-Hill.
Wooldridge, J. (2015). Introductory econometrics: A modern approach. Toronto, ON:
Nelson Education.
Wyckoff, P. G. (1990). The simple analytics of slack-maximizing bureaucracy. Public
Choice, 67(1), 35–47.