IS BANGLADESH SELF-SUFFICIENT IN FOOD (GRAIN) PRODUCTION? Food Security in Bangladesh
26
IS BANGLADESH SELF-SUFFICIENT IN FOOD (GRAIN) PRODUCTION? Food Security in Bangladesh Pieter Dijkhuizen Country Director WFP Bangladesh World Food 1 Programme
-
Upload
kevyn-cobb -
Category
Documents
-
view
18 -
download
0
description
World Food 1 Programme. IS BANGLADESH SELF-SUFFICIENT IN FOOD (GRAIN) PRODUCTION? Food Security in Bangladesh Pieter Dijkhuizen Country Director WFP Bangladesh. World Food - PowerPoint PPT Presentation
Transcript of IS BANGLADESH SELF-SUFFICIENT IN FOOD (GRAIN) PRODUCTION? Food Security in Bangladesh

IS BANGLADESH
SELF-SUFFICIENT IN
FOOD (GRAIN) PRODUCTION?
Food Security in Bangladesh
Pieter Dijkhuizen
Country Director
WFP Bangladesh
World Food 1Programme
Reply to this question is
important for strategy of
WFP assistance to Bangladesh:
Food self-sufficiency:
withdrawal or local purchase
World FoodProgramme 2

Considerable progress has been made in last 25
years:
From
“Bottomless Basket”
to discussion:
“Is Bangladesh Self-Sufficient?
In the 70’s : up to 20% of food provided by food aid
In 2000: food aid amounts to 2% of food supply
World FoodProgramme 3
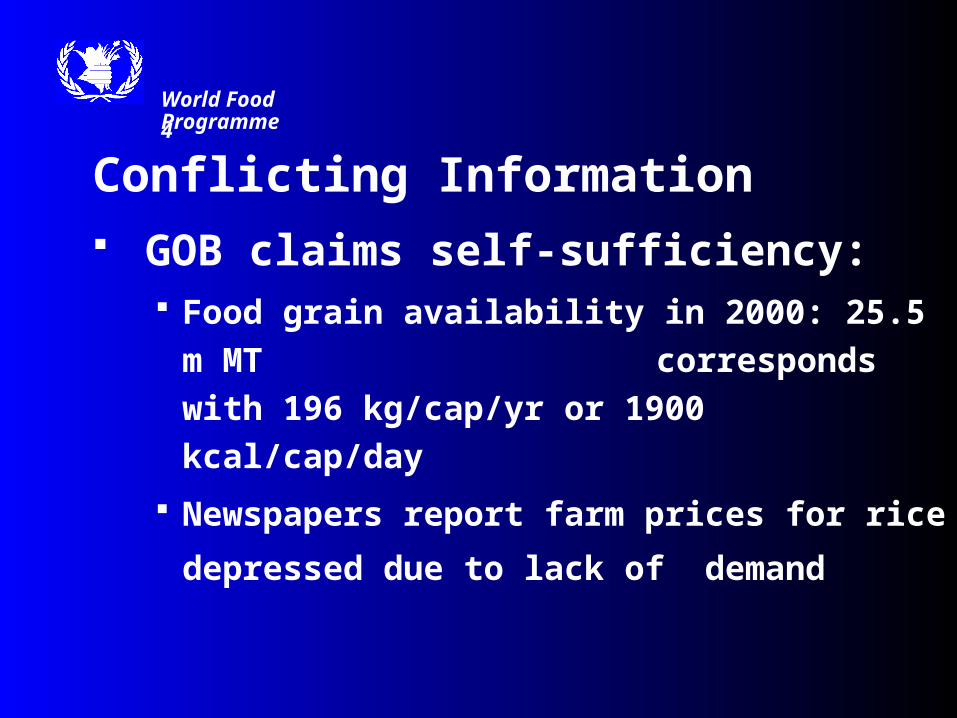
Conflicting Information GOB claims self-sufficiency:
Food grain availability in 2000: 25.5 m MT
corresponds with 196 kg/cap/yr or
1900 kcal/cap/day
Newspapers report farm prices for rice
depressed due to lack of demand
World FoodProgramme 4

HKI reports wide-spread serious
malnutrition:
Women almost 50% have BMI<18.5*;
45% Anaemic; 25% Vit-A deficient
Children <5 yrs:
55% Stunted*, Underweight, Anaemic
25% Vit-A deficient
* Indicating Chronic Under nutrition
World FoodProgramme 5

Food availability in 2000/01 (GOB)
( m MT Food grains)
Rice Wheat Total
Net local production* 22.5 1.5 24.0
Commercial imports 0.5 0.5 1.0
Food aid import 0.5 0.5
---------------------------
23.0 2.5 25.5
* 10% seeds and losses subtracted
World FoodProgramme 6

Food Requirement
• GOB assumes food grain requirement of
454 g/cap/day (1 lb)
• Total net food grain requirement
for Bangladesh therefore:
454 g x 365 days x 130 m people = 21.5 m MT
World FoodProgramme 7
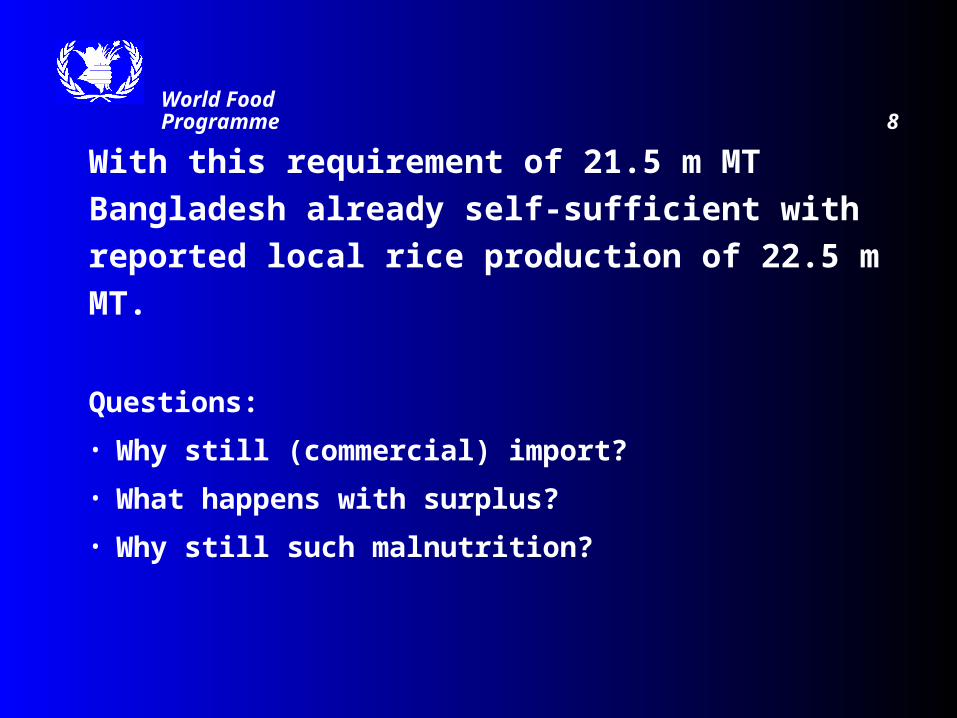
With this requirement of 21.5 m MT
Bangladesh already self-sufficient with reported
local rice production of 22.5 m MT.
Questions:
• Why still (commercial) import?
• What happens with surplus?
• Why still such malnutrition?
World FoodProgramme 8

Considering physiological needs and socio-
economic conditions FAO distinguishes 3
levels of food requirements:
1. Emergency level – 1800 kcal/cap/day
2. Requirement level – 2120 kcal/cap/day
3. Recommended level – 2400 kcal/cap/day
World FoodProgramme 9

Recommended level (2400 kcal/day)
takes into account:
Composition population
Size individuals
Physical activity level
Climate
Type of diet
Disease level
Distribution inequality
World FoodProgramme 10
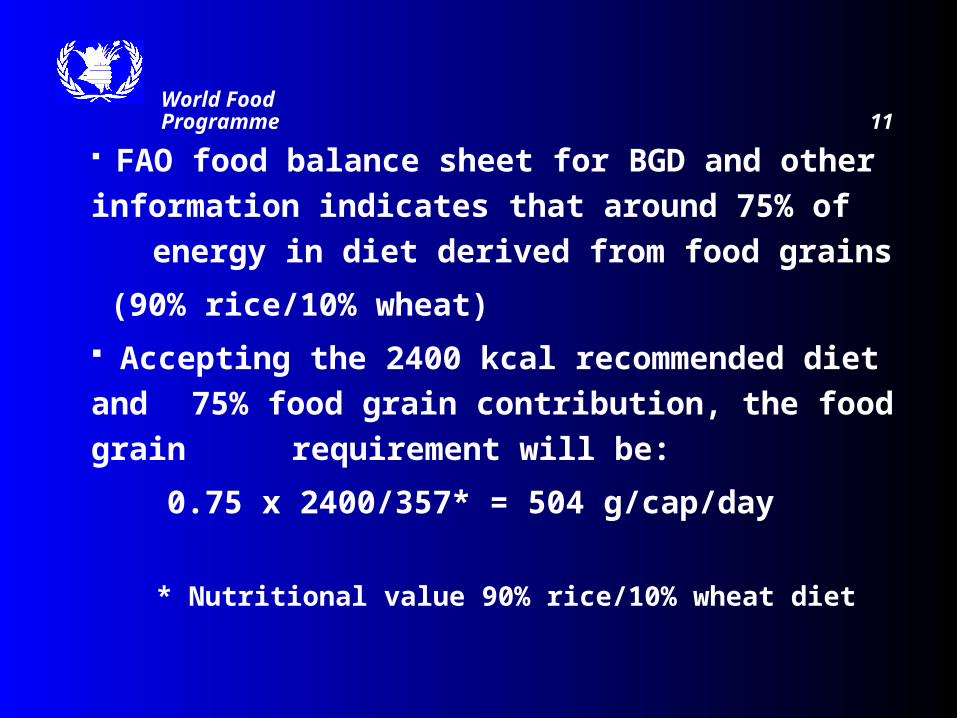
FAO food balance sheet for BGD and other
information indicates that around 75% of
energy in diet derived from food grains
(90% rice/10% wheat)
Accepting the 2400 kcal recommended diet and
75% food grain contribution, the food grain
requirement will be:
0.75 x 2400/357* = 504 g/cap/day
* Nutritional value 90% rice/10% wheat diet
World FoodProgramme 11

Total needs-based food grain requirement:
504 g x 365 days x 130 m people = 23.9 m MT
This amount coincides with claimed local food grain
production (24.0 m)
However availability (25.5 m MT) still exceeds requirement
Questions:
Still 1 m MT surplusₛ
Wide spread malnutrition unexplainedₛ
World FoodProgramme 12

Consumption Surveys: 1999 poverty monitoring survey (BBS)
2000 household income and expenditure survey (BBS)
outcome:
45% population (60 m) : absolute poverty
(food intake <2122 kcal/day)
20% population (26 m): hard-core poverty
(food intake <1805 kcal/day)
World FoodProgramme 13
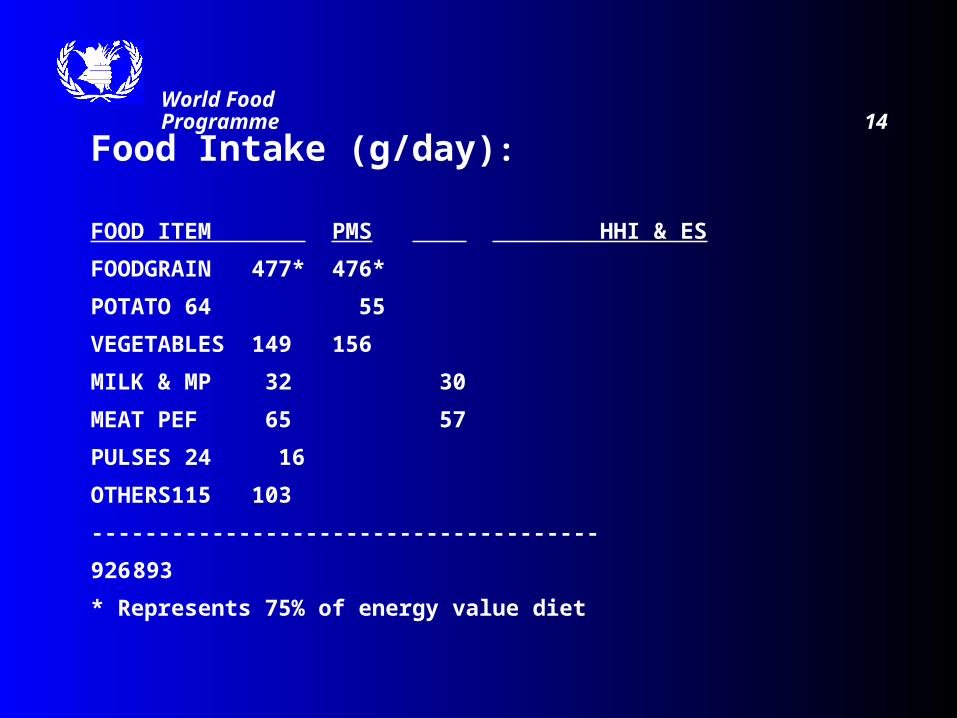
Food Intake (g/day):
FOOD ITEM PMS HHI & ES
FOODGRAIN 477* 476*
POTATO 64 55
VEGETABLES 149 156
MILK & MP 32 30
MEAT PEF 65 57
PULSES 24 16
OTHERS 115 103
--------------------------------------
926 893
* Represents 75% of energy value diet
World FoodProgramme 14

According Consumption Surveys:
Total food grain consumption
477 g x 365 days x 130m people = 22.6 m MT
= “true” availability
“Real” requirement : 23.9 m MT
Deficit between requirement and availability:
23.9 – 22.6= 1.3 m MT
Demand lower than requirement due to lack of
purchasing power
World FoodProgramme 15

“Realistic” local production:
22.6 m MT (consumption) – 1.5 m MT (imports)
= 21.1 m MT
Gap between “real” requirement and “realistic”
local production : 23.9 - 21.1 = 2.8 m MT
Deficit between requirement and availability:
23.9 – 22.6= 1.3 m MT
World FoodProgramme 16

Summary
Consumption = availability = 22.6 m MT food grain
Local production overestimated (losses too low)
‘Realistic’ net local production: 22.6 – 1.5 = 21.1 m MT (not 24.0)
‘Real’ requirement estimated at 23.9 m MT (not 21.5)
Gap requirement – local production: 23.9 – 21.1 = 2.8 m MT (12.7%)
Gap requirement – availability: 23.9 – 22.6 = 1.3 m MT
Above scenario explains importation needs and malnutrition
World FoodProgramme 17

Conclusion
Despite commercial imports and food aid still
considerable food deficit (1.3 m MT food grains):
due to lack of purchasing power
Food grain self-sufficiency not yet achieved
For immediate future still need for (imported) food aid
World FoodProgramme 18

What is the perspective for food(grain)
self-sufficiency of Bangladesh?
Detailed information from poverty monitoring
survey provides some insights
World FoodProgramme 19

Poverty Monitoring Survey: Intake Data (g/day)
World FoodProgramme 20
ITEM ALL POOR NON-POOR FAOFBS
FOODGRAIN 477* 439* 504* 518
POTATO 64 52 72 36
VEGETABLES 149 122 169 33
MILK & MP 32 12 47 41
MEAT PEF 65 33 89 39
PULSES 24 19 29 14
OTHERS 115 65 152 71
TOTAL 926 741 1060 753
KCAL
PROTEIN G
FAT G* Respectively 75%, 80%, 70%
2200
63
-
Energy
1900
-
-
Value
2500
-
-
Diet
2200
48
20

PMS/FAO-FBS Generic Developing Country
World FoodProgramme 21
ITEM PMS/N-P IMPORT/EXPORT FAOFBS-GDC
FOODGRAIN 504 15/- 455
POTATO 72 1/- 167
VEGETABLES 169 5/- 253
MILK&MP 47 16/- 129
MEAT & PEF 89 1/ 4 135
PULSES 29 32/- 21
OTHER (Fr Fa Su.) 152 Fa 90/-
Su 50/-
326
1060 1487
KCAL 2500
PROT G 63
FAT G 20
2684
69
62

Discussion 1: Diet Bangladeshi particular:
High rice demand
Low fat use
Large unmet demand for
Rice
Vegetables/fruit
Meat/fish/milk
Importation
Food grain
Milk
Fat
Sugar
World FoodProgramme 22

Discussion 2:
Food grain component of diet high;
expected to decrease with increase affluence population
Rice production has growth potential:
local paddy yield 3.6 MT/Ha,
surrounding countries 5.0 MT/Ha (40% up)
Decreased rice area would make room for foods now
imported
World FoodProgramme 23
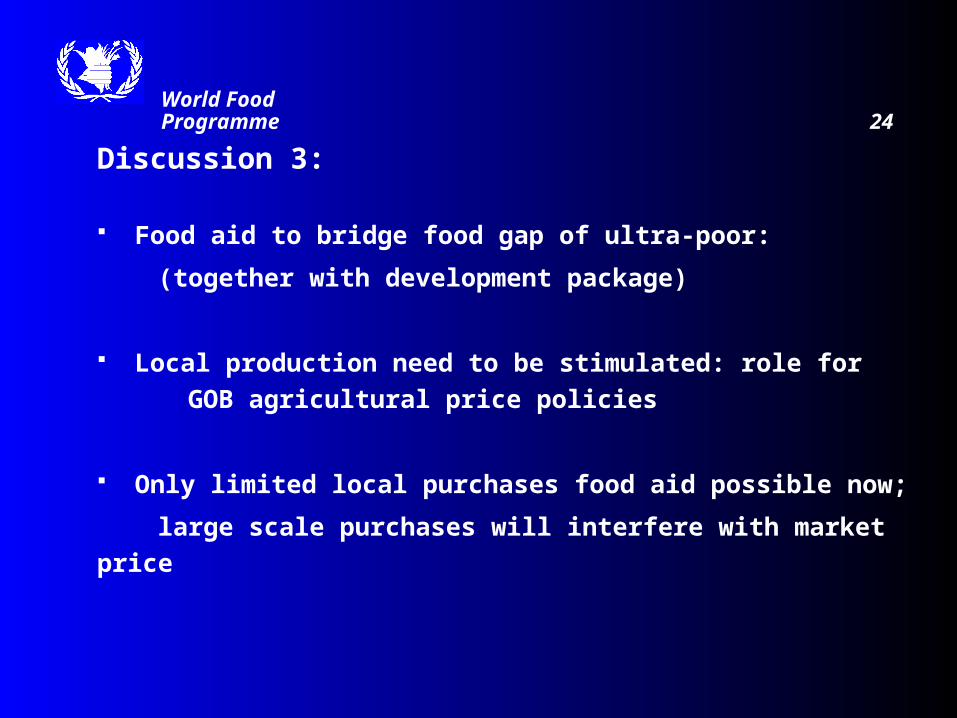
Discussion 3:
Food aid to bridge food gap of ultra-poor:
(together with development package)
Local production need to be stimulated: role for
GOB agricultural price policies
Only limited local purchases food aid possible now;
large scale purchases will interfere with market price
World FoodProgramme 24
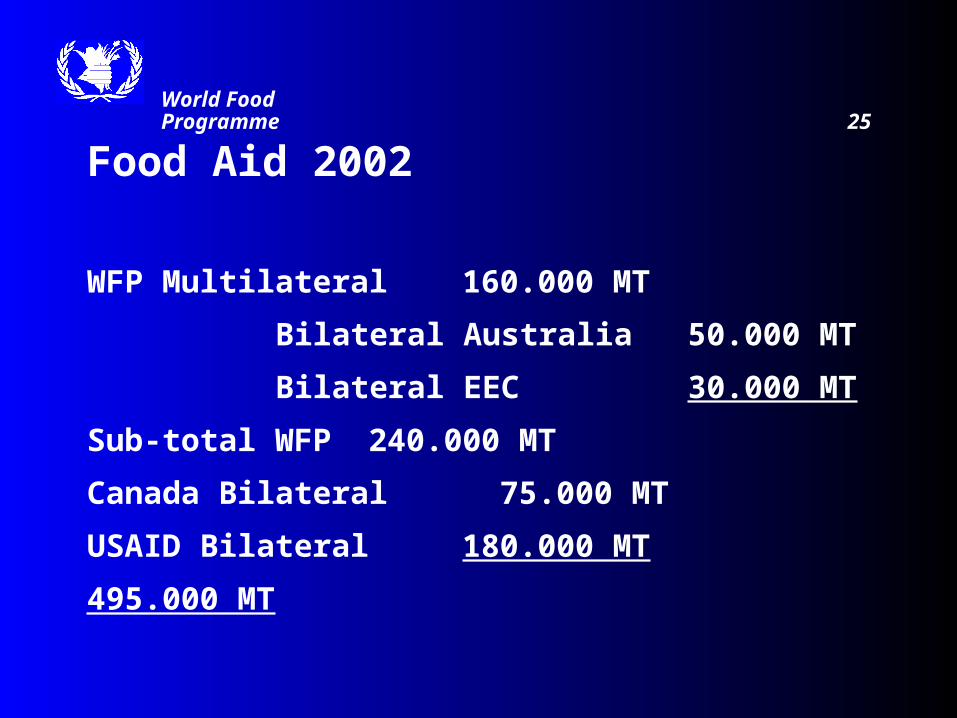
Food Aid 2002
WFP Multilateral 160.000 MT
Bilateral Australia 50.000 MT
Bilateral EEC 30.000 MT
Sub-total WFP 240.000 MT
Canada Bilateral 75.000 MT
USAID Bilateral 180.000 MT
495.000 MT
World FoodProgramme 25

Thank YouThank You
World FoodProgramme