IRS 2019 Q3 ANALYSIS - Eenadu5 daily thanthi 25758 24916 24054 23149 3 7 11 6 lokmat main 21765...
81
2019 Q3 (Compilation of 3 Quarters of previous rounds and 1 new quarter study)
Transcript of IRS 2019 Q3 ANALYSIS - Eenadu5 daily thanthi 25758 24916 24054 23149 3 7 11 6 lokmat main 21765...

2019 Q3
(Compilation of 3 Quarters of previous rounds
and 1 new quarter study)

2019 Q3� MRUC has released the readership data 2019 Q3.
� MRUC has decided to release the readership data every Quarter from 2019 onwards. This is called
the rolling sample method.
� Rolling sample is a compilation of the findings of the 4 Quarters study, which includes the fresh
Quarter and the preceding 3 Quarters of the earlier study.
� The findings are averaged and released.
� Sample size: 3,29,900 households all India
� The rolling sample details for this quarter are:� The rolling sample details for this quarter are:
Quarter Start date of
study
End date of
study
2017 Q4 August 2017 December 2017
2019 Q1 November 2018 April 2019
2019 Q2 April 2019 July 2019
2019 Q3 August 2019 November 2019
2

2019 Q3
All India trends
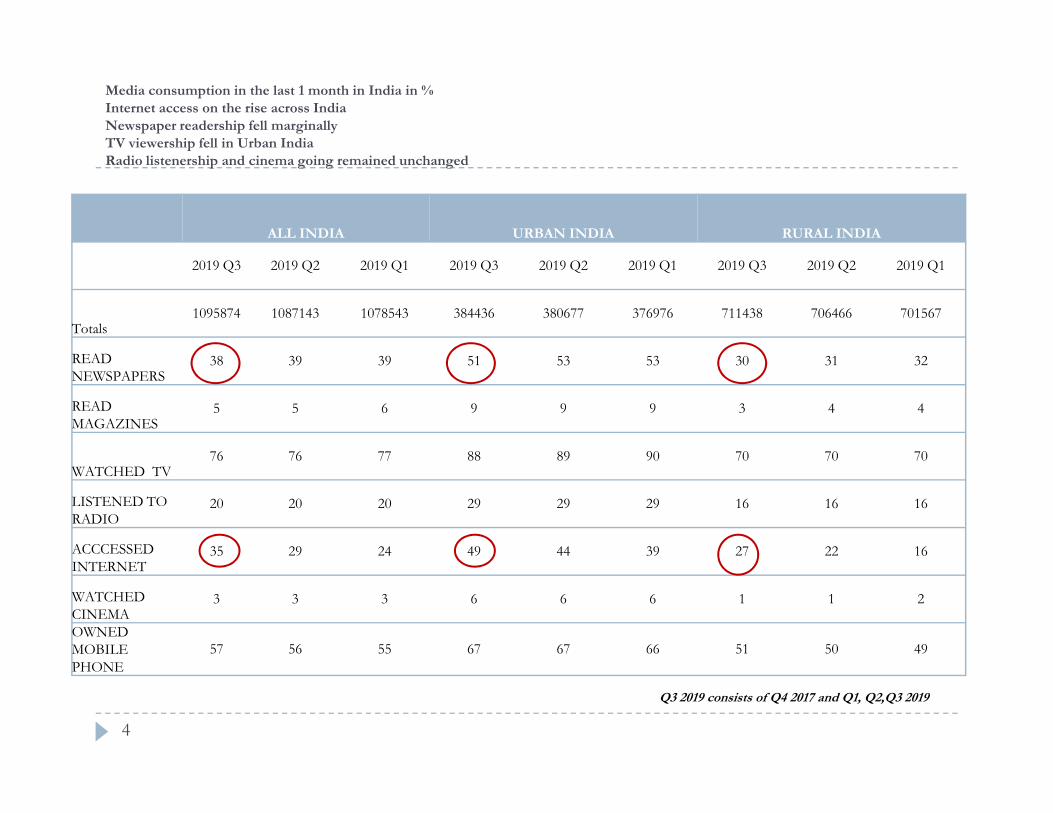
Media consumption in the last 1 month in India in %
Internet access on the rise across India
Newspaper readership fell marginally
TV viewership fell in Urban India
Radio listenership and cinema going remained unchanged
ALL INDIA URBAN INDIA RURAL INDIA
2019 Q3 2019 Q2 2019 Q1 2019 Q3 2019 Q2 2019 Q1 2019 Q3 2019 Q2 2019 Q1
Totals1095874 1087143 1078543 384436 380677 376976 711438 706466 701567
READ NEWSPAPERS
38 39 39 51 53 53 30 31 32
READ 5 5 6 9 9 9 3 4 4READ MAGAZINES
5 5 6 9 9 9 3 4 4
WATCHED TV76 76 77 88 89 90 70 70 70
LISTENED TO RADIO
20 20 20 29 29 29 16 16 16
ACCCESSED INTERNET
35 29 24 49 44 39 27 22 16
WATCHED CINEMA
3 3 3 6 6 6 1 1 2
OWNED MOBILE PHONE
57 56 55 67 67 66 51 50 49
Q3 2019 consists of Q4 2017 and Q1, Q2,Q3 2019
4

Read and Understand English in % increased across India
but remained unchanged in AP and Telangana
2019 Q3 2019 Q2 2019 Q1
All India 29 27 26
AP+TS 21 21 19
AP 16 16 15
Assam 30 29 25
Bihar 21 21 20
Chhattisgarh 16 16 16
Goa 56 55 55
Gujarat 18 17 16
Haryana 34 31 29
2019 Q3 2019 Q2 2019 Q1
All India 29 27 26
NCT Of Delhi 50 48 47
Nagaland 67 59 57
Odisha 39 34 28
Punjab 53 50 47
Rajasthan 16 16 19
Sikkim 66 64 63
Haryana 34 31 29
Himachal Pradesh57 57 52
Jammu & Kashmir64 64 63
Jharkhand 23 22 21
Karnataka 27 24 22
Kerala 48 45 37
Madhya Pradesh14 14 13
Maharashtra 34 31 29
Manipur 49 52 48
Meghalaya 43 38 31
Mizoram 47 35 21
Tamil Nadu 30 29 27
Telangana 27 27 24
Tripura30 28 28
Uttar Pradesh29 29 29
Uttarakhand 35 36 34
West Bengal 35 34 31
Delhi with NCR 51 49 48
UP without NCR
29 29 29
Haryana ... 30 28 26
5

Total Readership Trends across Languages in %
READ IN THE LAST 1 MONTH TR %
All India Urban Rural
2019 Q3 2019 Q2 2019 Q1 2019 Q3 2019 Q2 2019 Q1 2019 Q3 2019 Q2 2019 Q1
Any Daily35.7 36.7 37.3 49.0 50.3 51.1 28.5 29.3 29.9
Any English Daily3.1 3.0 2.9 7.4 7.2 7.0 0.8 0.8 0.7
Any Hindi Daily16.3 16.9 17.2 20.3 20.9 21.2 14.2 14.8 15.1
Any Bengali Daily2.0 2.0 2.0 2.9 3.0 3.0 1.5 1.4 1.4
Any Gujarati Daily1.8 2.0 2.1 3.2 3.4 3.6 1.1 1.2 1.3
Any Kannada Daily1.8 1.8 1.8 2.4 2.5 2.5 1.5 1.5 1.4
Any Malayalam-Daily2.3 2.3 2.3 3.3 3.4 3.4 1.7 1.8 1.8
Any Marathi Daily3.4 3.4 3.4 5.1 5.1 5.0 2.6 2.5 2.5
Any Oriya Daily1.0 1.0 1.0 0.8 0.8 0.9 1.1 1.1 1.1
Any Tamil Daily3.3 3.3 3.3 5.4 5.4 5.4 2.2 2.2 2.1
Any Telugu Daily1.9 2.1 2.3 2.6 2.9 3.1 1.6 1.7 1.9
Indicates fall
Indicates growth
6

Average Issue Readership Trends across Languages in %
Hindi, Malayalam and Telugu languages seen a drop in readership
AIR %
All India Urban Rural
2019 Q3 2019 Q2 2019 Q1 2019 Q3 2019 Q2 2019 Q1 2019 Q3 2019 Q2 2019 Q1
Any Daily14.7 15.3 16.1 24.0 25.2 26.1 9.6 10.0 10.6
Any English1.2 1.2 1.2 3.1 3.2 3.2 0.2 0.2 0.2
Any Hindi6.4 6.7 7.1 9.7 10.1 10.5 4.6 4.9 5.3
Any Bengali0.7 0.7 0.7 1.4 1.4 1.4 0.4 0.4 0.4
Any Gujarati0.9 0.9 0.9 1.8 1.9 2.0 0.4 0.3 0.4
Any Kannada0.7 0.7 0.7 1.0 1.1 1.2 0.5 0.5 0.5
Any Malayalam1.4 1.6 1.6 2.1 2.3 2.4 1.0 1.2 1.2
Any Marathi1.5 1.5 1.5 2.5 2.6 2.6 0.9 0.9 0.9
Any Oriya0.3 0.3 0.3 0.4 0.4 0.4 0.3 0.3 0.3
Any Tamil1.0 1.0 1.0 1.9 2.0 2.0 0.6 0.5 0.5
Any Telugu0.9 1.0 1.1 1.3 1.5 1.6 0.7 0.7 0.8
Indicates fall
Indicates growth
7

NCCS D&E declining
5
9
10
12
15
14
12
11
7
5
9 9
11
15
13
12
11
8
5
8
9
11
14
13
12 12
9
8 8
11
13 13
12 12
10
5
Lower NCCS shrinks from 40% in 2017 to 33% in 2019 Q3NCCS B1,B2 to C2 increased by 1%
2
5
2
1
2
5
4
1
2
5
4
1
2
4
5
2
A1 A2 A3 B1 B2 C1 C2 D1 D2 E1 E2 E3
19 Q3 19 Q2 19 Q1 2017
8

All In
dia
Prin
t reach
Sta
te wise: S
ho
wn
a d
rop
over Q
2 an
d Q
1
60
2828
28
65
2928
29
68
3029
35
2828
28
2524
2120
1919
1818
1716
1616
1514
1414
1313
2826
25
2120
2120
1918
1717
1717
1415
1515
1413
2625
2120
26
2118
1818
1716
18
12
1717
1616
14
Kerala
Delhi with NCT
NCT Of Delhi
Manipur
Goa
Himachal Pradesh
Tamil Nadu
Maharashtra
Uttarakhand
Rajasthan
Haryana
Punjab
Karnataka
Gujarat
Haryana without NCT
Nagaland
Meghalaya
Chhattisgarh
AP+TS
Uttar Pradesh
UP without NCT
Madhya Pradesh
Q3
Q2
Q1
9

% Share of Regular readers language wise- Unchanged for Telugu
More than the national average by 5%
3638
47
3937
62
43
46
36
40
45
4038
67
4346
37
4244
41 40
70
44
47
AIR/TRNational Average is 41%
BE
NG
AL
I
EN
GL
ISH
GU
JAR
AT
I
HIN
DI
KA
NN
AD
A
MA
LA
YA
LA
M
MA
RA
TH
I
OR
IYA
PU
NJA
BI
TA
MIL
TE
LU
GU
29 3031
30 303130 30 31
2019 Q3 2019 Q2 2019 Q1
10

All India Top 20 dailies Total Readership
Read in the last 1 monthTOTAL READERSHIP GROWTH/FALL % OF Q3
2019 Q3 2019 Q2 2019 Q1 2017 ON Q2 ON Q1 ON 17
S.NO 12+ yrs individuals 1095874 1087143 1078543 1046004 1 2 5
1 DAINIK JAGRAN 70430 72559 73673 70377 -3 -4 0
2 DAINIK BHASKAR 52622 52111 51413 45105 1 2 17
3 HINDUSTAN(MAIN) 51308 52866 54696 52397 -3 -6 -2
4 AMAR UJALA 44797 47066 47645 46094 -5 -6 -3
5 DAILY THANTHI 25758 24916 24054 23149 3 7 11
6 LOKMAT MAIN 21765 20443 19702 18066 6 10 20
7 M.MANORAMA 17849 18091 17480 15999 -1 2 12
8 RAJASTHAN PATRIKA 17476 17816 18040 16326 -2 -3 78 RAJASTHAN PATRIKA 17476 17816 18040 16326 -2 -3 7
9 THE TIMES OF INDIA MAIN 16986 16126 15234 13045 5 12 30
10 DAILY SAKAL 13996 12903 11840 10498 8 18 33
11 DINAKARAN 13109 12992 12657 12083 1 4 8
12 EENADU 12891 14326 15674 15848 -10 -18 -19
13 ANANDA BAZAR PATRIKA 12840 12533 12546 12763 2 2 1
14 MATHRUBHUMI 12673 13240 12970 11848 -4 -2 7
15 PRABHAR KHABAR 12459 13123 14102 13492 -5 -12 -8
16 DINAMALAR 12042 12081 11779 11659 0 2 3
17 PUNJAB KESARI 11807 12156 12655 12232 -3 -7 -3
18 PUNYA NAGARI 10884 10256 9684 9520 6 12 14
19 GUJARAT SAMACHAR 9928 10870 11873 11784 -9 -16 -16
20 BARTAMAN 9927 9765 9511 9674 2 4 3
Eenadu ranked no 10 in the 2019 Q2
11
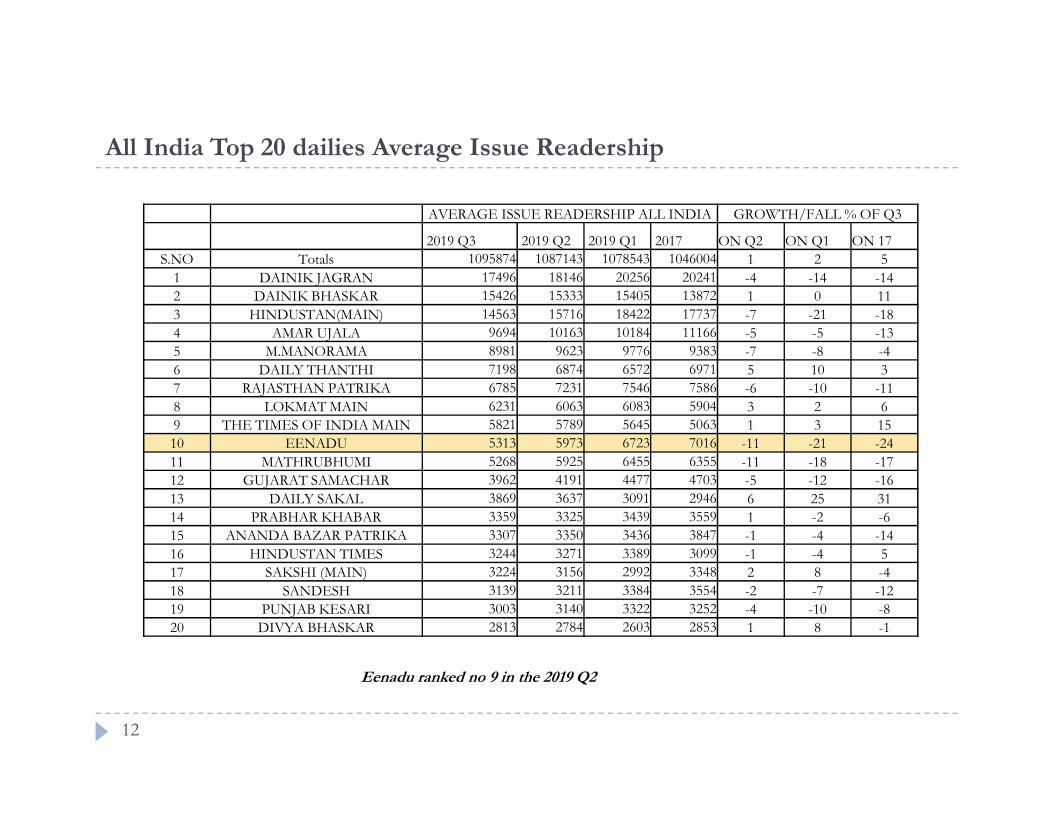
All India Top 20 dailies Average Issue Readership
AVERAGE ISSUE READERSHIP ALL INDIA GROWTH/FALL % OF Q3
2019 Q3 2019 Q2 2019 Q1 2017 ON Q2 ON Q1 ON 17
S.NO Totals 1095874 1087143 1078543 1046004 1 2 5
1 DAINIK JAGRAN 17496 18146 20256 20241 -4 -14 -14
2 DAINIK BHASKAR 15426 15333 15405 13872 1 0 11
3 HINDUSTAN(MAIN) 14563 15716 18422 17737 -7 -21 -18
4 AMAR UJALA 9694 10163 10184 11166 -5 -5 -13
5 M.MANORAMA 8981 9623 9776 9383 -7 -8 -4
6 DAILY THANTHI 7198 6874 6572 6971 5 10 3
7 RAJASTHAN PATRIKA 6785 7231 7546 7586 -6 -10 -11
8 LOKMAT MAIN 6231 6063 6083 5904 3 2 68 LOKMAT MAIN 6231 6063 6083 5904 3 2 6
9 THE TIMES OF INDIA MAIN 5821 5789 5645 5063 1 3 15
10 EENADU 5313 5973 6723 7016 -11 -21 -24
11 MATHRUBHUMI 5268 5925 6455 6355 -11 -18 -17
12 GUJARAT SAMACHAR 3962 4191 4477 4703 -5 -12 -16
13 DAILY SAKAL 3869 3637 3091 2946 6 25 31
14 PRABHAR KHABAR 3359 3325 3439 3559 1 -2 -6
15 ANANDA BAZAR PATRIKA 3307 3350 3436 3847 -1 -4 -14
16 HINDUSTAN TIMES 3244 3271 3389 3099 -1 -4 5
17 SAKSHI (MAIN) 3224 3156 2992 3348 2 8 -4
18 SANDESH 3139 3211 3384 3554 -2 -7 -12
19 PUNJAB KESARI 3003 3140 3322 3252 -4 -10 -8
20 DIVYA BHASKAR 2813 2784 2603 2853 1 8 -1
Eenadu ranked no 9 in the 2019 Q2
12

Eenadu has highest % share of regular readers after Malayalam dailies
50
42 41 40 3937 36
35 35 34
29 29 28 28 2825 25
22
53
4542
3941
36 3734 35
36
29 30 3028 28
26 25
22
56
50
43
38
42
3437
33 32
37
30 3134
27 26 26 27
21
SHARE OF REGULAR READERS
M M
AN
OR
AM
MA
TH
RU
BH
UM
I
EE
NA
DU
G.S
AM
AC
HA
R
RA
JAS
TH
AN
PA
TR
IKA
SA
KS
HI
N.T
EL
AN
GA
NA
SA
ND
ES
H
DIV
YA
BH
AS
KA
R
TIM
ES
OF
IN
DIA
D.B
HA
SK
AR
LO
KM
AT
HIN
DU
ST
AN
DA
ILY
TH
AN
TI
DA
ILY
SA
KA
L
P.K
ES
AR
I
DA
INIK
JA
GR
AN
AM
AR
UJA
LA
19 Q3 19 Q2 19 Q1
13

7198
8981
17496
15426
65%
61%
70%
12%
163%
Top dailies by language : AIR (‘000) & % lead over No 2 daily
Readership indicated here is All IndiaD
ail
y T
han
thi
Din
am
ala
...
Een
ad
u
Sak
shi (M
ain
)
Lo
km
at
Dail
y S
ak
al
M.M
an
ora
ma
Math
rub
hu
mi
Gu
jara
t S
am
ach
ar
San
des
h
Sam
bad
(O
ri)
Sam
aja
AB
P
Bart
am
an
Vij
ay
Karn
ata
ka
Vij
aya
van
i
Aji
t
Jag
Ban
i
D.J
ag
ran
D.B
hask
ar
Tamil Telugu Marathi Malayalam Gujarati Oriya Bengali Kannada Punjabi Hindi
2739
5313
3224
6231
3869
5268
39623139
1479 1290
33072741 2643
2265
1121 959
65%
26%
15%
21% 17%
17%
14

State wise leading daily % reach vs Print % reach
Eenadu reaches 50% of print reach in AP+TS
15 17 17
65
13
20
11
20 2115
21
12 12
50%
49 %
50%
48%55 %
Eenadu
G Samachar
V.Karnataka
M Manorama
D.bhaskar
Lokmat
Sambad
R.patrika
D.ThantiD.Jagaran ABP
Hindustan
AP
TS
Gu
jara
t
Karn
ata
ka
Ker
ala
Mad
hya
Pra
des
h
Mah
ara
shtr
a
Od
ish
a
Raja
sth
an
Tam
il N
ad
u
Utt
ar
Pra
des
h
Utt
ara
kh
an
d
Wes
t B
eng
al
Bih
ar
Print Reach Leading daily reach
Hindustan
15

2019 Q3
AP+TS

2019 Q3-AP+TS Universe increase of 12+ yrs individuals
4481144585
44362
3305932836 32616
1% increase over 2019 Q1
2019 Q3 2019 Q2 2019 Q1
AP TS
17

Urban and Rural Households in AP+TS
nearly 2% increase in households over Q2
5247 5172 5098
10016 9975 9934
5935 5906 5876
2019 Q3 2019 Q2 2019 Q1 2019 Q3 2019 Q2 2019 Q1
AP TS
15263 15147 15032
10718 10613 10508
4783 4707 4632
Totals Urban Rural
18

Population distribution in AP and TS
Urban population increased by 2% over 19 Q1 in AP and TS
Urban - 1-2L
Urban - Less than 1L
Rural - More than 5K
Rural - Less than 5K
2128
5045
12372
16687
2116
4967
12339
16671
2105
4890
12305
16655
Urban - 1-2L
Urban - Less than 1L
Rural - More than 5K
Rural - Less than 5K
987
3910
4960
13306
979
3835
4949
13269
1268
972
3763
4937
13233
Urban Metro 50L+
Urban Metro 15-50 L
Urban Metro 10+15 L
Urban 5-10L
Urban - 2-5L
1804
1625
1312
3837
1788
1607
1299
3799
1771
1589
1286
3761
AP IRS 2019 Q1 AP IRS 2019 Q2 AP IRS 2019Q3
Urban Metro 50L+
Urban Metro 15-50 L
Urban Metro 10+15 L
Urban 5-10L
Urban - 2-5L
7831
779
1286
7755
772
1277
7679
765
1268
TS IRS 2019 Q1 TS IRS 2019 Q2 TS IRS 2019Q3
19

% of Media consumption in AP and TS in last 1 month
The newspaper readership dropped by 4% over 2019 Q2
Internet consumption has increased by 3% compared to 2019 Q2
Radio listenership and mobile ownership increased by 1% and 2% respectively
AP+TS AP TS
2019 Q3 2019 Q2 2019 Q1 2019 Q3 2019 Q2 2019 Q1 2019 Q3 2019 Q2 2019 Q1
Read Newspapers29 32 34 27 29 31 32 36 38
Read Magazines 22 3
22 3 3 3 3
Read Any Print29 32 35 27 29 32 32 36 38
Watched TV91 91 91 92 91 91 90 90 90
Listened to Radio10 9 10 8 8 10 12 11 11
Accessed Internet29 26 24 25 22 20 34 30 28
Watched cinema7 8 9 7 8 9 8 8 9
Owned Mobile phone59 57 57 55 53 53 66 63 62
20

NCCS DISPERSION IN % FOR AP+TS, AP, &TS
NCCS A has seen a growth over Q2 by 1% and 2% respectively in AP+TS
NCCS B &C have grown by2% in AP
NCCS A & B have grown by 1% in TS
38
21 22 23 2325 25
18 18 19
Q3 Q2 Q1 Q3 Q2 Q1 Q3 Q2 Q1
AP+TS AP TS
13 12 12 9 9 917 16 16
25 23 2323 21 21
27 26 26
4040 39 42
41 40
38 38 37
NCCS A NCCS B NCCS C NCCS D
21

NCCS dispersion in actual numbers
AP+TS AP TS
Q3 Q2 Q1 Q3 Q2 Q1 Q3 Q2 Q1
UNIVERSE77870 77421 76978 44811 44585
44362 33059 32836 32616
9769 9414 9296 4222 4138 4179 5547 5276 5117NCCS A
9769 9414 9296 4222 4138 4179 5547 5276 5117
NCCS B19179 18048 17828 10370 9430 9404 8809 8618 8425
NCCS C31460 30738 30095 18952 18258 17892 12508 12480 12203
NCCS D16008 17221 17322 10130 11244 11068 5878 5976 6254
NCCS E1454 2001 2437 1137 1515 1819 317 486 617
22 Figs in 000s

AP+TS Market
� The digital consumption in AP+TS has increased by 3%.
� TV remained unchanged.
� Print and Cinema have seen a drop in this quarter 3
� The Universe of 12+ yrs individuals increased by 4.49 lakh in Q3
� The NCCS AB is 37% of the Universe of 12+ individuals
� 43% of the total population is in the age group of 20-39 yrs.
Figs:000s
� 43% of the total population is in the age group of 20-39 yrs.
� 19% are in the 12-19 yrs age group

Eenadu
Strengths and comparisons with competitors
AP+TS

Total Readership – AP+TS
12489
8379
13946
8597
15328
8622
Eenadu has 49% more readers than the no 2 daily in AP+TS
Eenadu Sakshi (Main)
Andhra Jyoti Namaste Telangana
Deccan Chronicle
The Hindu (Main)
The Times of India ( Main)
Vaartha Andhra Prabha
Andhra Bhoomi
Prajasakti Siasat The Munsif
5244
2249
876
611 437 424 292 284 209206
125
5850
2843
847593 456 528 339 336 203 170 119
6236
3013
782563 448
642430 452
248167 112
2019 Q3 2019 Q2 2019 Q1
25

Total Readership AP.
6750
5412
7243
5370
8251
5238
Eenadu has 25% more readers than Sakshi
Eenadu Sakshi (Main) Andhra Jyoti Prajasakti Andhra Bhoomi Vaartha Andhra Prabha The Hindu (Main)
3219
180 164 135 132 107
3628
176 207 189 172 111
3897
222 297 242 230 136
2019 Q3 2019 Q2 2019 Q1
26

Total Readership -Telangana
All dailies dropped in readership over Q2.
DC gained 5% readership
5739
6703
7077
Eenadu has 93 % more readers than Sakshi
Eenadu Sakshi (Main)
Namaste Telangana
Andhra Jyoti Deccan Chronicle
The Times of India ( Main)
The Hindu (Main)
Vaartha Siasat Andhra Prabha
The Munsif Andhra Bhoomi
2968
22312025
769
415 349 289 206 160 125 120
3228
2806
2221
735
416 371 339170 167 119 130
3384
2973
2339
646
373 325 400167 200 107 155
2019 Q3 2019 Q2 2019 Q1
27

Average issue readership AP+TS
No 2 daily has only 61% of Eenadu readership
5179
3155
1997
5822
3086
2239
6585
2947
2476
Eenadu leads with 64 % more readers than Sakshi
EE
NA
DU
SA
KS
H (
MA
IN)
AN
DH
RA
JY
OT
I
N.T
EL
AN
GA
NA
DE
CC
AN
CH
RO
NIC
LE
TH
E H
IND
U(M
AIN
)
TO
I (M
AIN
)
VA
AR
TH
A
Sia
sat
1997
817
343192 179 135 105
2239
1049
352
185 195 145 100
1112
319 161 183 178 86
2019 Q3 2019 Q2 2019 Q1
28

AIR -AP
2468
1896
2925
1850
3494
1708
30 % lead over no 2 daily
EENADU SAKSH (MAIN) ANDHRA JYOTI
1198
1378
1708
1519
2019 Q3 2019 Q2 2019 Q1
29

AIR Telangana
2711
2898
3091
115% lead over no 2 daily
1260
814799
304163 127 105
1236
1047
861
310167 132 100 66 112
12391111 957
250144 96 86 68
133
2019 Q3 2019 Q2 2019 Q1
30

Total Readership in AP+TS 2019 Q3
12489
8379
Eenadu leads by 33 % over the no 2 daily
Eenadu Sakshi (Main) Namaste Telangana
The Hindu (Main)
The Times of India ( Main)
Andhra Prabha Prajasakti The Munsif
5244
2249
876611 574 437 424 292 284 209 206 125 64
31

Average Issue readership AP+TS 2019 Q3
5179
3155
Eenadu leads by 39 % over the no 2 daily
AIR: Read yesterday
Eenadu Sakshi (Main) N.Telangana The Hindu(Main) Sakshi (Variant) Siasat
3155
1997
817
343192 179 170 135 105
32

Eenadu retains huge lead over competing Telugu dailies in both urban and rural AP+TS
Eenadu readership relatively more skewed to urban : higher purchasing power, limited wastage
2352
1661
986
490
Rural
Eenadu vs Telugu dailies AIR (‘000) : Urban vs Rural
Eenadu readership is 89%
and 42% higher than
2827
2352
1494
1011
327
Urban
AIR (000)
NT AJ Sakshi Eenadu
and 42% higher than
Sakshi in Urban and Rural
AP+TS
33
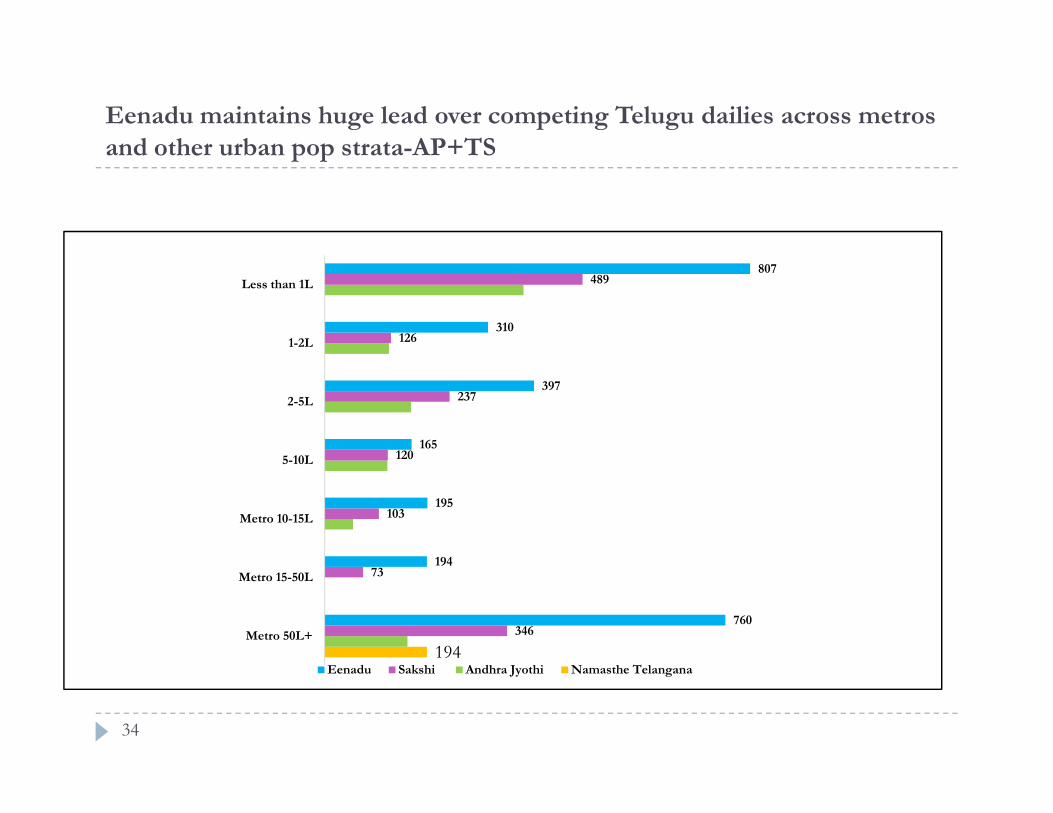
Eenadu maintains huge lead over competing Telugu dailies across metros
and other urban pop strata-AP+TS
237
126
489
397
310
807
2-5L
1-2L
Less than 1L
194
346
73
103
120
760
194
195
165
Metro 50L+
Metro 15-50L
Metro 10-15L
5-10L
2-5L
Eenadu Sakshi Andhra Jyothi Namasthe Telangana
34
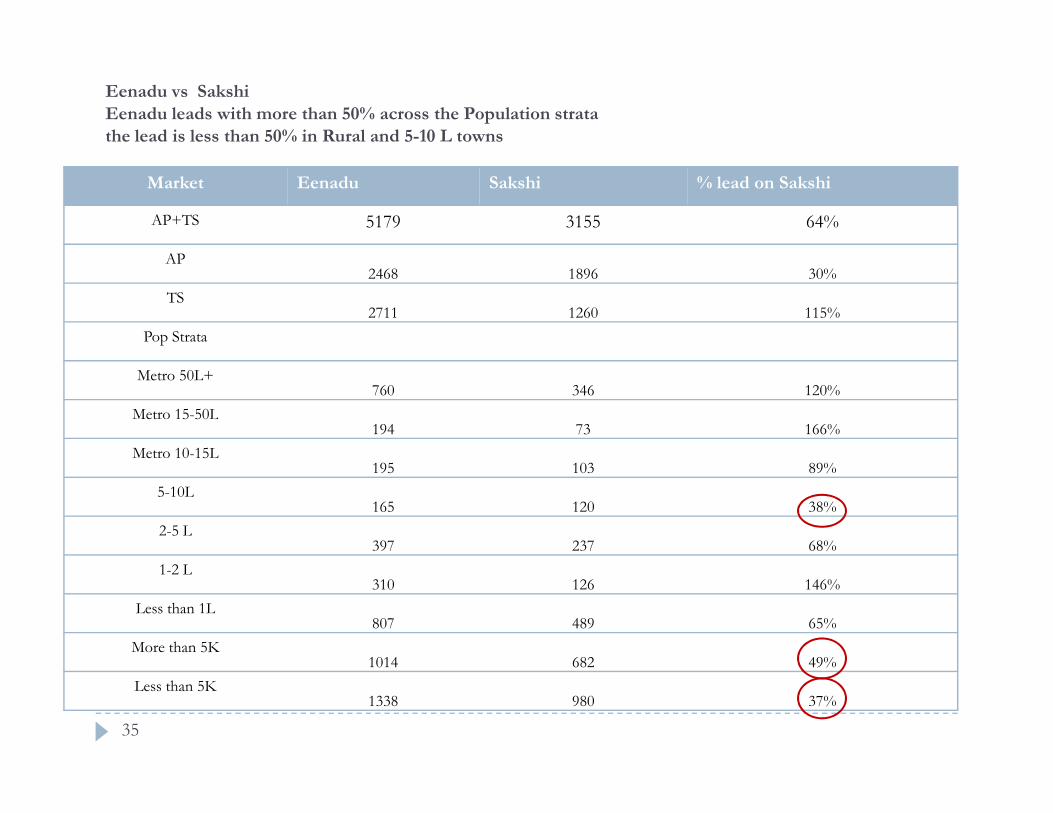
Eenadu vs Sakshi
Eenadu leads with more than 50% across the Population strata
the lead is less than 50% in Rural and 5-10 L towns
Market Eenadu Sakshi % lead on Sakshi
AP+TS 5179 3155 64%
AP2468 1896 30%
TS2711 1260 115%
Pop Strata
Metro 50L+760 346 120%
Metro 15-50LMetro 15-50L194 73 166%
Metro 10-15L195 103 89%
5-10L165 120 38%
2-5 L397 237 68%
1-2 L310 126 146%
Less than 1L807 489 65%
More than 5K1014 682 49%
Less than 5K1338 980 37%
35

Readership of Urban Reporting Centers-AP+TS
195 194
103
Vijayawada Visakhapatnam Warangal Guntur Nellore
70
56
39
73
5244
54
65
36
Eenadu Sakshi A.Jyoti
36

Readership by districts in AP
249
298
449
127
190
278
321
133
184
123
350
273
137
228
125
152 150
183
219
180
-15%
-15%-13%
116127 133
123137
125115 119
EENADU SAKSHI A JYOTI
37

District wise readership in Telangana
Eenadu leads across districts in Telangana
306
273
529
302319
Adilabad+Nizamabad Medak+RR Nalgonda+Khammam karimnagar Mahabubnagar Warangal
273
222225
257
107 115
199
118
162149
80
Eenadu Sakshi Ajyoti N.Telangana
38

Urban Rural Readership split-AP
Eenadu leads by 55% over Sakshi in Urban AP
1242
1226
109250%
50%
58%
Eenadu Sakshi (Main) AJ
2468
1896
1198
804
537
662
Total Urban Rural
42%
55%
45%
39

Urban and Rural Readership Split TS
Eenadu leads with 129% more readers than Sakshi in Urban TS
91% more readers than Sakshi in Rural TS
1585
1126
52%
48%
Eenadu Sakshi (Main) Andhra Jyothi Namasth... DC TH TOI
2711
1260799 814
304 127 163
691
475 324
299
127 163
589
324 490
5
Total Urban Rural
55%
45%
59%
41%
40%
60%
40

Eenadu has 24% more exclusive Urban readers than AJ+Sakshi+NT together AP+TS
Eenadu has 75% unduplicated readership compared to 3 competitor dailies
74% unduplicated readership with All 8 Telugu dailies
5179
54175597
2827 2893 2977
Duplication with 3 dailies Duplication with 8 Telugu dailies
6,29,000 urban
duplication
6,48,000
urban
duplication
Eenadu AJ+NT+Sakshi All Telugu(8 dailies)
2827
25242620
2362
2893
Total Urban Rural
6,59,000
Rural duplication
7,00,000 rural
duplication
8 dailies:AB+AP+AJ+S+NT+PS+V+MT
41

Eenadu alone reaches more than 50% of readers of any daily
or any Telugu daily readers across AP and Telangana
51 5053
48
5451
58
64
AP+TS AP TS Hyd
32 31 30
Any Daily Any Telugu daily Any English daily
42

Eenadu has higher no of Solus readers than Sakshi and any
other Telugu daily-AP+TS
4364
Eenadu alone and not Sakshi Eenadu alone and not Sakshi/AJ/NT
Eenadu alone and no other Telugu daily
3891
3831
Duplication with
Sakshi is 8,15,000Duplication with any
Telugu daily 13,48,000Duplication with
3 dailies is 12,88,000
43

Eenadu reaches 9 times more readers than all English
Combined- APTS
5179
Duplication 1,81,000
Eenadu all English combined
581
44

Eenadu maintains huge lead over competition across all age groups in AP+TS
About 47 % readers from 20-39 age band
53% more than Sakshi readers in that segment
1479
107210161034
285
631696
279
372
637
431402
197
425 404352
434
215 193
112
12- 15 16-19 20-29 30 - 39 40 - 49 50+
Eenadu Sakshi (Main) Andhra Jyothi Namasthe Telangana
45

Eenadu ’s lead over Telugu and English dailies- AP+TS
Eenadu delivers 116% more Grads and Post Grads than Sakshi
1 in every 3 Eenadu readers is graduate/Post graduate
EenaduAll Telugu
% lead on telugu
dailies All English
% lead on
English dailies
NCCS A1400 201 99 190 111
NCCS A1857 1433 30 442 320
NCCS B1780 1886 80 21251780 1886 80 2125
NCCS AB3637 3320 10 521 598
GRADUATES1444 1237 17 266 443
POST GRADUATES
513 304 69 137 274
Female1291 1250 3 120 976
46

Eenadu delivers 116% more Grads+Post-grads than Sakshi in AP+TS1 in every 3 Eenadu reader is a graduate / post graduate
1444
AIR (‘000)
36%
27%28%
36%
% share of Grads/ PG
513
715
189
468
90
243
Graduates Post Graduate
Eenadu Sakshi Andhra Jyothi Namasthe Telangana
Eenadu Sakshi Andhra Jyothi Namaste Telangana
47

51%52%
57%55%
53%
56%
60%
55%
All
Male
NCCS A
NCCS AB
20-39
Businessman/Industrialist/SEP/Officer/Executiv
Officer / Executive
Weekly internet user
Share of any daily AIR (%)
Een
ad
u sh
are o
f an
y daily A
IR (A
P +
Tela
ng
an
a)
Een
adu acco
un
ts for m
ore th
an h
alf (51%) o
f overall d
aily readersh
ip in
AP
+T
S
NCCS A
NCCS AB
Businessman/Industrialist/SEP/Officer/Executiv
e
Officer / Executive
Weekly internet user
48

Eenadu has huge lead over competing English and Telugu dailies in key affluent targets in Hyderabad
Eenadu All Telugu % lead on Telugu dailies All English
% lead on
English
NCCS A1 201 103 95 155 30
NCCS A 526 352 49 327 61
NCCS B 166 131 27
NCCS AB 692 483 43 376 84NCCS AB 692 483 43 376 84
GRADUATES 280 206 36 197 42
POST GRADUATES 126 74 70 82 54
18-24 131 105 25 87 51
20-39 353 299 18 193 83
25-40 290 226 28 142 104
Male 527 459 15 324 63
Female 233 170 37 87 168
49

Around 70 % Eenadu readers belong to NCCS AB; around 43 % Sakshi readers from NCCS CDE in AP+TS
�Affluent reader pyramid construct for Eenadu
Eenadu vs Others AIR (‘000) : NCCS
50

More than 1 in every Eenadu reader belongs to NCCS A in AP+TS
18571780
1098
% AIR share of NCCS AEenadu AIR 51.79 lakhs
710
545
711
277234
NCCS A NCCS B
Eenadu Sakshi Andhra Jyothi Namasthe Telangana
36%
23%
27%
34%
Eenadu Sakshi Andhra Jyothi Namasthe Telangana
Eenadu Sakshi Andhra Jyothi Namasthe Telangana
51

Eenadu’s undisputed lead over competing Telugu and
English dailies-AP+TS
1857
3637
3205
Base: AP+TS
EENADU 3 TELUGU 3 ENGLISH
1366
442521
NCCS A NCCS AB
52

Eenadu’s unduplicated NCCS A readers compared to All
Telugu together in AP+TS
Un duplicated NCCS A readers
1857
1459
1717
Duplication with Telugu dailies 3,98,000
With English dailies 1,40,000
Base: AP+TS
Eenadu exclusive of telugu exclusive of english
Eenadu exclusive of telugu exclusive of english
53

Eenadu delivers 18% more unduplicated AB readers compared to all Telugu dailies
in AP+TS
76% of Eenadu readers are unduplicated NCCS AB readers
2776
234476%
Base: AP+TS
EENADU 3 TELUGU 3 ENGLISH
36373205
521
355
NCCS AB Unduplicated readers
54

In key urban occupation segments, Eenadu delivers more readers than all Telugu/English dailies
combined in AP+TS
214
Eenadu vs Others AIR (‘000) : Urban occupation
106
9194
128
74
98
Businessman/Industrialist Officer / Executive Self Employed Professional
Eenadu All competing Telugu dailies clubbed All completing English dailies clubbed
55

Around 85 % of NCCS A readers who can read English, read Eenadu and not any English daily-AP+TS
EenaduAny English daily
NCCS A + Read & Understand English
316
(22%)1003
(68%)
AIR figs in ‘000
149 (10 %)
56

69% of NCCS A Eenadu readers who are internet users, do not read any newspaper on
the net.Preference to physical copy of the paper
EENADU AIR SPLIT
31%
69%
Read newspaper on the internet
Do not read
newspaper
on the
internet
57 NCCS A+ use internet at least once a month-AP+TS

Eenadu reaches more affluent readers : higher number of house owners, English understanding TG
2466
Read and understand English
639
House ownership : own
1387
740
456
Eenadu Sakshi Andhra Jyothi Namasthe Telangana
3618
2185
1436
Namasthe Telangana Andhra Jyothi Sakshi Eenadu
58

Mobile phone ownership, mobile internet access higher among Eenadu readers-AP+TS
Eenadu Sakshi A.Jyoti N.Telangana
Mobile phone owned-Personal 4270 2591 1598 671
Own 2 handsets
196 115
Use Mobile for accessing Internet
3208 1991 1042 441
59

Higher number of internet users among Eenadu readers compared to competition in AP+TS
Internet frequency : Everyday: AIR (000)
2532
1516
711
352
Eenadu Sakshi Andhra Jyothi Namasthe Telangana
60

Eenadu readers active on social media/online shopping/video consumption
Internet activities in the last 1 month : AIR(000)
2107
2521
Eenadu Sakshi Andhra Jyothi Namasthe Telangana
932
1353
1655
441
647
795
260327 376
134
Social Networking Watching/Downloading TV prog/videos
Online Shopping
61

Domestic travel in the last 12 months
Eenadu delivers more readers with active lifestyle
1336
731
Eenadu Sakshi A.Jyoti N.Telangana
443
219
62

Holiday travel, physical activity, eating out, mall visits :
Eenadu delivers more readers with active lifestyle in AP+TS
Physical activity at least once a month : AIR (000)
2094
1447
Eenadu Sakshi Andhra Jyothi Namasthe Telangana
966
780 766 780
470550 536
419
573
219
374278
184 209
868
123116 123239
Exercise Or Do Physical Activity
Play Games Or Sports Go To A Cinema Hall To Watch A Movie
Go Out To A Restaurant
Visit Friends And Family
Visit Malls On The Weekend
63

Financial products ownership :
Eenadu delivers more financially savvy readers than competition in AP+TS
4608
2785
376
2313
164
1348
1750
80
836701
377
Bank Account Credit Card Debit card
Eenadu Sakshi Andhra Jyothi Namaste Telangana
64

Consumer durable ownership
3224
2889
1206
767 758
512 464
224 172
1617
1433
555
274 234172 136
72 67
1140
987
387
176485351
110 1040 0
Two Wheeler Refrigerator Washing Machine PC / Laptop AC Car/Jeep/Van Internet Connection
Tablet Microwave Oven
Eenadu Sakshi Andhra Jyothi Namasthe Telangana
65
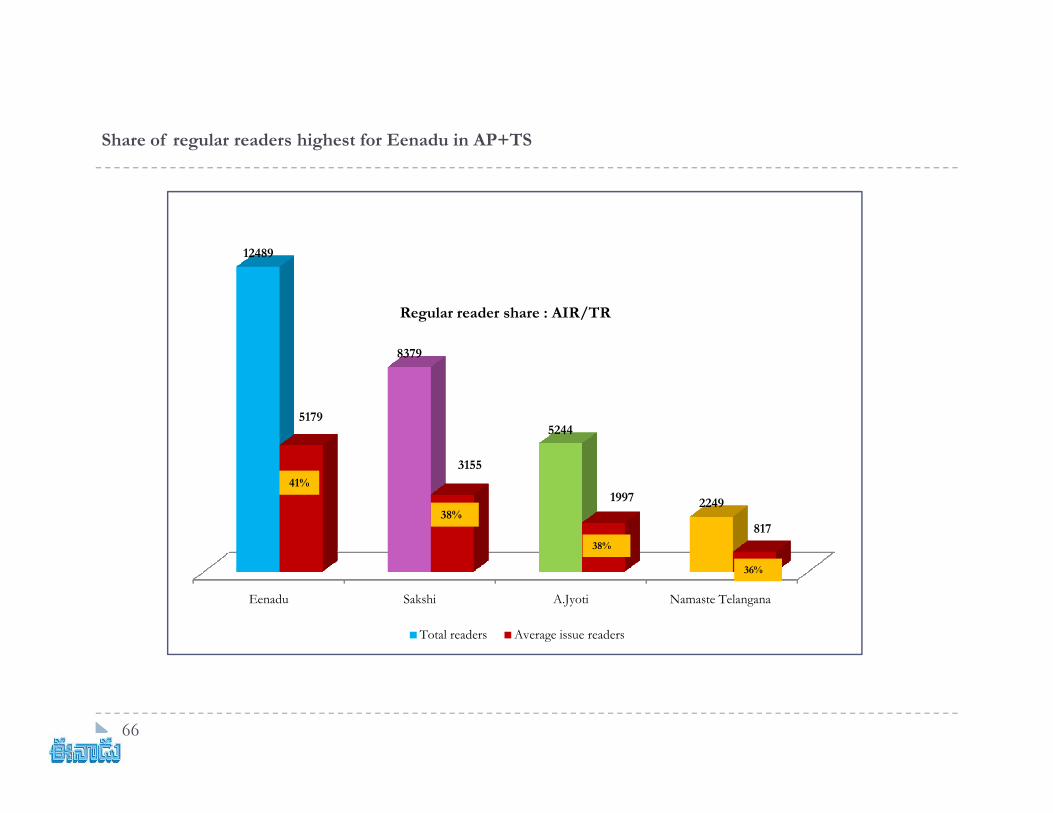
Share of regular readers highest for Eenadu in AP+TS
Regular reader share : AIR/TR
12489
8379
Eenadu Sakshi A.Jyoti Namaste Telangana
5244
2249
5179
3155
1997
817
Total readers Average issue readers
41%
38%
38%
36%
66

Source of publication : Paid for the copies in AP+TS
56%
45%
52%55%
Eenadu Sakshi Andhra Jyothi Namaste Telangana
67

1549
830
600
TS > 30 Mins Sundays/Holidays
Eenadu readers spend more time with the publication on Week days and Sundays
Compared to competitor publications in AP+TS
1137
641
465
TS >30 Mins Weekdays
Andhra JyothiAndhra Jyothi SakshiSakshi EenaduEenadu
68

Eenadu
Strengths and comparisons with competitors
Hyderabad

Hyderabad-Average Issue readership 2019 Q3
Eenadu leads more than 2 times the lead over no 2 daily
760
No 2 is only 46% of Eenadu readership
Eenadu Sakshi (Main) Andhra Jyothi Namasthe Telangana
Deccan Chronicle
The Hindu English (Main)
The Times Of India (Main)
346
157
194
263
111
159
70

Eenadu ’s reach is 46% more than all English combined-
Hyderabad
760
Eenadu alone All English combined
411
71

Eenadu Solus Readership -Hyderbad
631
643
AIR of Eenadu 7,60,000
Eenadu alone and not Sakshi
Eenadu alone and not Sakshi/AJ/NT
Eenadu alone and no other Telugu daily
Eenadu alone and not any English daily
555
548
72

69% of Eenadu readers are in NCCS A- Hyderabad
91% of Eenadu readers are in NCCS AB
526
336 327
692
465
376
Eenadu Hyd AIR: 7,60,000
EENADU 3 TELUGU 3 ENGLISH
336 327
NCCS A NCCS AB
73

48%48%
52% 52%52%
49%
51%
50%
Sh
are
of
an
y d
ail
y A
IR (
%)
Eenadu share of any daily AIR (Hyderabad)
Eenadu accounts for nearly 50% of overall daily readership in Hyderabad
All
Male
NC
CS
A
NC
CS
AB
20-3
9
Bu
sin
essm
an
/In
du
stri
ali
st/
SE
P/
Off
icer
/E
xec
uti
ve
Off
icer
/ E
xec
uti
ve
Wee
kly
in
tern
et u
ser
74

In Hyderabad, Eenadu delivers higher audience base than competing English dailies across key upmarket TG segments
Eenadu DC TOI TH
Working full time 379 138 92
NCCS A1 201 104
NCCS A 526 211 131 91
Own House 410 158 104Own House 410 158 104
Access Internet everyday 500 219 142 104
Access internet on the
mobile phone
572 231 146 107
Figs in 000s
75

Social networking, online shopping/banking, video/news consumption higher among Eenadu readers compared
to English daily readers in Hyderabad
Internet activities in the last 1 month
388
523
283 273 280
185219
114136
107 10680
185162 149
9889110
83 78
So
cial
Net
wo
rkin
g
Watc
hin
g/
Do
wn
load
ing
T
V
pro
g/
vid
eos
On
lin
e S
ho
pp
ing
On
lin
e B
an
kin
g A
nd
P
aym
ents
New
s
Eenadu The Times Of India Deccan Chronicle The Hindu English
76

Higher durable ownership among Eenadu readers compared to English daily readers in Hyderabad
620
438
357
625
440
285
357
219
127
241
197
148
216
118
164
78
144113 104
13910897
80 7494
76
AC Refrigerator Washing Machine PC / Laptop Two Wheeler Car/Jeep/Van LCD/LED/Plasma TV
Eenadu Deccan Chronicle The Times Of India The Hindu English
77

Summary
• Eenadu is the clear leader in Print Market with huge readership base that is 1.5 times
of the no.2 Telugu daily in APTS and 2times that of no.2 Telugu daily in Hyderabad
• Eenadu has a readership that is higher than all competing Telugu & English dailies
combined
• Eenadu - widely read among the all important millennial segment and among key
78
Eenadu - widely read among the all important millennial segment and among key
urban populace
• Eenadu reaches up market audience with high purchasing power across metros and
smaller towns also
• Affluent Reader Pyramid construct for Eenadu with 70% of the readers belonging to
NCCS AB

Summary
• Around 85% of NCCS A readers who can read and understand English prefer to read Eenadu
• Eenadu has 3.5 times more NCCS A readers with knowledge of English than all competing
English dailies together
• Eenadu delivers heavy internet users who prefer to shop online and spend time on social and
video
Eenadu has large number of readers with active lifestyle who are more evolved in adoption to new
79
• Eenadu has large number of readers with active lifestyle who are more evolved in adoption to new
technology and lead a higher standard of living
�• Opportunity for growth
Scope to strengthen lower pop strata
NCCS CDE,
tier 2, tier 3 towns
Rural audience
20-29 years of readership base

Eenadu’s lead in AP+TS:� Eenadu enjoys 50% readership across any daily/any Telugu daily
� 39% lead over competing telugu daily Sakshi
� 64% more readers than Sakshi
� 89% higher than Sakshi in Urban
Figs:000s
� 42% more than Sakshi in rural Ap+TS
� Eenadu leads across all Urban Metros and reporting units
� 24% more exclusive Urban readers than the 3 Telugu dailies combined(AJ/Sakshi/NT)
� 75% unduplicated readership(Solus) with the 3 dailies combined

Eenadu’s lead:
Eenadu has 54% more readership in Hyderabad than the competing Telugu daily
46% more readership than all English combined
Eenadu has 72% solus readership in Telugu readers( do not read any other telugudaily)
84% of Readers of Eenadu do not read any English daily in Hyderabad.
Figs:000s
69% of Eenadu readers are in NCCS A
91% of Eenadu readers are in NCCS AB in Hyderabad