
Irrational Delay Revisited: Examining Five Procrastination ...
35
Running head: EXAMINING FIVE PROCRASTINATION SCALES 1 Irrational Delay Revisited: Examining Five Procrastination Scales in a Global Sample Frode Svartdal Piers Steel UiT the Arctic University of Norway University of Calgary Contact information: F. Svartdal, Department of psychology, UiT the Arctic University of Norway, 9037 Tromsø, Norway. Email [email protected]
Transcript of Irrational Delay Revisited: Examining Five Procrastination ...

Running head: EXAMINING FIVE PROCRASTINATION SCALES 1
Irrational Delay Revisited:
Examining Five Procrastination Scales in a Global Sample
Frode Svartdal Piers Steel
UiT the Arctic University of Norway University of Calgary
Contact information: F. Svartdal, Department of psychology, UiT the Arctic University of
Norway, 9037 Tromsø, Norway. Email [email protected]

EXAMINING FIVE PROCRASTINATION SCALES 2
Abstract
Scales attempting to measure procrastination focus on different facets of the phenomenon, yet
they share a common understanding of procrastination as an unnecessary, unwanted, and
disadvantageous delay. The present paper examines in a global sample (N = 4,169) five different
procrastination scales – Decisional Procrastination Scale (DPS), Irrational Procrastination Scale
(IPS), Pure Procrastination Scale (PPS), Adult Inventory of Procrastination Scale (AIP), and
General Procrastination Scale (GPS), focusing on factor structures and item functioning using
Confirmatory Factor Analysis and Item Response Theory. The results indicated that The Pure
Procrastination Scale (PPS; 12 items selected from DPS, AIP, and GPS) measures different
facets of procrastination even better than the three scales it is based on. An even shorter version
of the PPS (5 items focusing on irrational delay), corresponds well to the 9-item Irrational
Procrastination Scale (IPS). Both scales demonstrate good psychometric properties and appear to
be superior measures of core procrastination attributes than alternative procrastination scales.
Keywords: Procrastination, procrastination scale, measurement, confirmatory factor analysis,
item response theory
EXAMINING FIVE PROCRASTINATION SCALES 3
Irrational Delay Revisited: Examining Five Procrastination Scales in a Global Sample
Measurement of self-reported procrastination in tests and questionnaires focuses on
different areas in which unnecessary delay expresses itself. As per Goal Phase Theory (Steel &
Weinhardt, 2017), aside from goal attainment itself, motivation can be broken down into a
decisional stage, a planning stage and a goal striving or implementation stage, with people
capable of procrastinating in each or all of them. Although these aspects of procrastination are
closely related, they may still be differentiated and are often measured by different instruments.
Thus, the Decisional Procrastination Scale (DPS, 5 items related to procrastination; Mann, 1982;
Mann et al, 1997) focuses on delay in planning and decision making, whereas general
procrastination scales such as the General Procrastination Scale (GPS; Lay, 1986) address
implemental or behavioral delay. McCown and Johnson’s Adult Inventory of Procrastination
Scale (AIP; McCrown, Johnson, & Petzel, 1989) completes this picture by including summary
items related to promptness, meeting deadlines, and timeliness.
To identify the core attributes of procrastination, Steel (2010) suggested two new
instruments. First is the Irrational Procrastination Scale (IPS), which consists of 9 items focusing
on implemental attributes of procrastination with an emphasis on “irrational” delay, “irrational”
referring to voluntary delay despite expecting it to be disadvantageous. Second is the Pure
Procrastination Scale (PPS, 12 items), which is based on items from existing and somewhat
diverse procrastination scales (i.e., the DPS, GPS, and AIP) selected after factor analyses of
responses from more than 4000 respondents. Exploratory and confirmatory factor analyses
indicated a three-factor solution for the items contained in the instruments, with the first factor
addressing habitual or problematic delay. This factor contained 14 items of which 12 of the
highest loading were selected for the PPS. All three established scales were represented in this

EXAMINING FIVE PROCRASTINATION SCALES 4
selection. In effect, the PPS is a mix of established scales measuring somewhat different aspects
of procrastination, but still loading high on a factor that addresses implemental delay.
Unsurprisingly, therefore, the PPS and IPS correlate highly, r = .87 (Steel, 2010).
Despite the similarity between the IPS and the PPS, examination of the items selected for
the PPS indicates a broader understanding of “delay” compared to the IPS. Table 1 shows the
items of both scales. Whereas the IPS items predominantly focus on implemental delay, the PPS
also includes items related to decisional delay and timeliness. Implicitly, the PPS therefore
assumes that decisional and behavioral delay, as well as delay in promptness and timeliness, are
closely related. This was not substantiated in the original article (Steel, 2010), neither was the
hypothesis that the PPS in fact measures a unidimensional construct related to problematic and
habitual delay.
<<Table 1 >>
Subsequent examinations of the PPS have obtained somewhat diverging results regarding
factor structure of this scale. For example, an assessment of a translated PPS for French-speaking
individuals (Rebetez, Rochat, Gay, & Van der Linden, 2014) indicated that the PPS should be
reduced to 11 instead of 12 items, the remaining items comprising a two-factor solution with
items 1-8 and items 9-11 loading on different constructs, “voluntary delay” and “observed
delay”. A Swedish study (Rozental et al., 2014) obtained a different two-factor solution for the
PPS, one factor being related to delaying decision making, not meeting deadlines, and missing
appointments (items 1–3 and 9–12), whereas the other was associated with starting late, lagging
behind, and wasting time (items 4-8). Neither of these suggestions addressed the fact that the
PPS consists of items from three established procrastination scales, each set of items tapping into
somewhat different aspects of problematic delay (e.g., decisional, implemental). Hence, Svartdal
EXAMINING FIVE PROCRASTINATION SCALES 5
et al. (2016), in a European study with 2893 student and employee participants from six
countries, examined the hypothesis that the PPS might measure multiple aspects. Confirmatory
factor analyses indicated poor fits for the two two-factor solutions discussed, as well as for a
one-factor solution implied by Steel (2010), but a good fit for a three-factor solution addressing
decisional delay (PPS items 1-3), implemental delay (items 4-8), and lateness/timeliness (items
9-12). The middle part of PPS (items 4-8) demonstrated considerable cross-national and
subgroup stability whereas the latter part (items 9-12) seemed to vary both between nations and
students vs. employees. This may indicate that the middle part of the PPS addresses core
properties of problematic procrastination whereas the latter part is more closely related to
procrastination in a cultural and situational context.
As for the IPS, this scale attempts to measure a single construct, “irrational delay” (Steel,
2010). Research has subsequently confirmed this (e.g., Svartdal et al., 2016), although the three
reversed items of the scale (items 2, 6, and 9) seem to measure the construct somewhat less
optimally compared to the others and have even been suggested to load on a different factor
(Rozental et al., 2014).
The remaining procrastination scales discussed in this paper, DPS, AIP, and GPS, have
all been widely used, but surprisingly few studies have assessed their psychometric properties.
For example, Lay (1986) proposed the GPS as a scale measuring a unidimensional construct
procrastination, but few studies have examined this scale psychometrically using confirmatory
factor analysis (CFA). One study (Argiropoulou & Ferrari, 2015) using a Greek sample
suggested, in contrast to the original ambition about unidimensionality, a two-factor solution
(i.e., delay and procrastination domains). A German study, testing the student version of the
GPS, could not confirm an one-factorial structure and instead proposed a reduced version – GPS-

EXAMINING FIVE PROCRASTINATION SCALES 6
K – consisting of items 1, 2, 7, 12, 14, 15, 18, 19, and 20 (Klingsieck & Fries, 2012). These
items (except items 2 and 14) are identical in the general version of GPS. As for the AIP, this
scale originally hypothesized a single latent construct, procrastination. Very few studies have
examined the AIP using CFA, an exception being Mariani and Ferrari (2012), reporting support
for a single-factor latent model in an Italian sample. Finally, the DPS (a subset of 31/22 items in
the Flinders/Melbourne decision-making questionnaire; Mann et al., 1997) measures decisional
procrastination. Mann et al. (1997) found that the procrastination subscale demonstrated good fit
within the revised Melbourne decision-making model. Little is known regarding the factor
structure of this subscale per se, but Mariani and Ferrari (2012) reported support for a
unidimensional factor solution in an Italian sample.
<< Table 2 >>
When comparing the various scales, it should be remembered that whereas the DPS
intended to measure decisional delay, the AIP and GPS are general procrastination scales
measuring a unidimensional latent construct, procrastination, in the much same way as intended
by the PPS and IPS. However, as is seen in Table 2, the various scales contain both decisional or
implemental procrastination items, as well as items related to lateness/timeliness, somewhat
sporadically. Evaluating the scale items at face value, the GPS and IPS both have their focus on
implemental delay, whereas most AIP items address timeliness and lateness. The PPS, being
composed of items from DPS, GPS, and AIP, thus appears to be a hybrid scale with a broad
focus not matched by any of the other scales. Also note that both the AIP (20 items) and GPS (15
items) are relatively comprehensive instruments. Because procrastination scales are often
administered with scales measuring other constructs, shorter instruments with comparable or
EXAMINING FIVE PROCRASTINATION SCALES 7
even better psychometric qualities compared to the full scales contribute to overall reduction of
survey length and should be used if possible (Rogelberg & Stanton, 2007; Stanton et al. 2002).
The present study
The present paper examines the PPS and IPS, as well as the complete DPS, AIP, and GPS
instruments in a global data set with 4,169 participants. Using Confirmatory Factor Analyses
(CFI) and Item Response Theory (IRT), we compare the different scales, examine their factor
structures, and suggest simplified scales to measure procrastination. We also assess measurement
invariance over gender and age, internal reliability, as well as correlations between the
instruments.
The first purpose of the present study was to examine the possibility that the PPS
addresses three rather different facets of procrastination (Svartdal et al., 2016), and that the
middle 5 items of the PPS correspond to IPS in measuring “irrational” delay. As the GPS seems
to measure this construct also, the full GPS as well as reduced versions were examined. Lay
(1986) hypothesized the GPS to measure a unidimensional construct, but as mentioned,
subsequent studies have not supported this assumption and have instead suggested different
factor structures (Argiropoulou & Ferrari, 2015) or a reduced version (Klingsieck & Fries, 2012).
We examine these possibilities, the latter being particularly interesting because the five
implemental items of the PPS (4-8) are in fact GPS items. Thus, the possibility that the GPS
could be reduced to five items is tested. Finally, the DPS and AIP were also examined. Recall
from Table 2 that the DPS focuses on decisional procrastination, whereas the AIP contains
several items that focus on timeliness and lateness. As the PPS includes items from both these
scales, we ask how these PPS items perform compared to the full scales. In effect, we pursue the

EXAMINING FIVE PROCRASTINATION SCALES 8
possibility that the DPS and AIP could be reduced to fewer items, likely corresponding the PPS
items, and in consequence that the PPS could replace the DPS, AIP and the GPS scales.
Method
Sample
The sample consisted of 4169 respondents (57.4 % women) completing an online survey.
Mean age was 37.4 years, the most frequent age group being 20-30 years (1200 respondents).
Most participants were located in the USA (68.1 %), 5.9 % in Canada, 4.4 % in the UK, 2.4 % in
Australia, 1.6 % in Italy, with the rest distributed among a large number of countries worldwide
with 1-40 respondents/country. Respondents were recruited to participate in a study on regret
when visiting a procrastination-themed website.
Material and procedure
All respondents answered a questionnaire consisting of standard demographic questions
followed by items from the complete DPS, GPS, AIP, and IPS scales. The DPS (Mann, 1982;
Mann et al., 1997) contains 5 items that primarily focuses on delay in planning and decision
making, e.g., “I waste a lot of time on trivial matters before getting to the final decisions,”
though has one item related to implementation, “Even after I make a decision I delay acting upon
it” (DPS 2). Internal reliability for the DPS is relatively high, alpha = .70 - .83 (Mariani &
Ferrari, 2012). The GPS (Lay, 1986) encompasses 20 items focusing primarily on implemental
delay, e.g., “Even jobs that require little else except sitting down and doing them, I find that they
seldom get done for days” (GPS 7). Two versions of the GPS exist, a general version and a
version adapted for students specifically. The general version was used here. It has a good
internal consistency, alpha = .86 (Lay, 1986). The AIP (McCown et al., 1989) contains a mix of
items addressing decisional and implemental delay, as well as lateness (see Table 2). Test-retest
EXAMINING FIVE PROCRASTINATION SCALES 9
reliability of this scale is relatively high, r = .71, as is internal consistency, alpha = .86 (McCown
et al., 1995). The IPS (Steel, 2010) is a 9-item scale focusing on implemental delay, e.g., “I delay
tasks beyond what is reasonable” (IPS 7). The IPS demonstrates good internal reliability, alpha =
.91 (Steel, 2010). Of note, the PPS was not included as a separate scale, as this scale is composed
of 12 items from the DPS, GPS, and AIP. Steel (2010) reported internal consistency of the PPS
at alpha = .92. For discriminant validity purposes, respondents answered the five-item
Satisfaction with Life Scale (SWLS; Diener et al., 1985). All items were answered on a common
1-5 scale, 1 = “Very seldom or not true of me,” 5 = “Very often true, or true with me.” All
answered a total of 159 items. First, respondents answered the demographic questions, then the
procrastination scales of the present study and finally the SWLS. Items were presented in fixed
order, one scale at a time.
Ethics
Participation was voluntary, anonymous, and confidential. Participants read a consent
form describing the nature and purpose of the study and then provided written informed consent
before responding. No payment was provided. The project of which this study was a part
received ethics approval from the Conjoint Faculties Research Ethics Board (CFREB) at the
University of Calgary.
Statistical analyses
The item scores were first examined for skewness and kurtosis. Then multivariate
normality was assessed for all scales, in particular multivariate kurtosis, which is important to
parameter estimation in CFA (Byrne, 2008). Non-normality was apparent in each scale according
to the Mardia skewness and kurtosis tests. Hence, we report the Satorra-Bentler scaled chi-square
statistic which is robust to multivariate nonnormality (Satorra & Bentler, 2001). Configural fits

EXAMINING FIVE PROCRASTINATION SCALES 10
to the suggested models were evaluated in CFA according to the root mean square error of
approximation (RMSEA), the Bentler comparative fit index (CFI), and the standardized root
mean square residual (SRMR) (Byrne, 2001). Acceptable goodness of fit adopted the standard
criteria of RMSEA < .08, CFI values in the .90 to 1.00 range, and SRMR < .08 (Brown, 2015;
Kline, 2016). After having established acceptable configural baseline models for the PPS and
IPS, those models were tested for measurement invariance over gender and age groups, using
standard procedures to test for configural, metric, and scalar invariance (Brown, 2015; Byrne,
2001; Gregorich, 2006). Scales reflecting a single latent construct were also analyzed by IRT
using the graded response model (GRM), focusing on parameter a (discrimination) and the
difficulty parameter (e.g., Fraley, Waller, & Brennan, 2000). CFAs and IRTs were performed
using the SEM and IRT modules in STATA 14.2 (www.stata.com).
Results and discussion
PPS factor structure
As discussed, four different factor models have been suggested for the PPS. These are
shown in Table 3 along with the CFA fit indices for the present data. As is seen in the table, the
three-factor model for the PPS – items 1-3 measuring decisional procrastination, items 4-8
measuring implemental delay, items 9-12 measuring timeliness and promptness – was superior to
the other suggested models. As the one-factor model and the suggested three-factor models are
nested, a ∆ Chi squared comparison between these models indicates whether one model
demonstrates a better fit (Brown, 2015). This difference was significant, ∆ Chi squared =
2062.85, ∆ df = 3, p < .001. Also, the ∆ CFI between these models was .07, well above the .01
criterion suggested by Cheung and Rensvold (2002).
<< Table 3 >>

EXAMINING FIVE PROCRASTINATION SCALES 11
An examination of modification indices of the three-factor solution indicated a path to be
added between the PPS factor timeliness/delay and PPS item 1. This connection is reasonable
because this item explicitly addresses timeliness/lateness (“I delay making decisions until it’s too
late”). Adding this path improved fit, RMSEA .065, CFI = .968, SRMS = .029.1 In the next
iteration of modification indices analysis, a path from PPS factor implemental delay and item 9
was suggested. This item (“I find myself running out of time”) has previously been argued to be
conflated with the busyness construct and not procrastination per se (Steel, 2010; Svartdal et al.,
2016) and recommended for deletion from procrastination scales. Deleting it improved overall
fit, RMSEA .062, CFI = .974, SRMS = .028. In the final iteration, modification indices indicated
a path from PPS factor implemental delay and PPS item 3 (“I waste a lot of time on trivial
matters before getting to the final decisions”), improving fit even more, RMSEA .043, CFI =
.989, SRMS = .015. In this model, shown in Figure 1, correlations between PPS factors were all
< .75, indicating discriminant validity. As a more formal test of discriminant validity, we
compared the squared correlations (SC) between factors with the average variance extracted
(AVE) by the latent variables (Brown, 2015). All AVE values were higher than the SC values,
indicating discriminant validity, and all AVE values were higher than .05, indicating convergent
validity.
<< Figure 1 >>
Addressing the PPS parts specifically, PPS items 4-8 should measure implemental delay
satisfactorily. A CFA of these items indicated good fit, RMSEA = .064 (.053), CFI = .991 (.992),
SRMR = .016. Regarding the IRT analysis of this construct, parameter a coefficients were > 2
1 The Satorra-Bentler scales estimates are not available when performing modification analyses
in Stata 14.2.
EXAMINING FIVE PROCRASTINATION SCALES 12
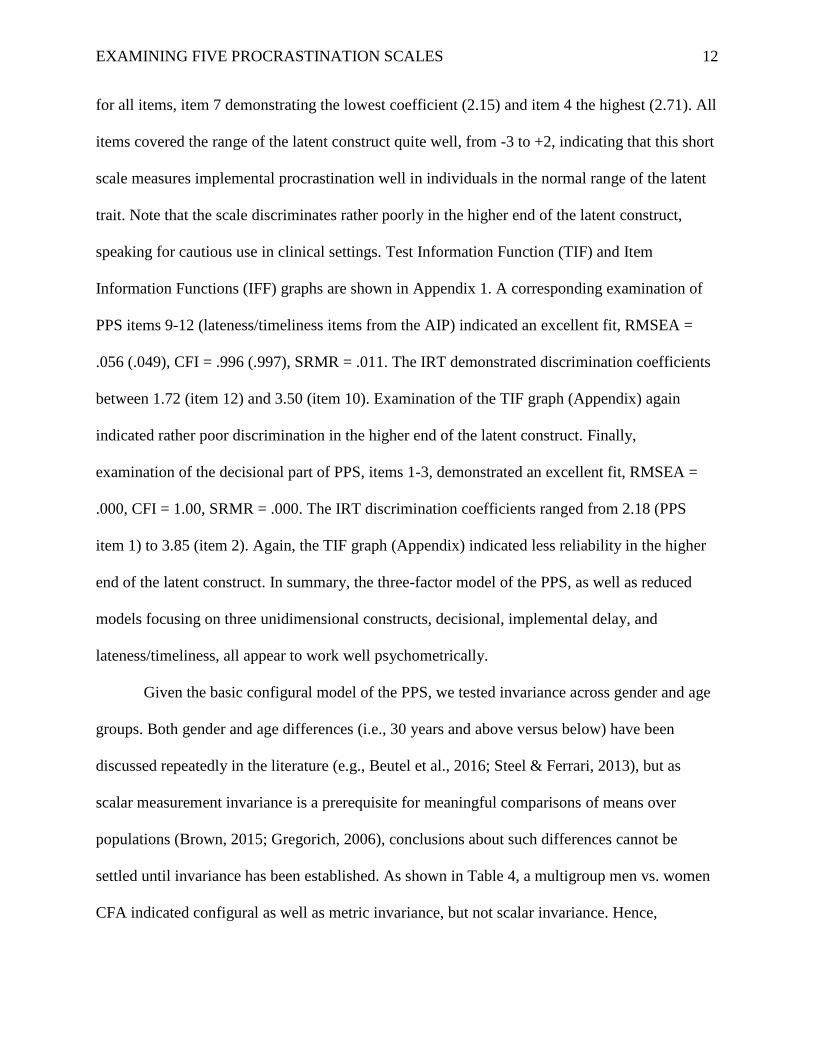
for all items, item 7 demonstrating the lowest coefficient (2.15) and item 4 the highest (2.71). All
items covered the range of the latent construct quite well, from -3 to +2, indicating that this short
scale measures implemental procrastination well in individuals in the normal range of the latent
trait. Note that the scale discriminates rather poorly in the higher end of the latent construct,
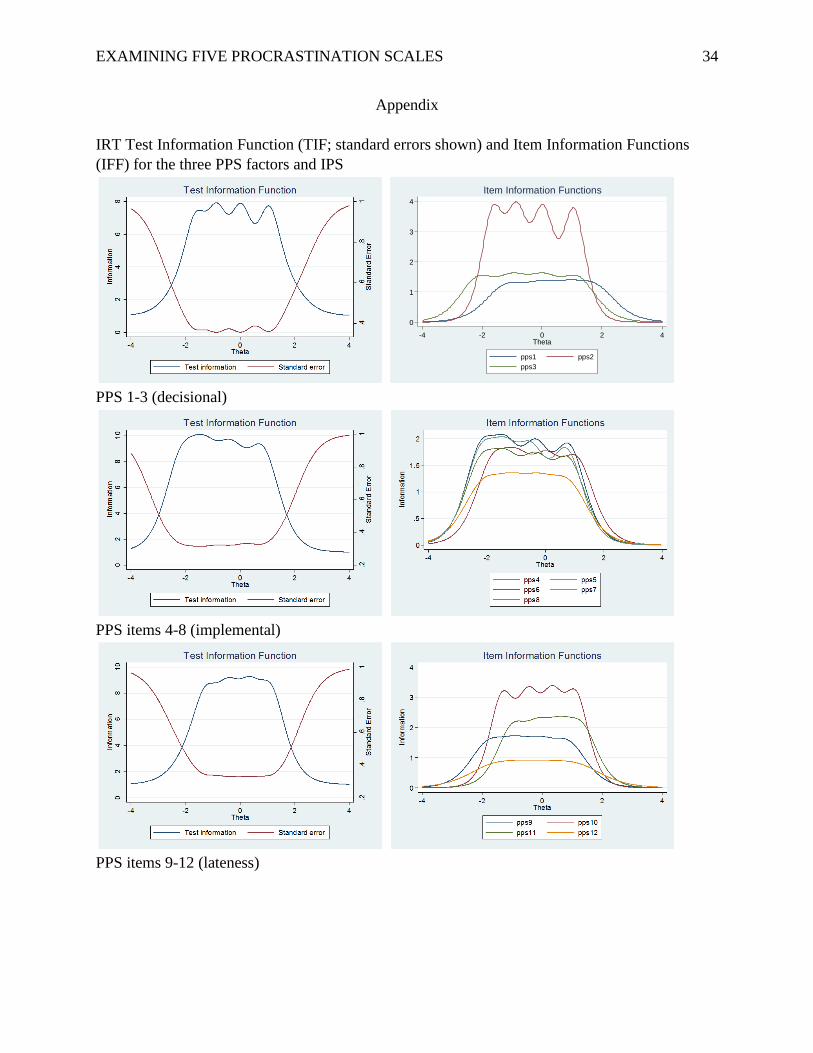
speaking for cautious use in clinical settings. Test Information Function (TIF) and Item
Information Functions (IFF) graphs are shown in Appendix 1. A corresponding examination of
PPS items 9-12 (lateness/timeliness items from the AIP) indicated an excellent fit, RMSEA =
.056 (.049), CFI = .996 (.997), SRMR = .011. The IRT demonstrated discrimination coefficients
between 1.72 (item 12) and 3.50 (item 10). Examination of the TIF graph (Appendix) again
indicated rather poor discrimination in the higher end of the latent construct. Finally,
examination of the decisional part of PPS, items 1-3, demonstrated an excellent fit, RMSEA =
.000, CFI = 1.00, SRMR = .000. The IRT discrimination coefficients ranged from 2.18 (PPS
item 1) to 3.85 (item 2). Again, the TIF graph (Appendix) indicated less reliability in the higher
end of the latent construct. In summary, the three-factor model of the PPS, as well as reduced
models focusing on three unidimensional constructs, decisional, implemental delay, and
lateness/timeliness, all appear to work well psychometrically.
Given the basic configural model of the PPS, we tested invariance across gender and age
groups. Both gender and age differences (i.e., 30 years and above versus below) have been
discussed repeatedly in the literature (e.g., Beutel et al., 2016; Steel & Ferrari, 2013), but as
scalar measurement invariance is a prerequisite for meaningful comparisons of means over
populations (Brown, 2015; Gregorich, 2006), conclusions about such differences cannot be
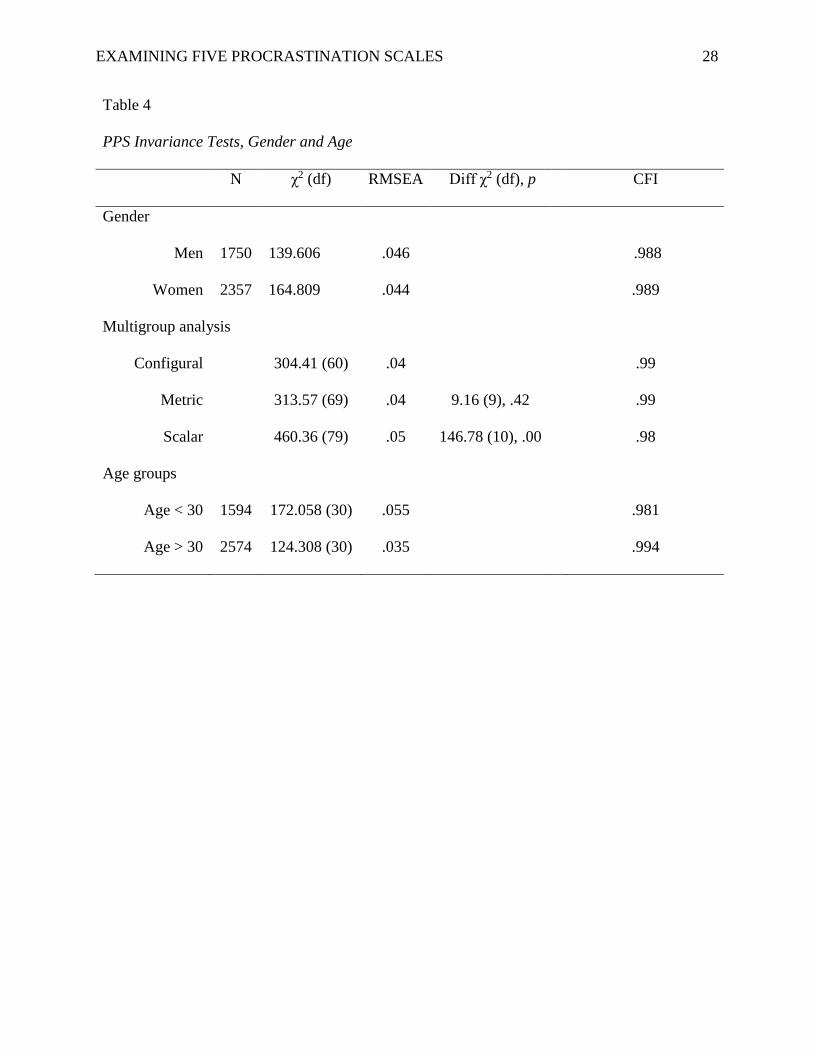
settled until invariance has been established. As shown in Table 4, a multigroup men vs. women
CFA indicated configural as well as metric invariance, but not scalar invariance. Hence,

EXAMINING FIVE PROCRASTINATION SCALES 13
comparisons of PPS means with gender is problematic. Also note that configural fit was
improved for participants > 30 years of age. The results further indicated that gender differences
appeared in the decisional and lateness parts of the PPS (z = -3.65 and -6.58, p < .000), but not in
the implemental part (z = -.28, p = .777). Hence, invariance tests of PPS items 4-8 demonstrated
a similar pattern to that of the complete PPS, with the important exception that scalar
equivalence was now observed for the age group > 30 (see Table 5). In summary, the PPS results
indicate that the complete scale does not attain full invariance across gender, and furthermore the
model fit was better for participants greater than 30 years of age. For the reduced PPS (items 4-8,
i.e., the implemental part), gender differences were minimal and these items also demonstrated
full measurement invariance for participants over 30 years, indicating that this part of the scale
permits comparisons of means scores for adults.
<< Table 4 >>
<< Table 5 >>
IPS factor structure
The IPS is hypothesized to measure a single construct, “irrational delay,” and the present
data indicates that it does, RMSEA = .075 (.066), CFI = .971 (.973), SRMR = .032. In
accordance with prior findings (Svartdal et al., 2016), modification indices indicated that the
reversed items should be correlated. This resulted in an improved fit, RMSEA = .058, CFI =
.984, SRMR = .019. Omitting the reversed items improved fit slightly. These analyses thus
support the hypothesis that the IPS confirms to a single latent construct, implemental or irrational
delay. Omitting the reversed items improves fit indices and provides an instrument that is more
easily administered and scored. Supporting this, the IRT indicated good parameter a
(discrimination) coefficients for all procrastination-consistent items (range 2.24 - 3.14), item 4
EXAMINING FIVE PROCRASTINATION SCALES 14
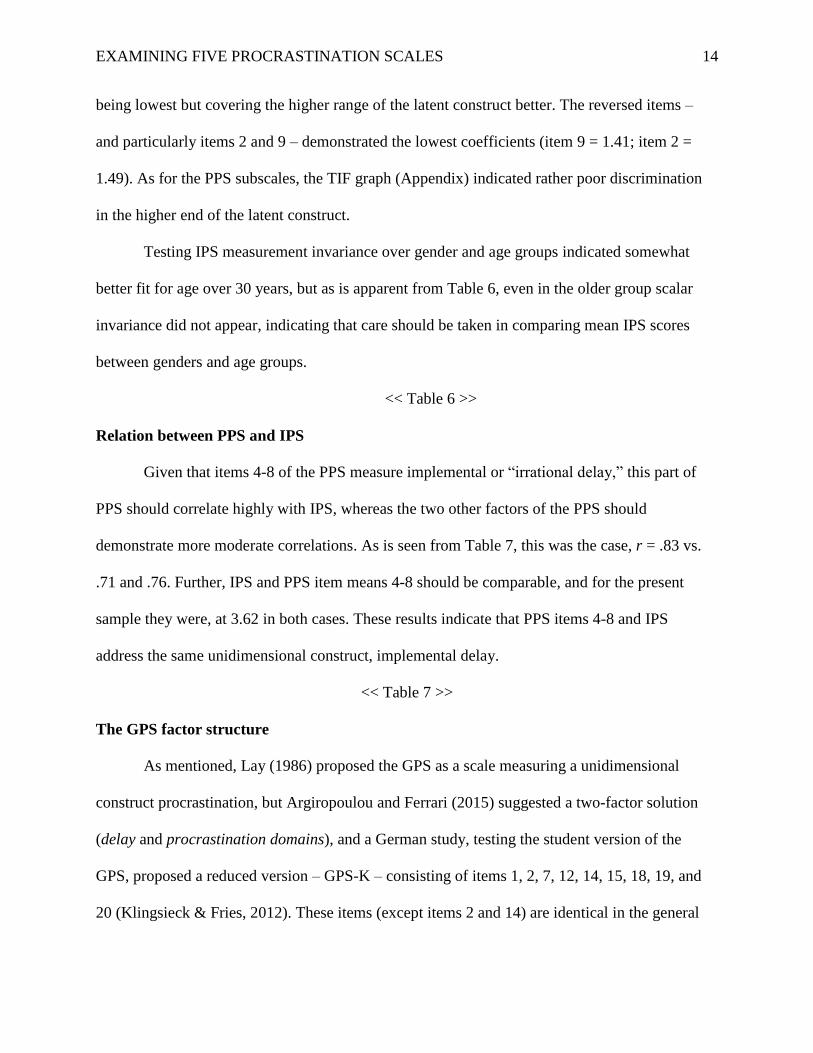
being lowest but covering the higher range of the latent construct better. The reversed items –
and particularly items 2 and 9 – demonstrated the lowest coefficients (item 9 = 1.41; item 2 =
1.49). As for the PPS subscales, the TIF graph (Appendix) indicated rather poor discrimination
in the higher end of the latent construct.
Testing IPS measurement invariance over gender and age groups indicated somewhat
better fit for age over 30 years, but as is apparent from Table 6, even in the older group scalar
invariance did not appear, indicating that care should be taken in comparing mean IPS scores
between genders and age groups.
<< Table 6 >>
Relation between PPS and IPS
Given that items 4-8 of the PPS measure implemental or “irrational delay,” this part of
PPS should correlate highly with IPS, whereas the two other factors of the PPS should
demonstrate more moderate correlations. As is seen from Table 7, this was the case, r = .83 vs.
.71 and .76. Further, IPS and PPS item means 4-8 should be comparable, and for the present
sample they were, at 3.62 in both cases. These results indicate that PPS items 4-8 and IPS
address the same unidimensional construct, implemental delay.
<< Table 7 >>
The GPS factor structure
As mentioned, Lay (1986) proposed the GPS as a scale measuring a unidimensional
construct procrastination, but Argiropoulou and Ferrari (2015) suggested a two-factor solution
(delay and procrastination domains), and a German study, testing the student version of the
GPS, proposed a reduced version – GPS-K – consisting of items 1, 2, 7, 12, 14, 15, 18, 19, and
20 (Klingsieck & Fries, 2012). These items (except items 2 and 14) are identical in the general

EXAMINING FIVE PROCRASTINATION SCALES 15
version of GPS. In the present study, the one-factor model for the complete GPS did not
demonstrate a good fit, RMSEA = .088, CFI = .824, SRMS = .058; the two-factor model
indicated somewhat better fit, RMSEA = .070 (.064), CFI = .89 (.89), SRMS = .058. In both
cases, however, the CFI criterion was not acceptable. The German reduced model, excluding
items 2 and 14, indicated a somewhat better fit, although not acceptable, RMSEA = .088 (.076),
CFI = .96 (.97), SRMS = .031.
AIP factor structure
As the other general procrastination scales discussed, the AIP is hypothesized to measure
a single latent construct, procrastination, and Mariani and Ferrari (2012) reported support for a
single-factor latent model in an Italian sample. The present data did not indicate a good fit for
this model, RMSEA = .135, CFI = .761, SRMS = .076. Mariani and Ferrari (2012) reported an
even better fit when errors of items 13, 4, 7, and 8 were allowed to correlate. This is theoretically
reasonable, as these items concern things to do before a deadline. Again, this model did not
improve fit indices in the present data. Thus, the present data did not support either of the
suggested factor solutions for the AIP. Analysis of individual items indicates that the AIP
focuses on rather different aspects of procrastination (see Table 2), which in part may explain
why this scale did not do well in the CFA analyses.
DPS factor structure
The DPS demonstrated a poor fit for a one-factor solution, RMSEA = .259, CFI = .916,
SRMS = .076. Modification indices suggested correlations between errors for items 4 and 5 (two
items with quite similar wording), and then between items 1 and 2. This model indicated an
excellent fit, RMSEA = .017, CFI = 1.000, SRMS = .002.
Relation between the scales
EXAMINING FIVE PROCRASTINATION SCALES 16
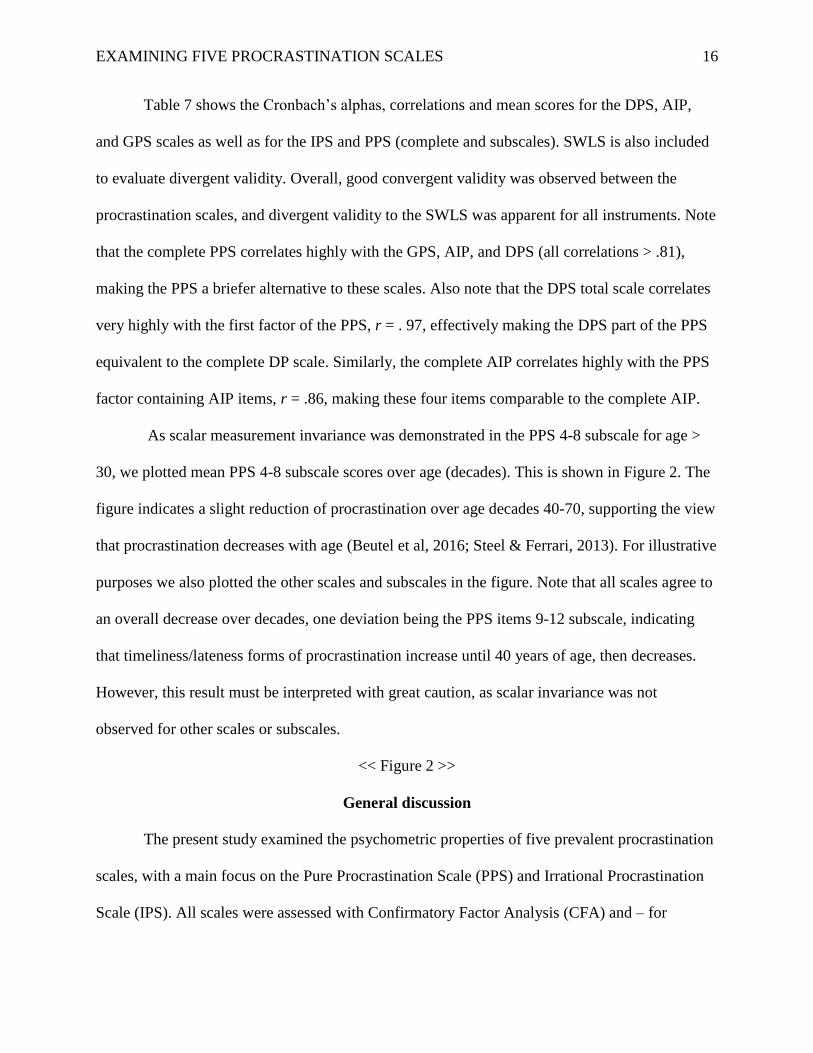
Table 7 shows the Cronbach’s alphas, correlations and mean scores for the DPS, AIP,
and GPS scales as well as for the IPS and PPS (complete and subscales). SWLS is also included
to evaluate divergent validity. Overall, good convergent validity was observed between the
procrastination scales, and divergent validity to the SWLS was apparent for all instruments. Note
that the complete PPS correlates highly with the GPS, AIP, and DPS (all correlations > .81),
making the PPS a briefer alternative to these scales. Also note that the DPS total scale correlates
very highly with the first factor of the PPS, r = . 97, effectively making the DPS part of the PPS
equivalent to the complete DP scale. Similarly, the complete AIP correlates highly with the PPS
factor containing AIP items, r = .86, making these four items comparable to the complete AIP.
As scalar measurement invariance was demonstrated in the PPS 4-8 subscale for age >
30, we plotted mean PPS 4-8 subscale scores over age (decades). This is shown in Figure 2. The
figure indicates a slight reduction of procrastination over age decades 40-70, supporting the view
that procrastination decreases with age (Beutel et al, 2016; Steel & Ferrari, 2013). For illustrative
purposes we also plotted the other scales and subscales in the figure. Note that all scales agree to
an overall decrease over decades, one deviation being the PPS items 9-12 subscale, indicating
that timeliness/lateness forms of procrastination increase until 40 years of age, then decreases.
However, this result must be interpreted with great caution, as scalar invariance was not
observed for other scales or subscales.
<< Figure 2 >>
General discussion
The present study examined the psychometric properties of five prevalent procrastination
scales, with a main focus on the Pure Procrastination Scale (PPS) and Irrational Procrastination
Scale (IPS). All scales were assessed with Confirmatory Factor Analysis (CFA) and – for

EXAMINING FIVE PROCRASTINATION SCALES 17
scales/subscales measuring one-dimensional constructs – also with Item Response Theory (IRT).
For the PPS, the results indicated that this scale conforms to a three-factor solution
corresponding to the three different scales the PPS is based on, measuring decisional
procrastination, delay in implementation, and timeliness/lateness. The three PPS subscales
enable this scale to measure three facets of procrastination in much the same way with 12 items
as is achieved by three separate scales with 39 items. This is a substantial practical advantage as
well as a psychometrically sounder solution, as the reduced set of items selected for the PPS
were shown to demonstrate better CFA fit indices compared to the full set of items of the
individual DPS, GPS, and AIP scales.
Simply collapsing the 12 PPS items into one score implies a potential loss of information.
Thus, the first part of the PPS, measuring decisional procrastination, correlated very highly with
the full DP scale, and the last part of PPS, measuring timeliness/lateness, correlated very highly
with the complete AIP scale. Importantly, the implemental part of the PPS (items 4-8; PPSimpl)
appears to measure irrational delay in much the same way as does the IPS, and thus represents an
even “purer” version of the Pure Procrastination Scale in measuring irrational delay.
Additionally, this part of PPS also correlates very highly with the complete GPS, suggesting that
this 20-item scale might be reduced to a five-item scale without loss of information. Collapsing
the three facets of the PPS into one score also masks the substantial mean differences in scores
between the implemental part of PPS (items 4-8) and the two other facets, the former being
consistently higher compared to the two others (see Figure 2). Finally, the lateness part of PPS
(items 9-12) may be more sensitive to cultural differences compared to the two other facets
(Svartdal et al., 2016) and also appears to relate to age differences differently from all the other
scales/subscales examined in this study.

EXAMINING FIVE PROCRASTINATION SCALES 18
The IPS conforms to a one-factor solution, the construct measured being very similar to
the implemental part of the PPS. The IPS includes three reversed items. In agreement with prior
findings (Rozental et al., 2014; Svartdal et al. 2016), the analyses indicate that these items can be
deleted from the scale without significant loss of information.
The two scales demonstrating acceptable fits to suggested factor structures, PPS and IPS,
were examined for measurement invariance across gender and age (i.e., above and below 30
years of age). Neither of these scales demonstrated full scalar invariance. As scalar invariance is
required for meaningful comparisons between population means, gender and age differences
cannot be assessed unless a given instrument is demonstrated to satisfy measurement invariance
requirements. However, note that the implemental part of the PPS (items 4-8) seems to perform
better compared to items related to decisional procrastination (items 1-3) and timeliness/lateness
(items 9-12), and full scalar invariance for the PPSimpl was observed for participants greater than
30 years.
The present results are based on answers from many nations, albeit with English as a
common language. Hence, we cannot unambiguously assess cultural or national differences. We
believe, however, that the present results, especially regarding the PPS and IPS, are quite robust.
Thus, the conclusions from the present paper regarding PPS and IPS factor structures are very
similar to prior findings in a comparison of these scales in Finland, Germany, Italy, Norway,
Poland, and Sweden (Svartdal et al. 2016), and the suggested PPSimpl subscale (items 4-8)
conforms well to recent findings in a German representative community study (Klein et al.,
2017). That study proposed a shortened version of the GPS-K (Klingsieck & Fries, 2012)
consisting of five items. These items are identical to the PPSimpl items proposed in this paper
except that the German version, being based on the student version of the GPS, uses the item “I

EXAMINING FIVE PROCRASTINATION SCALES 19
do not do assignments until just before they are to be handed in” (GPS – student, item 2) rather
than “In preparing for some deadline, I often waste time by doing other things” (GPS item 12;
PPS item 4; see Table 1). In the present study, the latter item demonstrated excellent item
properties (see Appendix) and appears to be more appropriate as an item measuring
procrastination in the general population. However, future studies should examine these scales,
both in item-level analyses and in cross-cultural comparisons. At present, the implemental part of
the PPS and the IPS seem to be the best available candidates for assessing procrastination over
different languages and cultures.
The scales examined in this study all differentiate procrastination well for low and
medium ranges of the construct, but appear to measure less reliably in the higher end of the
construct. This implies that measurement of high levels of procrastination, for example in
clinical cases, is error prone. Hence, assessment of procrastination in clinical settings should be
supplemented by other measures (e.g., depression and anxiety) to ensure sufficient validity and
reliability. Another issue of importance for future research is to establish more objective and
reliable measures that can supplement or even replace self-report measures (Gröpel & Steel,
2008). This is complicated by procrastination having an inherent subjective component as delays
are only irrational if they are inconsistent with a person’s internal preferences. What may be a
procrastination for one might easily not be for another. Still, the delay in implemental
procrastination can be observed and at times this may be less ambiguously connected to
procrastination (e.g., seeking treatment for a dire medical condition). This should help identify
those who delay somewhat trivially, but judge themselves harshly. Such people would be best
described as perfectionists rather than procrastinators, which has a different etiology and
treatment recommendations (Steel & Klingsieck, 2016).

EXAMINING FIVE PROCRASTINATION SCALES 20

EXAMINING FIVE PROCRASTINATION SCALES 21
References
Argiropoulou, M. I., & Ferrari, J. R. (2015). Chronic procrastination among emerging
adults:Factor structure of the Greek version of the General Procrastination Scale. Hellenic
Journal of Psychology, 12, 85-104.
Beutel, M. E., Klein, E. M., Aufenanger, S., Brähler, E., Dreier, M., Müller, K. W., ... &
Wölfling, K. (2016). Procrastination, distress and life satisfaction across the age range–a
german representative community study. PloS one, 11(2), e0148054.
Brown, T. A. (2015). Confirmatory factor analysis for applied research. Second Ed. N.Y.: The
Guilford Press.
Byrne, B. M. (2001). Structural equation modeling with AMOS, EQS, and LISREL:
Comparative approaches to testing for the factorial validity of a measuring instrument.
International Journal of Testing, 1(1), 55-86. doi:10.1207/S15327574IJT0101_4
Byrne, B. M. (2008). Testing for multigroup equivalence of a measuring instrument: A walk
through the process. Psicothema, 20(4), 872-882.
Cheung, G.W. & Rensvold, R.B. (2002). Evaluating Goodness-of-Fit Indexes for Testing
Measure-ment Invariance. Structural Equation Modeling, 9(2), 233-255.
Diener, E., Emmons, R. A., Larsen, R. J., & Griffin, S. (1985). The Satisfaction With Life Scale.
J Pers Assess, 49(1), 71-75. doi:10.1207/s15327752jpa4901_13
Ferrari, J. R. (1992). Psychometric evaluation of two procrastination inventories for adults:
Arousal and avoidance measures. Journal of Psychopathology and Behavioral
Assessment, 14(2), 97-110.

EXAMINING FIVE PROCRASTINATION SCALES 22
Ferrari, J. R., O'Callaghan, J., & Newbegin, I. (2005). Prevalence of Procrastination in the
United States, United Kingdom, and Australia: Arousal and Avoidance Delays among
Adults. North American Journal of Psychology, 7(1).
Fraley, R. C., Waller, N. G., & Brennan, K. A. (2000). An item response theory analysis of self-
report measures of adult attachment. Journal of Personality and Social Psychology,
78(2), 350.
Gregorich, S. E. (2006). Do self-report instruments allow meaningful comparisons across diverse
population groups? Testing measurement invariance using the confirmatory factor
analysis framework. Medical Care, 44(11 Suppl 3), S78.
doi: 10.1097/01.mlr.0000245454.12228.8f
Gröpel, P., & Steel, P. (2008). A mega-trial investigation of goal setting, interest enhancement,
and energy on procrastination. Personality and Individual Differences, 45(5), 406-411.
Klein, . E. M., Beutel, M. E., Müller, K. Wölfling, K., Brähler, E,, & Zenger, M. (2017).
Assessing procrastination. Dimensionality and factorial invariance across sex and age of
the short form of the General Procrastination Scale (GPS-K) in a representative German
community sample, European Journal of Psychological Assessment, in press.
Kline, R. B. (2016). Principles and practice of structural equation modeling. 4th Ed. N.Y.: The
Guilford Press.
Klingsieck, K. B., & Fries, S. (2012). Allgemeine prokrastination. Diagnostica, 58, 182-193.
DOI: http://dx.doi.org/10.1026/0012-1924/a000060
Steel, P., & Klingsieck, K. B. (2016). Academic procrastination: Psychological antecedents
revisited. Australian Psychologist, 51(1), 36-46.

EXAMINING FIVE PROCRASTINATION SCALES 23
Lay, C. H. (1986). At last, my research article on procrastination. Journal of Research in
Personality, 20(4), 474-495. doi:10.1016/0092-6566(86)90127-3
Mann, L. (1982). Decision-making questionnaire. Unpublished manuscript. Flinders University
of South Australia, Adelaide, Australia.
Mann, L., Burnett, P., Radford, M., & Ford, S. (1997). The Melbourne decision making
questionnaire: an instrument for measuring patterns for coping with decisional conflict.
Journal of Behavioral Decision Making, 10(1), 1-19. doi:10.1002/(sici)1099-
0771(199703)10:1<1::aid-bdm242>3.0.co;2-x
Mariani, M. G., & Ferrari, J. R. (2012). Adult Inventory of Procrastination scale (AIP): A
comparison of model with and Italian sample. Testing, Psychometric, Methodology in
Applied Psychology, 19, 3-14. DOI: 10.4473/TPM19.1.1
McCrown, W., Johnson, J., & Petzel, T. (1989). Procrastination, a principal components
analysis. Personality and Individual Differences, 10(2), 197-202. doi:10.1016/0191-
8869(89)90204-3
Rebetez, M. M. L., Rochat, L., Gay, P., & Van der Linden, M. (2014). Validation of a French
version of the Pure Procrastination Scale (PPS). Comprehensive Psychiatry, 55(6), 1442-
1447. doi:10.1016/j.comppsych.2014.04.024
Rogelberg, S. G., & Stanton, J. M. (2007). Introduction: Understanding and dealing with
organizational survey nonresponse. Organizational Research Methods, 10, 195-209.
DOI: https://doi.org/10.1177/1094428106294693
Rozental, A., Forsell, E., Svensson, A., Forsström, D., Andersson, G., & Carlbring, P. (2014).
Psychometric evaluation of the Swedish version of the pure procrastination scale, the
EXAMINING FIVE PROCRASTINATION SCALES 24
irrational procrastination scale, and the susceptibility to temptation scale in a clinical
population. BMC Psychol, 2(1). doi:10.1186/s40359-014-0054-z
Satorra, A., & Bentler, P. M. (2001). A scaled difference chi-square test statistic for moment
structure analysis. Psychometrika, 66(4), 507-514. doi:10.1007/BF02296192
Stanton, J. M., Sinar, E. F., Balzer, W. K., & Smith, P. C. (2002). Issues and strategies for
reducing the length of self‐report scales. Personnel Psychology, 55(1), 167-194. DOI:
10.1111/j.1744-6570.2002.tb00108.x
Steel, P. (2010). Arousal, avoidant and decisional procrastinators: Do they exist? Personality and
Individual Differences, 48(8), 926-934. doi:10.1016/j.paid.2010.02.025
Steel, P., & Ferarri, J. (2013). Sex, education and procrastination: An epidemiological study of
procrastinators' characteristics from a global sample. European Journal of Personality,
27(1), 51-58. doi:10.1002/per.1851
Steel, P. & Weinhardt, J. (2017). The building blocks of motivation. N. Anderson, D. S. Ones, H.
K. Sinangil, & C. Viswesveran (Eds.), Handbook of industrial, work & organizational
psychology (2nd ed., Vol. 3). Thousand Oaks, CA: Sage.
Svartdal, F., Pfuhl, G., Nordby, K., Foschi, G., Klingsieck, K. B., Rozental, A., ... & Rębkowska,
K. (2016). On the measurement of procrastination: Comparing two scales in six European
countries. Frontiers in Psychology, 7. https://doi.org/10.3389/fpsyg.2016.01307

EXAMINING FIVE PROCRASTINATION SCALES 25
Table 1
Irrational Procrastination Scale (IPS) and Pure Procrastination Scale (PPS) Items
Scale Item Origin
IPS 1. I put things off so long that my well-being or efficiency unnecessarily suffers
IPS 2. If there is something I should do, I get to it before attending to lesser tasks (R)
IPS 3. My life would be better if I did some activities or tasks earlier
IPS 4. When I should be doing one thing, I will do another
IPS 5. At the end of the day, I know I could have spent the time better
IPS 6. I spend my time wisely (R)
IPS 7. I delay tasks beyond what is reasonable
IPS 8. I procrastinate
IPS 9. I do everything when I believe it needs to be done (R)
PPS 1. I delay making decision until it’s too late. DPQ4
PPS 2. Even after I make a decision I delay acting upon it. DPQ2
PPS 3. I waste a lot of time on trivial matters before getting to the final
decisions.
DPQ1
PPS 4. In preparation for some deadlines, I often waste time by doing other
things.
GPS12
PPS
PPS
5. Even jobs that require little else except sitting down and doing them, I
find that they seldom get done for days.
6. I often find myself performing tasks that I had intended to do days
before
GPS7
GPS1
PPS 7. I am continually saying “I’ll do it tomorrow”. GPS19
PPS 8. I generally delay before starting on work I have to do. GPS9
PPS 9. I find myself running out of time. AIP10
PPS 10. I don’t get things done on time. AIP5
PPS 11.I am not very good at meeting deadlines. AIP9
PPS 12.Putting things off till the last minute has cost me money in the past. AIP15
Note. (R) denoted items are reversed scored. DPS = Decisional Procrastination Scale; GPS =
General Procrastination Scale; AIP = Adult Inventory of Procrastination Scale.

EXAMINING FIVE PROCRASTINATION SCALES 26
Table 2
The Procrastination Scales and Their Different Foci of Decisional, Implemental, or
Timeliness/Lateness
Scale (items) Decisional Implemental Timeliness, lateness
DPS (5) 1, 3, 4, 5 2
AIP (15) 11, 3 7, 8, 13 1, 2, 4, 5, 6, 9, 10, 12, 14, 15
GPS (20) 8 Most 2
IPS (9) 1, 2, 3, 4, 5, 6, 7, 8, 9
PPS (12) 1, 2, 4 (from DPS) 1, 7, 9, 12, 19 (from GPS) 5, 9, 10, 15 (from AIP)
Note. DPS = Decisional Procrastination Scale; AIP = Adult Inventory of Procrastination Scale;
GPS = General Procrastination Scale; IPS = Irrational Procrastination Scale (IPS); PPS = Pure
Procrastination Scale.

EXAMINING FIVE PROCRASTINATION SCALES 27
Table 3
For the PPS, CFA Results for Four Suggested Factor Solutions
Suggested models Chi
squared
(S_B)
dfs RMSEA
(S_B)
CFI
(S_B)
SRMR
1.One-factor (Steel) 3193.85
(2531.24)
54
.118
(.105)
.888
(.894)
.049
2.Two-factor (Rebetez) 1912.30
(1503.31)
43
.102
(.090)
.926
(.931)
.042
3.Two-factor (Rozental) 2328.45
(1841.95)
53
.101
(.090)
.919
(.923)
.042
4.Three factor model 1131.00
(895.69)
51
.071
(.063)
.961
(.964)
.032
Note. Satorra-Bentler corrected estimates in parentheses. (1) One-factor model (Steel,
2010); (2) two-factor model (PPS items 1-8 “voluntary delay”, and items 9-11 “observed
delay), ignoring item 12 (Rebetez et al., 2014); (3) two-factor model (Items 4-8 starting late,
lagging behind, and wasting time on other things, and items 1–3 and 9–12 focusing on
delayed decision making, not meeting deadlines, and missing appointments) (Rozental et
al., 2014); (4) three-factor model: PPS items 1-3, 4-8, 9-12 (Svartdal et al., 2016).
EXAMINING FIVE PROCRASTINATION SCALES 28
Table 4
PPS Invariance Tests, Gender and Age
N χ2 (df) RMSEA Diff χ2 (df), p CFI
Gender
Men 1750 139.606 .046 .988
Women 2357 164.809 .044 .989
Multigroup analysis
Configural 304.41 (60) .04 .99
Metric 313.57 (69) .04 9.16 (9), .42 .99
Scalar 460.36 (79) .05 146.78 (10), .00 .98
Age groups
Age < 30 1594 172.058 (30) .055 .981
Age > 30 2574 124.308 (30) .035 .994

EXAMINING FIVE PROCRASTINATION SCALES 29
Table 5
PPS (Items 4-8) Invariance Tests, Gender and Age
N χ2 (df) RMSEA Diff χ2 (df), p CFI
Gender
Men 1750 31.159 (5) .055 .993
Women 2357 68.144 (5) .073 .988
Multigroup analysis
Configural 99.30 (10) .07 .99
Metric 100.64 (14) .05 1.34 (4), .86 .99
Scalar 113.67 (19) .05 13.03 (5), .02 .99
Age groups
Age < 30 1594 54.003 (5) .078 .983
Age > 30 2574 42.590 (5) .054 .994
Gender, age > 30
Configural 54.79 (10) .06 .99
Metric 55.23 (14) .05 .45 (4), .98 .99
Scalar 58.92 (19) .04 3.69 (5), .60 .99

EXAMINING FIVE PROCRASTINATION SCALES 30
Table 6
IPS Invariance Tests, Gender and Age (IPS Reversed Items Not Included)
N χ2 (df) RMSEA Diff χ2 (df), p CFI
Gender
Men 1750 66.259 (9) .060 .991
Women 2357 107.792 (9) .068 .989
Multigroup analysis
Configural 174.05 (18) .06 .99
Metric 197.56 (23) .06 23.51 (5), .00 .99
Scalar 289.82 (29) .05 92.26 (6), .00 .99
Age groups
Age < 30 1594 103.455 (9) .081 .983
Age > 30 2574 77.951 (9) .055 .994
Gender, age > 30
Configural 85.44 (18) .05 .99
Metric 94.31 (23) .05 8.87 (5), .11 .99
Scalar 128.90 (29) .05 34.59 (6), .00 .99

EXAMINING FIVE PROCRASTINATION SCALES 31
Table 7
Means, Standard Deviations, Internal Consistencies (Cronbach’s Alpha) and Correlations
Between the Procrastination Scales as well as the SWLS
Measure M SD α 1 2 3 4 5 6 7 8
1. DP 3.06 .98 .90 1.00
2. AIP 2.97 .80 .89 .61 1.00
3. GPS 3.25 .69 .90 .70 .82 1.00
4. IPS 3.62 .83 .91 .69 .72 .79 1.00
5. PPS 3.34 .86 .92 .82 .82 .87 .87 1.00
6. PPS1-3 3.15 .97 .83 .97 .62 .70 .71 .84 1.00
7. PPS4-8 3.62 .89 .87 .65 .68 .84 .83 .92 .68 1.00
8. PPS9-12 3.13 1.04 .85 .66 .86 .75 .76 .90 .66 .72 1.00
9. SWLS 3.04 .98 .90 -.40 -.36 -.37 -.41 -.40 -.41 -.30 -.39

EXAMINING FIVE PROCRASTINATION SCALES 32
Figures
Figure 1. Final three-factor model for the PPS. PPSdesc = items 1-3, PPSimpl = items 4-8, PPSlate =
items 9-12. Standardized estimates shown

EXAMINING FIVE PROCRASTINATION SCALES 33
2 3 4 5 6 7
AGE (DECADES)
2.0
2.5
3.0
3.5
4.0
4.5
5.0
ME
AN
SC
OR
ES
(S
CA
LE
1-5
)
IPS
PPS_desc
PPS_impl
PPS_late
AIP
GPS
DPS
Figure 2. Relations between age (decades) and the procrastination scales. See text for
explanation.
EXAMINING FIVE PROCRASTINATION SCALES 34
Appendix
IRT Test Information Function (TIF; standard errors shown) and Item Information Functions
(IFF) for the three PPS factors and IPS
PPS 1-3 (decisional)
PPS items 4-8 (implemental)
PPS items 9-12 (lateness)
0
1
2
3
4
Info
rma
tion
-4 -2 0 2 4Theta
pps1 pps2
pps3
Item Information Functions

EXAMINING FIVE PROCRASTINATION SCALES 35
IPS