
Irr - Defense Technical Information Center · Measurement of the diffusion ... 8 Differential Heat...
74
Irr e' JonS unn DoglsN.Bnno TH1LCRCEICLRDCINO -EADNTOEZN I IEHLUFXD Jul 196 Reor No 84 aSZc L t ~vo pwu 01= ndW1 E A o .VmuS
Transcript of Irr - Defense Technical Information Center · Measurement of the diffusion ... 8 Differential Heat...
Irre'
JonS unn
DoglsN.BnnoTH1LCRCEICLRDCINO
-EADNTOEZN I IEHLUFXD
Jul 196
Reor No 84
aSZc Lmb-, t ~vo
pwu 01= ndW1
E A o .VmuS

Report No. 68-40
July 1968
kTHE ELECTROCHEMICAL REDUCTION OF
META-DINITROBENZENE IN DIMETHYLSULFOXIDE
John S. Dunning
Douglas N. Bennion, Principal Investigator
July 1968
Financial Support Provided throughContract No. N123-(62738)57439A
U. S. Navol Weapons CenterCorona, California
l0
DEPARTMENT OF ENGINEERINGUNIVERSITY OF CALIFORNIA
LOS ANGELES

FOREWORD
This report, in all essential respects, is the Master of Science thesis of
John S. Dunning, as accepted June 1968. Thanks are due to the authors'
co-workers, Dr. E. d'Orsay, Mr. Mike Yao, and Mr. Bill Tiedemann, whose
suggestions and discussions w'ere most helpful.
The authors are particularly grateful to the Electrochemistry Branch of
the Naval Weapons Center, Corona, California, which provided financial
support for this study through Contract No. N123-(62738)574939A.
- iii 1

ABSTRACT
The electrochemical red uction of meta-dinitrobenzene in solutions of dimeth-
ylsulfoxide was studied on platinum electrodes. The object of the investiga-
tion was to determine the number of electrons transferred and the mechanism
of transfer in the presence and absence of a proton donor, ammonium per-
chlorate.
Two independent electrochemical methods are used. They are the rotating
disk electrode ochnique and the potentiostatic step technique. Measurement
of the diffusion coefficient of meta-dinitrobenzene in the electrolyte solu-
tions is done for use in the electrochemical calculations. A separate study
of the temperature dependence of the soluhility of m-DNB in DMSO is also
(lone.
The electrochemical reduction in the absence of a proton donor takes place
in two steps, which correspond to the formation and reduction of the
m-DNB radical anion. When a proton donor is added, a homogeneous reaction
takes place in the solution near the electrode which results in an effective
increase in the number of electrons to four, corresponding to the reduction to
nitrophenylhdroxylamine.
In separate studies, the diffusion _jefficient of m-DNB in DMSO is found by
the diaphragm cell method to he t.1-5-x-10"oc=2/sec. The solubility ;s found
to increase from 3.51 molal at 24 C to 4.64 molal at 49.75CC.
i'
v

TABLE OF CONTENTSPage
LIST OF FIGURES ................................ ix
LIST OF TABLES ................................ xi
LIST OF SYMBOLS ................................ xiii
INTRODUCTION .................................. 1
I. Background ............................. 12. Statement of the Problem ................... 43. Rotating Disk Electrode Technique ..... ........... 54. Potentiostatic Step Technique ..................... 65. Diaphragm Cell Method for Diffusion Coefficients . .. 7
EXPERIMENTAL ................................. . 9
1. Solubility . .............................. 92. Diffusion Coefficient ...................... 103. Rotating Disk Electrode .................... 124. Potentiostatic Step ........................ 18
RESULTS AND DISCUSSION ........................... 23
1. Solubility .............................. 232. Diffusion Coefficient ....................... 253. Rotating Disk Electrode ..... ............... 284. Potentiostatic Step .. ................... .. .. 395. Interpretation ........................... . 43
CONCLUSIONS ................................... 51
BIBLIOGRAPHY ....................... . ......................... 53
A'" ENDICES
APPENDIX I ............................... 55APPENDLX II ............................... 59APPENDIX III .............................. 61APPENDIX IV .............................. 63APPENDIX V .............................. 65
vii

$ LIST OF FIGURES
Figure Page
1 Diffusion Cell ............................ 11
2 Rotating Disk Apparatus .................... 13
3 Rotating Disk Assembly ..................... 14
4 Rotating Disk Electrical Circuit .................... 16
5 Potential Step Cell ......................... 19
6 Potential Step Electrical Circuit .................... 20
7 Solubility of m-DNB in DMSO as a Functionof Temperature ........ .......................... 24
8 Differential Heat of Solution Plot for Solubilityof m-DNB in DMSO ............................... 26
9 Current-Voltage Curve for Reduction of M-DNBin the Absence of Proton Donors on the RotatingDisk Electrode ........ ........................... 29
10 Current-Voltage Curves as a Function of RotationSpeed for m-DNB in DMSO in the Absence ofProton Donors ................................... 30
11 Limiting Current Dependence on w2 for 1st Wave inAbsence of Proton Donors ...... ................... 32
12 Limiting Current Dependence on w 2 for 2nd Wave inAbsence of Proton Donor ....... .................... 33
13 Dependence of i .W2 on Concentration of m-DNB inthe Absence of 1 roton Donors. First Wave ............ 34
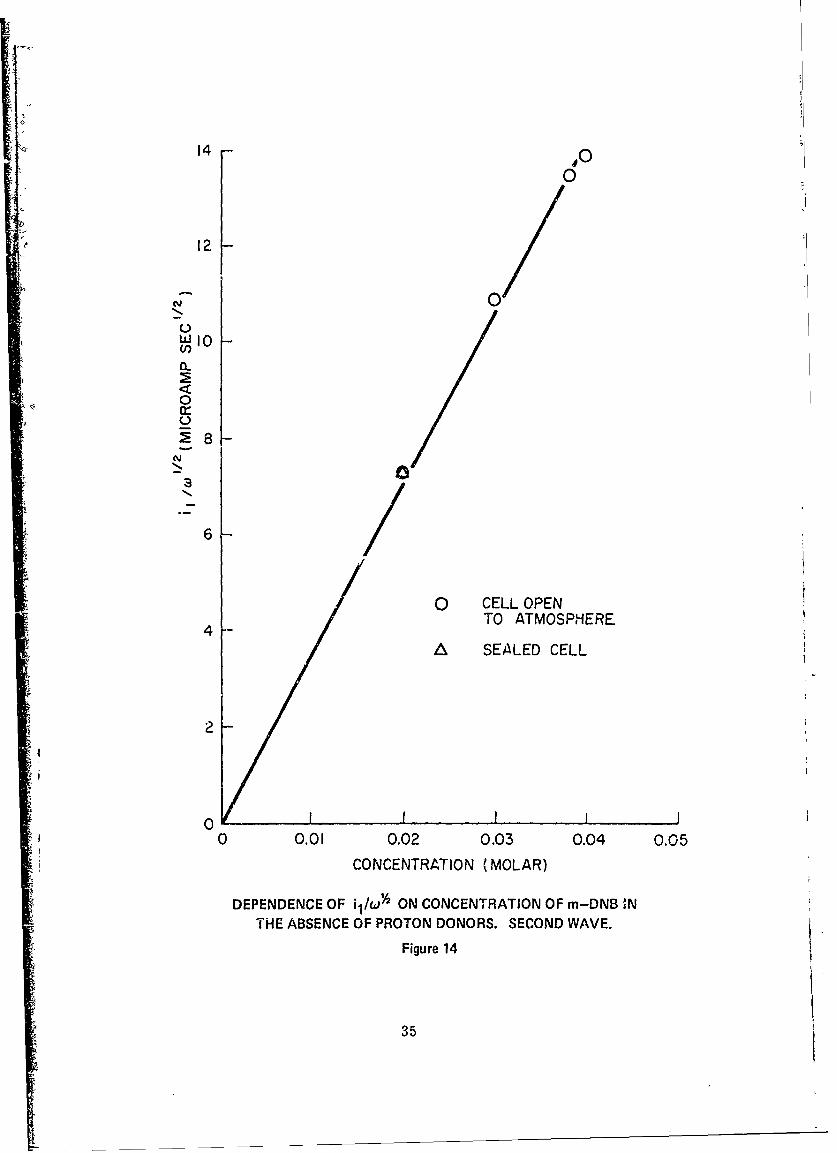
14 Dependence of i /o 2 on Concentration of m-DNB in1
the Absence of Proton Donors. Second Wave ........ ..... 35
15 Current-Voltage Curves for m-DNB Reduction as aFunction of Proton Donor Concentration ............... 37
16 The Effect of Addition of AP on the 1st Wave Reductionof m-DNB in DMSO ............................... 38
17 Current vs. Time 2 for 1st Wave Reduction of m-DNBin DMSO in the Absence of Protone Donors fromPotential Step Method ....... ...................... 40
t 118 Current vs. Time 2 for 2rnd Wave Reduction of
m-DNB in DMSO in the Absence of Protone Donorsfrom Potential Step Method ......................... 41
ix

LIST OF FIGURES (Continued)Figure Page
19 Concentration Dependence of the Quantityi• t2 for 1st and 2nd Waves in Reductionof m-DNB in DMSO in the Absence ofProton Donors by the Potential Step Method .............. 42
20 Calculated Concentration Profile for m-DNB forthe Potential Step Method ....................... 44
21 Distillai~on Column Apparatus .................... 56
22 Calibration Curve for Determination of m-DNBConcentration by Spectrophotometric Means .............. 60
23 Kinematic Viscosity of DMSO Solution as aFunction of m-DNB Concentration ................. 64
24 Ratio of Limiting Currents for 1st and 2nd Waves as aFunction of Temperature in the Absence of Proton Donors . 66
25 Diffusion Coefficient of m-DNB in DMSOSolutions as a Function of Temperature ................. 67
26 Activation Energy Plot for Diffusion of m-DNBin DMSO Solutions .................................. 68
x
-.- ---

LIST OF TABLES
Table Page
1. The Effects of Proton Donor Addition on the Reduction ofHydrocarbons as Reported by Given and Peover .......... 3
2. Initial and Final Concentrations of the Diffusion Cell 4
for Two Runs ..................................... 27
3. Measured Properties of Purified DMSOat 25 °C ........ .................................. 57
4. Calibration Readings for SpectrophotometricDetermination of DMSO Concentration .................. 59
5. Karl Fischer Water Determination for Purified DMSO . . . . 6-2
xi

LIST OF SYMBOLS
A electrode area LS
AP ammonium perchlorate
C concentration
Co concentration in bulk of solution
D integral diffusion coefficient
DMSO dimethylsulfoxide
De diameter of rotating disk electrode
e- electron
F Faraday' s constant
H partial molar enthalpy
i electrical current
iI diffusion limited current
j molar flux
k homogeneous reaction rate constant
KFR Karl Fischer reagent
I thickness of diaphragm
m i molality of species i
m-DNB meta-dinitrobenzene
n number of electrons transferred
p pressure
q effective cross sectional area of diaphragm
R general form of hydrocarbon
R,, gas constant
Rd ratio of proton donor concentration tomr-DNB concentration
Re Reynolds number
r distance (radial) from center of a spherical electrode
ro radius of spherical electrode
/L effective radius of a molecule
T absolute temperature
xiii

LIST OF SYMBOLS (Continued)
t time
ue fluid velocity at edge of rotating disk
V volume
x distance variable
9cell constant of diaphragm cell
7i activity coefficient (molal) of species i
6 diffusion boundary layer thickness
6 o hydrodynamic boundary layer thickness
x reciprocal of reaction layer thickness
9i chemical potential of species i
0o cbemical potential in standard state
v kinematic viscosity
17 viscosity
0 generalized benzene ring
AHds differential heat of solution
xiv
INTRODUCTION
1. Background. The subject of high energy density batteries using
lithium as a negative electrode in a nonaqueous electrolyte system has been.1
discussed by Jasinski.
Among the promising nonaqueous electrolytes are those of the organic
sulfur containing class. 2 Of these, one widely studied has been dimethylsulf-
oxide (DMSO). The solvent properties of DMSO have been rev.ewed by Smyrl. 3
An extensive review of electrochemistry in DMSO has been prepared by Butler.4
DMSO has a fairly high dielectric constant of 46 to 47 at 25 0 C and has a liquid
range between 18. 50 C and 189 0 C at atmospheric pressure. It appears to be
stable towaid lithium and has exhibited a useful voltage range of about five volts
before decomposition. Electrical conductances for some lithium salts in DMSO-3 - 1 -1
have been measured to be in the range of 7 x 10 ohm cm . While this is
a little low for battery applications, it is quite possible for some solutes that
conductance will be over 10- 2 ohm- cm at operating tempe tures of 50 C.
Batteiies using lithium as one electrode and using DMSO as the solvent
appear to be feasible if a suitable positive (cathode on discharge) electrode re-
action can be found. The reduction of m-DNB has been used for this purpose
in high ene. gy, short life batteries with liquid ammonia solutions used as elec-6
trolytes. Based on an open circuit voltage of 2. 5 volts, a lithium/m-DNB
couple has a theoretical energy density of about 1380 watt-hours per pound if
the m-DNB were reduced completely to the dianiline. The study of the reduc-
tion of m-DNB in DMSO solutions is thus a natural extension of the search for
high energy battery systems. This study is concerned with the mechanism of
the reduction.
A survey of the literature shows many studies of organic electro-
chemical reductions in both aqueous and nonaqueous media. The effects of
proton donor addition have been investigated for a number of systems. A few
of the important references are summarized here as an introduction to the gen-
eral problem.

In the absence of proton donors, Hoijtink et al. found that the chief
steps in the redu tion of various alternpnt and nonalternant hydrocarbons could
be described as follows:
R+e - R I
R+ e -R II
The first reaction is the formation of a radical anion by a reversible one elec-
tron transfer. The second reaction is the reduction of the radical anion. Re-
action II occurs at more negative potentials than reaction I giving rise to two
wave behavior on a dropping mercury polarogram.
The product of reaction I may also diffuse into the bulk of the solution
and react with a hydrogen ion to form RH which then may dimerize or dispro-
portionate. R will also diffuse into solution to react eventually with hydrogen
ions to form RH 2 .
If a proton donor is present in the solution, the nature of the reduction
process becomes quite complicated and many types of behavior are displayed.8
Given and Peover, upon investigation of the reduction of aromatic hydrocar-
bons and carbonyl compounds in dimethylformamide, found that five different
types of behavior resulted from the addition of phenol and benzoic acid. Their
results are summarized in Table 1. It is interesting to note the differences in
behavior of the same reactant due to differences in proton donors. It appears
that the proton donating ability of the benzoic acid is greater than that of the
phenol and that one might expect class E behavior in strongly acidic solutions,
other things being equal.
Kolthoff and Reddy 9 have reported that the reduction of benzoquinone
and quinhydrone in . 1M tetraethylammonium perchlorate (TEAP) solutions in
DMSO gave two waves. The first corresponds to a one electron reversible step
while the second wave corresponds to an irreversible addition of, effectively,
less than one electron. Upon addition of proton donors like hydrochloric acid,
the second wave shifted to more positive potentials. This corresponds to class
D behavior reported in Table 1.
2

TABLE 1
THE EFFECTS OF PROTON DONOR ADDITION ON THEREDUCTION OF HYDROCARBONS AS REPORTED
BY GIVEN AND PEOVER. 8
Behavior Explanation
Class A 1st wave height in- R-+ H+ -, RH"creases as 2nd wave RH. reduced at sameheight decreases. potential as R.
Class B New wave between 1st Dimerization ofand 2nd wave appears R'and grows in height as2nd wave decreases.
~- H+
Class C Both waves grow in a) R + -. RH.height; new waves may RH. reduced at sameappear. potential as R.
b) Protonation makesfurther reductionpossible; mechanisr-undetermined.
Class D 1st wave stays the same R protonatedbut 2nd wave shifts to but R- is not.less negative potentials.
Class E New wave at less negative Prior protonationpotentials appears; of R to RHgrows as the originalwaves decrease.
Kemula and Sioda 10 have reported the behavior of two nitrocompounds
in dimethylformamide (DMF). They found that the addition of benzoic acid to
nitrosobenzene with NaNO 3 as supporting electrolyte caused the appearance of
a new wave at less negative potentials than the first wave. This is clearly
class E behavior. The addition of benzoic acid to nitrobenzene caused an in-
crease in the height of the first wave to the height of both waves observed in
the absence of benzoic acid. This is an example of a nitrocompound displaying
type A behavior. The conclusions of Kemula and Soida were that the reduction
of the aromatic nitro-group was a four electron reaction in the presence of a
proton donor and that the first step represented the one electron formation of
the free radical anion.
3

In a later study, Kemula and Sioda 1 1 reported the visible spectrum of
the nitrobenzene free radical anion. Geske and Maki 1 2 have used ESP spec-
troscopy to study the electrochemical generation of nitrobenzene free radicals.
Tice, Cadle, and Chambers 1 3 have studied the reduction of several
aromatic nitrocompounds as a function of the proton donor in solutions of
acetonitrile, DMSO, propylene carbonate, and DMF. They found that trichlo-
roacetic acid, p-toluenesulfonic acid, N, N diethylanilinium perchlorate, o-
phthalic acid, salicylic acid, and p-hydroxybenzoic acid caused a new wave to
appear at potentials more positive than the wave for the formation of the radi-
cal anion. All of these proton donors thus seem. to produce class E behavior.
Benzoic acid produced a wave which was merged with the one electron wave.
Phenol, hydroquinone, and water at low concentrations did not produce class
E behavior. It was also found that the reduction of p-chloronitrobenzene in
o-phthalic acid solutions of acetonitrile resulted in a four electron wave using
four moles of acid per mole of p-chloronitrobenzene. The reaction product was
found to be p-chlorophenylhydroxylamine so that tie overall reaction was:
NO 2 NHOH
+4e'+4 4 + - + H 2H0C1 C1
It is interesting to note that the complete reduction to the aniline, involving six
electrons and six hydrogen ions, was not observed. Apparently the phenyl-
hydroxylamine is resistant to further reduction and only four electrons are
transferred for each nitro-group.
2. Statement of the Problem. The purpose of this study was to de-
termine the number of electrons transferred in the reduction, on a platinum
electrode, of m-DNB in DMSO in the presence and absence of a proton donor,
ammonium perchlorate. Two independent electrochemical methods were used
for the determinations. These were the rotating disk electrode technique and
the potentiostatic step technique. Information regarding the details of the re-
duction was to be derived from the electrochemical measurements.
4

In order to use the electrochemical techniques proposed, determina-
tions of the diff ision coefficient and kinematic viscosity of m-DNB in DMSO
were necessary. The diffusion coefficient was measured by means of the dia-
phragm cell method and the kinematic viscosity was measured with an Ubbelohde
viscomete-. In addition, a separate study of the solubility of m-DNB in DMSO
was to be done as a function of temperature.
3. Rotating Disk Electrode Technique. The basis of the rotating disk
technique is the solution of the Navier-Stokes equations for a disk rotating about
an axis perpendicular to its face in a stationary, infinite, incompressible fluid.
The resulting velocity profile for the system is then used in the convective dif-
fusion equation. Using Fick's first law and the boundary condition that at the
surface of the disk the concentration of the species in question is zero, the so-
lution to the convective diffusion equation yields the limiting diffusional flux of
the species toward the disk. Levich 14 has developed the equations describing
this phenomenon. Riddiford 1 5 has published a comprehensive review of the
technique.
Electrochemical reactions can be investigated if the rotating disk surface
is an electrode. Observation of current through the electrode versus the poten-
tial difference between the electrode and the solution will show the point at which
the flux to the surface becomes diffusion limited. At this point a small increase
in the current will cause a large change in potential difference as a new reaction
must begin to account for the increased current. Levich gives the following ex-
pression for the limiting current:
ili m = 0.62 nFD2/3 -1/6 1/2 oi 06nD v w C°A (1)
where
n = number of electrons transferred in the electrode reactionper mole of the active species.
F = Faraday's constant.D = integral diffusion coefficient of the active species.v = kinematic viscosity of the bulk solution.
C ° = concentration of the active species in the bulk solution.w = angular rotational velocity of the electrode.A = area of the electrode.
5

16Newman has shown that for large Schmidt numbers the value of the
numerical constant in Equation (1) can be corrected to give:
0.554 nFD2/3 V-1/6 1/2 C0AO1im"4nFD I 2-73- (2)
.8934(1+.298Sc- /3+.14514Sc-2(3)
If a limiting diffusional current can be obtained experimentally, Equation (1)
and Equation (2) can be used to determine the number of electrons transferred
if the other parameters are known. The kinematic viscosity and diffusion coef-
ficients can be measu ed by standard methods. The bulk concentration and ro-
tation speeds can be controlled for the experimental measurements. The elec-
trode area can be measured accurately. Thus the rotating disk electrode gives
a steady state method of determining the number of electrons transferred at an
electrode surface.
4. Potentiostatic Step Technique. The potentiostatic step technique,
as applied to a spherical electrode, involves the solution of the semi-infinite
spherical diffusion equation. This technique has been described by Delahay. 1 7
A sudden change in the potential difference between the electrode and the sur-
rounding solution is applied. The magnitude of the change is such that the
species of interest is electrolyzed at a very high rate. The boundary condition
of zero concentration of active species at the electrode surface is thereby es-
tablished. The concentration distribution resulting from the imposition of the
step is a function of time as follows:
C(r,t) = C0 -0 erfc (3)r \2D2t2/
where the complementary error function is defined by
erfc= I - 2 exp (-Z ) dZ ( )Vt 0
and
D = integral diffusion coefficient of the active species.r = distance from the center of the electrode.r = radius of the electrode.
0
t = time from application of the potential step.
6

The current at the surface of the electrode is obtained by evaluating the
concentration gradient at the surface:
dCD flux at the surface (5)Ddr
r=r0
which gives, for the current
i = nFA D'C ° _--' + nFA D 1o (6)
where n, F and A have the same meanings as for the rotating disk electrode.
In general, for short times (less than 2 seconds) and large r (greater0
than .50 mm.), the second term in Equation (6) can be neglected compared to
the first term. If the time of reaction is too long, natural convection is set
up by the differe'nces in density between product and reactant solutions near the
electrode. in this case Equation (6) is not valid.
If experimental results indicate that Equation (6) is being obeyed, then
the number of electrons transferred can be calculated if the diffusion coefficient
iF known. The bulk concentration is used as the experimental variable, along
with the time of electrolysis.
5. Diaphragm Cell Method for Diffusion Coefficients. The diaphragm
cell method of determining diffusion coefficients has been discussed by Stokes. 1 8
It is an unsteady state method in which a concentration gradient is set up in the
pores of a sintered glass disk. In this manner mechanical and thermal distur-
bances in the surroundings have no effect on the diffusion because convection
within the diaphragm is prevented. In addition, large concentr-.tV1i gradients
can be used, so that short runs can be made. Because of these advantages over
other methods, as well as the simplicity of the eiperiment, the diaphragm cell
method was chosen to determine the integral diffusion coefficient to be used in
the electrochemical experiments.
The cell is characterized by a vertical tube in which solutions in the top
and bottom compartments are separated by a horizontal sintered glass dik.
The pores of the disk must be small enough to prevent streaming and convection
between the solutions and large enough to eliminate wall effects of the pores.
7
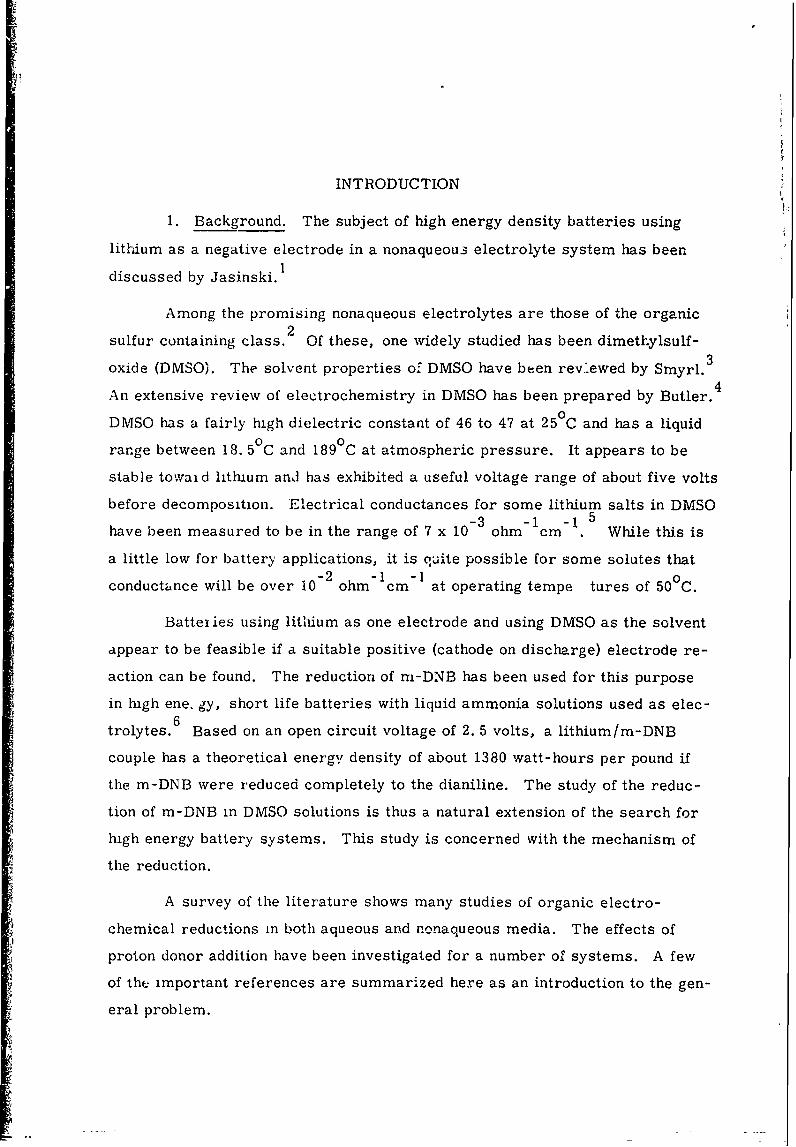
Different experimenters have found a pore diameter of 10 - 3 to 10- 4 cm. to
be satisfactory. Within each compartment of the cell complete mixing is ac-
complished by means of mechanical stirrers.
The equations describing the mass transfer for a system such as the one
above can be written.
VtdCt + Dq/1 (Ct-Cb) dt 0 (7)
V dC b + Dq/1 (C -C )dt 0 (8)b b b t
In these equations Ct and Vt refer to the concentration and volume of the top
compartment and C b and Vb refer to the lower compartment. The effective
cross-section of the disk is denoted by q, and 1 refers to the thickness of the
diaphragm. If Equations (7) and (8) are combined and D is assumed independ-
ent of concentration, we get:
d(Ct-C b
/C -b+ PDdt = 0 (9)(ct- cb )
where is the cell factor, given by
= '7 4_-~.- (10)t Vb
Integrating Equation (9), the result is
(Ct-Cb initialin =- /Dt (11)
(Ct-C b4tbfinal
Thus if the initial and final concentrations in each compartment, the cell fac-
tor, and the time of the experiment ae'e known, the integral diffusion coefficient
can be calculated.
The measurement of the cell factor is usually done by calibrating the
cell with a solution whose diffusion coefficient is well known. Gordon1 9
recommends that KC be used as a calibrating solution at . 1 N and 25 0 C. He
suggests the value of D 1 1. 838 x 10- 5 cm 2/sec for small concentration differ-
ences between compartment concentrations. Stokes 2 0 gives a very complete
set of calibration data.
8

EXPERIMENTAL
1. Solubility. The solubility of m-DNB in DMSO was determined as
a function of temperature at atmospheric pressure. Measurements were car-
ried out in a dry atmosphere glove box using purified DMSO. The purification
procedure is described in Appendix I. The temperature of the solution was con-
trolled by placing it in a double walled vessel with water used as the heating and
cooling medium. The water temperature was controlled by a mercury contact
temperature bath to ±0. 01 0 C. Temperatures of the solution were measured by
a copper-corstantan thermocouple as well as with a calibrated thermometer.
Stirring of the solution was accomplished by means of a magnetic stirring bar.
The temperature of the solution was raised to approximately 50°C to
start the experiment. A period of one week was allowed initially for the solu-
tion to reach equilibrium before samples were taken. The temperature was
lowered after each sample was taken and the system was allowed to equilibrate
for at least 24 hours. About half of the samples were taken in this manner.
Then the temperature was raised after each sampling and the system again was
allowed 24 hours to come to equilibrium. There was no systematic variation of
the measured solubilities between the two methods of changing temperature.
Samples were withdrawn using a 10ml. pipet. The pipet was heated to
the temperature of the bath to minimize crystallization in the pipet. The pipet
volume change due to thermal expansion was negligible. A glass wool filter
was used to keep undissolved particles of m-DNB out of the pipet. The pipet
was washed with 10 ml. of pure DMSO after transferring the original contents
to a 100 ml. volumetric flask. This wash was also put into the volumetric
flask. After several samples had been taken, the volumetric flask5 were re-
moved from the dry box and each was filled to the 100 ml. mark.
The samples were then diluted again to either 1/20 or 1/40 of the satu-
rated concentrations in order to put the concentration in a range convenient for
analysis. The concentration was determined using a Beckman modeL DU spec-
trophotometer. A light wavelength of 420 millimicrons and a slit width of
0. 22 mm. were found to give good calibration readings. It was found that for
9

m-DNB in DMSO Beer's law i3 followed up to concentrations of about 30 mg.
of m-DNB per ml. of solution. Instead of taking readings in this range, it was
decided to calibrate the absorbance versus concentration curve up to 90 mg. /ml.
and fit the data with a quadratic equation. See Appendix II for a detailed account
of the method used. This procedure reduced dilution errors and gave less scat-
ter of the actual solubility data than would have been obtained if concentrations
were determined in the linear absorbance-concentration region.
2. Diffusion Coefficient. It was necessary to measure the diffusion
coefficient of m-DNB in the supporting electrolyte solution used in the electro-
chemical experiments. The diaphragm cell method of Stokes 18 was chosen foruse in these measurements.
The glass cell is shown in Figure 1. It consisted of two compartments
separated by a porous glass diaphragm 10 mm. in diameter and 3 mm. thick.
It had a pore size of 10-15 microns. Stirring was accomplished by magnetically
driven gla,'s stirring bars located on each side of the diaphragm. A large U-
shaped magnet, mounted externally to the cell, and rotated by a variable speed
motor, provided the driving force. The cell was operated in a vertical position
with the upper compartment containing the dilute solution and thE lower com-
partment the more concentrated solution. The stirring bars were so constructed
that the one in the lower compartment floated to the top and rested on the dia-
phragm while the one in the upper compartment sank to the bottom and rested
on the diaphragm. This arrangement enabled the bars to sweep the surface of
the diaphragm and provided for reproducible stirring. The stirring rate was
60 RPM.
The cell was similar to that of Stokes 1 8 but was modified to provide for
only glass and teflon to be in contact' with the solution. This was to prevent
DMSO from dissolving the grease and rubber present in Stokes, cell. Telflon
stopcocks were used for filling and draining the cell and teflon sleeves were usedon all ground glass joints.
10

TEFLON STOPCOCK
POROUS GLASSDIAPHRAGM
MAGNETIC____STIRRING BARS
TEFLON STOPCOCK
DIFFUSION CELL
Figure 1

The experimental procedure described by Stokes was followed. All
measurements were taken in a water bath held at 25.0 ±. 1 0 C. Calibration
of the cell was done with the lower compartment filled with a 0. 1 N potassium
chloride-water solution and the upper compartment filled with redistilled water.
Analysis of the final solutions was done by precipitating the chloride ion as AgCi
and weighin~g. The durations of the calibration runs varied from 175 minutes-2
to 7180 minutes. The average cell constant was 8 = 6.19 cm with an aver-
age deviation of 9. 2%.
Two runs were made to determine the diffusion coefficient of m-DNB
in 0. 1M tetraethyl ammonium perchiorate (TEAP) solutions in DMSO. The
first lasted 5840 minutes and measured D in the range between 0. 0381 M
m-DNB and pure supporting electrolyte. The second run was for 8225 min-
utes and the D measured was for concentrations between 0. 05 M m-DNB and
the pure suppcrting electrolyte. These concentrations represent the initial
conditions.
The concentrations of m-DNB (initial and final) in the two compart-
ments were determined by spectrophotometric means described in Appendix II.
3. Rotating Disk Electrode. The rotating disk electrode equipment is
shown in Figure 2. It consisted of a variable speed motor which drove a ro-
tating shaft by means of pulleys. The motor was isolated by rubber vibration
damping mounts and the electrode drive shaft ran through a Dumore quill bear-
ing system. The electrode was very carefully mounted so that vibration was
kept at a minimum.
The electrode assembly is shown in Figure 3. The working electrode
surface was a cross-section of platinum wire of 0. 258 cm. diameter. The
wire was force- fitted through a teflon shaft of 3 cm. diameter. The teflon was
in turn force-fitted to a steel shaft which was placed in the chuck of the quill.
Copper wire made the electrical connection between the steel and platinum.
The pick-up on the rotating shaft consisted of a silver slip ring and a spring
loaded graphite rod which made the connection to the non-rotating electrical
12

0
W z0 0
00
J Id
LLId
D cc0 0
2
- z
LU F-m0
0Z Z 0
FJ 00
13

SILVER SLIP RING
-,---STAINLESS STEELSHAFT
I -TEFLON SHAFT
-- COPPER CONTACT WIRES
S- - WORKING ELECTRODE(PLATINUM WIRE)
ROTATING DISK ELECTRODE ASSEMBLY
Figure 3
14
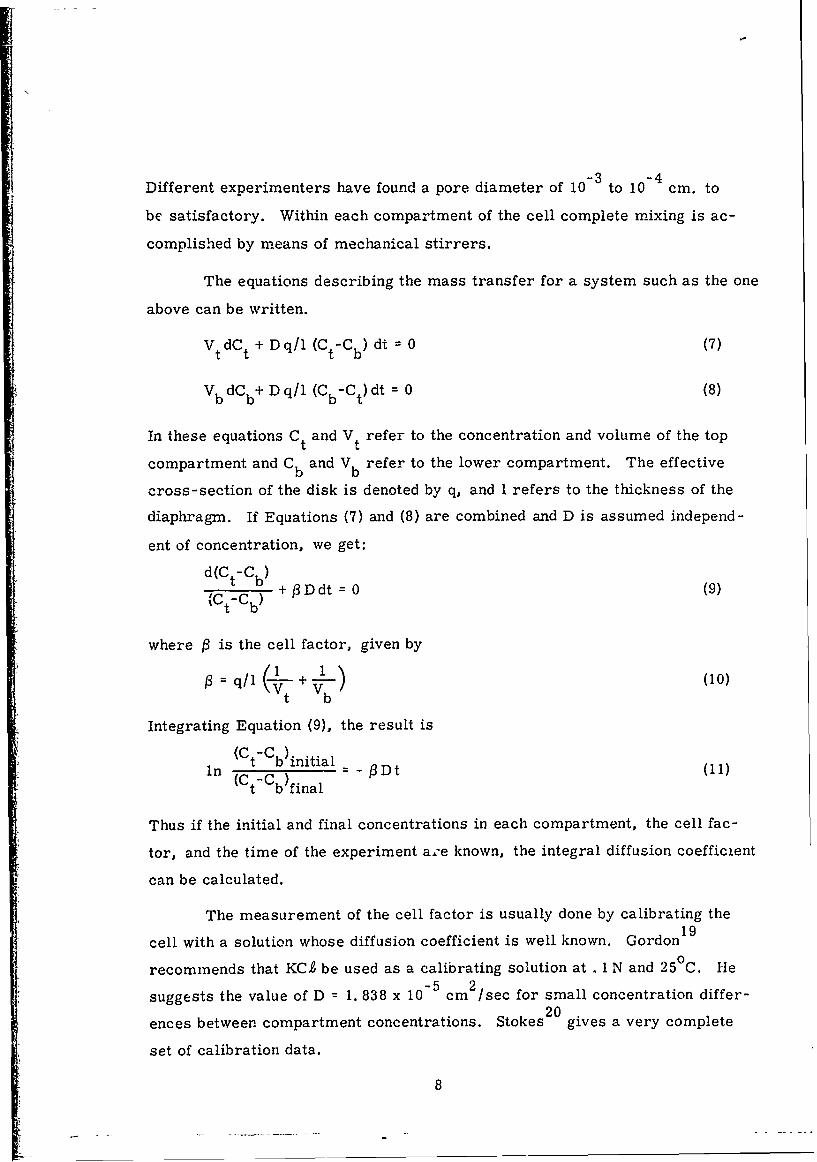
measuring system. The electrode was carefully machined to eliminate wobble
and the face was polished to a mirror surface on #00 emery paper.
The speed of rotation of the disk was made variable by two means.
First, the drive motor was a universal motor controlled by a variac speed
control with speeds from 0 Lo 8800 RPM. Secondly, speed variation could be
accomplished by changing the pulley combination on the motor and the drive
shaft. The speed was monitored by a General Radio strobotac accurate to
The circuit used for the galvanostatic polarization of the rotating disk
electrode is shown in Figure 4. The power supply used was a Heathkit model
IP-32 Regulated Power Supply having a range of 0 to 400 volts and a maximum
current output of 100 milliamps. The voltmeter was a Keithley model 610B
electrometer with rated input impedance in excess of 1012 ohms. The ammeter
was . Simpson model 262 volt-ohm-milliammeter with a sensitivity of 1. 0 micro-
amp on the finest scale. The variable resistor was a Clarostat Power Resistor
decade box, which was set at 999, 999 ohms.
The voltages measured were compared to either a saturated Ag/AgC90 4
reference electrode or to the platinum counter electrode. The counter elec-2
trode had an area of 10 cm . Since this is 3000 times the area of the working
electrode, the counter electrode was considered nonpolarizable and therefore
suitable for a reference electrode.
The Ag/AgC 04 reference electrode consisted of a tube of pyrex glasswith one end sealed with soft glass. The soft glass cracked on cooling, allow-
ing good ionic conduction but negligible diffusion through the cracks. A satu-
rated AgCIO4 solution in DMSO was placed in the tube and a coil of shiny silver
wire put in contact with the solution and AgC 04 crystals in the tube. The open
end of the tube was sealed to prevent atmospheric contamination of the solution.
Tht cracked glass tip was placed as near as possible to the working electrode
when measurements were being taken.
15

D. C.POWERSUPPLY
DECADERESISTOR
AMMETEELECTROMETER
-REFERENCE ELECTRODE
_WORKING ELECTRODE
COUNTER ELECTRODE-
ELECTRICAL CIRCUIT - - ROTATING DISK ELECTRODE
Figure 4
16

The reaction vessel contained approximately 250 ml. of solution. The
counter electrode was placed directly in the solution, at a distance of 3 to 4 cm.
from the working electrode.
The platinum working electrode was cleaned with a saturated solution
of ferrous sulfate in sulfuric acid. It was washed with distilled water and
rinsed with, the test solution before each run. Between experimental runs, the
electrode was carefully re-polished with soft tissue. The cell wa3 washed and
dried whenever a fresh solution was being used.
The potential-current curves were generated by adjusting the power sup-
ply so that a constant, known current was passed between the counter electroie
and the working electrode. The resulting steady state potential difference be-
tween the working electrode and the reference electrode was noted. Steady
state may be defined for the purpose of this report as the conc ition when the
potential is constant within 10 millivolts for ten minutes. At currents greater
than 10 microamps, steady state potential differences were attained within two
minutes of the application of the current. Below 10 microamps, somewhat
longer times, on the order of 10 minutes, were necessary for steady state to
be reached.
Current-potential curves were generated for a number of rotation
speeds for each concentration investigated. The speeds ranged from 200 RPM
to 1200 RPM. The concentrations of m-DNB ranged from 0. 01 M to 0. 04 M.
The effects of water content on the results of the rotating disk experi-
ments were examined. Distilled DMSO with water content below 100 ppm was
used in a sealsd cell under a dry nitrogen atmosphere. The m-DNB was re-
crystallized three times from methanol and the melting point was determined
to be 89 0 C, which is in good agreement with the literature values. The tetra-
ethylammonium perchlorate and ammonium perchlorate used were dried in a
vacuum oven for 24 hours at 80-100 °C.
It was found that increasing the water content uf the DMSO up to 0. 2%
did not change the results of the experiments. This is illustrated by Figures
13 and 14 in which the m-DNB concentration of . 02 represents the data found
17

with the purified system and the other points represent the results obtained
with the reaction vessel open to the atmosphere. These tests were done at
ambient (22-24°C) temperatures.
In addition to the above study, the effect of adding NH ion, as dissolved
ammonium perchlorate, was investigated. For these measurements, a 0. 02M
m-DNB solution was used at a rotation speed of 300 RPM. Limiting currents
were recorded as a function of the concentration of the ammonium ion.
4. Potentiostatic Step. The cell used for the potentiostatic step ex-
periments is shown in Figure 5. The working electrode was a platinum ballwit a aeaof8.5 1-2 2
with an area of 8. 55 x 10 cm . The ball was formed by melting the tip of a
piece of platinum wire in an oxygen-gas flame. The wire was then sealed in-
to a thirn pyrex glass tube attached to a ground glass joint for fitting through the
top of the cell. The apparent area of the ball was determnined by optical magni-
fication of the electrode and subsequent measurement. The counter electrode
was a large cylinder of platinum wire screen which surrounded the working
electrode at a distance of about 1. 5 cn. Various ports were provided in the
cell for purging and reference electrode placement. Approximately 190 ml.
of solution were contained in the cell. The cleaning procedure for the cell was
essentially the same as that described for the rotating disk electrode.
The circuit used to set the potential for the step and to measure the cur-
rent decay is shown in Figure 6. The potential was set with an Anotrol Model
4100 Research Potential Controller. Current was measured as a function of
the time from the application of the potential step. This was done with a
Tektronix 545-A oscilloscope fitted with a Polaroid camera. The oscilloscope
measured the potential drop across a General Radio precision decade resistor
with an accuracy of 0. 01 ohms. A photograph of the decay of this potential
drop as a function of the time from the application of the potential step was ob-
tained. From this the current-time curve was calculated. The times involved
in the experiment were from 0. 2 sec to 2. 0 seconds from the application of the
potential step. The rise time of the potentiostat is on the order of one milli-
second or less.
18

ELECTRICALCONNECTIONS
BUBBLER
OUTLET
4
GROUND
GLASSJOINTS
BUBBLERINLET
I N L E T W O R K I N G
"ELECTRODE
PLATINUM MESHCOUNTER ELECTRODE
POTENTIAL STEP CELL
Figure 5
19

C.E.
POTENTIOSTAT R. E.
W. E.
DECADERESISTOR
OSCILLOSCOPE
WORKING ELECTRODE ELECTRODE
P01 ENTIAL STEP CIRCUIT
Figure 6
20
The value of the potential imposed by the potentiostat must be sufficient
to produce zero concentration of m-DNB at the surface of the electrode, if
Equation (6) is to apply. In order to get some idea of the potential necessary,
a continuous voltage sweep polarogram was run on the solutions. The potential
at which limiting currents were observed was used as the preliminary value to
be imposed between the working and counter electrodes of the cell. For the
first wave this potential was -1. 8 V. For the second wave it was -2. 3 V. This
represents the potential of the working electrode relative to the counter elec-
trode. It was found that when these potentials were applied during the experi-
ments, the current-time curves corresponding to diffusion limitation of mass
transfer were observed.
The first wave was investigated with five concentrations of m-DNB-3 -
ranging from 8 x 10 to 4 x 10 M. The second wave was investigated with
three concentrations in the same range. The supporting electrolyte, as in the
rotating disk experimcnts, was 0. 1 M tetraethylammonium perchlorate.
The potential step method was not applied to solutions containing am-
monium perchlorate as a proton donor for two reasons. First, the addition of
a proton donor changes the potentials at which the limiting currents occur.
Thus the potential which must be set to produce this current was experimentally
difficult to determine. This limitation does not apply to the rotating disk elec-
trode system because the potential is the dependent rather than the independent
experimental variable. The second reason that the potential step was not used
for proton donor experiments is that it is an unsteady state method in which the
diffusion layer thickness is changing with time. Thus, if the reaction is a com-
plicated series of homogeneous and heterogeneous steps, the potential step
method generates a series of time dependent species conservation equations
which are difficult to solve. The rotating disk technique, on the other hand,
is a steady state method which offers much simpler mathematical solutions
when complicated mechanisms are involved.
21

HESULTS AND DISCUSSION
1. Solubilit:t. It was found that the solubility of m-DNB in UMSO in-o 0
creased fl'om 3. 51 molal at 24 C to 4. 64 molal at 49. 75 C. The data is shown
w Figure 7.
At saturation, the chemical potentials of the m-DNB (denoted by sub
~Cl'ipt i) are equal in the liquid and solid phases.
·.vhere
s 1 IJ. . = /). .
1 1
0 J.l. = J.l. + RT ln I'· m.
1 1 1 1
and the convention is that
,. ... 1 1
as m. -m. 1 1, s
(12)
(13)
(14)
where m. is the molality of m-DNB at saturation at the temperature and 1, s
pressure of interest. At saturation, Equations (12) and (13) can be combined
to gi vc s 0
p'. "' f..L + RT ln 'Y· + RT ln m. 1 1 1 1S
upon rearrangement,
s j.l.
1
T
0 J.l,
1
T = H ln ')'. + R ln m.
1 1S
(15)
(16)
If Lquation (1 G) is differentiated with respect to temperature, the result is ·· · · ·
Hut
("~If)p,SAT-( a:~T), SAT= R(a ~~ yit SAT+ R (a l~mi)p, SAT
-s H.
1 ')
T~
(17)
{18)
23 i__.t,L::CEDING PAGE BLANK

0 LO
0uD
LI)
w U-D
00
00 I-
% - - cr)0 U-
00
~LL
0 o0
0 010E
U-) 0Lto
q: I: )(Al-IVON eNI - J N~iV~N3NOOWuniv
24-

and
aT T 2 (19)
3T T2
where s is the partial molar enthalpy in the solid and o is the partial4 1
molar enthalpy in the saturated solution. Thus Equations (13), (18), and (19)
combine to give
HS H° 81n-y ainm
R / ) a n -y R aIm(20)T2 + T /-)p, SAT - pO SAT
But by the convention adopted in Equation (14),
---~ PSA 0 (21)8T '/,SAT
The resulting equation is:aIn m. 0 ' -AH
m.s- AHDS (22)
al/T R R
where A HDS is the differential heat of solution.
Figure 8 shows a plot of the experimental values of the logarithm of
the molality versus the inverse of the temperature. From the slope of the
plot the differential heat of solution was found to be 2053 cal/mole. The solid
line in Figure 7 is a piot of the empirical equation for molality m 112. 8 exp
(-2053/RT). This equation fits the data quite well in the temperature range
considered.
2. Diffusion Co, fficient. Stokes (18) has reported that accuracies of
better than 1% can be obtained with the diaphragm cell technique. In this study
deviations of up to 10% were found among the various calibration runs and in
the final determination of the unknown diffusion coefficient. It is believed that
the main cause of this error was the blockage of some of the pores in the
diaphragm by air bubbles. Although the solutions were deaerated by evacua-
tion with an aspirator waLer pump, some bubble formation was noted as the
solution was sucked through the diaphragm to start the experiment. The
25

1.56 -
0
1.52 -
1.48
I-a:5 -J
o 1.44 -
oz
I- 0a:
- 1.40 -,on 0
LL
I1.36 -
0,0
0b
1.28
1.241 I I3000 3100 3200 3300 3400
I/T (-K X 106)
DIFFERENTIAL HEAT OF SOLUTION PLOT FOR SOLUBILITY OF m-DNB
Figure 8
26

compartments were refilled before the runs were started, but there is a
possibility that some air was still trapped in the diaphragm. This would cause
the cell "constant" to be different for different experimental runs, possible
enough to account for the observed discrepancies.
The results of the two experiments to determine the diffusion coefficient
of m-DNB in the solution of 0. 1 M TEAP-DMSO are summarized in Table 2.
TABLE 2
INITIAL AND FINAL CONCENTRATIONS IN TOP AND BOTTOMCOMPARTMENTS OF THE DIFFUSION CELL FOR TWO RUNS
Run Time Ci Cf Ci Cf
no. (min) top top bot bot(molar) (molar) (molar) (molar)
1 5840 0 .0042 .0381 .0363
2 8225 0 .0075 .0500 .0430
A simple analysis of the above data indicates some discrepancies.
The volumes of the two compartments were determined by filling with water3
and weighing. They were 25. 6 cm. for the bottom compartment and 25. 73
cm. for the top compartment. Using these volumes, it is possible to calcu-
late any one of the four concentrations in Table 2 from the other three. This
can be done by means of the following molar balance:
f i i ftt t t b b b b
The results of the first experimental run do not satisfy Equation (23).
Because of this discrepancy the second run was undertaken. Run #2 gave much
better agreement with Equation (23) and yielded a diffusion coefficient of6.9x1-6 2/sc f
6. 49 x 10 cm /sec. The value of C seems to be in error in run #1. Thist
value was discounted and a "corrected" final dilute concentration of. 0018M
was calculated from Equation (23). The resulting diffusion coefficient was-6 2
5. 81 x 10 cm /sec. The mean value of the two rums, used to analyze the
electrochemical experiments, was D 6. 15 x 10- 6 cm 2/sec ± 101- This leads
27
I2
to a discrepancy of ± 4% in the value of D 3 used in the rotating disk experi-
ments for determining the number of electrons.
The Stokes-Einstein relation for the effective radius of a large mole-
cule diffusing through a continuum of smaller molecules is:
T (2 4 )
Using the value of the diffusion coefficient found and the other known param-
eters of Equation (24), rwas calculated to be 1. 82 x 10 8 cm. This radius isKitagoroski22
near the smallest dimension given by Kitaigorodskii for the m-.DNB mole-
cule from crystallographic studies. The small value for the effective radius
indicates that few, if any, solvent molecules are strongly associated with the
m-DNB molecules in the solvation process in DMSO.
3. Rotating Disk Electrode. As the current through the cell containing
the solutions of m-DNB in DMSO was increased by increasing the voltage out-
put of the power supply, a red substance appeared on the surface of the elec-
trode. This substance appeared to be quite soluble in DMSO. It was also less
dense than the solution and floated to the top of the cell if the electrode was
motionless. If no m-DNB was present in the cell, the red substance did not
appear.
Figure 9 shows the dependence of the voltage on current for the gal-
vanostatic reduction of m-DNB in a . 1 M TEAP-DMSO solution. The voltage
was measured versus the Ag/AgCIO4 reference electrode. The m-DNB con-
centration was . 02 M and the rotation speed was 300 rpm. Two steps in the
reduction are clearly visible and marked by limiting currents at 27 microamps
and 46 microamps for the first and second waves, respectively. These occur
at -1. 57 volts and -2. 25 volts.
Figure 10 shows the voltage-current curves for four different rotation
speeds on the electrode in . 0381 M m-DNB. The potentials in this case are
measured versus the platinum counter electrode. The voltage drop due to
solution resistance has not been subtracted from the data. It can be seen that
the limiting currents for the two waves increase with rotation speed.
28

-3.0
~--2.5 op
zwwwLU
-2.0 0o
C)
4' -1.5
: 00 RPMo0> -1,0 Co .02 M m-DNB
-0.5
0 I I0 20 40 60 80
CURRENT (MICROAMPS)
CURRENT-VOLTAGE CURVE FOR REDUCTION OF m-DNB INTHE ABSENCE OF PROTON DONORS ON THE
ROTATING DISK ELECTRODE
Figure 9
29

-3.0A 281 RPM
0 340 RPM - jV 554 RPM
-2.5 Z0 670 RPM /
71 -
- 2.0I--
0
wz
> C=.0381 M m-DNB
-0.5
00 25 50 75 1OO 125
CURRENT (MICROAMPS)
CURRENT-VOLTAGE CURVES AS A FUNCTION OF ROTATIONSPEED FOR m-DNB IN DMSO IN THE ABSENCE OF
PROTON DONORS
Figure 10
30

The dependence of the limiting currents for the first and seconu waves
on the square root of the rotation speed (in radians/second) is shown in Figures
11 and 12 for different concentrations of m-DNB. These figures show the lin-
ear dependence, predicted by Equation (1), for the range of rotation speed and
concentration investigated. Figures 13 and 14 show the dependence of theI
quantity i1I/0' on the bulk concentration of m-DNB. These also show a linear
dependence, as indicated by Equation (1), with slopes as follows:
iI1st wave: 1 I coul cm 3
- 0. 205 (25)t 2 2C ° mole sec2
" 32nd wave: l 0. 358 coul cm (26)1 0.38 2)W 2cmole sec 2
Using Equation (1) and the values of the diffusion coefficient and kine-
matic viscosity presented earlier, an effective, overall number of electrons
transferred per mole of m-DNB can be calculated for each reduction step.
For the first step the value found was n = 1. 01 i1. For the second step the
value is n = 1.76 ± . 1.
The use of Equation (1) assumes that the flow regime is laminar. This4
can be achieved up to Reynolds numbers of 104 with well balanced disks. The
Reynolds number, given by,
zu D D 2
Re e e- e (27)
was calculated to be 240 based on the diameter of the working electrode and
was 2250 based on the diameter of the whole disk for the maximum rotational
speed used. This is well within the laminar flow regime. Levich 1 4 also
assumes that the thickness of the hydrodynamic boundary layer, given by,
5 = 3.6 W (28)
is much smaller than the diameter of the disk. This enables one to neglect
the effects of the edge of the disks on the solution to the Navier-Stokes equa-
tions. For the lowest rotational speed usel, 6 was calculated to be . 08 ) cm,0
which is small compared to the radius of the disk
31

0~
z
00
LL Z
O Ow
CD Z ZL~
0000 00
32d

0
>0 w
0o 0L 0
zLi 0-
Zo C
WCL u-
w z(n
~i~iIINr'z <W
0000 zc
o0~1 N
00 0 0 0 0(.0 ON 0
(SdAVOJOWJV)
33

9
8 0
7
6-
n,-
-5
4
0 CELL OPENTO ATMOSPHERE
2 A SEALED CELL
I
0 I I I0 0.01 O.Oz 0.03 0.04 0.05
CONCENTRATION OF m-DNB (MOLAR)
DEPENDENCE OF it/wY2 ON CONCENTRATION OF m-DNB INTHE ABSENCE OF PROTON D.3NORS. FIRST WAVE.
Figure 13
34
14 - 0
12
Q- 0
w-o
OI
C o
0U
6
0 CELL OPENTO ATMOSPHERE
4-A SEALED CELL
2
ao I I I I
0 0.01 0.02 0.03 0.04 0.05
CONCENTRATION (MOLAR)
DEPENDENCE OF il/w# ON CONCENTRATION OF m-DNB oNTHE ABSENCE OF PROTON DONORS. SECOND WAVE.
Figure 14
35
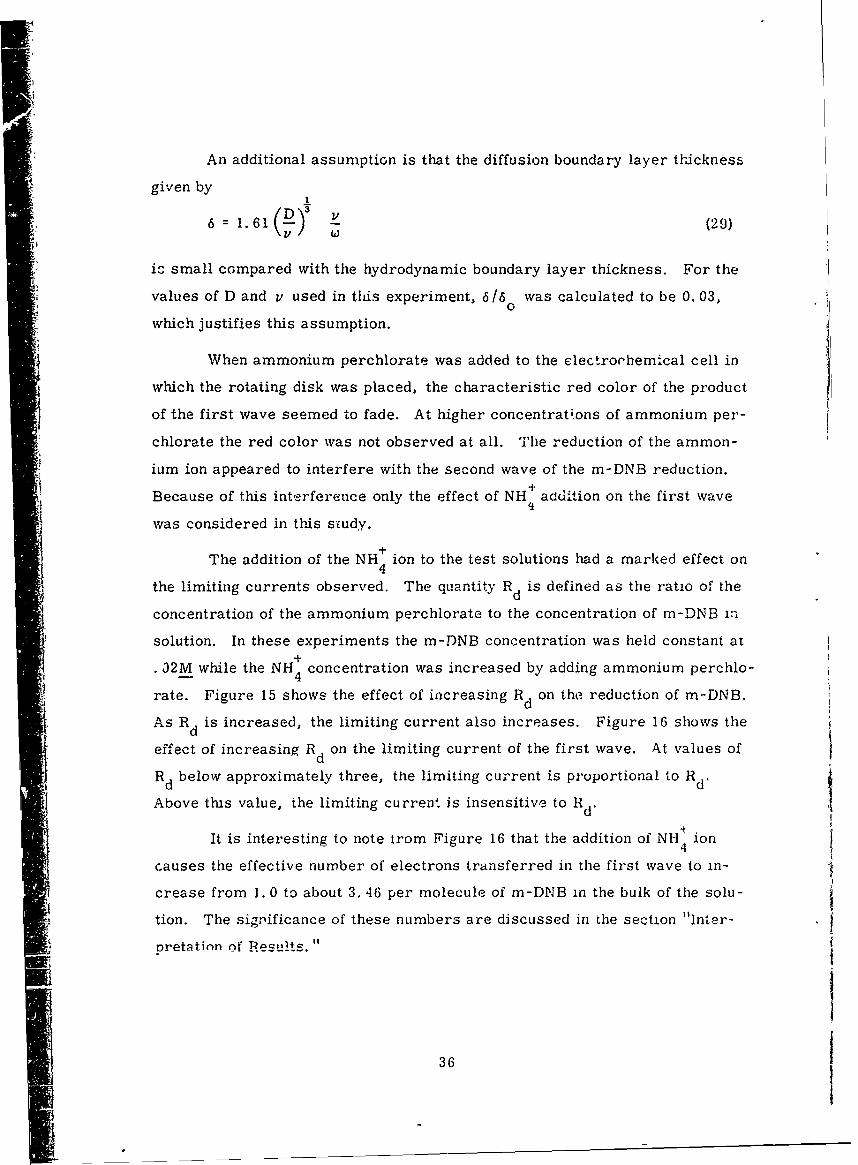
An additional assumption is that the diffusion boundary layer thickness
given by
::6 = 1. 61 (D (29)
ic small compared with the hydrodynamic boundary layer thickness. For thevalues of D and v used in this experiment, 6/6 was calculated to be 0.03,
0
which justifies this assumption.
When ammonium perchlorate was added to the electrochemical cell in
which the rotating disk was placed, the characteristic red color of the product
of the first wave seemed to fade. At higher concentrations of ammonium per-
chlorate the red color was not observed at all. The reduction of the ammon-
ium ion appeared to interfere with the second wave of the m-DNB reduction.
Because of this interference only the effect of NH + addition on the first wave
was considered in this s'udy.
The addition of the NH ion to the test solutions had a marked effect on4
the limiting currents observed. The quantity Rd is defined as the ratio of the
concentration of the ammonium perchlorate to the concentration of m-DNB in
solution. In these experiments the m-DNB concentration was held constant at+
. 32M while the NH concentration was increased by adding ammonium perchlo-4
rate. Figure 15 shows the effect of increasing Rd on the reduction of m--DNB.
As R is increased, the limiting current also increases. Figure 16 shows thed
effect of increasing Rd on the limiting current of the first wave. At values of
Rd below approximately three, the limiting current is proportional to Rd.
Above this value, the limiting curren' is insensitive to Rd.'
It is interesting to note irom Figure 16 that the addition of NH 4 ion
causes the effective number of electrons transferred in the first wave to in-
crease from 1.0 to about 3.46 per molecule of m-DNIB in the bulk of the solu-
tion. The significance of these numbers are discussed in the section "Inter-
pretation of Results.
36

-3.0
Co = 0.02 M
0 Rd = 0.5
-2.5 - 0 R d= .0 J / 0
w V Rd= 1.5zw
Liw,,w -2.0
o-1.5 -
U
-0.5
0 I I I0 20 40 60 80 100
CURRENT (MICROAMPS)
CURRENT-VOLTAL'GE CURVES FOR m-DNB REDUCTION AS AFUNCTION OF PROTON DONOR CONCENTRATION
Figure 15
37
oI1.

7
6
5
CLw I
0
i ADDITIONAL 2.46 e0 ACCORDING TO EQUATION I
4
N
3
3 CO :0.02 M
2
I ELECTRON REDUCTIONI ACCORDING TO EQUATION I
00 2 I I
0 2 4 6 8 10
Rd [m-DNB
THE EFFECT OF ADDITION OF AMMONIUM PERCHLORATE ONTHE "st WAVE REDUCTiON OF m-DNB IN DMSO
Fimire 16
38

4. Potential Step. The application of a potential step to the platinum
sphere electrode in a solution of m-DNB in 0. 1 M TEAP-DMSO caused the
appearance of a soluble red substance at the surface of the electrode. The
physical appearance of the substance was the same as that observed for the
rotating disk experiments.
Figures 17 and 18 are plots of the observed current versus the inverse
of the square root of the time from the application of the potential step. Figure
17 results from the application of -1.7 volts versus the counter electrode. This
corresponds to the first step of the reduction of m-DNB. Figure 18 represents
the second step in the reduction of m-DNB, due to the application of a voltage
step of -2. 3 volts versus the counter electrode. It is clear that, for times be-
tween 0. 2 and 2. 0 seconds, the plots are linear and pass nearly through zero
for each concentration investigated. Tihis indicates that the conditions of the
experiment are such that Equation (6) can be applied.
Figure 19 shows the dependence of the slopes of Figure 17 and 18 on th3
concentrations used. It can be seen that the slopes are proportional to the bulk
concentration of m-DNB, as predicted by Equation (6). This is true for both the
first and second steps. The slopes of the lines in Figure give the following
quantities:
1st step it 2 9 amp sec2 cm1st= ste _L9 (30)o molec
I 1- 3
2nd step I t 2 amp sec 2 cm (31)o molec
Using Equation (6), the value of the diffusion coefficient previously de-
termined, and the area of the electrode, effective overall numbers of electrons
transferred were calculated. Tney are:
1st step n = .95±. 1 (32)
2nd step n = 1.71 1J
39

m - DNB CONCENTRATION7 VV 0.040 M /
o 0.028 M v
0.02M /A 0.017M
o 0.008 M /5 v
× ~v z
00
zw0
/
2
~~~~0
F-o
4cp 0
00 0.5 1.0 1.5 2.0 2.5
t - (SEC / 2 )
CU~RiRENT V&. I IME-'~ FOR 1st WAVE REDUJCTION OF m-DNB INDMSO IN THE ABSENCE OF PROTON DONORS FROM THE
POTENTIAL STEP METHOD
Figure 17
40

"A 0.017 M
0 0.008 M
0
m4
a.
5 ,/110-
x
n.*/
cA'
oz
2 - 0
00.0
0 I I I
0 0.5 1.0 1.5 2.0 2.5t"112 (SEC-' )
CURRENT VS. TIME . FOR 2nd WAVE REDUCTION OF m-DNB
IN DMSO IN THE ABSENCE OF PROTON DONORS FROM
THE POTENTIAL STEP METHOD
I Figure 18
41

6
5
0
04x
w.3
T20 FIRST STEP
A A SECOND STEP
0 I0 10 20 30 40 50
CONCENTRATION OF m-DNB (mole /cm 3 ) X 103
CONCENTRATION DEPENDENCE OF THE QUANTITY i . t/2 FOR 1stAND 2nd WAVES IN REDUCTION OF m-DNB IN THE ABSENCEOF PRO*e ON DONORS FROM THE POTENTIAL STEP METHOD
Figure 19I
424

The maximum time at which data was taken was two seconds. Equa-
tion (6) assumes that the solution in the cell is stagnant. Another way of say-
ing this is that the diffusion boundary layer on the electrode must be much
smaller than the hydrodynamic boundary layer caused by natural convection.17
Delahay gives the concentration as a function or r and t as:
r r-rC(r,t) 1- -- erfc - (33)
C ° r 2D 3 t 2
where r is the radius of the electrode (0. 0825 cm in the present case).o
Figure 2u shows the concentration ratio above as a function of the distance
from the surface of the electrode, at a time two seconds after the application
of the potential step. The diffusion boundary layer thickness, 6, can be defined
by: 1-c ro (6-r) =-1 (34)ar 0
r=r
-3
From Equation (34), 6 was calculated to be 6. 2 x 10 cm after 2 seconds.
At this point the concentration of m-DNB is approximately 82% of the bulk con-
centration. No convection was observed in the cell until many minutes after
the application of the potential step. This was due to the fact that the difference
in density between the products and the reactants was very small. Also, the
total currents involved were quite small (on the order of . I milliamp) so that
very little of the product material was formed. It may be concluded from
these observations that convection was not important during the time range in-
vestigated.
5. Interpretation of Results. The results of the potential step experi-
ments and the rotating disk electrode experiments are in good agreemenit. It
is clear that the first step in the reduction of m-DNB in . IM TEAP-DMSO re-
sults from a single electron transfer. This observation is in good agreement
with the conclusions of other investigators of nitro-compound reductions.
43

I
1.0
I.o-/
0.8 /
0.6
C)1
0.4
TIME IS 2 SECONDSAFTER APPLICATION
0. OF STEP.0.2
0 I I I I
0 2 4 6 8 10
r-r o (cm) x 103
CALCULATED CONCENTRATION PROFILE FOR m-DNB FOR THEPOTENTIAL STEP METHOD
Figure 20
1 44

The second step yields an effective, overall number of electrons of
about 1.75 per molecule of m-DNB in the bulk of the solution. The second step
therefore, adds an effective .75 electrons to the radical anion produced by the
first step. If the second step is also a one electron transfer, this suggests
that only 75% of the radical anion produced by the first step is reacted in the
second step.
Kemula and Sioda I 0 found for nitrobenzene that the second wave height
of the reduction in dimethylformamide was less than proportional to the con-
centration of nitrobenzene at concentrations greater than 3. 5 x 10- 4M. In all32
probability, considering the general reaction system of Hoijtink, the second
wave is the reduction of the radical anion to the di-negative state. The fact that
less than one electron seems to be involved may be due to a complicated mech-
anism involving desorption and/or reaction with the solvent which is not yet
fully understood.
The possibility that the second wave somehow involves an attack on the
second nitro-group of m-DNB is not excluded by the above remarks. However,
it is to be noted that the second wave has been observed for nitrobenzene 10 and
other mono-nitrocompounds 1 3 where thie second nitro-group is not present to be
attacked. Thus, it seems thaL the formation of the radical di-anion is quite
reasonable in this case.
The effect of the addition of ammonium perchlorate on the reduction of
m-DNB appears to correspond to the behavior reported by Given and Peover 8
as class C, involving the protonation of the radical anion formed by the first
electron transfer. The first reduction step in the absence of a proton donor pro-
duced a red substance in both the poteatiostatic step and rotating disk experi-
ments. This corresponds to the formation of the m-DNB radical anion. If the
radical anion disappears by reaction in solution upon addition of proton donors.
one would expect the color to disappear also. The observed loss of red color
upon addition of ammonium ions may thus be considered evidence that a reaction,
such as protonation, occurs.
L 45 _

A detailed mechanism, corresponding to class C behavior of Given and23
Peover was proposed by Koopmann and Gerischer for the reduction of nitro-
benzene in weakly alkaline aqueous solutions. By applying this mechanism to
the case under consideration here, the following system of reactions is pro-
posed:(NO 2 NO 2
NO 2 / )D\ SOLN ADS/s
NO 2 +e N2
NO2 )ADSj t {NO I
No NOH
2 2ADSOL +N~~O NH
ONOH 2 NHO-o\ NNO 2 H+ NO 2 __ NO + (OH) V
~NO~ NO, I NO2 2 /SOLN
No2 + ( N)O2 ; NH ---- NO 2 + (NO2 + NH3 VI
s 2ONOH + NO-OH NO
N+ NH4 + NHNO NO _ NO + ANO 3 V
2 2 SOLN N 2 2VII
It can be seen that the radical amion formed by reaction II serves totransfer electrons in the solution reactions IV and VII. The completioi of
reaction VII requires reaction II to take place four times, providing four radi-
cal anions. Thus the system of reactions above can be condenspd neglecting ,
the effect of the desorption reactions I and III, into the following heterogeneous
ii and homogeneous reactions:
46

NO 2 NO 24 )NO 2 + 4e 4 " )NO 2 VIII2 2
NO- NONO 2 3HNHOH NO2
4 + 3NH NO 3 NO + 3NH3 + (OH) IXNO2 4 O2 23
The overall reaction becomes:NO2 -4 (NOToNO2 + 4 + 3NO- + 3NH 3 + (OH) X
2 2
Equation X predicts that the stoichiometric ratio of NH ions to4
m-DNB in the solution is 3 to 1. Experimentally, this is confirmed by Fig-
ure 16 which shows the current increasing with NH concentration up to a point4
where the 3 to 1 ratio is reached. At this point the ammonium ion concentra-
tion no longer limits the current and the current therefore becomes independent
of NH + concentration.4
Equation (1), which was used to predict the number of electrons trans-
ferred as a function of the limiting current, was derived for the case in which
no chemical reactions were taking place in solution. Equation IX represents
just such a reaction and, consequently, Equation (1) must be modified to ac-
count for this.
In order to modify Equation (1) one must solve the continuity equations
for each species of interest. In this case these species are m-DNB and the
radical anion. It will be assumed that the reaction represented by Equation
IX is fast enough that all reaction takes place within the diffusion layei-. In
this case the species equations become:
dt 1- 0 = D-d2- +-_ k C 2 (35)d2
dC 2 d C 2S0 = D -- kC (35)
dt dx 2 ~ 2
47

where C 1 and C are the concentrations of m-DNB and the radical anion,
respectively.
Jn writing Equations (35) and (36) it has been assumed that the diffusion
coefficients for the two species are equal and independent of concentration. It
has also been assumed that the reaction IX is first order with respect to the
radical anion, and that there is enough NH present that it does not limit the
current, as discussed above.
The boundary conditions of Equations (35) and (36) are as follows. On
the surface of the electrode the concentration of the m-DNB is zero due to the
assumption of diffusion limited current. In addition the flux of the m-DNB
approaching the electrode is just equal to the flux of the radical anion leaving
the electrode. These conditions may be summarized as follows:
at the surface
0=00 (37)
l lj 21 = il/FA
in the bulk of the solution (a distance 6 away from the ele-ctrode)
1 0
(38)C2=0
The solutions of the equations for C1 and C 2 are:
0 1(3 sinh Xx + x cosh X6)C1 3 sinh A6 + X6 cosh6 (39)
C2 = k sinh X6 3 1 2 2 (40)X6 sinhX6 + X 6 cosh X6
where
X - (41)
If the above equations are solved for the limiting current, the resulting re-
lation is:
48

[•+=_ ta1hX 1 FADC O (42)+ _ tanh X 6J
It is interesting to note that the quantity in brackets in Equation (42)
corresponds to the "number of electrons" which would be observed for Equa-
tion (1). At low reaction rates, where X6 is small, this quantity approaches
unity, the true number of electrons transferred per electrode reaction. At
high rates of homogeneous reaction, the value gives the equivalent of a four
electron reduction.
It is clear that the rate of reaction IX has a dependence on the nature of
the proton donor and its ability to donate a proton in DMSO . 1M TEAP solutions.
It is expected that strong proton donors would give a high rate constant while
relatively weak donors, like the ammonium ion, would give somewhat smaller
rate constants. If the value of the limiting current of 3. 46 electrons from
Figure 16 is substituted for the quantity in brackets in Equation 42 an overall
rate constant can be calculated to be:
-1k = 2. 5 sec
In acid solutions the OH ion produced by reaction V would probably
be reacted with another proton donor so that a ratio of 4 to 1 for proton donor
concentration to active species concentration would be observed. This appears
to be the case for benzoic acid in dimethylforrnamide in the reduction of nitro-10
benzene studied by Kemula and Sioda.
49

CONCLUSIONS
Thl.' rcdudion of m-DNB in DSMO at a platinum electrode in the ab
s;;nce of a pr0ton donor takes place in two distinct steps. The first step cor
responds to a one electron transfer and may be postulated to be the for:nation
of the m-DNJ3 radical anion by comparison with the results of Kemula and
S . ' 10 '- d . 10oa. Tne secon step, occurring at more negative potentials than the first,
involves less than one electron, overall. It is assumed that tJ-lis step is act
ually a one electron reduction of the radical anion. This explanation is in ac
cord ~.vith Hoijtink 's 7
general mechanism for hydrocarbon reducbon.
In the presence of ammonium perchlorate, a proton donor, the results
of the experiments performed are consistent with the following mechanism.
The radical anion formed by the first wave reduction reacts in solution with
the ammonium ion in a complex series of reactions similar to those proposed
by Koopmann and Gerischer23
for nitrobenzene reduction. In this way the
radical anion acts as the cha.:ge transfe1· agent in solution-. · The formation of
nitro-phenyl-hydroxylamine as a product, and an overall transfer of four elec
trons is consistent with the mechanism proposed for the first wave in the pres
ence of a proton donor.
i\ reaction rate constant for the homogeneous protonation reaction in
the range of 22-24°C was calculated to be 2. 5 sec. -l by the application of the
species conservation equations to the experimental data.
The use of the rotating disk technique to investigate problems involving
homOf!,Cneous reactions of electrode reaction products enables one to analyze
a r·ather complicated reaction scheme. The greatest uncertainties in the use
of thls technique are those in the determination of the diffusion coefficient. T~e
potentid step teclmique for single electron tranofers provides a good check on
the .,..ot:::~.ting disk t~chnique, but is burdened with time dependent equations for
rnore complkatcd systems.
51 PRECEDING PAGE BLANK

• BIBLIOGRAPHY
l • .la,.,inHk;, Haymond, llif!,lt 1-,'ncrg-y flatteries, Plemur. Oress, New York, 19o7.
J',w, \;, P .• !<. d'Onwy, wHI 1), N. lknnion, "Nonaqueous electrolyte Hystems," U.S. Army Interim ii'I'Jiurf \',;,:.!,Contract \i•1. DA-H-OOCJ-M1C-l66J(T). September 1%7.
:l. Smyrl. W.ll., ''Propnlit•s of dimethyl sulfoxide m• a solvent for innrp;anic compounds," lntrrnal Tt'<'hnil'a! Rt'porl NOLC, !Jept. of Chern. lo'ngr. Unit•ersity of Calif., flt·rlcelr·y, 1963.
L 1\n:ler, .lamt•s N. "l<:kctrochernistry in dimethyl sulfo:dde," ). /:,'[f'ctromwl. ChPm., /4, H9-lH1 (19(17).
:J. \lt'lendrc·s, Carlos A., "Solubilities, conductanccR, viscositien, nnd denRitics of Holutions of se!Pc!ed inorganic corn}HHlntls in dimethylsu~foxidc," U.S. 1ltomir /,'nergy Cnmm. Rt•porl
n:HL-16:1:30, l%S.
(), Spindler. W.C. ''A reviPw of recf'ntly dev~loped liquid ammonia butteries," Pror. AdvanrPs in 811/!t'rv 'f't•f'h. Symposnwr. I, 21-fiS (l9(iS).,
!luijtink. c; . .1 .. J. van ~choot~n. f:. oeBoer, arrd W. Anlbersbeqz:. "The polarnwnphic reduction of conju~.tt!'d LydrocarhonH. IV. The mcdmnism of the reduction pf va;ious ttltcrnnnt and nnnalternnnt hydrocurhons," Rt'c. Tmu. Cltcm., 73, .1Sfi-:H5 ([954).
B. Civen, P. II. and \1. E. PPo\·Pr, "Polnrogruphic reduction of aromatic hydrocurbnns and cnrbonyl nHnpounds in dimeth~·lform01midc in the pr('Rcncc of proton donors,"}. Chcm. Soc· •• /_one/on, 3RS· :F>:1. F>r.o.
lJ. 1\,J!t!wff. l.\1. and T. B. lleddy, "Polarography nnd \'nltnmmetry in dimethylsulfoxide,"}, Drrtrol'ht·m. Sut·., 108. 1}80-9HS (1961).
lO. ht·mula, W. and ll. Siodu, "Polaro~ruphic rc·duetion of nitrohPnz!'nt• and nitrosohcnr.cnf' in tlim~thylforn'"mide," liz;//. :lrrul. ! 1oliw. S1·i., Sl'r. Sri. Chim., 10,107-111 (IQ02).
j i. Kt•nmla. W. anon. Sioda. "l·:leclrnchemical generation and visible l'iJlCl'lrum of nitrobenzene frel' mdH·nl nnion in dimtPhylformumidc," Natun•, /97, .SRR-SHQ (1Q63).
1:!. Ct>skt·, D. H. ;md .\. \!. \lnki, "l<:lectrochcr.ticnl ~eneration of free radicals and their study by !'lee· tr"n spin resonance spcctrosr<lp~·; the nitrobenzene union radical."). :lm. Chrm. Sor., R2, 2o71· ?H76 (l%0).
l:i. Cmilr·. S. H .. Paul ll. Tict>, and .lnmes Q. Chnmhers, "Elt~ctrochemical reduction of nromntic nitrocnmpmmds in tlw pn·scnt·t• of proton donors," ). Phys. Chf'm., 7/, :l517-3S22 0<>67).
li. I ,n·ic'l, \'<'nia:nin (;,, !'lrrsir'nclzemical!lydrodynamirs, Prentice llall, En~lcwond Cliffs,-..;, .J .. 1962.
i :i. lliddifnrd, A. C., "The rotatinfr, disk ~')'Stem," :ld!'fmrt'S in 1:'/i•rtmrllt'mistry and 1:'/rrtrorhemical l·:nginr·crin;;, No. 1. Wdiu·d b~· P. Delahay and C. W. Tobius) lnterscicrH·r, ~f'\\' York, ·l7-ll6, j C)(j(i.
!h. \,·wrn;u;, J•,hn, "Schmidt number corrrction for the rotating disk,"). /'/,ys. Chcm., 70, 1327-1328 ! I 'i(i()\.
17, D·~lahilv, i 1aul, .V<'II' lnslllllrtl'llli!l Ml·tlt()(ls in l~'!ct•frorhcmistry, lntcrl'itif'nce, \'!'w York, }l)!).t.
I'' > () ~ StnkPs, H. 11., ":\n irnprnwd dinphragrn-ccll fnr di(fusion studies, ano !'lome tests o( the method," j. -! m. Uu·rn. Snr .• 7:!, 7(,;~-7(,7 (1 %0).
-53 PRECED1Nt3 PAGE BLANK
':

19. Gordon, A.R., "The diaphragm cell method of measuring diffusion," Annals of the New YorkAcademy of Sci., 46, 285-308 (1945).
20. Stokes, R. If "Integral diffusion coefficients of potassium chloride solutions for calibration of dia-phragm cells,"" J. Am. Chem. Soc., 73, 3527-3528 (1951).
21. Denbigh, Kenneth, The Principles of Chemical Equilibrivn, Cambridge Univ. Press, 1964
22. Kitaigorodskii, A.J., Organic Chemical Crystallography, Consultants Bureau, New York, 1965,p. 365.
23. Koopmann, R. and H. Gerischer, "Untersuchung der elektrochemischen Reduktion Von Nitrobenzoldurch Kombination von ESR-Iessungen mit electroanalytischen Methoden," Berichte der Bun-sengesellschaft fur physikalische Chemie, 70, 127-138 (1966).
24. Douglas, T. B., "Vapor pressure of methyl sulfoxide from 200 to 500. Calculation of the heat ofvaporization," J. Am. Chem. Soc., 73, 799 (1951).
25. Dunnett, J. S. and R. P. H. Gasser, "Electrolyte solutions in dimethyl sulfoxide," Trans. FaradaySoc., 61, 922-927 (1965).
* 26. Meek, D.W., D.K. Straub, and R.S. Drago, "Transition metal ion complexes of dimethyl sulfo,\ide,"J. Am. Chem. Soc., 82, 013-.6016 (1960).
27. Sears, P. G., G. R. Lester. and L. R. Dawson, "A study of the conductance behavior of some uni-valent electrolytes in dimethyl sulfoxide at 250, 't 1. Phys. Chem., 60, 1433-1436 (1956).
28. Schlaefer, H. L. and W. Schaffernicht, "Dimethylsulfoxyd als Losungmittel fur anorganischc Verbin-dungen," Angewandte Chemie, 72, 618-626 (1960).
29. Vogel, Arthur I., A Textbook of Quantitative Inorganic Analysic, Wiley, New York, 1961.
S0. Archer, E. E. and H. W. Jeater, "Determination of small amounts of water in some organic liquids,"The Analyst, 1965, 351-355.
31. Crown Zellerbach Corp., Dimethyl Sulfoxide, Technical Bulletin, 1964.
32. Crown Zellerbach Corp., Dimethyl Sulfoxide-Reaction Medium and Reactant, 1964.
33. Jackson, G. W. and J.S. Dereska, "An electrode mechanism for the electrochemical reduction ofm-dinitrobenzene," J. Electrochem. Soc., 112, 1218-1221 (1965).
34. Nlairanovskii, S. G., "Effect of the double layer structure and of the absorption of electrode reac-tion participants upon polarographic waves in the reduction of organic substances," J. Electroanal.Chem., 4, 166-181 (1962).
4 35. Given, P. If., NI. E. Peover, and J. Schoen, "Polarography of some aromatic carbonyl compounds indimethylformamide," 1. Chem. Soc., London, 1958, 2674-2679.
36. Given, P. II., "Polarography of conjugated systems in dimethylforniamide," J. Chem. Soc., London,1956, -ot4-2687.
37. lloijtink, G.J., "The polarographic reduction of conjugated hydrocarbons. V. The mechanism of thereduction of various alternant and nonalternant hydrocarbons with aromatic and olefinic doublebonds," Rec. Tray. Chim., 73, 895-900 (1954).
38. Iloleck, L. and D. Becher, "lintersuchungen uber den Einfluss der Leitsalzionen auf die polaro-graphische Reduktion aromatischer Nitroverbinduagen in Acetonitril und Dimethylformamid,"J. Electroanal. Chem., 4, 321 (1962).
54

"2. I
APPENDIX I
PURIFICATION OF DMSO
The DMSO used in the solubility experiments had to be purified before
use. The DMSO received from Van Waters and Rogers C~rp. was in a 46 lb.
polyethylene coated container. The principal impurities present were water,
dimethyl sulfide and dimethyl sulfone.
24Douglas used fractional crystallization to purify his DMSO. Dunnett
25and Gasser purified the solvent by drying with calcium oxide followed by
fractional distillation at 20 mm Hg in a 1 meter column. Meek, Straub, and26 27 t
Drago used a similar method. Sears, Lester, and Dawson also employed
fractional distillation at 5 mm Hg. Melendres 5 pretreated the DMSO with so-
dium hydroxide and molecular sieves before distilling at 5 mm Hg.
The fractional distillation method was used to purify the DMSO used in
these studies. The column built for the purpose was modeled after that of28
Schlaeffer and Schaffernicht. They used vacuum distillation because it was
found that DMSO decomposed slightly when distilled at one atmosphere pressure.
The essential features of the distillation apparatus are shown in Figure
21. The column was 1200 mm long with a 25 mm inside diameter. It was well
insulated by asbestos cord and spun glass, and was packed with 6 mm Raschig
rings. The boiling pot was a 2 liter flask, equipped with a heating mantle. At
the top of Lhe column was a water jacketed glass condenser equipped with a tef-
lon stopcock to control the reflux ratio. The collection apparatus consisted of
a graduated dispenser of 100 ml capacity and a collection flask which could be
withdrawn from the system while the column remained under vacuum. The pres-
sure was measured with a mercury manometer and was maintained by a mech-
anical vacuum pump isolated from the system by an acetone-dry ice cold trap.
The entire apparatus was sealed from the atmosphere and was equipped for dry
nitrogen purging.
About 1500 ml of the DMSO as received was placed in the boiling flask
and distilled at 3 mm Hg at about 44 0 C. The first 200 ml of product collected
55

CONDENSER
Ak
THERMOMETER- ~COOLING WATER ]::
"-; "VACUUM CONTROL: STOPCOCKS;
RECEIVER
MANOMETER -
COLD TRAP
INSULATED,PACKEDCOLUMN
PRODUCT FLASK
BOILING. F L A S K B F E
VESSEL
HEATING MANTLE
VACUUM PUMP
DISTILLATION COLUMN APPARATUS
Figure 21
56

were discarded. The next 1000 ml of liquid collected were transferred to a
flask in a glove box containing a dry nitrogen atmosphere. The final 300 ml
were extracted from the boiling flask after the column had been cooled down
and were discarded.
The water content of the purified solvent was tested by Karl Fischer
titration as described in Appendix iII. It was found that the pure DMSO con-
tained less than 100 ppm (. 10 weight per cent) water. Some of the properties
of the distilled DMSO measured in this laboratory by standard methods, are
presented in Table 3. They are in good agreement with the literature values
reported by Butler.4
TABLE 3
MEASURED PROPERTIES OF PURIFIED DMSO AT 250 C
Density 1. 0961 gm/cc
Viscosity 2.011 cp
Dielectric Constant 47.2 ± 216-7 -1
Specific Conductance 3. 48 x 10 ohm cm
57

APPENDIX II
CALIBHATION OF THE SPECTROPHOTOMETER
The ab::;orbance of m-DNB solutions in DMSO was meast"red with r
Dec!anan modci DU spectrophotometer. Five soluticns of known concentration
of m-DNB were p:r~pared und the1r absorbances were measured. The solutions
ran1~ed in concentration from zero to 88. 4 t mg/ml of solution. A wavelength of
'120 mp and a slit width of . 22 mm wer~ found to give excellent ,.;ariations in
the ·1bsorbance. The readjngs taker. are shown in Table 4.
Point . 1 2 3 4 5 G
TABLE 4
CALJBRA'P!ON READINGS
Concentration
0.00 17. 97 30. 72 47.43 67. 97 88.44
Absorbance
0.000 0. 175 0.300 0. 450 0.627 0.785
Since there appear2d to be little scatter in the data, it was decided to
fit tl1(; data to a quadratic equation. In thb way it w .. s found that the concen
tration of an 1.''1known cot1ld be determined more easily than from visually pick-
i.ng off a graph.
·rhe region of inter·est was between 20 and 60 mg /ml, go the points
nea1· the center of the data were used to fit the following equation:
concentration (mg I ml) = A a 2
+ B a + D
where a is the abf:~Orbance reading, and A, B, and D are co11stants to be
determined.
The following values were found to fit the data well~
A=41.8o B = 79. 98 D = 2. 96
(44)
The solid line in Figure 22 is the plot of equation wjth these values for
A, 8, and D. All solubility data w.a..s taken as absorbance readings and con
vertct, to concentration in the above manner.
59 PRECEDING PAGE BLAf'JK

0.8
0.6 O
0
z0
00
00.2
zzo 0
0 20 40 60 80 100CONCENTRATION (MG/ML)
CALIBRATION CURVE FOR DETERMINATION OF m-DNB CONCENTRATION BYSPECTROPHOTOMETRIC MEANS
Figure 22
60
. .. .. . . . . . .. . . " .w° . .
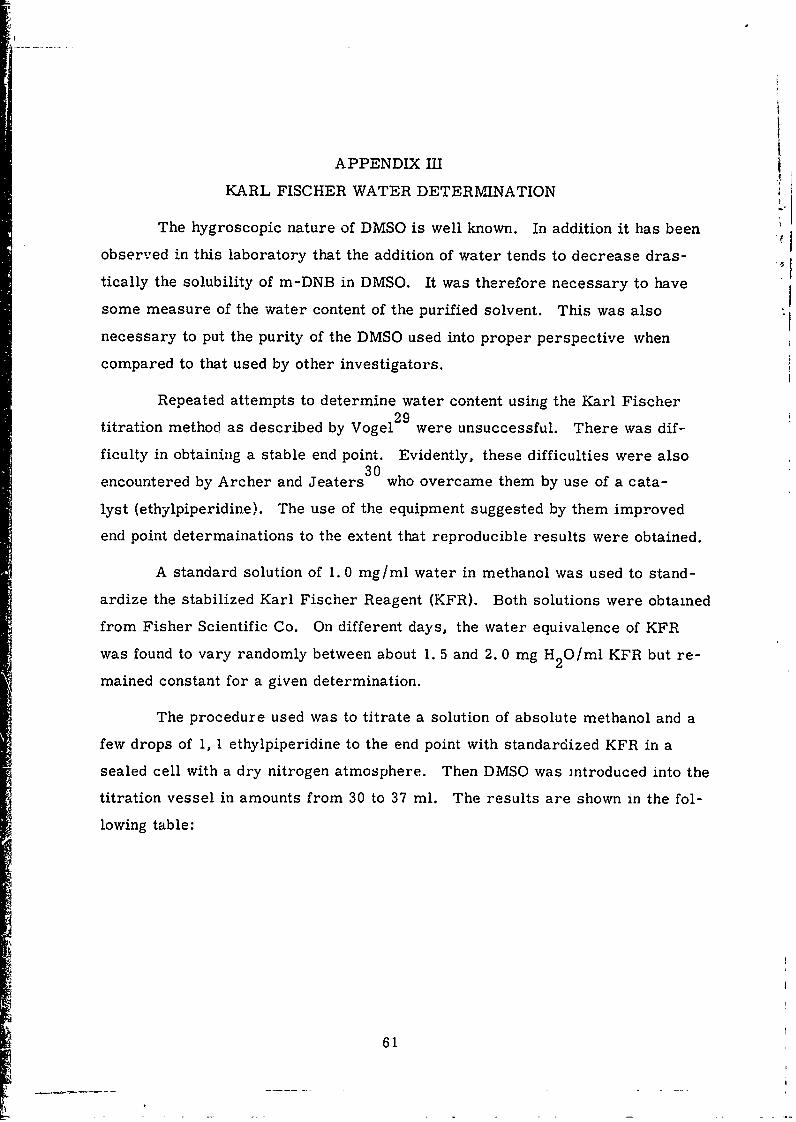
_I
APPENDIX III
KARL FISCHER WATER DETERMINATION
The hygroscopic nature of DMSO is well known. In addition it has been
observed in this laboratory that the addition of water tends to decrease dras-
tically the solubility of m-DNB in DMSO. It was therefore necessary to have
some measure of the water content of the purified solvent. This was also
necessary to put the purity of the DMSO used into proper perspective when
compared to that used by other investigators.
Repeated attempts to determine water content using the Karl Fischer
titration method as described by Vogel 2 9 were unsuccessful. There was dif-
ficulty in obtaining a stable end point. Evidently, these difficulties were also30
encountered by Archer and Jeaters who overcame them by use of a cata-
lyst (ethylpiperidine). The use of the equipment suggested by them improved
end point determainations to the extent that reproducible results were obtained.
A standard solution of 1. 0 mg/ml water in methanol was used to stand-
ardize the stabilized Karl Fischer Reagent (KFR). Both solutions were obtained
from Fisher Scientific Co. On different days, the water equivalence of KFR
was found to vary randomly between about 1. 5 and 2.0 mg H2 0/ml KFR but re-
mained constant for a given determination.
The procedure used was to titrate a solution of absolute methanol and a
few drops of 1, 1 ethylpiperidine to the end point with standardized KFR in a
sealed cell with a dry nitrogen atmosphere. Then DMSO was introduced into the
titration vessel in amounts from 30 to 37 ml. The results are shown in the fol-
lowing table:
61

TABLE 5
KARL FISCHER WATER DETERMINATIONFOR PURIFIED DMSO
Volume DMSO Volume KFR Equivalence Water Contentml ml mg H2 0/ml KFR ppm *
37.05 1.38 1.975 66.830.05 0.50 1.975 29.934.45 0.57 1.975 29.834.5 0.78 1.600 32.9
These samples were taken from the DMSO stored in the dry box for
over two weeks after having been distilled one time. On the basis of these re-
sults, it is assumed that the water content of the DMSO used in the solubility
experiments was below 100 ppm.
-64
62 [

I
APPENDIX IV
MEASUREMENT OF VISCOSITY AThe kinematic viscosity of m-DNB solutions in 0. 1 M TEAP-DMSO was
measured as a function of concentration. A Cannon Ubbelhode Semi-Micro
viscometer was used. It was calibrated to have a constant of 0. 003910
centistokes/sec. Measurements were done in a constant temperature oil vis-
cometer bath at 24.20C. Three drop times were recorded at each concentra-
tion of m-DNB. The following table gives the results:
Conc. m-DNB v (centistokes)
0.00 1. 958, 1. 954, 1. 9610.01 M 1. 989, 1. 982, 1. 9850.02 M 2. 008, 2. 012, 2. 0180.04 M 2. 037, 2. 045, 2. 037
The data is plotted in Figure 23. The values of v for zero concentration agree
very well with those compiled for pure DMSO by Butler.4
The purpose of the kinematic viscosity measurements was to get a value
which could be used in the expression for the limiting current in rotating disk
experiments. Since the kinematic viscosity appears to the 1/6 power, in that
expression, the dependence is very insensitive. Therefore an average value
of v = . 513 (cm 2/sec) 1 / 6 was used for all solutions of m-DNB in DMSO for
these calculations.
63

2.025
--- 0oT.
0
2.000-
LU/
w8
1.975
1.950 " [' I
0 0.01 0.02 0.03 0.04 0.05
CONCENTRATION OF m-DNB (MOLAR)
KINEMATIC VISCOSITY OF DMSO SOLUTIONS AS A FUNCTION OF
m-DNB CONCENTRATION
Figure 23
64

APPENDIX V
TEMPERATURE DEPENDENCE OF DIFFUSION COEFFICIENT
A determination of the heights of the first and second waves as a func-
tion of temperature was done. It was found that the ratio of the wave heights in
the absence of a proton donor was invariant with temperature, as shown by
Figure 24. It was hoped that the temperature measurements would held clarify
the kinetic steps involved in the second electron transfer. However, the results
did not allow additional conclusions to be drawn on this matter.
The temperature measurements were valuable in that they made pos-
sible the calculation of the diffusion coefficient of m-DNB as a function of tem-
perature, assuming a 1 electron transfer for the first step. The results are
shown in Figure 25. A plot of in D versus l/T gives a straight line, as indi-
cated by Figure 26. The slope of this line indicates that the activation energy for
diffusion of m-DNB in DMSO is about 3. 42 Kcal/mole.
65
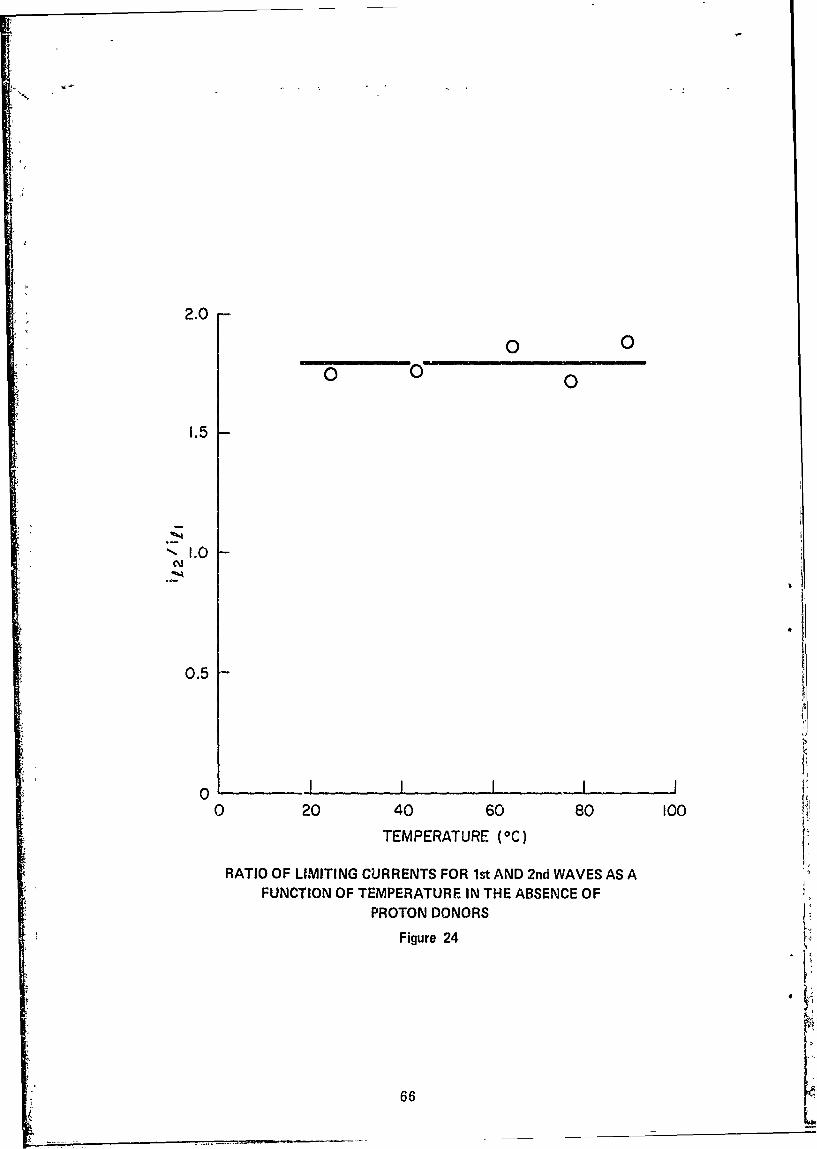
2.0
0 0b 0 0
1.5
0.5
0 20 40 60 80 100
TEMPERATURE (°C)
RATIO OF LIMITING CURRENTS FOR 1st AND 2nd WAVES AS AFUNCTION OF TEMPERATURE IN THE ABSENCE OF
PROTON DONORS
Figure 24 t
6
"'6 6 P [
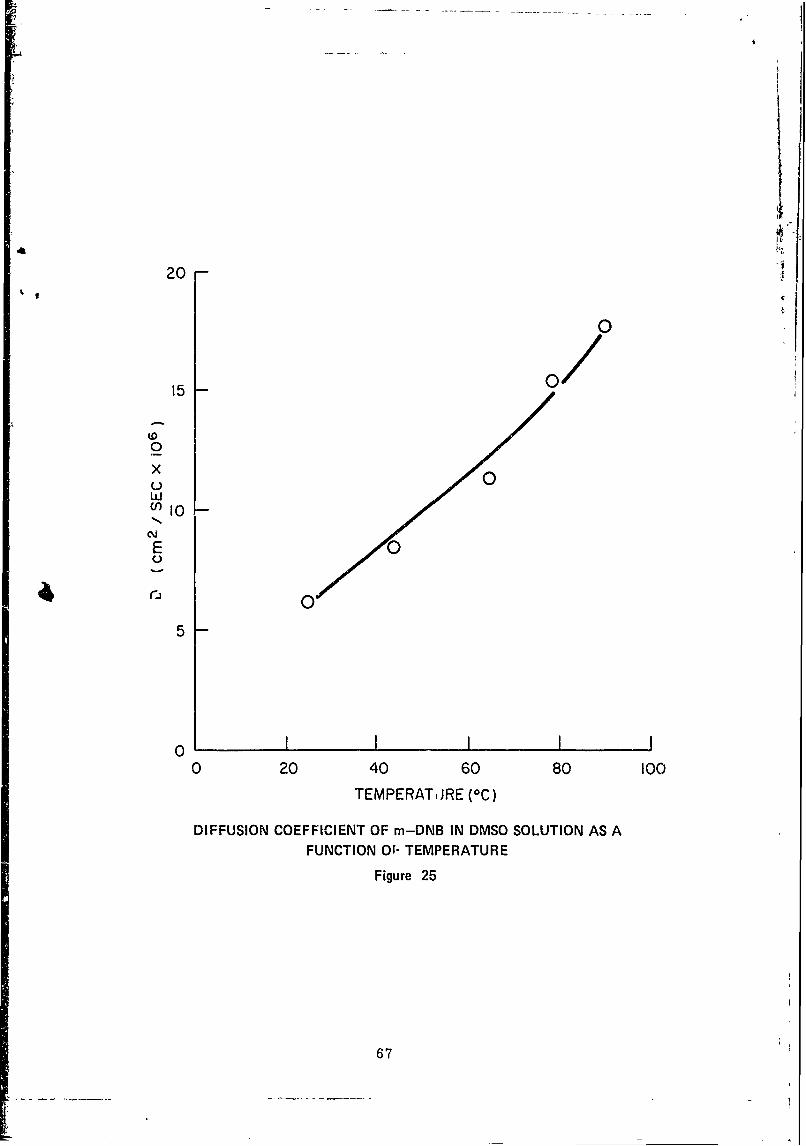
II
20
15 O
x 0w
1010 0E
0
5
0 1I I I0 20 40 60 80 100
TEMPERAT,)RE (0C)
DIFFUSION COEFFICIENT OF m-DNB IN DMSO SOLUTION AS AFUNCTION Or- TEMPERATURE
Figure 25
67
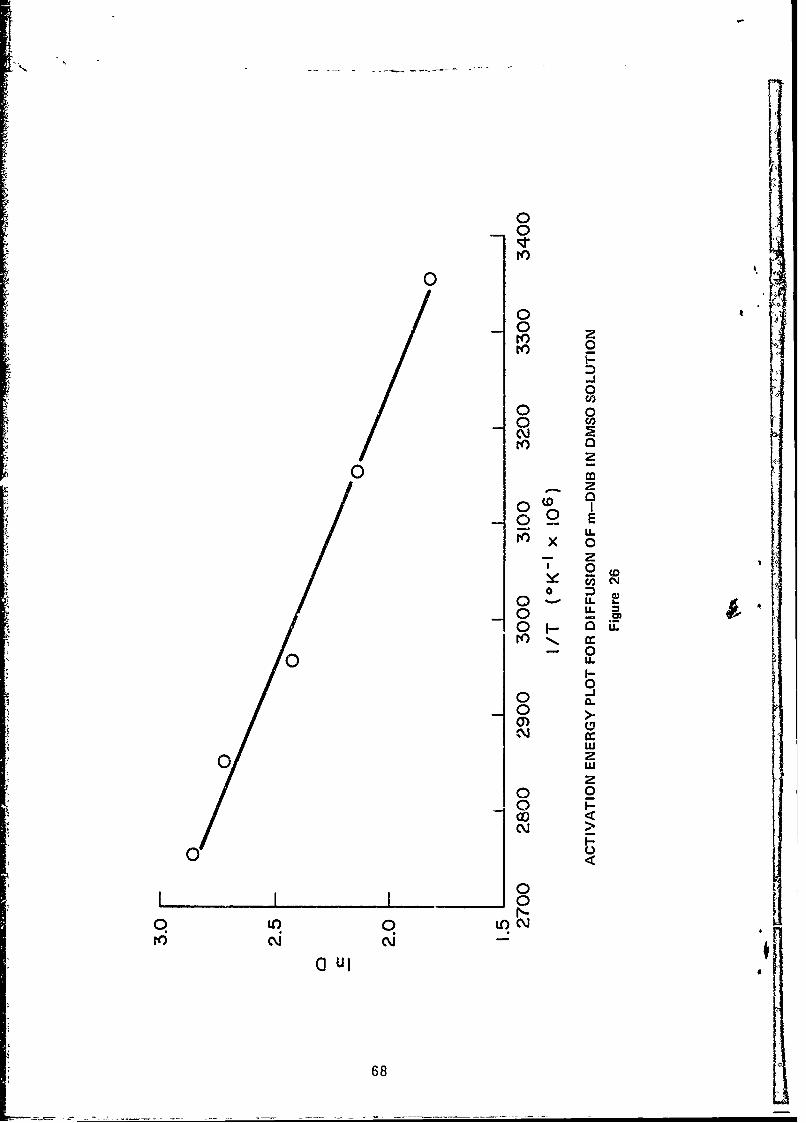
0
N()I
0 0o
zo
LL0
0 (
0 LLo z1
09 E
00 Cz02 >
O 0
0 I0q 9 L(0r() N N<
aul gT>
68)


![SOLUBILITY AND SOLUBILITY PRODUCT - Instruct · SOLUBILITY AND SOLUBILITY PRODUCT [MH 5; 16.1 & 16.2] • In this section we are going to consider the solubility of ionic solids in](https://static.fdocuments.in/doc/165x107/5ae1efb27f8b9a90138bbc8f/solubility-and-solubility-product-instruct-and-solubility-product-mh-5-161.jpg)