Ironshore Inc. Consolidated Financial Statements … 2015 GROUP PUBLIC... · We have audited the...
39
Ironshore Inc. Consolidated Financial Statements December 31, 2015
Transcript of Ironshore Inc. Consolidated Financial Statements … 2015 GROUP PUBLIC... · We have audited the...

Ironshore Inc.
Consolidated Financial Statements
December 31, 2015

A member firm of Ernst & Young Global Limited
Ernst & Young LLP 5 Times Square New York, NY 10036-6530
Tel: +1 212 773 3000 Fax: +1 212 773 6350 ey.com
1
Report of Independent Auditors
The Board of Directors and Shareholders Ironshore Inc.
We have audited the accompanying consolidated financial statements of Ironshore Inc., which comprise the consolidated balance sheets as of December 31, 2015 and 2014, and the related consolidated statements of operations and comprehensive income, changes in shareholders’ equity, and cash flows for the years then ended, and the related notes to the consolidated financial statements.
Management’s Responsibility for the Financial Statements
Management is responsible for the preparation and fair presentation of these consolidated financial statements in accordance with accounting principles generally accepted in the United States of America; this includes the design, implementation, and maintenance of internal control relevant to the preparation and fair presentation of consolidated financial statements that are free from material misstatement, whether due to fraud or error.
Auditor’s Responsibility
Our responsibility is to express an opinion on these consolidated financial statements based on our audits. We conducted our audits in accordance with auditing standards generally accepted in the United States of America. Those standards require that we plan and perform the audit to obtain reasonable assurance about whether the financial statements are free from material misstatement.
An audit involves performing procedures to obtain audit evidence about the amounts and disclosures in the consolidated financial statements. The procedures selected depend on the auditor’s judgment, including the assessment of the risks of material misstatement of the consolidated financial statements, whether due to fraud or error. In making those risk assessments, the auditor considers internal control relevant to the entity’s preparation and fair presentation of the consolidated financial statements in order to design audit procedures that are appropriate in the circumstances, but not for the purpose of expressing an opinion on the effectiveness of the entity’s internal control. Accordingly, we express no such opinion. An audit also includes evaluating the appropriateness of accounting policies used and the reasonableness of significant accounting estimates made by management, as well as evaluating the overall presentation of the financial statements.
A member firm of Ernst & Young Global Limited
2
We believe that the audit evidence we have obtained is sufficient and appropriate to provide a basis for our audit opinion.
Opinion
In our opinion, the consolidated financial statements referred to above present fairly, in all material respects, the financial position of Ironshore Inc. as of December 31, 2015 and 2014, and the results of their operations and their cash flows for the years then ended in accordance with accounting principles generally accepted in the United States of America.
March 10, 2016

See accompanying notes to the consolidated financial statements.
3
Ironshore Inc.
Consolidated Balance Sheets
As of December 31, 2015 and 2014 (Expressed in thousands of U.S. dollars, except share data)
2015 2014
ASSETS
Fixed maturity securities, at fair value (amortized cost: 2015 - $4,451,226;
2014 - $4,031,724) $4,425,968 $4,044,195
Equity securities, at fair value (cost: 2015 - $202,014; 2014 - $209,265) 200,724 207,090
Short term investments, at cost which approximates fair value 3,979 40,877
Other investments 90,866 61,089
Total investments 4,721,537 4,353,251
Cash and cash equivalents 381,604 328,797
Accrued investment income 21,057 19,351
Premiums receivable 494,834 514,035
Reinsurance recoverable on unpaid losses 776,787 693,298
Reinsurance recoverable on paid losses 59,034 66,397
Deferred acquisition costs 106,939 125,098
Prepaid reinsurance premiums 372,612 305,647
Goodwill and other intangible assets 76,226 79,354
Deferred tax asset 37,228 12,191
Receivable for securities sold 9,179 17,904
Other assets 193,036 184,592
Total assets $7,250,073 $6,699,915
LIABILITIES
Reserve for losses and loss adjustment expenses $3,197,541 $2,838,158
Unearned premiums 1,304,591 1,310,908
Insurance and reinsurance balances payable 228,243 240,594
Payable for securities purchased 21,761 11,388
Other liabilities 183,383 111,477
Debt obligations 347,992 347,629
Total liabilities 5,283,511 4,860,154
COMMITMENTS AND CONTINGENCIES
SHAREHOLDERS' EQUITY
Common shares, 400,000,000 authorized, par value $0.01 per share
(2015: 140,657,340; 2014: 136,625,637), shares issued and outstanding 1,407 1,366
Additional paid-in capital 1,431,794 1,364,762
Accumulated other comprehensive loss (6,149) (8,074)
Retained earnings 539,510 481,707
TOTAL SHAREHOLDERS' EQUITY 1,966,562 1,839,761
TOTAL LIABILITIES AND SHAREHOLDERS' EQUITY $7,250,073 $6,699,915

See accompanying notes to the consolidated financial statements.
4
Ironshore Inc.
Consolidated Statements of Operations and Comprehensive Income
For the years ended December 31, 2015 and 2014 (Expressed in thousands of U.S. dollars, except share data)
2015 2014
REVENUES
Gross premiums written $2,163,852 $2,210,554
Reinsurance premiums ceded (684,028) (591,374)
Net premiums written 1,479,824 1,619,180
Change in unearned premiums 63,427 (92,184)
Net premiums earned 1,543,251 1,526,996
Net investment income 113,300 97,043
Net realized and unrealized gains (losses) on investments (48,351) 28,039
Net foreign exchange losses (11,054) (5,283)
Other income 50,413 33,566
Total revenues 1,647,559 1,680,361
EXPENSES
Losses and loss adjustment expenses 1,010,218 1,077,274
Acquisition expenses 210,053 214,708
General and administrative expenses 322,728 279,101
Non-recurring transaction expenses 39,529 -
Interest expense 22,169 21,906
Total expenses 1,604,697 1,592,989
Income before tax benefit (expense) 42,862 87,372
Income tax benefit (expense) 14,941 (2,906)
Net income 57,803 84,466
Net loss attributable to non-controlling interest - (11)
Net income attributable to Ironshore Inc. $57,803 $84,477
COMPREHENSIVE INCOME
Net income $57,803 $84,466
Other comprehensive income, before tax
Equity gains from foreign currency translation 3,851 6,909
Losses on intra-entity foreign currency transactions (1,926) (4,662)
Other comprehensive income, before tax 1,925 2,247
Income tax on other comprehensive income - -
Other comprehensive income, net of tax 1,925 2,247
Comprehensive income 59,728 86,713
Comprehensive loss attributable to non-controlling interests - (11)
Comprehensive income attributable to Ironshore Inc. $59,728 $86,724
Earnings per share:
Weighted average common shares outstanding - Basic 137,195,272 135,185,765
Weighted average common shares outstanding - Diluted 143,106,668 139,934,730
Net income (loss) per common share outstanding - Basic $0.42 $0.62
Net income (loss) per common share outstanding - Diluted $0.41 $0.61

See accompanying notes to the consolidated financial statements.
5
Ironshore Inc.
Consolidated Statements of Changes in Shareholders’ Equity
For the years ended December 31, 2015 and 2014 (Expressed in thousands of U.S. dollars)
2015 2014
COMMON SHARES
Balances as of beginning of year $1,366 $1,362
Issuance of shares, net of forfeitures 377 8
Repurchase of shares (336) (4)
Balance as of end of year 1,407 1,366
ADDITIONAL PAID-IN CAPITAL
Balance as of beginning of year 1,364,762 1,354,164
Issuance of shares, net of forfeitures 466,387 2,590
Repurchase of shares (469,813) (5,189)
Contribution of additional paid-in capital 36,947 -
Stock compensation expense 19,450 7,927
Tax benefit on stock compensation expense 8,088 722
Modification of liability awards to equity 5,973 5,897
Purchase of non-controlling interest - (1,349)
Balance as of end of year 1,431,794 1,364,762
ACCUMULATED OTHER COMPREHENSIVE LOSS
Balance as of beginning of year (8,074) (10,321)
Equity gains from foreign currency translation 3,851 6,909
Losses on intra-entity foreign currency transactions (1,926) (4,662)
Balance as of end of year (6,149) (8,074)
RETAINED EARNINGS
Balance as of beginning of year 481,707 397,230
Net income attributable to Ironshore Inc. 57,803 84,477
Balance as of end of year 539,510 481,707
TOTAL IRONSHORE INC. SHAREHOLDERS' EQUITY 1,966,562 1,839,761
NON-CONTROLLING INTEREST
Balance as of beginning of year - 3,909
Net loss attributable to non-controlling interest - (11)
Purchase of non-controlling interest - (3,898)
Balance as of end of year - -
TOTAL SHAREHOLDERS' EQUITY $1,966,562 $1,839,761

See accompanying notes to the consolidated financial statements.
6
Ironshore Inc.
Consolidated Statements of Cash Flows
For the years ended December 31, 2015 and 2014 (Expressed in thousands of U.S. dollars)
2015 2014
CASH FLOWS PROVIDED BY OPERATING ACTIVITIES:
Net income $57,803 $84,466
ADJUSTMENTS TO RECONCILE NET INCOME TO NET CASH
PROVIDED BY OPERATING ACTIVITIES:
Amortization and depreciation 7,906 10,478
Stock compensation expense 22,953 11,866
Amortization of fixed maturity securities 23,444 19,724
Net realized and unrealized (gains) losses on investments 48,351 (28,039)
Deferred tax benefit (25,065) (7,931)
CHANGES IN OPERATING ASSETS AND LIABILITIES:
Accrued investment income (1,765) (1,031)
Premiums receivable 13,138 (60,928)
Reinsurance recoverable on unpaid losses (88,342) (109,272)
Reinsurance recoverable on paid losses 6,551 (5,993)
Deferred acquisition costs 16,027 (2,683)
Prepaid reinsurance premiums (68,945) (33,088)
Other assets 2,018 5,370
Reserve for losses and loss adjustment expenses 381,347 681,891
Unearned premiums 4,691 116,772
Insurance and reinsurance balances payable (8,461) 59,492
Other liabilities 48,699 15,499
Net cash provided by operating activities 440,350 756,593
CASH FLOWS USED IN INVESTING ACTIVITIES:
Purchases of fixed maturity securities (3,974,331) (3,723,875)
Purchases of short term investments (22,055) (278,929)
Purchases of equity securities (134,894) (347,221)
Purchases of other investments (83,236) (58,497)
Proceeds from sales of fixed maturity securities 3,086,889 2,654,490
Proceeds from maturity of fixed maturity securities 430,589 401,470
Proceeds from sales of short term investments 58,956 283,885
Proceeds from sales of equity securities 135,978 278,630
Proceeds from sales of other investments 61,724 1,726
Purchases of fixed assets (9,890) (9,368)
Issuance of note receivable - (3,741)
Net cash used in investing activities (450,270) (801,430)

See accompanying notes to the consolidated financial statements.
7
Ironshore Inc.
Consolidated Statements of Cash Flows
For the years ended December 31, 2015 and 2014 (Expressed in thousands of U.S. dollars)
2015 2014
CASH FLOWS PROVIDED BY FINANCING ACTIVITIES:
Proceeds from issuance of common shares 466,764 2,600
Repurchase of shares (470,149) (5,156)
Contribution of additional paid-in capital 36,965 -
Contribution of deferred merger consideration 35,413 -
Issuance of debt - 100,000
Purchase of non-controlling interest - (5,247)
Net cash provided by financing activities 68,993 92,197
Net increase in cash and cash equivalents 59,073 47,360
Cash and cash equivalents as of beginning of year 328,797 286,700
Effect of exchange rates on cash and cash equivalents (6,266) (5,263)
CASH AND CASH EQUIVALENTS AS OF END OF YEAR $381,604 $328,797
SUPPLEMENTAL DISCLOSURES OF CASH FLOW INFORMATION:
Income taxes paid $20,639 $12,578
Interest paid $21,631 $21,393

Ironshore Inc.
Notes to consolidated financial statements (Expressed in thousands of U.S. dollars, except share data)
8
1. Nature of the business
Ironshore Inc. (“Ironshore”), a Cayman Islands corporation, through its subsidiaries (collectively referred to as the “Company”)
provides specialty commercial property and casualty coverage for risks located throughout the world.
The Company’s principal operating subsidiary, Ironshore Insurance Ltd. (“Ironshore Insurance”), is registered as a Class 4 insurer
under The Insurance Act 1978 in Bermuda, related regulations and amendments thereto (the “Bermuda Insurance Act”). Ironshore
Insurance writes primarily property catastrophe and property all-risks coverage for small to mid-sized commercial risks. Ironshore
Insurance includes Ironshore Insurance Ltd, Singapore Branch, which is registered as a direct insurer to carry on general insurance
in Singapore effective January 26, 2012, and Ironshore Insurance Ltd., Canada Branch, which writes property and casualty
insurance for Canadian-domiciled risks effective March 29, 2014.
The Company’s U.S. platform consists of Ironshore Holdings (U.S.) Inc. (“Ironshore Holdings U.S.”), a Delaware corporation, and
its principal subsidiaries Ironshore Indemnity Inc., (“Ironshore Indemnity”), a Minnesota domiciled insurer, and Ironshore
Specialty Insurance Company (“Ironshore Specialty”), an Arizona domiciled insurer (collectively referred to as the “U.S.
companies”). The U.S. companies serve the property and specialty casualty insurance market sectors. The U.S. companies also
insure all classes of aviation and aerospace risks worldwide through an agreement with Starr Aviation Agency, Inc.
The Company’s International platform includes Ironshore International Ltd. (“IIL”) and a subsidiary company, Ironshore
Corporate Capital Ltd. (“ICCL”), both of which were incorporated in England and Wales. The International platform also includes
Pembroke JV Limited (“PJV”), its principal subsidiary, Pembroke Managing Agency Limited (“PMA”), and Ironshore Europe
Limited (“IEL”), an Irish corporation. PMA operates within the Lloyd’s of London (“Lloyd’s”) insurance market through
Syndicate 4000 and underwrites a portfolio of specialist lines products including financial institutions, professional liability,
marine and other select specialist lines. IEL commenced underwriting a diverse range of specialty lines in 2011.
Iron-Starr Excess Agency Ltd (“Iron-Starr Excess” or the “Agency”) acts as a specialty lines insurance and reinsurance managing
general agency in the offering, issuance and administration of insurance policies written on an equal subscription basis by
Ironshore Insurance and Starr Insurance and Reinsurance Limited (“SIRL”). In July 2014, Iron-Starr Excess added Hamilton Re, a
Bermuda-based property and casualty reinsurer, as subscribing insurer in order to increase capacity for full suites of products being
offered. Iron-Starr Excess writes financial lines, healthcare and catastrophic excess casualty insurance products, targeting Fortune
2000 and other clients purchasing catastrophe excess coverage.
2. Significant accounting policies
Basis of presentation These consolidated financial statements have been prepared in accordance with accounting principles generally accepted in the
United States of America (“U.S. GAAP”) and include the financial statements of Ironshore and its wholly owned and majority
owned subsidiaries. All significant inter-company balances and transactions have been eliminated in consolidation. Certain prior
year amounts have been reclassified to conform to the current year presentation.
Use of estimates in financial statements
The preparation of financial statements in conformity with U.S. GAAP requires management to make estimates and assumptions
that affect the reported and disclosed amounts of assets and liabilities and disclosure of contingent assets and liabilities as of the
date of the financial statements and the reported amounts of revenues and expenses during the reporting period. Actual results
could differ materially from those estimates. The major estimates reflected in the Company’s consolidated financial statements
include, but are not limited to, the reserves for losses and loss adjustment expenses, reinsurance recoverable balances including
allowances for reinsurance recoverables deemed uncollectible, estimates of written and earned premium, the fair value of
investments, recoverability of intangible assets and the net deferred tax asset or liability.
Premiums and related expenses
Premiums. Direct insurance and assumed facultative reinsurance premiums are recognized as earned on a pro rata basis over the
applicable policy or contract periods. For assumed treaty reinsurance written on a losses occurring basis, premiums written are
earned on a pro rata basis over the risk period. For assumed treaty reinsurance written on a risks attaching basis, premiums written
are earned on a pro rata basis over the periods of the underlying policies. Premiums may include estimates based on information

Ironshore Inc.
Notes to consolidated financial statements (Expressed in thousands of U.S. dollars, except share data)
9
received from brokers, ceding insurers and insureds, and any subsequent differences from such estimates are recorded in the period
in which they are determined. In each case, the portions of the premiums written applicable to the unexpired terms are recorded as
unearned premiums.
Assumed retroactive loss portfolio transfer (“LPT”) contracts in which the insured loss events occurred prior to the inception of the
contract are evaluated to determine whether they meet the established criteria for reinsurance accounting. If reinsurance accounting
is appropriate, premiums written are fully earned and corresponding losses and loss adjustment expenses recognized at the
inception of the contract. The contracts can cause significant variances in gross premiums written, net premiums written, net
premiums earned, and net incurred losses in the years in which they are written. Reinsurance contracts sold not meeting the
established criteria for reinsurance accounting are recorded using the deposit method.
A premium deficiency reserve is established when expected claim payments or incurred losses, loss adjustment expenses and
administrative expenses exceed the premiums to be earned over the remaining contract period. For the purposes of determining
whether a premium deficiency reserve exists contracts are grouped in a manner consistent with how policies are marketed,
serviced and measured. Anticipated investment income is utilized as a factor in the premium deficiency reserve calculation.
Acquisition expenses Acquisition expenses are costs that vary with, and are directly related to, the production of new and renewal business, and consist
principally of commissions and brokerage expenses. The Company does not capitalize internal costs associated with the
production of new business. Acquisition expenses are shown net of commissions on reinsurance ceded. These costs are deferred
and amortized over the periods in which the related premiums are earned. Deferred acquisition costs are limited to their estimated
realizable value based on the related unearned premiums. Anticipated loss and loss adjustment expenses based on historical and
current experience and anticipated investment income related to those premiums are considered in determining the recoverability
of deferred acquisition costs. Acquisition expenses also include profit commission. Profit commissions are recognized when
earned.
Reserve for losses and loss adjustment expenses
The reserve for losses and loss adjustment expenses includes reserves for unpaid reported losses and for losses incurred but not
reported. The reserve for unpaid reported losses and loss expenses is established by management based on reports from loss
adjusters, ceding companies and insureds and represents the estimated ultimate cost of events or conditions that have been reported
to, or specifically identified, by the Company. The reserve for incurred but not reported losses and loss adjustment expenses is
established by management based on actuarially determined estimates of ultimate losses and loss expenses. Inherent in the estimate
of ultimate losses and loss expenses are expected trends in claim severity and frequency and other factors which vary significantly
as claims are settled. Accordingly, ultimate losses and loss expenses may differ materially from the amounts recorded in the
consolidated financial statements. These estimates are reviewed regularly and, as experience develops and new information
becomes known, the reserves are adjusted as necessary. Such adjustments, if any, are recorded in earnings in the periods in which
they become known and are accounted for as changes in estimates.
Ceded Reinsurance In the normal course of business, the Company may seek to mitigate underwriting risk that could cause unfavorable results by
reinsuring certain amounts of risk with reinsurers. Reinsurance does not relieve the Company of its primary obligation to the
insured. The accounting for reinsurance ceded depends on the method of reinsurance. If the policy is on a losses occurring basis,
reinsurance premiums ceded and associated commissions are expensed on a pro rata basis over the period reinsurance coverage is
provided. If the policy is on a risk attaching basis, reinsurance premiums ceded and associated commissions are expensed in line
with gross premiums earned to which the risk attaching policy relates. Prepaid reinsurance premiums represent the portion of
premiums ceded on the unexpired terms of the policies purchased. Reinsurance commissions that will be earned in the future are
deferred and recorded as deferred acquisition costs on the balance sheets.
Reinsurance recoverable is presented on the balance sheets net of any reserves for uncollectible reinsurance. The method of
determining the reinsurance recoverable on unpaid losses and loss adjustment expenses involves actuarial estimates in a manner
consistent with the determination of unpaid losses and loss adjustment expenses.
Ceded reinstatement premiums are estimated after the occurrence of a significant loss and are recorded in accordance with the
contract terms based upon the ultimate loss estimates associated with each contract. Ceded reinstatement premiums are earned over

Ironshore Inc.
Notes to consolidated financial statements (Expressed in thousands of U.S. dollars, except share data)
10
the remaining contract period. Ceded reinstatement premiums earned were $5,905 and $8,296 for the years ended December 31,
2015 and 2014, respectively.
Certain ceded reinsurance contracts do not transfer underwriting risk and are accounted for using the deposit method of
accounting. Fees are accounted for as income based on the terms of the contract. A deposit asset is recorded at the inception of the
contract based on the consideration transferred. Corresponding changes in the amount of the deposit asset reflecting actual and
expected future loss payments are recorded as a credit or charge to interest income.
Investments The Company’s investments in fixed maturity and equity securities are classified as trading and are carried at fair value, with
related unrealized gains and losses recorded in net realized and unrealized gains (losses) on investments included in the statement
of operations and comprehensive income. The Company believes that accounting for its investments as trading with all changes in
fair value included in income reduces an element of management judgment as the Company is not required to perform an analysis
of its investments for other-than-temporary impairment.
Fair values of the Company’s fixed maturity and equity securities are based on quoted market prices or, when such prices are not
available, by reference to broker or underwriter bid indications and/or internal pricing valuation techniques. Investment
transactions are recorded on a trade date basis with balances pending settlement recorded as receivable for investments sold or
payable for investments purchased.
For mortgage-backed and other asset-backed debt securities, fair value includes estimates regarding prepayment assumptions,
which are based on current market conditions. Amortized cost in relation to these securities is calculated using a constant effective
yield based on anticipated prepayments and estimated economic lives of the securities. When actual prepayments differ
significantly from anticipated prepayments, the effective yield is recalculated to reflect actual payments to date. Changes in
estimated yield are recorded on a retrospective basis, which results in future cash flows being used to determine current book
value.
Realized gains and losses on sales of investments are determined on the average cost basis.
Net investment income includes interest income on fixed maturity securities, recorded when earned, dividend income on equity
investments, recorded when declared and the amortization of premiums and discounts on investments. The amortization of
premium and accretion of discount is computed using the effective interest rate method. Net investment income is recorded net of
investment expenses.
Short term investments Short term investments, which are managed as part of the Company’s investment portfolio, have an original maturity of one year
or less when purchased, and are carried at cost which approximates fair value.
Other investments
Other investments include investments in promissory notes and investments in closed-end limited partnerships that invest
primarily in commercial real estate debt in North America and Europe. It also includes investment in a Cayman-island registered
partnership fund that primarily invests in portfolio companies in China, Hong Kong, Macau and/or Taiwan. Investments in
promissory notes are carried at cost with interest income recorded in net investment income. Investments in closed-end limited
partnerships and Cayman-island registered fund are carried at fair value, with related unrealized gains and losses recorded in net
realized and unrealized gains (losses) on investments included in the statement of operations and comprehensive income.
Cash and cash equivalents The Company considers all investments with an original maturity of ninety days or less as cash equivalents.
Other Assets Investments in which the Company had significant influence over the operating and financial policies of the investee are classified
as other assets and are accounted for under the equity method of accounting. Under this method, the Company records its
proportionate share of income or loss from such investments in its results for the period and includes these investments in other
assets in its consolidated financial statements.

Ironshore Inc.
Notes to consolidated financial statements (Expressed in thousands of U.S. dollars, except share data)
11
Also included in other assets are depreciable long-lived assets such as information technology equipment, software, leasehold
improvements, furniture and fixtures that are carried at cost less accumulated depreciation and are depreciated on a straight-line
basis over their estimated useful lives taking into account residual value. The estimated useful lives (i.e. information technology
equipment—3 years; software—3 to 5 years; leasehold improvements—shorter of their useful life or remaining life of the lease;
furniture and fixtures—5 years) is based on the period over which the Company expects to generate net cash inflows from the use
of these assets. The depreciable long-lived assets are subject to impairment testing whenever events or changes in circumstances
indicate that their carrying amount may not be recoverable.
Insurance and reinsurance balances payable Insurance and reinsurance balances payable principally represents ceded premiums payable and profit commissions payable to
third party reinsurance companies or program administrators. Also included within this line item are amounts related to the
Company’s insurance business principally related to return premiums, which arise when an insurance contract is cancelled and the
Company is required to return some or all of the premium received to the insured.
Business combinations, goodwill and other intangible assets The Company accounts for business combinations in accordance with FASB ASC Topic 805 Business Combinations, and
goodwill and other intangible assets that arise from business combinations in accordance with FASB ASC Topic 350 Intangibles—
Goodwill and Other. A purchase price that is in excess of the fair value of the net assets acquired arising from a business
combination is recorded as goodwill, and is not amortized. Other intangible assets with a finite life are amortized over the
estimated useful life of the asset. Other intangible assets with an indefinite useful life are not amortized.
Goodwill and other indefinite life intangible assets are tested for impairment at least annually. The Company first assesses
qualitative factors in determining whether it is necessary to perform the two-step quantitative goodwill impairment test. Only if
management determines that it is more likely than not that the fair value of a reporting unit is less than its carrying amount based
on qualitative factors, would it be required to then perform the two-step quantitative goodwill impairment test detailed below.
The first step identifies potential impairments by comparing the fair value of the reporting unit to its book value, including
intangibles. If the fair value of the reporting unit exceeds the carrying amount, the intangible is not impaired and the second step is
not required. If the carrying value is in excess of the fair value, the second step computes the possible impairment loss by
comparing the implied fair value of the intangible with the carrying amount. If the implied fair value of the intangible is less than
the carrying amount, the intangible is written down to its fair value with a corresponding expense being charged to earnings.
The Company considers the recoverability of its intangible assets whenever a change in circumstances arises and in the event that
an impairment exists, any excess unamortized balances are recorded in earnings.
Non-controlling interest The Company accounts for non-controlling interest in accordance with FASB ASC Topic 805 Business Combinations which
establishes accounting and reporting standards that require that ownership interests in subsidiaries held by other parties be
presented in the consolidated statement of shareholders’ equity separately from the parent’s equity and the consolidated net income
attributable to non-controlling interest be presented on the face of the consolidated statements of operations and comprehensive
income. The guidance also requires that changes in a parent’s ownership interest while the parent retains controlling financial
interest in its subsidiary be accounted for consistently. Disclosures in financial statements are required to identify and distinguish
between the interests of the parent and non-controlling owners. On July 1, 2014, the Company purchased the remaining 40%
interest in Wright & Co. from the non-controlling shareholders for cash of $5,247, increasing its ownership interest from 60% to
100%.
Foreign exchange The Company’s reporting currency is the United States Dollar (U.S. dollars). Monetary assets and liabilities denominated in
currencies other than the entities’ functional currencies are revalued at the exchange rates in effect as of the balance sheet date with
the resulting foreign exchange gains and losses included in earnings as net foreign exchange gains (losses). Revenues and expenses
denominated in currencies other than the entities’ functional currencies are remeasured at the average rate for the period. The
financial statements of each of the Company’s subsidiaries are initially measured using the entity’s functional currency, which is
determined based on its operating environment and its underlying cash flows. For entities with a functional currency other than
U.S. dollars, foreign currency assets and liabilities are translated into U.S. dollars using the period end rates of exchange, while

Ironshore Inc.
Notes to consolidated financial statements (Expressed in thousands of U.S. dollars, except share data)
12
statements of operations are translated at average rates of exchange for the period. The resulting cumulative translation adjustment
is recorded in accumulated other comprehensive income as a separate component of shareholders’ equity.
Stock based compensation The Company accounts for its stock compensation plans in accordance with the fair value recognition provisions of FASB ASC
Topic 718 Compensation—Stock Compensation, which requires the Company to measure the cost of services received from
employees, directors and eligible consultants in exchange for an award of equity instruments based on the estimated fair value of
the award on the date of grant for equity-classified awards. The cost of these services is recognized as compensation expense over
the requisite service period and is included in earnings. The Company measures liability-classified awards based on the fair value
remeasured at each reporting period until the date of settlement. The compensation cost related to liability-classified awards
includes a change in the fair value of the liability instrument at each reporting period.
Earnings per share Basic earnings per ordinary share are calculated by dividing net income available to ordinary shareholders by the weighted average
number of ordinary shares outstanding. Diluted earnings per ordinary share are based on the weighted average number of ordinary
shares, warrants, restricted stock and options outstanding, except the effects of the warrants, restricted stock and options that are
anti-dilutive.
Taxation Income taxes have been provided in accordance with the provisions of FASB ASC Topic 740 Income Taxes on those operations
which are subject to income taxes. Deferred tax assets and liabilities result from temporary differences between the amounts
recorded in the consolidated financial statements and the tax basis of the Company’s assets and liabilities. The effect on deferred
tax assets and liabilities of a change in tax rates is recognized in earnings in the period that includes the enactment date. A
valuation allowance against deferred tax assets is recorded if it is more likely than not that all, or some portion, of the benefits
related to deferred tax assets will not be realized.
The Company reflects tax positions in accordance FASB ASC Topic 740, Income Taxes. Such tax positions are, based solely on
their technical merits, more likely than not to be sustained upon examination by taxing authorities and reflect the largest amount of
benefit, determined on a cumulative probability basis that is more likely than not to be realized upon settlement with the applicable
taxing authority with full knowledge of all relevant information.
Recent accounting pronouncement
Amendments to Fair Value Disclosures
In May 2015, the FASB issued Accounting Standards Update 2015-07 “Disclosure for Investments in Certain Entities That
Calculate Net Asset Value per Share (or Its Equivalent)” which removes the requirement to categorize within the fair value
hierarchy all investments for which fair value is measured using the net asset value per share practical expedient. However, the
reporting entity is still required to disclose information that will help users understand the nature and risk of these investments.
This update is effective for public business entities for fiscal years beginning after December 15, 2015 and after December 15, 2016
for all other entities. The amendments should be applied retrospectively for all periods presented. Earlier application is permitted.
The Company adopted this pronouncement starting for the period ended June 30, 2015 and it had no material impact on the
consolidated financial statements.
Amendments to the Consolidation Standard
In February 2015, the Financial Accounting Standards Board (“FASB”) issued Accounting Standards Update No. 2015-2,
Consolidation – Amendments to the Consolidation Analysis, which amends the current consolidation guidance. The main
provisions of these amendments may affect consolidation conclusion and include, among others, the following key items:
elimination of three of the six conditions for evaluating whether a fee paid to a decision maker or a service provider
represents a variable interest;
exclusion of some fee arrangements paid to a decision maker on determining primary beneficiary; and
reduction in the application of related party guidance on determining primary beneficiary.
Ironshore Inc.
Notes to consolidated financial statements (Expressed in thousands of U.S. dollars, except share data)
13
This update will be effective for public business entities with annual periods beginning after December 15, 2015 and December 15,
2016 for all other entities. Earlier application is allowed. The Company believes that this guidance has no impact on the
consolidated financial statements.
Elimination of Extraordinary Item Concept
In January 2015, the FASB issued Accounting Standard Update No. 2015-01, Income Statement – Extraordinary and Unusual
Items which eliminates the concept of extraordinary items. Preparers and their auditors will no longer need to evaluate whether
unusual and/or infrequent items are treated properly. Presentation and disclosure guidance for items that are unusual in nature or
infrequent in occurrence will be expanded to include items that have both characteristics. This update will be effective for interim
and annual periods beginning after December 15, 2015. Earlier application is allowed. The Company believes that this guidance
will have no impact on the consolidated financial statements.
Simplifying the Presentation of Debt Issuance Costs
In April 2015, the FASB issued Accounting Standards Update 2015-03 Simplifying the Presentation of Debt Issuance Costs
requiring entities to present debt issuance costs related to a recognized liability in the balance sheet as a direct reduction from that
liability rather than as an asset. This will align the presentation of debt issuance costs with that of debt discounts and premiums. The
guidance is effective for non-public business entities for fiscal years beginning after December 15, 2015 and interim periods within
fiscal years beginning after December 15, 2016. Earlier application is permitted. The Company believes that this guidance will not
have a material impact on the consolidated financial statements.
Disclosures about Short Duration Insurance Contracts
In May 2015, the FASB issued Accounting Standards Update 2015-09 Disclosures about Short Duration Insurance Contracts
requiring insurers to make additional disclosures about short-duration contracts (typically a year or less). The disclosures focus on
the liability for unpaid claims and claim adjustment expenses. Insurers are required to provide tables showing incurred and paid
claims development information by accident year for the number of years claim typically remain outstanding (but not more than 10
years). Insurers will also have to provide a reconciliation of this information to the statement of financial position. For accident
years included in the development tables, insurers will have to disclose the total of incurred-but-not-reported liabilities and
expected development on reported claims plus claims frequency information unless impracticable, and the historical average annual
percent of payout incurred claims. These disclosures will be required to be aggregated or disaggregated so that useful information is
not obscured. The guidance is effective for non-public business entities for fiscal years beginning after December 15, 2016 and
interim periods the following year. Earlier application is permitted. The Company believes that this guidance has no impact on the
consolidated financial statements as it is a change in disclosure only.
Simplifying the Accounting for Measurement Period Adjustments
In September 2015, The FASB issued Accounting Standards Update 2015-16 Simplifying the Accounting for Measurement Period
Adjustments eliminating the requirement that an acquirer in a business combination account for adjustments it makes to the
provisional amounts it records for assets and liabilities retrospectively. An acquirer must recognize these measurement-period
adjustments during the period in which it determines their amounts, including the effect on earnings of any amounts they would
have recorded in previous periods if the accounting had been completed at the acquisition date. The guidance is effective for non-
public business entities for fiscal years beginning after December 15, 2016 and interim periods with fiscal years beginning after
December 15, 2017. Earlier application is permitted. The Company believes that this guidance will not have a material impact on
the consolidated financial statements.
3. Fosun Equity Investment and Ironshore Tender Offer
On August 17, 2014, the Company entered into a definitive equity purchase agreement (the “Equity Purchase Agreement”) with
Fosun International Limited (“Fosun”) and Mettlesome Investment Limited, a wholly owned subsidiary of Fosun (“Mettlesome”),
pursuant to which the Company agreed to sell to Mettlesome 20% of Ironshore’s total outstanding ordinary shares on a fully
diluted basis (the “Fosun Equity Investment”). The Fosun Equity Investment was consummated on February 12, 2015 and,
pursuant to the terms of the Equity Purchase Agreement, the Company initially issued to Mettlesome 27,980,743 ordinary shares
for a cash purchase price of $456,804. The purchase price and number of shares issued were subject to certain post-closing
adjustments under the Equity Purchase Agreement.

Ironshore Inc.
Notes to consolidated financial statements (Expressed in thousands of U.S. dollars, except share data)
14
In November 2014, the Company launched a tender offer (the “Ironshore Tender Offer”) to repurchase securities representing 20%
of Ironshore’s total outstanding ordinary shares on a fully diluted basis. Following closing of the Fosun Equity Investment, the
Company consummated the Ironshore Tender Offer, repurchasing 27,687,491 ordinary shares (including shares underlying options
and Class B warrants exercised in connection with the tender offer) at approximately $16.3256 per share and 1,921,040 Class A
warrants at approximately $6.3256 per warrant. All of the proceeds from the Fosun Equity Investment, together with the exercise
price payable to the Company upon the exercise of options and Class B warrants described above, were used to pay the tender
offer consideration. The securities repurchased by the Company pursuant to the Ironshore Tender Offer were cancelled and retired.
The number of securities repurchased by the Company and the aggregate tender offer consideration are subject to adjustment based
on the post-closing adjustments pursuant to the Equity Purchase Agreement.
On March 6, 2015, in conjunction with the initial post-closing adjustment pursuant to the Equity Purchase Agreement, the
Company issued 97,296 additional shares to Mettlesome and received a cash purchase price adjustment of $9,776.
The post-closing adjustments under the Equity Purchase Agreement and the related post-closing share adjustments pursuant to the
Ironshore Tender Offer were finalized in the second fiscal quarter of 2015. Costs incurred associated with the Fosun Equity
Investment are recorded in non-recurring transaction expenses in the consolidated statement of operations and comprehensive
income.
Effective upon closing of the Fosun Equity Investment, the Company’s memorandum of association was amended to increase the
authorized capital of the Company from 200,000,000 ordinary shares to 400,000,000 shares, par value of $0.01 each, which may
be ordinary shares or preferred shares.
4. Merger with Fosun
On May 1, 2015, the Company entered into a definitive merger agreement (the “Merger Agreement”) with Fosun International
Limited (“Fosun”), Mettlesome Investments (Cayman) III Limited (“Purchaser”), Mettlesome Investment 2, a wholly-owned
subsidiary of Purchaser (“Merger Sub”) and IS Equityholder Rep, LLC, solely in its capacity as the representative of the
equityholders of the Company (“Equityholder Representative”), pursuant to which the parties agreed that Fosun would acquire
indirectly the remaining interest in the Company that Fosun did not already beneficially own (the “Fosun Acquisition”). On
November 20, 2015, the Fosun Acquisition was effected by the merger of Merger Sub with and into the Company, with the
Company surviving the merger and becoming a wholly owned indirect subsidiary of Fosun. The aggregate consideration paid by
Purchaser was $2,042,936, which was allocated ratably among the holders of shares, restricted share units, warrants and options of
the Company (taking into consideration the exercise prices of warrants and options), after deduction of (a) the portion of
transaction expenses incurred by the Company payable out of the merger consideration, (b) transaction expenses incurred by the
Equityholder Representative prior to the Closing, (c) $2,500 to fund an escrow account against which indemnity claims may be
made by the Purchaser and (d) $750 to fund potential expenses incurred by the Equityholder Representative after the closing.
Payments for certain equity held by certain employees of the Company were funded into separate escrow accounts for the benefit
of such employees, and payments out of such escrow accounts will be made to such employees on a deferred basis, in each case,
pursuant to arrangements contemplated by the Merger Agreement. The deferred consideration payable was $48,498 and is
recorded in the consolidated balance sheet in the following line items: cash of $48,498, other liabilities of $35,413, and additional
paid in capital of $13,085. Costs incurred associated with the merger of $22,110 are recorded in non-recurring transaction expenses in the consolidated
statement of operations and comprehensive income. Fosun reimbursed the Company for these expenses and the reimbursement is
recorded as additional paid in capital in the balance sheet. Non-recurring transaction expenses also include costs incurred of
$7,615 associated with the Fosun Equity Investment (refer to Note 3) and $9,804 due to the accelerated vesting of certain share
based compensation awards pursuant to the Merger Agreement.

Ironshore Inc.
Notes to consolidated financial statements (Expressed in thousands of U.S. dollars, except share data)
15
5. Investment in Joint Ventures
Ironshore Holdings U.S. formed IDP Holdings LLC (“IDP”) as a joint venture with The Distinguished Programs Group LLC
(“DPG”).
On November 1, 2012, IDP entered into an Asset and Membership Interest Purchase Agreement with National Specialty
Underwriters, Inc. and certain of its subsidiaries (collectively, “NSU”) pursuant to which IDP purchased NSU’s hospitality and
casualty insurance programs business and related claims administration business for cash and a promissory note issued by IDP.
Ironshore Holdings U.S. made a cash equity investment of $4,844 and advanced a loan of $10,088 to IDP, which equity
investment and loan, together with a cash equity investment by DPG, were used to finance the purchase from NSU. In April 2014,
Ironshore Holdings U.S. made an additional cash equity investment of $1,250 and advanced a loan of $2,500 to IDP, which equity
investment and loan, together with a cash equity investment by DPG were used to repay the promissory note issued by IDP in
connection with the NSU transaction. Further, on September 1, 2014, IDP entered into an asset purchase agreement with DPG
pursuant to which IDP purchased certain new hospitality program business from DPG for cash. Ironshore Holdings U.S. made an
additional cash equity investment of $620 and advanced a loan of $1,241 to IDP, which equity investment and loan, together with
a cash equity investment by DPG were used to finance such purchase from DPG. Each loan from Ironshore Holdings U.S. to IDP
bears interest at a rate of prime plus 4% per annum subject to a minimum interest rate of 6% per annum and a maximum interest
rate of 12% per annum. The loans were secured by a pledge of substantially all of the assets of IDP. All profits and losses of
operations are shared equally between Ironshore Holdings U.S. and DPG.
On October 26, 2015, Ironshore Holdings U.S. sold its ownership interest in IDP to DPG for $10,893 resulting in a gain of $5,330
recognized in other income. In addition, the aggregate promissory note value of $13,828 and accrued interest outstanding up to the
October 26, 2015 were settled by DPG.
6. Goodwill and other intangible assets
Goodwill and other intangibles as of December 31, 2015 and 2014 are as follows:
Goodwill & other
Goodwill intangible assets
Gross Gross Amortization
Foreign
Exchange Total Total
Balance as of January 1, 2014 $17,804 $80,425 $(9,944) $(5,727) $64,754 $82,558
Reclassification (b) 391 (391) - - (391) -
Acquired during 2014 - 620 - - 620 620
Amortization - - (2,384) - (2,384) (2,384)
Foreign exchange translation (a) - - - (1,440) (1,440) (1,440)
Balance as of December 31, 2014 18,195 80,654 (12,328) (7,167) 61,159 79,354
Acquired during 2015 187 425 - - 425 612
Amortization - - (2,519) - (2,519) (2,519)
Foreign exchange translation (a) - - - (1,221) (1,221) (1,221)
Balance as of December 31, 2015 $18,382 $81,079 $(14,847) $(8,388) $57,844 $76,226
Other intangible assets
(a) Represents foreign exchange translation on Lloyd’s Syndicate capacity.
(b) Represents adjustment related to the acquisition of ERR acquisition.
Ironshore Inc.
Notes to consolidated financial statements (Expressed in thousands of U.S. dollars, except share data)
16
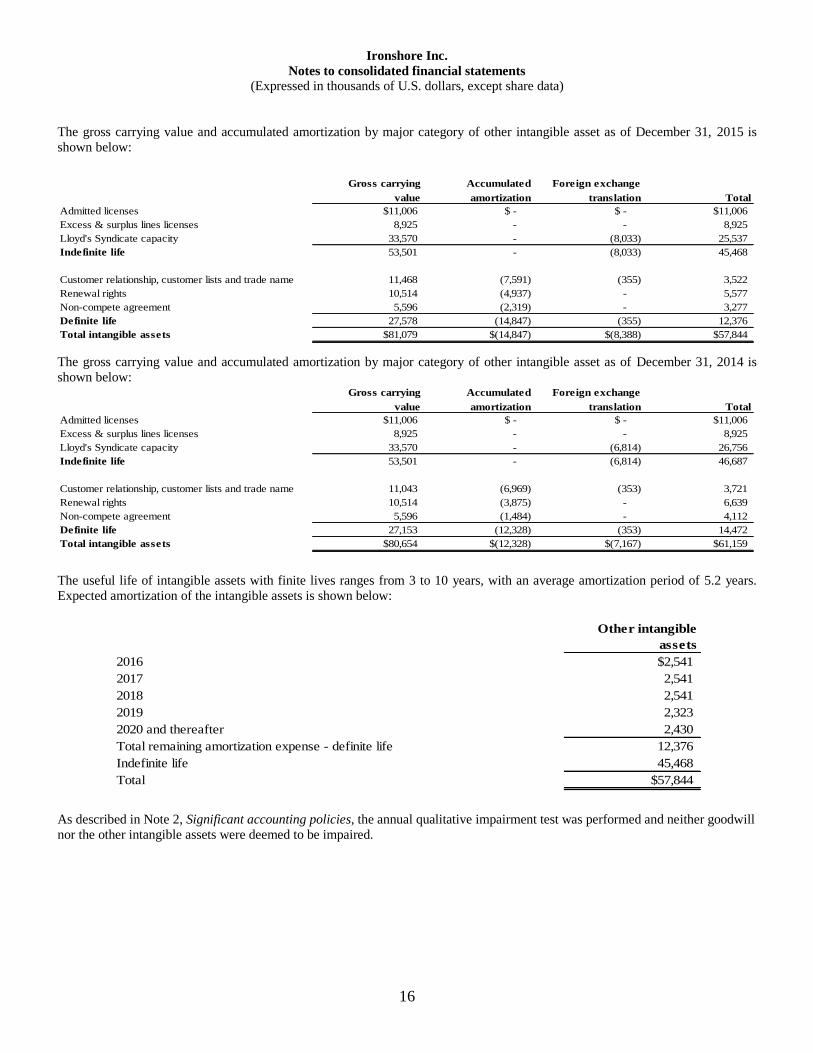
The gross carrying value and accumulated amortization by major category of other intangible asset as of December 31, 2015 is
shown below:
Gross carrying Accumulated Foreign exchange
value amortization translation Total
Admitted licenses $11,006 $ - $ - $11,006
Excess & surplus lines licenses 8,925 - - 8,925
Lloyd's Syndicate capacity 33,570 - (8,033) 25,537
Indefinite life 53,501 - (8,033) 45,468
Customer relationship, customer lists and trade name 11,468 (7,591) (355) 3,522
Renewal rights 10,514 (4,937) - 5,577
Non-compete agreement 5,596 (2,319) - 3,277
Definite life 27,578 (14,847) (355) 12,376
Total intangible assets $81,079 $(14,847) $(8,388) $57,844
The gross carrying value and accumulated amortization by major category of other intangible asset as of December 31, 2014 is
shown below: Gross carrying Accumulated Foreign exchange
value amortization translation Total
Admitted licenses $11,006 $ - $ - $11,006
Excess & surplus lines licenses 8,925 - - 8,925
Lloyd's Syndicate capacity 33,570 - (6,814) 26,756
Indefinite life 53,501 - (6,814) 46,687
Customer relationship, customer lists and trade name 11,043 (6,969) (353) 3,721
Renewal rights 10,514 (3,875) - 6,639
Non-compete agreement 5,596 (1,484) - 4,112
Definite life 27,153 (12,328) (353) 14,472
Total intangible assets $80,654 $(12,328) $(7,167) $61,159
The useful life of intangible assets with finite lives ranges from 3 to 10 years, with an average amortization period of 5.2 years.
Expected amortization of the intangible assets is shown below:
Other intangible
assets
2016 $2,541
2017 2,541
2018 2,541
2019 2,323
2020 and thereafter 2,430
Total remaining amortization expense - definite life 12,376
Indefinite life 45,468
Total $57,844
As described in Note 2, Significant accounting policies, the annual qualitative impairment test was performed and neither goodwill
nor the other intangible assets were deemed to be impaired.

Ironshore Inc.
Notes to consolidated financial statements (Expressed in thousands of U.S. dollars, except share data)
17
7. Investments
The amortized cost, gross unrealized gains and losses and fair value of investments as of December 31, 2015 are as follows:
Amortized Unrealized Unrealized Fair
cost gains losses value
U.S. government and government agency securities $484,524 $164 $(1,240) $483,448
Non-U.S. government and government agency securities 121,800 1,040 (4,191) 118,649
Municipal securities 90,898 845 (182) 91,561
Corporate securities 1,589,575 7,030 (12,815) 1,583,790
Bank loans 456,803 1,656 (10,055) 448,404
U.S. asset-backed securities 610,907 293 (5,588) 605,612
U.S. mortgage-backed securities 1,096,719 6,009 (8,224) 1,094,504
Total fixed maturity securities 4,451,226 17,037 (42,295) 4,425,968
Equity securities 202,014 10,547 (11,837) 200,724
Short term investments 3,979 - - 3,979
4,657,219 $27,584 $(54,132) $4,630,671
The amortized cost, gross unrealized gains and losses and fair value of investments as of December 31, 2014 are as follows:
Amortized Unrealized Unrealized Fair
cost gains losses value
U.S. government and government agency securities $359,877 $764 $(370) $360,271
Non-U.S. government and government agency securities 107,536 1,663 (1,122) 108,077
Municipal securities 88,020 1,344 (179) 89,185
Corporate securities 1,325,037 15,915 (8,015) 1,332,937
Bank loans 435,697 1,489 (6,811) 430,375
U.S. asset-backed securities 635,540 1,562 (3,459) 633,643
U.S. mortgage-backed securities 1,080,017 12,379 (2,689) 1,089,707
Total fixed maturity securities 4,031,724 35,116 (22,645) 4,044,195
Equity securities 209,265 5,527 (7,702) 207,090
Short term investments 40,877 - - 40,877
$4,281,866 $40,643 $(30,347) $4,292,162
Included in the tables above are fixed maturity securities with a fair value of $16,585 and $25,483 which are on deposit with U.S.
insurance regulators as of December 31, 2015 and 2014, respectively, to meet certain statutory requirements. The Company also
maintains fixed maturity securities and cash amounting to $1,981,393 and $1,545,000 in trust accounts as collateral under the
terms of certain insurance and reinsurance transactions as of December 31, 2015 and 2014, respectively.
As of December 31, 2015 and 2014, the Company maintained a trust account of $28,265 and $18,101, respectively, composed of
cash and fixed maturity securities to meet certain Canadian insurance regulatory requirements for Ironshore Insurance Ltd. -
Canada Branch.
On December 1, 2009, the Company entered into a $50,000 standby letter of credit facility provided by Citibank Europe plc. As of
December 31, 2015 and 2014, $49,701 and $37,254 respectively, of letters of credit were issued and outstanding under this
facility, for which $63,754 and $43,929, respectively, of fixed maturity securities were pledged as collateral.
The Company operates in the Lloyd’s market through its corporate member ICCL, which represents its participation in Syndicate
4000. Lloyd’s sets capital requirements for corporate members annually based on the Syndicates’ business plans, rating and
reserving environment together with input arising from Lloyd’s discussions with regulatory and rating agencies. Such capital, or
Funds at Lloyd’s (“FAL”), may be satisfied by cash, certain investments and undrawn letters of credit provided by approved
banks. As of December 31, 2015 and 2014, fixed maturity securities with a fair value of $322,003 and $277,571; equity securities
with a fair value of $51,698 and $55,783; and short term investments and cash equivalents with a fair value of $1,521 and $9,929,
respectively, were restricted to satisfy ICCL’s FAL requirements.

Ironshore Inc.
Notes to consolidated financial statements (Expressed in thousands of U.S. dollars, except share data)
18
The following represents an analysis of net realized gains (losses) on the sale of investments for the years ended:
Realized Realized Net realized
gains losses gains (losses)
Fixed maturity securities $11,451 $(18,250) $(6,799)
Equity securities 2,805 (5,106) (2,301)
Short term investments 602 (719) (117)
$14,858 $(24,075) $(9,217)
Year ended December 31, 2015
Realized Realized Net realized
gains losses gains (losses)
Fixed maturity securities $14,263 $(10,951) $ 3,312
Equity securities 19,639 (4,290) 15,349
Short term investments 664 (707) (43)
$34,566 $(15,948) $ 18,618
Year ended December 31, 2014
The amortized cost and fair value amounts for fixed maturity securities held as of December 31, 2015 are shown by contractual
maturity below. Actual maturity may differ from contractual maturity because certain borrowers may have the right to call or
prepay certain obligations with or without call or prepayment penalties.
Amortized cost Fair value
Due in one year or less $119,186 $119,256
Due after one year through five years 2,159,334 2,152,723
Due after five years through ten years 391,047 384,267
Due after ten years 51,160 46,731
U.S. asset-backed securities 610,907 605,612
U.S. mortgage-backed securities 1,096,719 1,094,504
U.S. government sponsored enterprises 22,873 22,875
Total fixed maturity securities $4,451,226 $4,425,968
December 31, 2015
The following table sets forth certain information regarding the investment ratings of the Company’s fixed maturity investment
portfolio as of December 31, 2015. Investment ratings are as designated by Standard & Poor’s Ratings Group or Moody’s
Investors Service.
S&P Equivalent Rating (a) Amortized cost Fair value
AAA $825,850 $821,953
AA 1,620,810 1,619,238
A 901,539 901,138
BBB 553,388 546,168
Below BBB 361,437 349,357
Not rated 188,202 188,114
Total fixed maturity securities $4,451,226 $4,425,968
December 31, 2015
(a) Carried at the lower of Standard & Poor’s or Moody’s rating, presented in Standard & Poor’s equivalent rating

Ironshore Inc.
Notes to consolidated financial statements (Expressed in thousands of U.S. dollars, except share data)
19
Net investment income is derived from the following sources:
For the years ended December 31 2015 2014
Fixed maturity securities $109,241 $95,864
Equity securities 6,566 6,302
Other investments 6,210 2,124
Cash and cash equivalents 850 686
Short term investments 10 8
Total gross investment income 122,877 104,984
Investment expenses (9,577) (7,941)
Net investment income $113,300 $97,043
8. Fair value measurement
U.S. GAAP establishes a framework for measuring fair value using a hierarchy of fair value measurements that distinguishes market
data between observable independent market inputs and unobservable market assumptions and requires additional disclosures about
such fair value measurements. Financial assets and liabilities are classified in their entirety based on the lowest level of input that is
significant to the fair value measurement. The hierarchy gives the highest priority to unadjusted quoted prices in active markets for
identical assets or liabilities (Level 1 measurements) and the lowest priority to unobservable inputs (Level 3 measurements).
The three levels of the fair value hierarchy are described further below:
Level 1: Quoted prices in active markets for identical assets/liabilities (unadjusted);
Level 2: Indirect observable inputs including quoted prices for similar assets/liabilities (adjusted) and market corroborated inputs;
Level 3: Unobservable inputs which reflect the underlying entity’s interpretation of risk assumptions used by market participants.
The Company receives assistance with its investment accounting function from an independent service provider. This service
provider as well as the Company’s investment managers uses several pricing services and brokers to assist with the determination of
the fair value of the Company’s investment portfolio.
The Company does not typically adjust prices obtained from pricing services. In accordance with accounting guidance regarding fair
value measurements, the Company’s service providers maximize the use of observable inputs ensuring that unobservable inputs are
used only when observable inputs are not available.
The following table presents the Company’s investments that are measured at fair value on a recurring basis as well as the carrying
amount of these investments as of December 31, 2015 by level within the fair value hierarchy:
Quoted Prices in Significant
Active Markets Other Significant
for Identical Observable Unobservable
Assets Inputs Inputs
2015 (Level 1) (Level 2) (Level 3) Total
U.S. government and government agency securities $460,573 $22,875 - $483,448
Non-U.S. government and government agency securities - 118,649 - 118,649
Municipal securities - 91,561 - 91,561
Corporate securities - 1,582,790 1,000 1,583,790
Bank loans - 226,342 222,062 448,404
U.S. asset-backed securities - 575,575 30,037 605,612
U.S. mortgage-backed securities - 1,089,388 5,116 1,094,504
Total fixed maturity securities 460,573 3,707,180 258,215 4,425,968
Equity securities 194,876 5,848 - 200,724
Short term investments - 3,979 - 3,979
$655,449 $3,717,007 $258,215 $4,630,671

Ironshore Inc.
Notes to consolidated financial statements (Expressed in thousands of U.S. dollars, except share data)
20
The following table presents the Company's investments that are measured at fair value on a recurring basis as well as the carrying
amount of these investments as of December 31, 2014 by level within the fair value hierarchy:
Quoted Prices in Significant
Active Markets Other Significant
for Identical Observable Unobservable
Assets Inputs Inputs
2014 (Level 1) (Level 2) (Level 3) Total
U.S. government and government agency securities $283,252 $77,019 - $360,271
Non-U.S. government and government agency securities - 108,077 - 108,077
Municipal securities - 89,185 - 89,185
Corporate securities - 1,331,957 980 1,332,937
Bank loans - 188,998 241,377 430,375
U.S. asset-backed securities - 629,027 4,616 633,643
U.S. mortgage-backed securities - 1,081,844 7,863 1,089,707
Total fixed maturity securities 283,252 3,506,107 254,836 4,044,195
Equity securities 172,992 33,873 225 207,090
Short term investments - 40,877 - 40,877
$456,244 $3,580,857 $255,061 $4,292,162
A description of the valuation techniques and inputs used to determine fair values of investments carried at fair value, as well as the
classification of each investment type in the fair value hierarchy is detailed below.
The Company’s investments classified as Level 1 include U.S. government and government agency securities and equity securities
for which fair value is based on quoted market prices in active markets which is defined by the Company’s pricing service as a
security that has traded in the previous seven days.
The Company’s Level 2 securities primarily consist of securities that are valued using models or other valuation techniques. These
models are industry standard models that take into account various assumptions including time value, yield curve, prepayments
speeds, default rates, loss severity, current market and contractual prices for the underlying securities as well as other economic data.
The majority of these assumptions are observable in the marketplace and this category includes some U.S. and Non-U.S.
government and government agency securities, municipal securities, corporate securities, bank loans, U.S. asset-backed securities,
U.S. mortgage-backed securities, equity securities and short term investments.
The Company’s investments classified as Level 3 consist of bank loans, certain corporate securities, U.S. asset and mortgage-backed
securities and equity securities. Level 3 securities are valued using non-binding broker quotes and other third party pricing sources,
without modification. Consequently, the information about significant unobservable inputs used in the fair value measurement as
required by U.S. GAAP are not disclosed.
The Company’s other investments include investments in closed-end limited partnerships that invest primarily in private commercial
real estate debt in North America and Europe (“Real Estate Debt Funds”). In May, 2015, the Company also invested in a limited
partnership fund registered in Cayman Islands called China Momentum Fund, L.P. (CMF). The fair value of these investments is
estimated using the net asset value (NAV) as provided by the general partners or investment managers. As the NAV obtained from
the general partners or investment managers lags by one quarter as of the measurement date, the Company considers any adjustment
to the most recent NAV such as capital calls, distributions, redemptions and all other information available to the Company.
The Real Estate Debt Funds invest principally in senior and subordinated instruments, including mortgages, B-notes and mezzanine,
senior and bridge loans related to real estate-related assets. These investments are not allowed to be redeemed, transferred or resold
and have an estimated term of 3 to 7 years. CMF invests primarily in portfolio of companies engaged in consumer, financial or
industrial undertakings domiciled in China, Hong Kong, Macau and/or Taiwan. The investment period for CMF commenced on
August 15, 2013 and with an estimated term of 10 years unless sooner dissolved. As of December 31, 2015 and 2014, Real Estate
Debt Funds and CMF had a balance of $87,366 and $43,760, respectively, recorded as other investments in the consolidated balance
sheets.
There have been no significant changes in the Company’s use of valuation techniques or related inputs nor have there been any
transfers between Level 1 and Level 2 during the years ended December 31, 2015 and 2014, respectively. The transfers from Level 2

Ironshore Inc.
Notes to consolidated financial statements (Expressed in thousands of U.S. dollars, except share data)
21
to Level 3 during the years ended December 31, 2015 and 2014 reflect low level of trading activity in certain fixed maturity
securities while the transfers of fixed maturity securities from Level 3 to Level 2 that occurred during the same periods reflect higher
reliance on observable inputs. The Company’s policy is to recognize transfers in and out of the fair value hierarchy measurement
levels as of the date of the actual transfer.
As of December 31, 2015 and 2014, the Company’s Level 3 investments represented 5.6% and 5.9% of its total investments
measured at fair value, respectively.
Level 3 Gains and Losses
The table below presents assets that are measured at fair value on a recurring basis as of December 31, 2015 using significant
Level 3 inputs:
U.S. asset- U.S. mortgage-
Equity Corporate backed backed
Year ended December 31, 2015 Bank loans securities securities securities securities Total
Balance at beginning of year $241,377 $225 $980 $4,616 $7,863 $255,061
Realized gains (losses) (1,198) (7) - - 130 (1,075)
Unrealized gains (losses) 459 15 17 (212) (127) 152
Purchases 75,442 - - 22,065 6,018 103,525
Sales (75,744) (233) 1 (772) (8,755) (85,503)
Amortization 837 - 2 11 (13) 837
Transfer into Level 3 4,609 - - 8,708 - 13,317
Transfer out of Level 3 (23,720) - - (4,379) - (28,099)
Balance at end of the year $222,062 $0 $1,000 $30,037 $5,116 $258,215
The table below presents assets that are measured at fair value on a recurring basis as of December 31, 2014 using significant
Level 3 inputs:
U.S. asset- U.S. mortgage-
Equity Corporate backed backed
Year ended December 31, 2014 Bank loans securities securities securities securities Total
Balance at beginning of the period $132,831 - $77 $50,571 $3,567 $187,046
Realized gains 26 - 4 - - 30
Unrealized gains (losses) (2,593) (15) (2) (14) 86 (2,538)
Purchases 174,926 240 980 4,629 6,180 186,955
Sales (71,796) - (79) - (1,099) (72,974)
Amortization 698 - - 1 12 711
Transfer into Level 3 25,018 - - - - 25,018
Transfer out of Level 3 (17,733) - - (50,571) (883) (69,187)
Balance at end of the year $241,377 $225 $980 $4,616 $7,863 $255,061
Change in unrealized loss for the year included in earnings for assets held at the end of December 31, 2015 and 2014 amounted to
$669 and $1,795, respectively.
Financial Instruments not Carried at Fair Value
U.S. GAAP requires that entities disclose the fair value of all of their financial instruments whether or not carried at fair value in
the financial statements.
On May 4, 2010, the Company issued $250,000 of Senior Notes bearing an annual interest rate of 8.5%, payable semi -annually in
arrears on May 15 and November 15 of each year, beginning November 15, 2010. As of December 31, 2015 and December 31,
2014, the fair value of the Senior Notes was $287,500 (carrying value – $247,992) and $300,948 (carrying value - $247,629),
respectively. The fair value is determined using a non-binding broker quote which is considered Level 3 in the fair value hierarchy.

Ironshore Inc.
Notes to consolidated financial statements (Expressed in thousands of U.S. dollars, except share data)
22
Consequently, the information about significant unobservable inputs used in the fair value measurement as required by U.S. GAAP
is not disclosed.
As of December 31, 2015, the Company has an outstanding loan of $100,000 owed to Federal Home Loan Bank Boston (“FHLB”)
(see Note 14). As of December 31, 2015, the carrying value of the short-term loan of $100,000 approximates fair value and is
classified as Level 2 in the fair value hierarchy.
9. Reserves for losses and loss adjustment expenses
Reserves for losses and loss adjustment expenses are based in part upon the estimation of case reserves reported from brokers,
insureds and ceding companies. The Company also uses statistical and actuarial methods to estimate ultimate expected losses and
loss adjustment expenses. The period of time from the occurrence of a loss, the reporting of a loss to the Company and the
settlement of the Company’s liability may be several months or years. During this period, additional facts and trends may be
revealed. As these factors become apparent, case reserves will be adjusted, sometimes requiring an increase or decrease in the
overall reserves of the Company, and at other times requiring a reallocation of incurred but not reported reserves to specific case
reserves. These estimates are reviewed regularly, and such adjustments, if any, are recorded in earnings in the period in which they
become known. While management believes that it has made a reasonable estimate of ultimate losses, there can be no assurances
that ultimate losses and loss expenses will not exceed the total reserves.
The following table represents the activity in the reserve for losses and loss adjustment expenses for the years ended December 31,
2015 and 2014, respectively:
2015 2014
Gross reserves for losses and loss adjustment expenses, beginning of year $2,838,158 $2,181,812
Less reinsurance recoverable balances, beginning of year 693,298 601,352
Net reserves for losses and loss adjustment expenses, beginning of year 2,144,860 1,580,460
Increase (decrease) in net losses and loss adjustment expenses incurred in
respect of loses occurring in:
Current year 1,000,318 1,024,508
Prior years 9,900 52,766
Total incurred losses and loss adjustment expenses 1,010,218 1,077,274
Less net losses and loss adjustment expenses paid in respect of losses
occurring in:
Current year 130,449 146,129
Prior years 586,252 358,467
Total net paid losses 716,701 504,596
Net foreign currency gain on reserve for losses and loss adjustment expenses (17,623) (8,278)
Net reserve for losses and loss adjustment expenses, end of year 2,420,754 2,144,860
Plus reinsurance recoverable balances, end of year 776,787 693,298
Gross reserve for losses and loss adjustment expenses, end of year $3,197,541 $2,838,158
The underlying reasons for prior year unfavorable development of $9,900 for the year ended December 31, 2015 included:
Net unfavorable loss reserve development for our U.S. segment of $7,800, of which $13,200 was recognized in our
IronPro line of business, primarily on the 2013 and 2014 accident years, and $12,800 in our aviation line of business,
primarily on the 2013 and 2014 accident years, due to higher than expected reported claim activity. This was partially
offset by favorable loss reserve development due to better than expected reported claim activity in the following lines of
business and accident years: $11,300 in our U.S. property line of business (2013 and 2014 accident years) and $10,400 in
our environmental line of business (2012 and 2013 accident years); and

Ironshore Inc.
Notes to consolidated financial statements (Expressed in thousands of U.S. dollars, except share data)
23
Net unfavorable loss reserve development for our Bermuda segment of $1,400, of which was $6,200 was recognized in
our Bermuda property line of business, primarily on the 2013 and 2014 accident years, due to higher than expected
reported claim activity. This was partially offset by favorable development due to better than expected reported claim
activity of $4,700 in our Corporate Deals line of business, primarily on the 2013 and 2014 accident years.
The underlying reasons for prior year unfavorable development of $52,766 for the year ended December 31, 2014 included:
Net unfavorable loss reserve development for our U.S. segment of $43,700, of which $74,700 was recognized in our
casualty line of business, primarily on the 2009 to 2013 accident years, due to higher than expected reported claim
activity. This was partially offset by favorable loss reserve development due to better than expected reported claim
activity in the following lines of business and accident years: $11,600 in our U.S. property line of business (2011 to 2013
accident years), $9,700 in our political risk line of business (2011 to 2013 accident years), $4,000 in our IronPro line of
business (2009 and 2010 accident years), and $3,200 in our IronHealth line of business (2011 accident year); and
Net unfavorable loss reserve development for our International segment of $9,400, of which $14,000 was recognized in
our marine line of business due to higher than expected reported claim activity, primarily on the 2010 to 2012 accident
years. This was partially offset by favorable loss reserve development due to better than expected reported claim activity
of $4,700 in our liability line of business primarily on the 2009 and 2011 accident years.
The Company has written an increasing volume of casualty business in recent years which adds significant variability to
management’s estimates because of the longer tail nature of the risks.
As of December 31, 2015 and 2014, reinsurance recoverable and reserve for losses and loss adjustment expenses include amounts
of $25,506 and $18,784, respectively, related to the pre-acquisition business of Ironshore Indemnity and Ironshore Specialty that
are secured by conditional guarantees from the parents of the sellers.
10. Reinsurance
In certain cases, the risks written by the Company are wholly or partially reinsured with third-party reinsurers. Reinsurance ceded
varies by location and line of business based on a number of factors, including market conditions. The benefits of ceding risks to
third-party reinsurers include reducing exposure on individual risks, protecting against catastrophic risks, maintaining acceptable
capital ratios and enabling the writing of additional business. Reinsurance ceded contracts do not discharge the Company from its
liabilities to the original policyholder in respect of the risk being reinsured.
The Company uses reinsurance to support its underwriting and retention guidelines as well as to control the aggregate exposure of
the Company to a particular risk or class of risks. Reinsurance may be purchased at several levels ranging from reinsurance of risks
assumed on individual contracts to reinsurance covering the aggregate exposure on a portfolio of policies issued by groups of
companies.
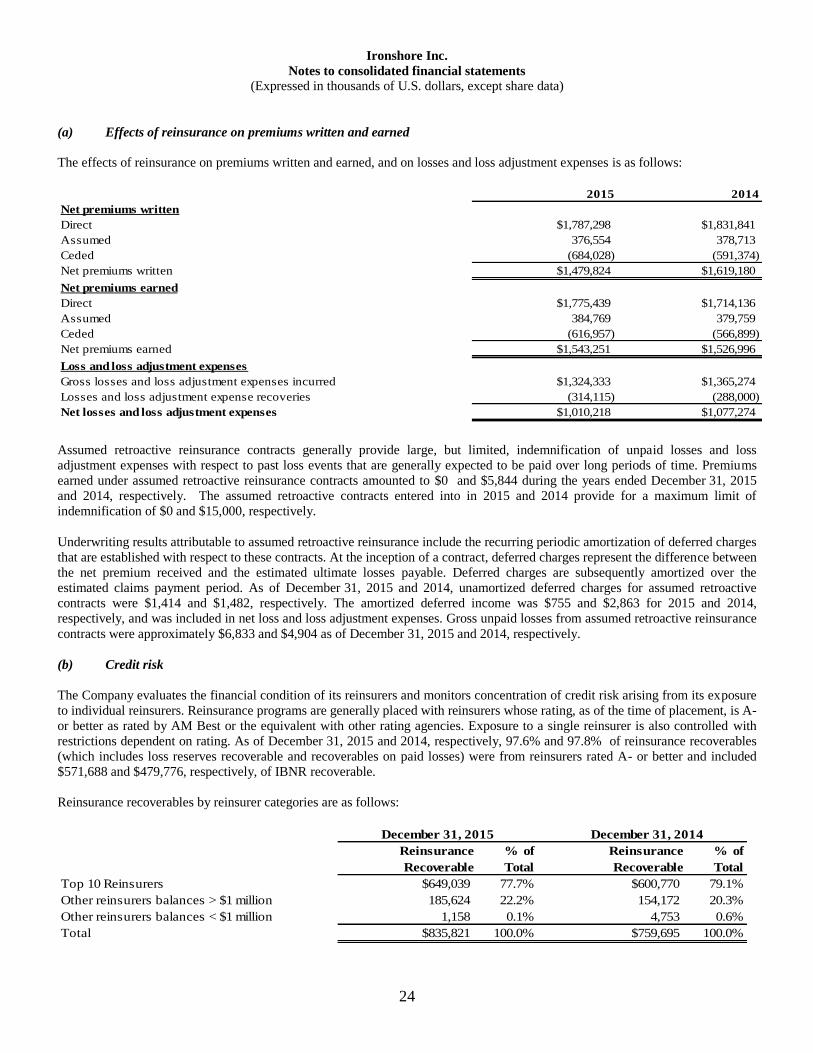
Ironshore Inc.
Notes to consolidated financial statements (Expressed in thousands of U.S. dollars, except share data)
24
(a) Effects of reinsurance on premiums written and earned
The effects of reinsurance on premiums written and earned, and on losses and loss adjustment expenses is as follows:
2015 2014
Net premiums written
Direct $1,787,298 $1,831,841
Assumed 376,554 378,713
Ceded (684,028) (591,374)
Net premiums written $1,479,824 $1,619,180
Net premiums earned
Direct $1,775,439 $1,714,136
Assumed 384,769 379,759
Ceded (616,957) (566,899)
Net premiums earned $1,543,251 $1,526,996
Loss and loss adjustment expenses
Gross losses and loss adjustment expenses incurred $1,324,333 $1,365,274
Losses and loss adjustment expense recoveries (314,115) (288,000)
Net losses and loss adjustment expenses $1,010,218 $1,077,274
Assumed retroactive reinsurance contracts generally provide large, but limited, indemnification of unpaid losses and loss
adjustment expenses with respect to past loss events that are generally expected to be paid over long periods of time. Premiums
earned under assumed retroactive reinsurance contracts amounted to $0 and $5,844 during the years ended December 31, 2015
and 2014, respectively. The assumed retroactive contracts entered into in 2015 and 2014 provide for a maximum limit of
indemnification of $0 and $15,000, respectively.
Underwriting results attributable to assumed retroactive reinsurance include the recurring periodic amortization of deferred charges
that are established with respect to these contracts. At the inception of a contract, deferred charges represent the difference between
the net premium received and the estimated ultimate losses payable. Deferred charges are subsequently amortized over the
estimated claims payment period. As of December 31, 2015 and 2014, unamortized deferred charges for assumed retroactive
contracts were $1,414 and $1,482, respectively. The amortized deferred income was $755 and $2,863 for 2015 and 2014,
respectively, and was included in net loss and loss adjustment expenses. Gross unpaid losses from assumed retroactive reinsurance
contracts were approximately $6,833 and $4,904 as of December 31, 2015 and 2014, respectively.
(b) Credit risk The Company evaluates the financial condition of its reinsurers and monitors concentration of credit risk arising from its exposure
to individual reinsurers. Reinsurance programs are generally placed with reinsurers whose rating, as of the time of placement, is A-
or better as rated by AM Best or the equivalent with other rating agencies. Exposure to a single reinsurer is also controlled with
restrictions dependent on rating. As of December 31, 2015 and 2014, respectively, 97.6% and 97.8% of reinsurance recoverables
(which includes loss reserves recoverable and recoverables on paid losses) were from reinsurers rated A- or better and included
$571,688 and $479,776, respectively, of IBNR recoverable.
Reinsurance recoverables by reinsurer categories are as follows:
Reinsurance % of Reinsurance % of
Recoverable Total Recoverable Total
Top 10 Reinsurers $649,039 77.7% $600,770 79.1%
Other reinsurers balances > $1 million 185,624 22.2% 154,172 20.3%
Other reinsurers balances < $1 million 1,158 0.1% 4,753 0.6%
Total $835,821 100.0% $759,695 100.0%
December 31, 2015 December 31, 2014
Ironshore Inc.
Notes to consolidated financial statements (Expressed in thousands of U.S. dollars, except share data)
25
Reserves for reinsurance recoverables deemed uncollectible are based on an estimate of the amount of the reinsurance recoverable
balance that will ultimately not be recovered due to reinsurer insolvency, contractual dispute or some other reason. The valuation
of the reserve for uncollectible reinsurance includes a detailed review of the credit ratings of the reinsurance recoverable by
reinsurer on a continuous basis with any resulting adjustments recorded in earnings in the period that collection issues are
identified. As of December 31, 2015 and 2014, the reserves for reinsurance recoverables deemed uncollectible was $465 and $477,
respectively.
11. Share capital
(a) Authorized and issued
The Company’s authorized share capital is 400,000,000 ordinary shares with a par value of $0.01 each. As a result of the merger
with Fosun, with the Company becoming a wholly owned indirect subsidiary of Fosun, the Company’s existing outstanding shares,
excluding the 28,131,468 shares owned by Mettlesome Investment Limited (Mettlesome), were cancelled and converted into
ordinary shares. As of December 31, 2015, the Company had a total of 140,657,340 outstanding shares; 28,131,468 of which are
owned by Mettlesome and 112,525,872 are owned by Mettlesome Investments (Cayman) III Limited. Refer also to Note 4.
During 2014, the Company re-purchased 391,754 of the Company’s shares for $5,026. The shares repurchased by the Company
were cancelled and retired.
(b) Warrants
The Company did not issue any warrants during the years ended December 31, 2015 and 2014. For the years ended December 31,
2014, the outstanding warrants of 10,282,185 were fully vested and had a weighted average exercise price of $10.00.
As of December 31, 2015, all warrants were settled as part of the merger with Fosun.
(c) Dividends
The Company did not declare any dividends during the years ended December 31, 2015 and 2014.
12. Stock compensation plans
The Company had a stock incentive plan, the 2006 Long Term Incentive Plan (the “Plan”), under which the Compensation
Committee of the Company’s Board of Directors periodically granted stock option awards, restricted share unit awards, and
restricted share awards to employees, non-employee directors and consultants. As part of the merger with Fosun, all outstanding
warrants, restricted shares and restricted share units were terminated and converted into the right to receive cash equal to its ratable
portion of the closing merger consideration.

Ironshore Inc.
Notes to consolidated financial statements (Expressed in thousands of U.S. dollars, except share data)
26
(a) Options
Activity with respect to options for the years ended December 31, 2015 and 2014 is as follows:
Weighted Weighted
average grant average exercise
Options date fair value price
Options outstanding, January 1, 2014 10,171,578 $3.09 $10.58
Options issued during 2014 88,050 $4.85 $12.49
Options exercised during 2014 (265,878) $2.42 $9.78
Options forfeited during 2014 (115,400) $3.62 $10.40
Options outstanding, December 31, 2014 9,878,350 $10.81
Options exercisable as of December 31, 2014 7,749,156
Options outstanding, January 1, 2015 9,878,350 $2.97 $10.80
Options issued during 2015 2,030,000 $1.83 $16.59
Options exercised during 2015 (789,742) $3.30 $10.10
Options forfeited during 2015 (115,748) $3.06 $10.30
Options settled as part of Fosun merger (11,002,860) $2.74 $11.93
Options outstanding, December 31, 2015 -
b) Restricted shares
Activity with respect to restricted share awards for the years ended December 31, 2015 and 2014 is as follows:
Weighted average
Restricted Shares grant date fair value
Restricted shares outstanding, January 1, 2014 3,701,358 $10.20
Restricted shares issued during 2014 942,593 $13.23
Restricted shares settled during 2014 (379,526) $12.83
Restricted shares forfeited during 2014 (1,406) $10.50
Restricted shares issued but not yet fully vested, December 31, 2014 (2,039,016) $11.87
Restricted shares vested as of December 31, 2014 2,224,003 $10.00
Restricted shares outstanding, January 1, 2015 4,263,019 $10.89
Restricted shares issued during 2015 905,603 $16.58
Restricted shares settled during 2015 (198,372) $11.34
Restricted shares forfeited during 2015 (13,014) $14.83
Restricted shares settled as part of the Fosun merger (4,957,236) $11.90
Restricted shares vested as of December 31, 2015 -
13. Retirement plans
The Company maintains defined contribution retirement plans. Contributions are based on the participants’ eligible compensation.
During 2015 and 2014, the Company expensed $10,575 and $9,660, respectively, related to these retirement plans.

Ironshore Inc.
Notes to consolidated financial statements (Expressed in thousands of U.S. dollars, except share data)
27
14. Taxation
(a) Cayman Islands
Under current Cayman Islands law, the Company is not required to pay any taxes on its income or capital gains. If a Cayman
Islands law were to be enacted that would impose taxes on income or capital gains, the Company has received an undertaking from
the Governor in Cabinet that would exempt it from such taxation until October 2026.
(b) Bermuda
Under current Bermuda law, Ironshore Insurance is exempt from all Bermuda income, withholding and capital gains taxes. At the
present time, no such taxes are levied in Bermuda. In the event that such taxes are imposed, Ironshore Insurance would be exempt
until March 2035 pursuant to the Bermuda Exempted Undertakings Tax Protection Act 1966, and Amended Act of 1987.
(c) United States
The Company’s U.S. subsidiaries are subject to federal, state, and local corporate income taxes and other taxes applicable to U.S.
operations. A partial valuation allowance has been established for the Company’s net deferred tax asset related to certain U.S.
operations, as management believes that the realization of the tax benefits from these deferred tax assets is uncertain.
(d) United Kingdom
The Company operates in the U.K. through its U.K. subsidiaries and the profits of these companies are subject to U.K. corporation
taxes. Income from the Company’s operations at Lloyd’s is also subject to U.S. income taxes. Under a Closing Agreement
between Lloyd’s and the IRS, Lloyd’s Members pay U.S. income tax on U.S.-connected income written by Lloyd’s Syndicates.
U.S. income tax due on this U.S.-connected income is calculated by Lloyd’s and remitted directly to the IRS and is charged by
Lloyd’s to Members in proportion to their participation on the relevant Syndicates. The Company’s Corporate Member is subject
to this arrangement and will receive a U.K. corporation tax credit for any U.S. income tax incurred up to the value of the
equivalent U.K. corporation tax charge on the U.S. income. A partial valuation allowance has been established for the Company’s
net deferred tax asset related to certain U.K. operations, as management believes that the realization of the tax benefits from these
deferred tax assets is uncertain.
(e) Ireland
The Company operates in Ireland through its Irish subsidiary which is subject to income taxes in that jurisdiction. A valuation
allowance has been established for the Company’s net deferred tax asset related to its Irish operations, as management believes
that the realization of the tax benefits from these deferred tax assets is uncertain.
The Company is subject to income taxation in other jurisdictions than those stated above, but the impact of the other jurisdictions
is not material to the provision for income taxes for 2015 and 2014. There can be no assurance that there will not be changes in
applicable laws, regulations or treaties, which might require the Company to change the way it operates or become subject to
taxation.

Ironshore Inc.
Notes to consolidated financial statements (Expressed in thousands of U.S. dollars, except share data)
28
The components of the provision for income taxes attributable to operations consist of the following:
2015 2014
Current tax expense:
U.S. Federal $8,200 $8,895
U.S. State & local 1,400 683
United Kingdom 766 1,213
Ireland (270) (22)
Total 10,096 10,769
Deferred tax benefit:
U.S. Federal (25,989) (7,674)
U.S. State & local - (249)
United Kingdom 952 60
Total (25,037) (7,863)
Income tax expense (benefit) ($14,941) $2,906
Deferred income taxes reflect the tax impact of temporary differences between the carrying amounts of assets and liabilities for
financial reporting and income tax purposes. Significant components of the net deferred tax assets were as follows:
2015 2014
Deferred tax assets:
Discounting of loss reserves $8,604 $8,406
Unearned premiums 6,629 8,303
Deferred acquisition costs 21,131 24,040
Non-deductible compensation 16,187 17,466
Net operating losses 13,763 8,393
Underwriting losses - 3,170
Intercompany service accrual 4,330 5,124
Deferred ceding commissions 2,016 2,674
Other deferred tax assets 12,287 3,862
Total deferred tax assets 84,947 81,438
Valuation allowance (26,655) (47,623)
Deferred tax assets net of valuation allowance 58,292 33,815
Deferred tax liabilities:
Intercompany revenue accrual (6,402) (8,261)
Amortization of intangibles (4,427) (3,880)
Underwriting income (1,772) -
Investments - fixed maturity securities - (1,048)
Investments - equity securities - (731)
Other deferred tax liabilities (8,463) (7,704)
Total deferred tax liabilities (21,064) (21,624)
Net deferred tax asset $37,228 $12,191
The Company’s net deferred tax asset or liability relates primarily to net operating loss carry-forwards and U.S. GAAP versus tax
basis accounting differences. The Company has provided a valuation allowance to reduce certain deferred tax assets to an amount
that management expects will more likely than not be realized. During 2015, the Company reassessed its estimate of deferred tax
assets that are more likely than not to be realized, resulting in a reduction to the valuation allowance. The deferred tax asset is
realizable to the extent of projected future taxable income and deferred tax liabilities that can offset deferred tax assets.
In the prior year, the Company established a valuation allowance for its U.S., U.K., Irish subsidiaries that are subject to corporate,
federal, state and local income taxes as management believes that the realization of a portion of tax benefits from these deferred

Ironshore Inc.
Notes to consolidated financial statements (Expressed in thousands of U.S. dollars, except share data)
29
tax assets is uncertain due to negative evidence at that time that sufficient taxable income will be generated in the future. During
the year, the Company recorded net reductions to the valuation allowance of $20,968, a significant portion of which is in respect of
U.S. operations. The reduction in the valuation allowance is due to the Company’s reassessment of its estimate of deferred tax
assets that is more likely than not to be realized and its projections of future income.
The expected tax provision computed on pre-tax income at the weighted average tax rate has been calculated as the sum of the pre-
tax income in each jurisdiction multiplied by that jurisdiction’s applicable statutory tax rate. A reconciliation of income before tax
expense by taxing jurisdiction to the expected income tax provision by taxing jurisdiction and consolidated weighted average
effective income tax rate is as follows for the years ended December 31, 2015 and 2014:
2015 2014
Income (loss) before tax expense by taxing jurisdiction:
Bermuda $18,891 $69,208
United States 19,905 16,844
Ireland (4,467) 1,356
Canada (187) 463
United Kingdom 10,732 7
Australia (1,440) (348)
Hong Kong (397) (158)
United Arab Emirates (175) -
Consolidated income before tax expense $42,862 $87,372
Statutory tax rates:
Bermuda 0.0% 0.0%
United States 35.0% 35.0%
Ireland 12.5% 12.5%
Canada 25.0% 25.0%
United Kingdom 20.3% 21.5%
Australia 30.0% 30.0%
Hong Kong 16.5% 16.5%
United Arab Emirates 0.0% 0.0%
Expected income tax provision by taxing jurisdiction
Bermuda - -
United States 6,967 5,895
Ireland (558) 170
Canada (47) 116
United Kingdom 2,173 2
Australia (432) (104)
Hong Kong (66) (28)
United Arab Emirates - -
Consolidated $8,037 $6,051
Consolidated weighted average effective income tax rate 18.8% 6.9%
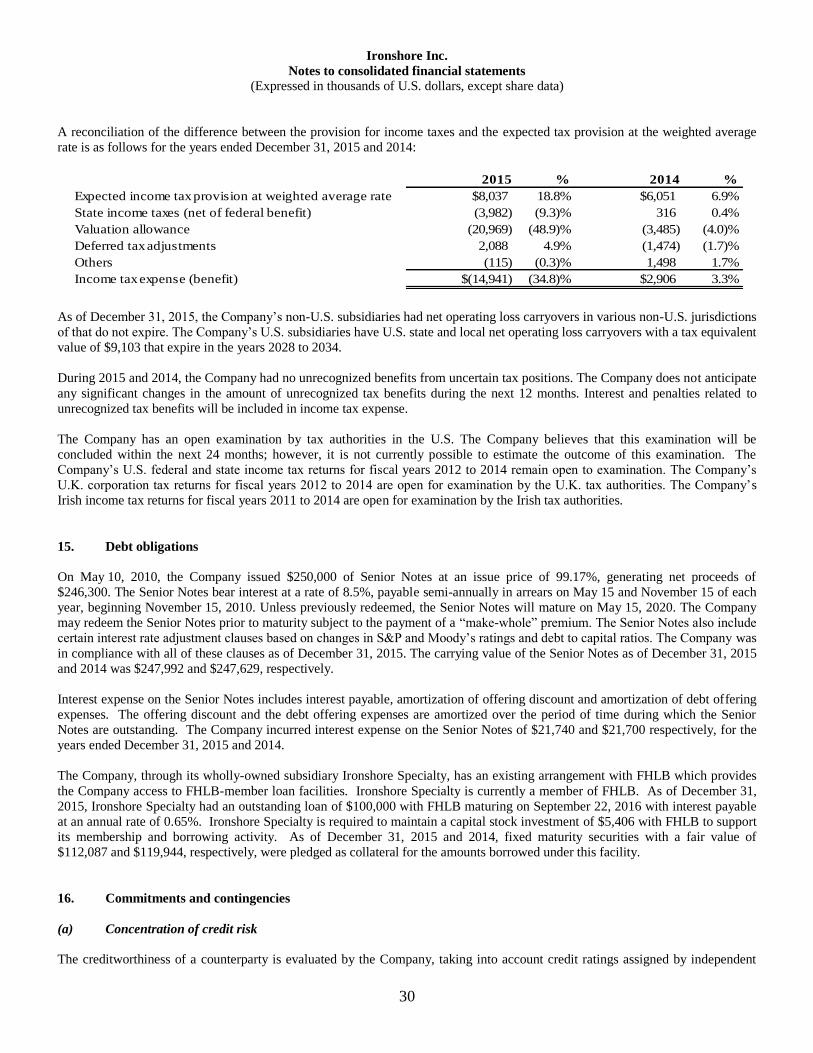
Ironshore Inc.
Notes to consolidated financial statements (Expressed in thousands of U.S. dollars, except share data)
30
A reconciliation of the difference between the provision for income taxes and the expected tax provision at the weighted average
rate is as follows for the years ended December 31, 2015 and 2014:
2015 % 2014 %
Expected income tax provision at weighted average rate $8,037 18.8% $6,051 6.9%
State income taxes (net of federal benefit) (3,982) (9.3)% 316 0.4%
Valuation allowance (20,969) (48.9)% (3,485) (4.0)%
Deferred tax adjustments 2,088 4.9% (1,474) (1.7)%
Others (115) (0.3)% 1,498 1.7%
Income tax expense (benefit) $(14,941) (34.8)% $2,906 3.3%
As of December 31, 2015, the Company’s non-U.S. subsidiaries had net operating loss carryovers in various non-U.S. jurisdictions
of that do not expire. The Company’s U.S. subsidiaries have U.S. state and local net operating loss carryovers with a tax equivalent
value of $9,103 that expire in the years 2028 to 2034.
During 2015 and 2014, the Company had no unrecognized benefits from uncertain tax positions. The Company does not anticipate
any significant changes in the amount of unrecognized tax benefits during the next 12 months. Interest and penalties related to
unrecognized tax benefits will be included in income tax expense.
The Company has an open examination by tax authorities in the U.S. The Company believes that this examination will be
concluded within the next 24 months; however, it is not currently possible to estimate the outcome of this examination. The
Company’s U.S. federal and state income tax returns for fiscal years 2012 to 2014 remain open to examination. The Company’s
U.K. corporation tax returns for fiscal years 2012 to 2014 are open for examination by the U.K. tax authorities. The Company’s
Irish income tax returns for fiscal years 2011 to 2014 are open for examination by the Irish tax authorities.
15. Debt obligations
On May 10, 2010, the Company issued $250,000 of Senior Notes at an issue price of 99.17%, generating net proceeds of
$246,300. The Senior Notes bear interest at a rate of 8.5%, payable semi-annually in arrears on May 15 and November 15 of each
year, beginning November 15, 2010. Unless previously redeemed, the Senior Notes will mature on May 15, 2020. The Company
may redeem the Senior Notes prior to maturity subject to the payment of a “make-whole” premium. The Senior Notes also include
certain interest rate adjustment clauses based on changes in S&P and Moody’s ratings and debt to capital ratios. The Company was
in compliance with all of these clauses as of December 31, 2015. The carrying value of the Senior Notes as of December 31, 2015
and 2014 was $247,992 and $247,629, respectively.
Interest expense on the Senior Notes includes interest payable, amortization of offering discount and amortization of debt offering
expenses. The offering discount and the debt offering expenses are amortized over the period of time during which the Senior
Notes are outstanding. The Company incurred interest expense on the Senior Notes of $21,740 and $21,700 respectively, for the
years ended December 31, 2015 and 2014.
The Company, through its wholly-owned subsidiary Ironshore Specialty, has an existing arrangement with FHLB which provides
the Company access to FHLB-member loan facilities. Ironshore Specialty is currently a member of FHLB. As of December 31,
2015, Ironshore Specialty had an outstanding loan of $100,000 with FHLB maturing on September 22, 2016 with interest payable
at an annual rate of 0.65%. Ironshore Specialty is required to maintain a capital stock investment of $5,406 with FHLB to support
its membership and borrowing activity. As of December 31, 2015 and 2014, fixed maturity securities with a fair value of
$112,087 and $119,944, respectively, were pledged as collateral for the amounts borrowed under this facility.
16. Commitments and contingencies
(a) Concentration of credit risk
The creditworthiness of a counterparty is evaluated by the Company, taking into account credit ratings assigned by independent

Ironshore Inc.
Notes to consolidated financial statements (Expressed in thousands of U.S. dollars, except share data)
31
agencies. The credit approval process involves an assessment of factors, including, among others, the counterparty, country and
industry credit exposure limits. The areas where significant concentrations of credit risk may exist include reinsurance
recoverables (see Note 10), investments and cash and cash equivalent balances.
The Company underwrites a significant amount of its business through brokers. Credit risk exists should any of these brokers be
unable to fulfill their contractual obligations with respect to the payments of insurance and reinsurance balances owed to the
Company.
During the years ended December 31, 2015 and 2014, the following brokers were used to generate greater than 10% of the
Company’s consolidated gross premiums written:
% of Gross Premiums % of Gross Premiums
Written December 31, Written December 31,
Broker 2015 2014
Marsh & McLennan Companies 12.3% 12.4%
Aon Benfield 11.0% 10.1%
The Company’s investment portfolio is managed in accordance with guidelines designed to ensure specific investment strategies
are met. These guidelines include standards of diversification which limit the allowable holdings of any single issue. There were
no investments in any entity in excess of 10% of the Company’s shareholders’ equity as of December 31, 2015 and 2014 other
than investments issued or guaranteed by the U.S. government, its agencies or U.S. Government-Sponsored Enterprises.
The Company’s cash and cash equivalents are on deposit with various financial institutions. Credit risk arises from the failure of
the counterparty to perform according to the terms of a contract. The Company’s deposits are with reputable banks to minimize
this risk and they are located principally in Bermuda, the U.S., the U.K., Ireland, Singapore, Australia, Canada and the Cayman
Islands.
(b) Operating leases
The Company has entered into various operating lease agreements to lease office space and fixtures and fittings that expire up to
2032. During the years ended 2015 and 2014, total rent expenses of $11,728 and $8,551, respectively, were recorded in general
and administrative expenses. The future minimum lease payments in the aggregate as of December 31, 2015 are as follows:
December 31, 2015
2016 $6,694
2017 8,789
2018 10,227
2019 10,152
2020 9,530
Later years 88,606
Total minimum future lease commitments $133,998
(c) Outsourcing
On December 23, 2011, the Company entered into a services agreement with Genpact International, Inc. (“Genpact”), whereby
Genpact provides certain information technology processes and business process functions to the Company up to December 31,
2018. The future minimum payments as of December 31, 2015 are as follows:
December 31, 2015
2016 $15,391
2017 15,706
2018 16,167
Total minimum future commitments $47,264

Ironshore Inc.
Notes to consolidated financial statements (Expressed in thousands of U.S. dollars, except share data)
32
(d) Letters of credit
On December 1, 2009, the Company entered into a $50,000 standby letter of credit facility provided by Citibank Europe plc.
Refer to Note 7 for additional disclosure.
(e) Litigation
The Company is subject to litigation and arbitration in the normal course of its business. These lawsuits and arbitrations principally
involve claims on policies of insurance and contracts of reinsurance and are typical for the Company and for the property and
casualty insurance and reinsurance industry in general. Such legal proceedings are considered in connection with the Company’s
loss and loss expense reserves. In addition to litigation relating to insurance and reinsurance claims, the Company and its
subsidiaries are subject to lawsuits in the normal course of business. The status of any such legal actions is actively monitored by
management. If management believed, based on available information, that an adverse outcome upon resolution of a given legal
action was probable and the amount of that adverse outcome was reasonable to estimate, a loss would be recognized and a related
liability recorded. No such liabilities were recorded by the Company as of December 31, 2015 and 2014.
(f) Other Investments
As of December 31, 2015 and 2014, the Company had an unfunded commitment to invest $88,202 and $101,377, respectively,
into closed-end limited partnership funds.
17. Related party transactions
On July 1, 2015, the Company through its subsidiary Ironshore Insurance Services, LLC entered into an agreement with Summit
Glory, LLC to lease certain office space in New York City expiring on May 31, 2032. Summit Glory, LLC is a wholly-owned
subsidiary of Fosun Property Holdings Limited, a subsidiary of Fosun. During the year ended December 31, 2015, the Company
incurred rental, maintenance and utility expenses of $1,589 related to this lease.
As of December 31, 2015 and 2014, the Company through its wholly-owned subsidiary, Ironshore Surety Holdings Inc. (“ISHI”)
invested a total of $26,463 and $20,376, respectively, in Lexon Group composed of Lexon Surety Group LLC (“LSG”), Surety
Agency Holding Company LLC (“SAHC”), and Surety Management Company, LLC (“SMC”). Lexon Group is engaged in the
business of underwriting, placing, insuring and reinsuring contract and commercial surety bonds, court and probate surety bonds,
surety bail bonds, U.S. Customs surety bonds and other related risks. ISHI purchased Class B units in LSG and common units in
SAHC and SMC. The Class B units rank senior to the Common and Class A units of LSG. The Class B units are also entitled to a
cumulative fixed return of 3% per annum for the first five years and then 9% per annum thereafter. The investment is recorded in
other assets in the Company’s consolidated balance sheet as of December 31, 2015 and 2014.
In connection with the above investment, the Company through its subsidiaries Ironshore Indemnity and Ironshore Specialty
provides quota share reinsurance and a primary fronting facility on new and renewal business for U.S. commercial and contract
surety risks. The amounts of gross written premium assumed by Ironshore Indemnity and Ironshore Specialty as part of the quota
share facility for the year ending December 31, 2015 and 2014 are $50,282 and $31,851, respectively.
As of December 31, 2015, Company had an investment of $18,514 in CMF and had an unrealized loss of $2,380 for the year ending
December 31, 2015. Fosun Momentum Holdings Limited is the sole shareholder of the general partner of CMF. Fosun Momentum
Holdings Limited is owned by Fosun International Holdings Ltd., a related party. The investment is recorded in other investments
in the Company’s balance sheet as of December 31, 2015.
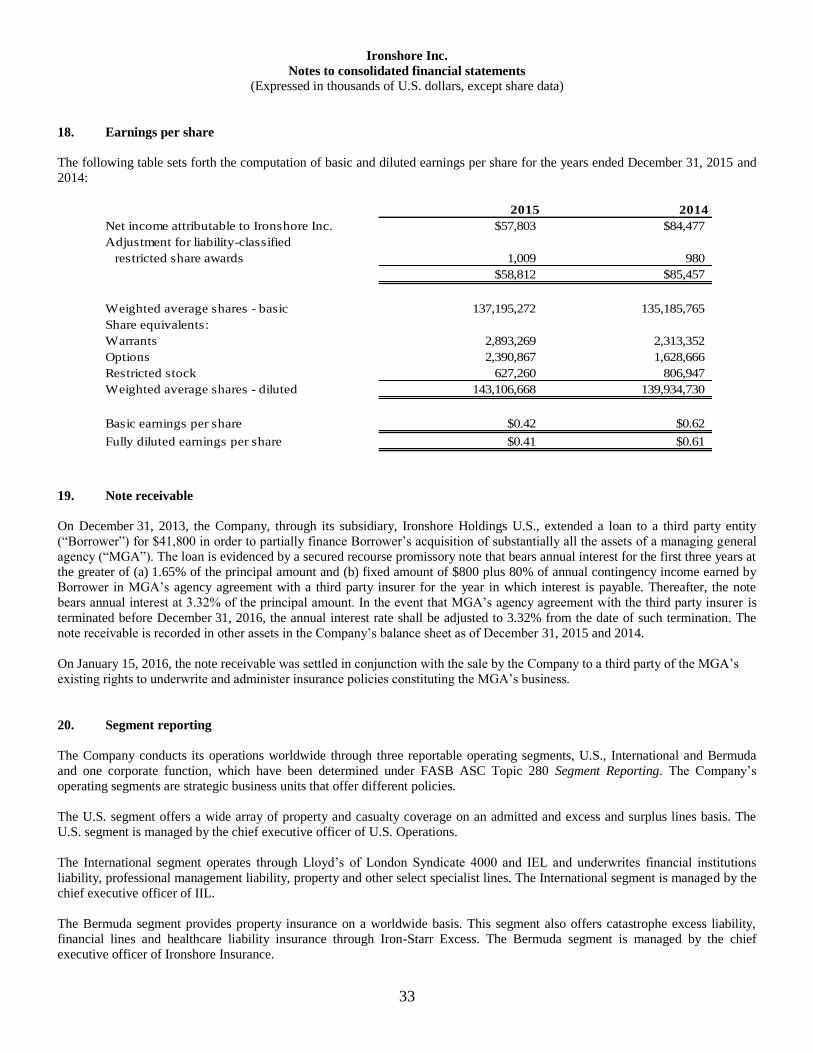
Ironshore Inc.
Notes to consolidated financial statements (Expressed in thousands of U.S. dollars, except share data)
33
18. Earnings per share
The following table sets forth the computation of basic and diluted earnings per share for the years ended December 31, 2015 and
2014:
2015 2014
Net income attributable to Ironshore Inc. $57,803 $84,477
Adjustment for liability-classified
restricted share awards 1,009 980
$58,812 $85,457
Weighted average shares - basic 137,195,272 135,185,765
Share equivalents:
Warrants 2,893,269 2,313,352
Options 2,390,867 1,628,666
Restricted stock 627,260 806,947
Weighted average shares - diluted 143,106,668 139,934,730
Basic earnings per share $0.42 $0.62
Fully diluted earnings per share $0.41 $0.61
19. Note receivable
On December 31, 2013, the Company, through its subsidiary, Ironshore Holdings U.S., extended a loan to a third party entity
(“Borrower”) for $41,800 in order to partially finance Borrower’s acquisition of substantially all the assets of a managing general
agency (“MGA”). The loan is evidenced by a secured recourse promissory note that bears annual interest for the first three years at
the greater of (a) 1.65% of the principal amount and (b) fixed amount of $800 plus 80% of annual contingency income earned by
Borrower in MGA’s agency agreement with a third party insurer for the year in which interest is payable. Thereafter, the note
bears annual interest at 3.32% of the principal amount. In the event that MGA’s agency agreement with the third party insurer is
terminated before December 31, 2016, the annual interest rate shall be adjusted to 3.32% from the date of such termination. The
note receivable is recorded in other assets in the Company’s balance sheet as of December 31, 2015 and 2014.
On January 15, 2016, the note receivable was settled in conjunction with the sale by the Company to a third party of the MGA’s
existing rights to underwrite and administer insurance policies constituting the MGA’s business.
20. Segment reporting
The Company conducts its operations worldwide through three reportable operating segments, U.S., International and Bermuda
and one corporate function, which have been determined under FASB ASC Topic 280 Segment Reporting. The Company’s
operating segments are strategic business units that offer different policies.
The U.S. segment offers a wide array of property and casualty coverage on an admitted and excess and surplus lines basis. The
U.S. segment is managed by the chief executive officer of U.S. Operations.
The International segment operates through Lloyd’s of London Syndicate 4000 and IEL and underwrites financial institutions
liability, professional management liability, property and other select specialist lines. The International segment is managed by the
chief executive officer of IIL.
The Bermuda segment provides property insurance on a worldwide basis. This segment also offers catastrophe excess liability,
financial lines and healthcare liability insurance through Iron-Starr Excess. The Bermuda segment is managed by the chief
executive officer of Ironshore Insurance.

Ironshore Inc.
Notes to consolidated financial statements (Expressed in thousands of U.S. dollars, except share data)
34
The corporate function includes the activities of the parent company and activities of certain key executives, such as the Chief
Executive Officer and Chief Financial Officer of Ironshore. The corporate function includes revenue earned on the Company’s
investment portfolio and costs associated with parent company activities.
The Company does not manage its assets by segment and therefore total assets are not allocated to the segments.
Segment data for the years ended December 31, 2015, and 2014 are as follows:
Year ended December 31, 2015 U.S. International Bermuda Total Corporate Consolidated
REVENUES
Gross premiums written $1,402,484 $597,228 $164,140 $2,163,852 - $2,163,852
Reinsurance premiums ceded (456,879) (139,517) (87,632) (684,028) - (684,028)
Net premiums written 945,605 457,711 76,508 1,479,824 - 1,479,824
Change in unearned premiums 65,590 (8,528) 6,365 63,427 - 63,427
Net premiums earned 1,011,195 449,183 82,873 1,543,251 - 1,543,251
Net investment income - - - - 113,300 113,300
Net realized and unrealized losses on investments - - - - (48,351) (48,351)
Net foreign exchange losses - - - - (11,054) (11,054)
Other income 25,733 15,622 9,058 50,413 - 50,413
Total revenues 1,036,928 464,805 91,931 1,593,664 53,895 1,647,559
EXPENSES
Losses and loss adjustment expenses 729,863 240,388 39,967 1,010,218 - 1,010,218
Acquisition expenses 105,971 105,416 (1,334) 210,053 - 210,053
General and administrative expenses 166,528 85,199 23,497 275,224 47,504 322,728
Non-recurring transaction expenses - - - - 39,529 39,529
Interest expense - - - - 22,169 22,169
Total expenses 1,002,362 431,003 62,130 1,495,495 109,202 1,604,697
Income (loss) before tax expense $34,566 $33,802 $29,801 $98,169 ($55,307) $42,862
Loss ratio (a) 72.2% 53.5% 48.2% 65.5%
Acquisition costs ratio (b) 10.5% 23.5% (1.6)% 13.6%
General and administrative expense ratio (c) 13.9% 15.5% 17.4% 14.6%
Combined ratio (d) 96.6% 92.5% 64.0% 93.7%
(a) The loss ratio is calculated by dividing losses and loss adjustment expenses by net premiums earned.
(b) The acquisition costs ratio is calculated by dividing acquisition expenses by net premiums earned.
(c) The general and administrative expense ratio is calculated by dividing general and administrative expenses less other income by net premiums earned.
Corporate general and administrative expenses, non-recurring transaction expenses and corporate other income are not included in the calculation.
(d) The combined ratio is the sum of the loss ratio, acquisition costs ratio and general and administrative expense ratio.

Ironshore Inc.
Notes to consolidated financial statements (Expressed in thousands of U.S. dollars, except share data)
35
Year ended December 31, 2014 U.S. International Bermuda Total Corporate Consolidated
REVENUES
Gross premiums written $1,437,684 $574,327 $198,543 $2,210,554 - $2,210,554
Reinsurance premiums ceded (356,614) (128,749) (106,011) (591,374) - (591,374)
Net premiums written 1,081,070 445,578 92,532 1,619,180 - 1,619,180
Change in unearned premiums (71,448) (35,105) 14,369 (92,184) - (92,184)
Net premiums earned 1,009,622 410,473 106,901 1,526,996 - 1,526,996
Net investment income - - - - 97,043 97,043
Net realized and unrealized gains on investments - - - - 28,039 28,039
Net foreign exchange losses - - - - (5,283) (5,283)
Other income 13,383 12,460 5,711 31,554 2,012 33,566
Total revenues 1,023,005 422,933 112,612 1,558,550 121,811 1,680,361
EXPENSES
Losses and loss adjustment expenses 758,447 251,621 67,206 1,077,274 - 1,077,274
Acquisition expenses 115,993 97,738 977 214,708 - 214,708
General and administrative expenses 142,566 70,250 21,975 234,791 44,310 279,101
Interest expense - - - - 21,906 21,906
Total expenses 1,017,006 419,609 90,158 1,526,773 66,216 1,592,989
Income before tax expense $5,999 $3,324 $22,454 $31,777 $55,595 $87,372
Loss ratio (a) 75.1% 61.3% 62.9% 70.5%
Acquisition costs ratio (b) 11.5% 23.8% 0.9% 14.1%
General and administrative expense ratio (c) 12.8% 14.1% 15.2% 13.3%
Combined ratio (d) 99.4% 99.2% 79.0% 97.9%
(a) The loss ratio is calculated by dividing losses and loss adjustment expenses by net premiums earned.
(b) The acquisition costs ratio is calculated by dividing acquisition expenses by net premiums earned.
(c) The general and administrative expense ratio is calculated by dividing general and administrative expenses less other income by net premiums earned.
Corporate general and administrative expenses, non-recurring transaction expenses and corporate other income are not included in the calculation.
(d) The combined ratio is the sum of the loss ratio, acquisition costs ratio and general and administrative expense ratio.
Gross premiums written by type of business for the years ended December 31, 2015 and 2014 are as follow:
U.S. International Bermuda Total
Year ended December 31, 2015
Casualty $1,079,832 $191,063 $41,297 $1,312,192
Property 167,577 121,221 122,843 411,641
Specialty Short Tail 155,075 284,944 - 440,019
Total $1,402,484 $597,228 $164,140 $2,163,852
U.S. International Bermuda Total
Year ended December 31, 2014
Casualty $1,093,919 $204,058 $48,274 $1,346,251
Property 171,090 108,461 150,269 429,820
Specialty Short Tail 172,675 261,808 - 434,483
Total $1,437,684 $574,327 $198,543 $2,210,554

Ironshore Inc.
Notes to consolidated financial statements (Expressed in thousands of U.S. dollars, except share data)
36
21. Statutory financial data
Bermuda
Ironshore Insurance is subject to the requirements of the Bermuda Insurance Act. Under the Bermuda Insurance Act, Ironshore
Insurance is required to prepare statutory financial statements and to file a statutory financial return. The Bermuda Insurance Act
also requires Ironshore Insurance to maintain certain measures of solvency and liquidity during the year. Declarations of dividends
from retained earnings and distributions from additional paid-in capital are subject to these solvency and liquidity requirements
being met. As of December 31, 2015 and 2014, these requirements were met.
Under the Bermuda Insurance Act, Ironshore Insurance is restricted from paying dividends for amounts greater than 25% of the
prior year’s statutory capital and surplus unless approved by the Bermuda Monetary Authority.
As of December 31, 2015 and 2014, Ironshore Insurance was required to maintain a minimum statutory capital and surplus of
$550,747 and $654,500, respectively. As of December 31, 2015 and 2014, Ironshore Insurance had statutory capital and surplus of
$1,388,301 and $1,254,923, respectively, and its statutory net income was $130,133 and $91,027 for the years ended December
31, 2015 and 2014, respectively. The declaration of dividends from retained earnings and distributions from additional paid-in
capital are limited to the extent that the solvency and liquidity requirements are met.
United States Ironshore Indemnity and Ironshore Specialty file financial statements prepared in accordance with statutory accounting practices
prescribed or permitted by U.S. insurance regulators. Statutory net income and statutory surplus, as reported to the insurance
regulatory authorities, differ in certain respects from the amounts prepared in accordance with U.S. GAAP. The main differences
between statutory net income and U.S. GAAP net income relate to deferred acquisition costs, deferred income and deferred
income taxes. In addition to deferred acquisition costs, deferred income and deferred income tax assets, other differences between
statutory surplus and U.S. GAAP shareholders’ equity are unrealized appreciation or decline in value of investments and non-
admitted assets.
Ironshore Indemnity is required to maintain a minimum combined statutory surplus of $15,000. As of December 31, 2015 and
2014, Ironshore Indemnity’s statutory surplus was $154,000 and $156,600, respectively, and its statutory net income (loss) was
$(48) and $2,894 for the years ended December 31, 2015 and 2014, respectively.
Ironshore Specialty is required to maintain a minimum combined statutory surplus of $15,000. As of December 31, 2015 and
2014, Ironshore Specialty’s statutory surplus was $333,950 and $325,800 respectively, and its statutory net income was $20,900
and $31,300 for the years ended December 31, 2015 and 2014, respectively.
Both of Ironshore Indemnity and Ironshore Specialty must seek regulatory approval at least 30 days prior to payment of an
extraordinary dividend or distribution, or payment of a dividend from a source other than earned surplus (determined as of the end
of the immediately preceding quarter for which the insurer has filed a quarterly or annual statement). Such an extraordinary
dividend, extraordinary distribution or a dividend paid from a source other than earned surplus cannot be paid unless the insurance
regulator has approved such payment or has failed to disapprove the payment within the 30-day period. An extraordinary dividend
or extraordinary distribution includes any dividend, distribution of cash or other property the fair market value of which together
with that of other dividends or distributions made within the preceding 12 months exceeds the greater of (i) 10% of the insurer’s
policyholders surplus as of the 31st day of December next preceding, or (ii) the net income for the 12-month period ending on the
31st day of December next preceding, but does not include pro rata distributions of any class of the insurer’s own securities. For
purposes of this calculation, the Minnesota statute applicable to Ironshore Indemnity provides that “net income” excludes realized
capital gains. Ironshore Indemnity could not pay any dividend without prior regulatory approval. As of December 31, 2015,
Ironshore Indemnity obtained regulatory approval and paid $5,000 dividend to its parent company, Ironshore Holdings U.S.
As of December 31, 2015 and 2014, the maximum dividend payout that Ironshore Specialty could have made without prior
regulatory approval was approximately $15,600 and $16,800, respectively. In 2015 and 2014, Ironshore Specialty made dividend
payments of $15,600 and $0, respectively, to its parent company, Ironshore Holdings U.S.

Ironshore Inc.
Notes to consolidated financial statements (Expressed in thousands of U.S. dollars, except share data)
37
United Kingdom and Lloyd’s
(pounds sterling in thousands)
The Company owns a Lloyd’s managing agency, PMA which operates in the Lloyd’s insurance market and manages Syndicate
4000, Special Purpose Syndicate 6110 (“SPS 6110”) and Syndicate 2014. PMA is subject to regulation by the UK Financial
Conduct Authority (“FCA”) and the Prudential Regulation Authority (“PRA”). The majority of the underwriting risk is borne by
ICCL which is a corporate member at Lloyd’s. Effective January 1, 2010, Ironshore CC (Two) Limited (“ICC2”), which is a
wholly owned subsidiary of IIL, also participated in the underwriting of Syndicate 4000. This participation ceased at the end of the
2012 year of account, leaving ICCL as the sole capital provider for Syndicate 4000 in the 2013 underwriting years onwards. For
the 2015 year of account, Syndicate 4000 has a capacity of £270,000.
PMA is subject to regulations by Lloyds which requires it to maintain certain measures of solvency and liquidity during the year.
As of December 31, 2015, PMA was required to maintain a minimum fixed capital of £400 (2014: £400), a net current asset
margin of £1,984 (2014: £368) and a minimum net asset requirement of £1,109 (2014: £615). As of December 31, 2015, PMA had
fixed capital of £2,150 (2014: £2,200), a net current asset surplus of £14 (2014: £6) and a surplus of net assets of £15,706 (2014:
£7,900).Therefore as of December 31, 2015 and 2014, these requirements were met.
Corporate members of Lloyd’s and Lloyd’s syndicates are bound by the rules of Lloyd’s, which are prescribed by-laws and
Requirements made by the Council of Lloyd’s under powers conferred by the Lloyd’s Act 1982. These rules prescribe members’
membership subscription, the level of their contribution to the Lloyd’s Central Fund and the assets they must deposit with Lloyd’s
in support of their underwriting. The Council of Lloyd’s has broad powers to sanction breaches of its rules, including the power to
restrict or prohibit a member’s participation on Lloyd’s Syndicates.
The amount which is provided as FAL is not available for distribution for the payment of dividends or for working capital
requirements. Corporate members may also be required to maintain funds under the control of Lloyd’s in excess of their capital
requirements and such funds also may not be available for distribution for the payment of dividends. Lloyd’s sets the corporate
members’ required capital annually. Individual Capital Assessments (ICA’s) are agreed with the syndicates based on their business
plans.
FAL may comprise cash, certain investments and undrawn letters of credit provided by approved banks. The FAL requirement set
by Lloyd’s to support the planned level of underwriting by ICCL for 2016 and 2015 was £240,464 and £210,048, respectively.
ICC2 ceased underwriting after the 2012 year of account. However, as of December 31, 2015, ICC2 was still required to hold FAL
to a value of £11,700 until such time as the corporate quota share agreement with a specific reinsurer is commuted. As of
December 31, 2015 and 2014, ICCL met its FAL requirement. Refer to Note 7 for the fair value of assets restricted to satisfy
ICCL’s FAL requirements.
Ireland
The Company’s Irish-regulated operating subsidiary, IEL, is subject to the regulatory framework established by the Central Bank
of Ireland (“CBI”). It is required to:
maintain an adequate solvency margin and guarantee fund;
submit quarterly and annual regulatory returns to ensure that IEL maintains an adequate solvency margin and minimum
guarantee funds as well as ad hoc reporting of certain material transactions; and
obtain regulatory pre-approval of certain transactions, such as payment of dividends or acquisitions and disposals in the
ownership/voting rights of (re)insurance companies.
The CBI has minimum competency and fitness and probity codes that seek to ensure that regulated entities are run by those with
appropriate professional qualifications or experience within the CBI’s view, with regulatory pre-approval required for certain key
roles. The CBI’s Corporate Governance Code for Credit Institutions and Insurance Undertakings 2013 sets out the minimum
statutory corporate governance requirements for Irish incorporated credit institutions and insurance undertakings. A compliance
statement specifying whether this has been complied with during the period must be submitted to the CBI on an annual basis.

Ironshore Inc.
Notes to consolidated financial statements (Expressed in thousands of U.S. dollars, except share data)
38
In addition, the CBI has broad supervisory and administrative powers over capital and surplus requirements; outsourcing
arrangements; changes in qualifying holdings; intercompany loans; related party transactions; and changes in and the declaration
of and payment of dividends or other distributions. IEL is required to seek prior approval from the CBI in respect of these matters.
IEL is also subject to limited regulation from the FCA in respect of its London branch.
As of December 31, 2015 and 2014, IEL was required to maintain a minimum statutory capital and surplus of $22,326 and
$23,101, respectively. As of December 31, 2015 and 2014, IEL had statutory capital and surplus of $99,599 and $92,578,
respectively, and its statutory net income (loss) was $(4,197) and $1,226 for the years ended December 31, 2015 and 2014,
respectively.
International
The Company’s international subsidiaries prepare statutory financial statements based on local laws and regulations. Some
jurisdictions impose complex regulatory requirements on insurance companies while other jurisdictions impose fewer
requirements. In some countries, the applicable subsidiary must obtain licenses issued by governmental authorities to conduct local
insurance business. These licenses may be subject to reserves and minimum capital and solvency tests. Jurisdictions may impose
fines, censure, and/or criminal sanctions for violation of regulatory requirements.
22. Subsequent events
Subsequent events have been evaluated through March 10, 2016, the date on which the financial statements were available to be
issued.