IRON CARBONATE SCALE GROWTH AND THE EFFECT OF …
23
05285 ~~RROSION2005 IRON CARBONATE SCALE GROWTH AND THE EFFECT OF INHIBITION IN C02 CORROSION OF MILD STEEL Kunal Chokshi, Wei Sun, Srdjan Nesic Institute for Corrosion and Multiphase Technology, Ohio University 342 West State Street Athens, Ohio 45701 Abstract Investigations were conducted to investigate iron carbonate scale precipitation, the interaction between a corrosion inhibition and the precipitating iron carbonate scale, and their effects on the corrosion rate. Both the effects of iron carbonate precipitation on inhibited and uninhibited surfaces and the effects of inhibition on surfaces with iron carbonate scale were studied. The experiments were done in glass cells at 80 °C and a iron carbonate supersaturation range of 7 - 150. A generic imidazoline based inhibitor was added at various points in the iron carbonate scale formation process. Both corrosion rates and precipitation rates were measured using electrochemical and weight gain/loss methods. The scale was later analyzed using scanning electron microscopy (SEM). It was found that the dissolved ferrous ion concentration method, used previously, overestimates the rate of iron carbonate precipitation. Although no antagonism was found under any of other conditions tested, it was seen that the addition of the inhibitor retarded the growth of the iron carbonate scale. Keywords: iron carbonate, scale, film, inhibitor, precipitation, CO 2 corrosion Introduction In CO2 corrosion, some iron carbide or iron carbonate scale form on the surface due to the corrosion process. As a result, the surface of the metal is not always bare when the inhibitor is applied. Depending on the time when the inhibitor is added, the presence of the corrosion scale could affect the workings of the inhibitor. However very little research has been devoted to study of corrosion inhibition of the steel covered with corrosion product layers. Gulbrandsen et at., (1998) observed that inhibitor performance was impaired with increasing precorrosion time and increasing temperature. The inhibitor problems were attributed to the presence of the iron carbide layer at the steel surface. The longer the Copyright @2005 by NACE International. Requests for permission to publish this manuscript in any form, in part or in whole must be in writing to NACE International. Publications Division, 1440 South Creek Drive, Houston, Texas 77084 77084-4906. The material presented and the views expressed in this paper are solely those of the author(s) and not necessarily endorsed by the Association. Printed in U.S.A. 1
Transcript of IRON CARBONATE SCALE GROWTH AND THE EFFECT OF …
05285 ~~RROSION2005IRON CARBONATE SCALE GROWTH AND THE EFFECT OF INHIBITION IN
C02 CORROSION OF MILD STEEL
Kunal Chokshi, Wei Sun, Srdjan NesicInstitute for Corrosion and Multiphase Technology,
Ohio University342 West State StreetAthens, Ohio 45701
Abstract
Investigations were conducted to investigate iron carbonate scale precipitation,the interaction between a corrosion inhibition and the precipitating iron carbonate scale,and their effects on the corrosion rate. Both the effects of iron carbonate precipitation oninhibited and uninhibited surfaces and the effects of inhibition on surfaces with ironcarbonate scale were studied. The experiments were done in glass cells at 80 °C and airon carbonate supersaturation range of 7 - 150. A generic imidazoline based inhibitorwas added at various points in the iron carbonate scale formation process. Both corrosionrates and precipitation rates were measured using electrochemical and weight gain/lossmethods. The scale was later analyzed using scanning electron microscopy (SEM). It wasfound that the dissolved ferrous ion concentration method, used previously, overestimatesthe rate of iron carbonate precipitation. Although no antagonism was found under any ofother conditions tested, it was seen that the addition of the inhibitor retarded the growthof the iron carbonate scale.
Keywords: iron carbonate, scale, film, inhibitor, precipitation, CO2 corrosion
Introduction
In CO2 corrosion, some iron carbide or iron carbonate scale form on the surfacedue to the corrosion process. As a result, the surface of the metal is not always bare whenthe inhibitor is applied. Depending on the time when the inhibitor is added, the presenceof the corrosion scale could affect the workings of the inhibitor. However very littleresearch has been devoted to study of corrosion inhibition of the steel covered withcorrosion product layers.
Gulbrandsen et at., (1998) observed that inhibitor performance was impaired withincreasing precorrosion time and increasing temperature. The inhibitor problems wereattributed to the presence of the iron carbide layer at the steel surface. The longer the
Copyright@2005 by NACE International. Requests for permission to publish this manuscript in any form, in part or in whole must be in writing to NACE International.Publications Division, 1440 South Creek Drive, Houston, Texas 77084 77084-4906. The material presented and the views expressed in this paper are solelythose of the author(s) and not necessarily endorsed by the Association. Printed in U.S.A.
1
precorrosion time, the thicker the iron carbide scale would grow and more severely theinhibitor performance was impaired. However, the failure of the inhibitor was not due totransportation of the inhibitor to the metal surface. One reason cited for inhibitor failurewas that the high metal dissolution rates prevented the slowly adsorbing inhibitors fromadsorbing onto the metal surface and protecting it from corrosion. This phenomenon isdescribed by the electromechanical inhibitor desorption model of Drazic V. and DrazicD. (1990).
Nesic et al., (1995) observed that in the presence of iron carbide as well as ironcarbonate scale the performance of an imidazoline-based inhibitor was very poor. Theyconcluded that it was the changes on the steel surface due the precorrosion, which wasresponsible for the weaker performance of the inhibitor rather than the scale itself actingas a diffusion barrier for the inhibitor. Malik (1995) conducted a study to see the effect ofan amine based inhibitor on the surface films. He found that in the presence of ironcarbonate scale, lower concentrations of inhibitor seemed to work better than the higherconcentrations. He also found that in the presence of inhibitor, there was a transformationof the surface structure of iron carbonate.
Iron carbonate scale growth depends primarily on the kinetics of scale formation.Two different expressions were developed to describe the kinetics of iron carbonateprecipitation (respectively by Johnson and Tomson (1991) and Van Hunniket al. (1996».The equation given by Johnson and Tomson (1991) was fitted with experimental resultsat low levels of supersaturation and it overestimated the precipitation rate at large valuesof supersaturation. Similar results were obtained by the equation developed by vanHunnik et al. (1996). In their experiments, the precipitation rate of iron carbonate wasdetermined by the decrease of ferrous ion concentration in the bulk of the solution.Considering that iron carbonate precipitated not only on the coupons but also elsewherein the system, measuring precipitation rate by using ferrous ion concentrationmeasurements lead to an overestimation.
From the preceding discussion, it appears that understanding regarding thekinetics of iron carbonate scale precipitation as well as the interaction between the ironcarbonate scale and inhibition needs improvement.
Experimental procedure
The experiments were performed in the glass cells. Electrochemical corrosionmeasurements were performed in the glass cell as shown in Figure 1 by using apotentiostat connected to a PC. Corrosion rates were measured by using the linearpolarization resistance (LPR) method. A saturated Ag/AgCl reference electrode usedexternally was connected to the cell via a Luggin capillary and a porous wooden plug. Aconcentric platinum ring was used as a counter electrode. Each glass cell was filled with2 liters of distilled water and 1% wt. NaCl. The solution was heated to 80°C and purgedwith 1.0 bar CO2 gas. After the solution was deoxygenated, the pH was increased fromthe equilibrium pH 4.18 to the desired pH by adding a deoxygenated sodium bicarbonate
2
solution. Later the required amounts of Fe++were added in the form of a deoxygenatedferrous chloride salt (FeChAH20) solution. Then the working electrode was inserted intothe solution and the measurements were taken. Prior to immersion, the carbon steelspecimen surfaces were polished with 240, 400 and 600 grit SiC paper, rinsed withalcohol and degreased using acetone.
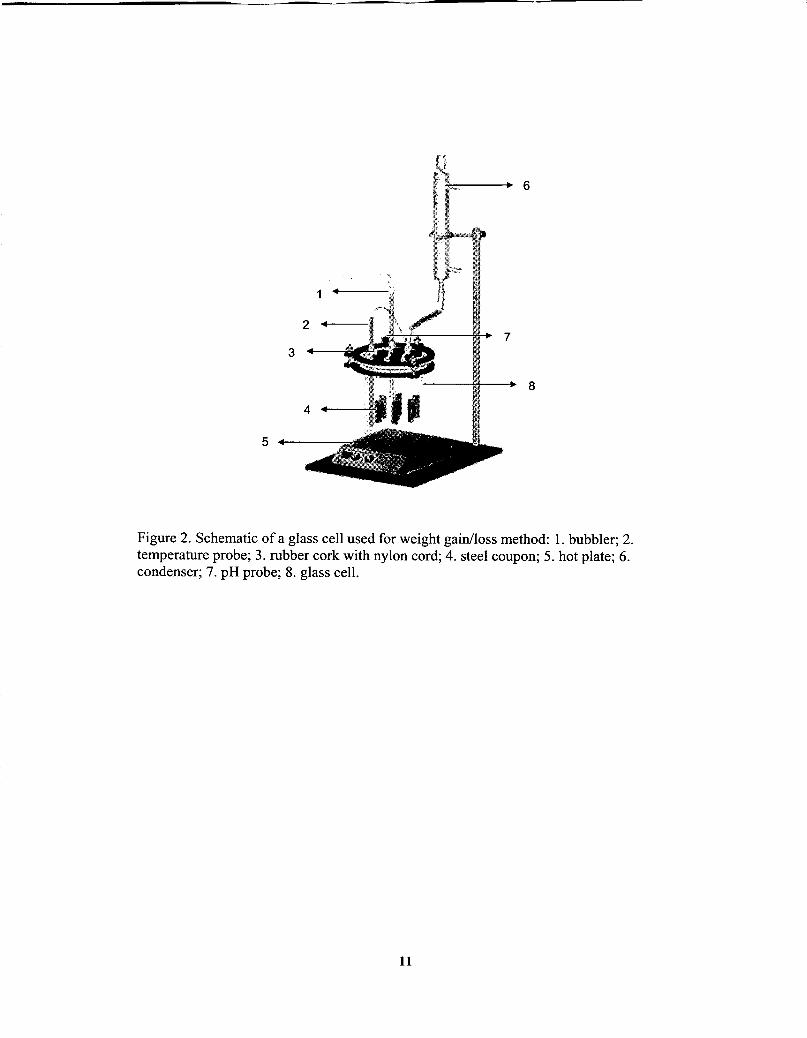
Weight gain/loss measurement was performed in another glass cell shown inFigure 2. Precipitation rate was measured by weight gain/loss method. Precipitation rateof iron carbonate scale was obtained by weighing the coupons which had iron carbonatescale before and after removing the scale. The coupon with the iron carbonate scale on itwas observed using Scanning Electron Microscopy (SEM). The chemical composition ofthe X-65 steel used for all the experiments is shown in Table 1. Two types of genericinhibitors were used for the experiments. The compositions of the inhibitors were shownin Table 2 and Table 3.
Results
The experimental results obtained are presented below in the following manner:• Experiments with scale formation done at different supersaturations without an
inhibitor.• Experiments done with only inhibitor A and inhibitor B without scale formation.• Experiments with scale formation done at different supersaturations with addition
of inhibitors.
Baseline precipitation experiments at different supersaturations without inhibitor
These set of experiments were designed to see the effect of iron carbonate scaleformation at various supersaturations, on both corrosion rate and precipitation rate. Thesupersaturation was varied from 7 to 150 by changing the pH and the Fe++concentration.The Fe++ was added in the system in the form of FeChAH20 salt solution.Supersaturation of iron carbonate is defined as:
CF 2+CC02-ss= e J
Ksp
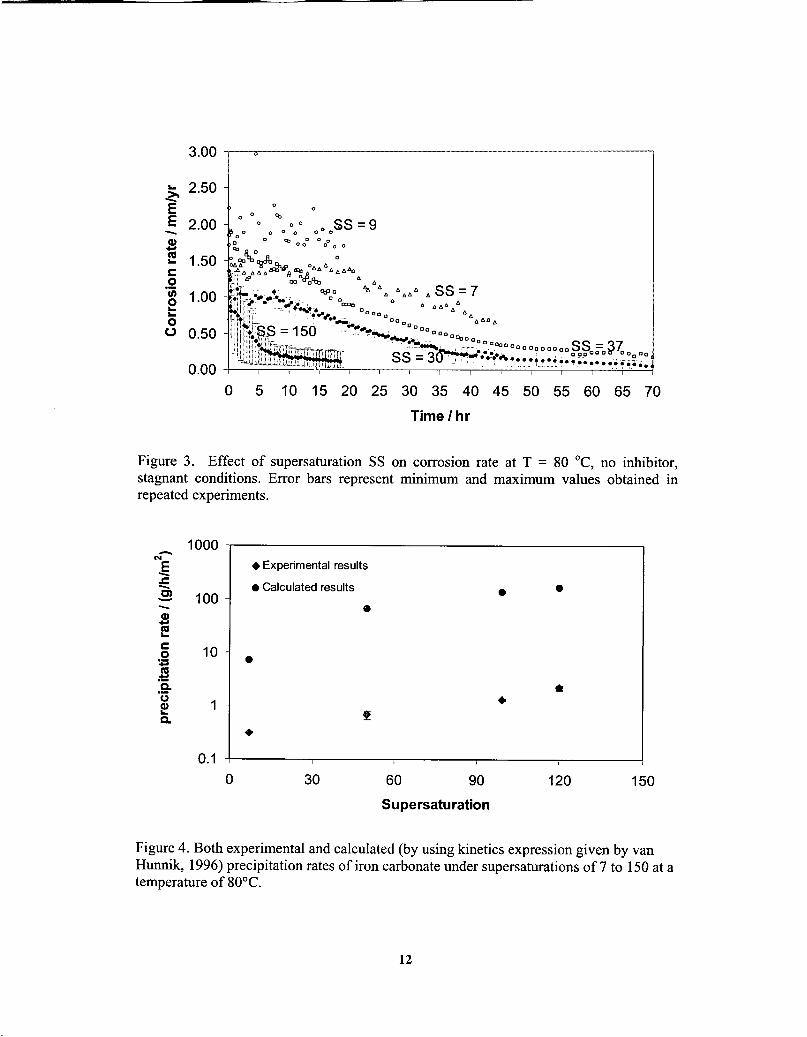
The effect of change in supersaturation on the corrosion rate is shown in Figure 3.Clearly with higher supersaturation the iron carbonate scale formed faster and thecorrosion rate was decreased more rapidly. Error bars display the maximum andminimum values obtained in repeated experiments. Discrepancies in measuredprecipitation rate were identified when compared to literature correlations which weretraced back to the indirect experimental techniques used there to obtain the originalprecipitation kinetics data (Johnson and Tomson 1991 and Van Hunnik 1996). New datagenerated in the present project are one to two orders of magnitude lower compared to thecalculated results using kinetics expressions given by those authors, as shown in Figure 4.Table 4 shows the conditions under which these supersaturations were obtained. The
3

supersaturations were varied from a range of 7 to 150 by varying the pH from 6.0 - 6.6and the Fe++ concentration from 10 - 50 ppm. The error bars shown in Figure 4 representthe maximum and the minimum values. Increase in the precipitation rate of ironcarbonate is observed in the Figure 4, due to the increase in supersaturation of thesolution with respect to iron carbonate. This increase in the precipitation rate, results in adecrease in the corrosion rate of the metal, since the scale blocks a part of the steelsurface, prevents it from corroding, and acts as a diffusion barrier for the corrodingspecies as shown in Figure 3.
The top view and the cross-sectional view of the samples at varioussupersaturations are shown in the Figure 5 - Figure 8. A comparison of scale thickness,crystal grain size, and final corrosion rate for all the baseline experiments atsupersaturation of7 - 150, are shown in Table 5. It is observed that as the supersaturationis increased, the size of the iron carbonate crystal decreases. This is expected since withhigher supersaturation and precipitation rates, higher number of crystals nucleates on thesurface of the metal. This close proximity of nuclei causes interference in growth of thecrystals due to the adjacent crystals. It should be noted that at supersaturation of 7, thisphenomenon is not observed since the experiment was stopped after 45 hours and thecrystals were not allowed to grow any further.
Baseline experiments done with only inhibitor and without scale
This set of experiments was designed to see the effect of inhibitor concentrationon the corrosion rate under non-scaling conditions.
Inhibitor A
The effect of inhibitor A concentration on the corrosion rate is shown in Figure 9.From the figure, it can be seen that at 25 ppm the inhibitor is partially protective, while itdecreases the corrosion rate by more than 80% at 50 ppm.
From the potentiodynamic sweeps (Figure 10), the values of the Tafel slopes weremeasured to be l3a = 62 mY/decade, l3c = 98 mY/decade and the 'B' value was calculatedto be 16.4 mY. From the sweeps, it can be seen that the inhibitor slows down the anodicreaction as well as the cathodic reaction.
Inhibitor B
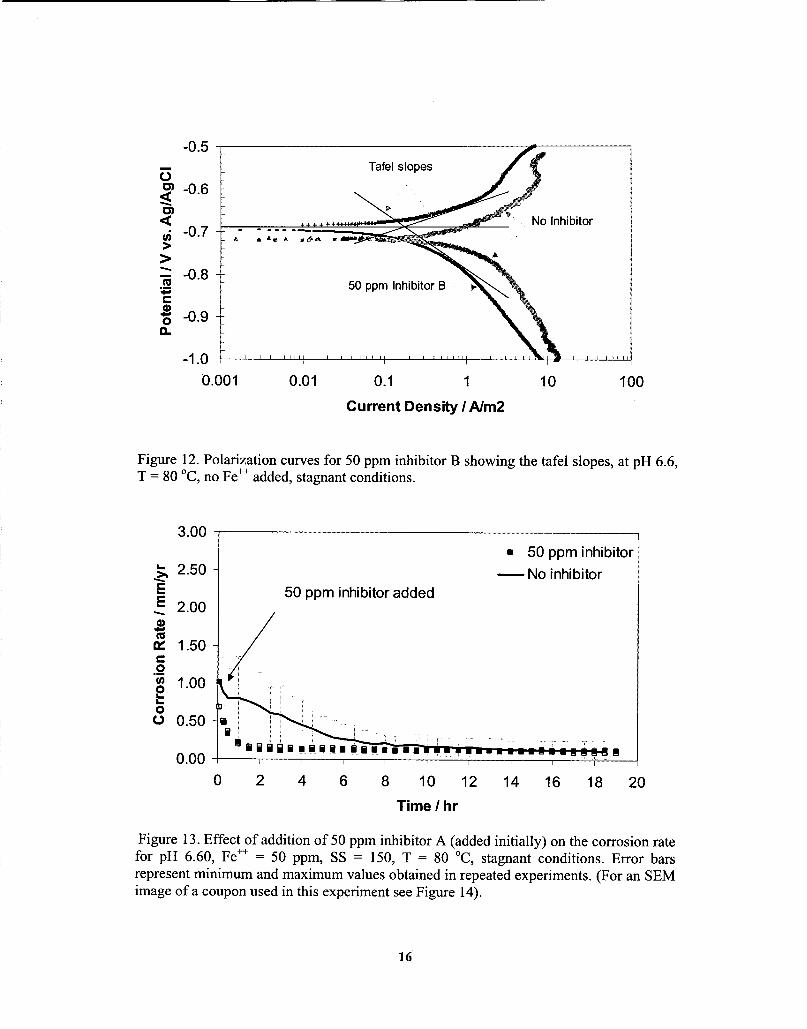
The effect of inhibitor B concentration on the corrosion rate is shown in Figure11. To study the nature of the inhibitor, the potentiodynamic sweeps for the experimentswere done at pH 6.60. The sweeps were done in the cathodic direction initially. Thenafter waiting for sometime for the potential to stabilize the anodic sweep was carried out.From the sweeps (Figure 12), the anodic and the cathodic Tafel slopes for inhibitor Bwere calculated to be 60 mY/decade and 120 mY/decade respectively and the 'B' valuewas calculated to be 17.36 mY. Hence, an average value of 17 mV was used for all theexperiments.
4
Inhibitor-scale interactions at supersaturation of 150
In this set of experiments selected concentration of inhibitor A was added to thesolution that is at an initial supersaturation of 150 w.r.t. iron carbonate. From Figure 9, itcan be seen that at 25 ppm, inhibitor A is partially protective. So, 25 ppm inhibitor waschosen as the concentration to start the testing. In order to study the effect of moreprotective inhibitor film, 50 ppm inhibitor was added in subsequent experiments.
Simultaneous inhibition and scaling
These experiments were designed to see the interaction of the inhibitor and theiron carbonate scale when both the processes would compete for a place on the metalsurface. In the experiment, a supersaturation of 150 was achieved in the beginning of theexperiments by adjusting the pH to 6.60 and adding 50 ppm of Fe++. The requiredamounts of inhibitor A was added after 15 minutes of starting the experiment. Onaddition of 25 ppm inhibitor A, no effect of addition of the inhibitor was seen on thecorrosion rate as well as scale formation, i.e. scale formation dominated the corrosionprocess.
However, on addition of 50 ppm of inhibitor A, it can be seen that although thecorrosion rate drops to 0.2 mm/yr in less than two hours, the final corrosion rate is thesame as that without the inhibitor. It can be observed that for this experiment (Figure 13),the inhibitor dominates the iron carbonate scale from the beginning. From the front viewof the sample (Figure 14), it can be seen that very little iron carbonate is seen on thesurface of the metal. Therefore, it seems that the metal surface is mainly protected due tothe presence of the inhibitor and 50 ppm of inhibitor seems to hamper the growth of ironcarbonate on the surface of the metal.
Inhibition ofa scaled surface
In these set of experiments, the inhibitor was added after 5 hours. Theseexperiments were designed to see the interaction of the inhibitor and the iron carbonatescale when the latter is partially formed. In these experiment, a supersaturation of 150was achieved in the beginning by adjusting the pH to 6.60 and adding 50 ppm of Fe++.Subsequently, required amounts of inhibitor A was added after 5 hours. It is observed that25 ppm of inhibitor had no effect on the corrosion rate as well as scale formation.
Figure 15 consists of the experiment in which a supersaturation of 150 wasachieved in the beginning, and subsequently 50 ppm inhibitor was added 5 hours afterstarting the experiment. In this experiment, it can be seen that as soon as the inhibitor isadded, the corrosion rate drops rapidly. From the top view of the specimen in Figure 16,it is seen that there are only a few crystals of iron carbonate formed on the surface of themetal. These iron carbonate crystals might have formed before the addition of theinhibitor and subsequently, the inhibitor hampered the growth of the iron carbonate scale.
5
Inhibitor-scale Interactions at supersaturation of 30
The supersaturation of the solution was lowered to test the inhibitor scaleinteraction under lower iron carbonate precipitation rates. In this set of experiments, 25ppm of inhibitor B is added to the solution that is at an initial supersaturation of 30. Sincewe were in search of a possible antagonistic interaction between the inhibitor and thescale, a concentration of inhibitor that was partially protective was chosen. From Figure11, it is seen that 25 ppm of inhibitor B fitted our criteria very well.
Simultaneous inhibition and scaling
These experiments were designed to see the interaction of the inhibitor and theiron carbonate scale when both the processes would compete for a place on the metalsurface. In the experiment shown in Figure 17, a supersaturation of 30 was achieved inthe beginning by adjusting the pH to 6.60 and adding 10 ppm of Fe++.Subsequently 25ppm inhibitor B was added after 30 minutes. The figure shows the comparison betweenthe experiments with
• Only 25 ppm inhibitor B• Only iron carbonate scale• 25 ppm inhibitor added under scaling conditions.
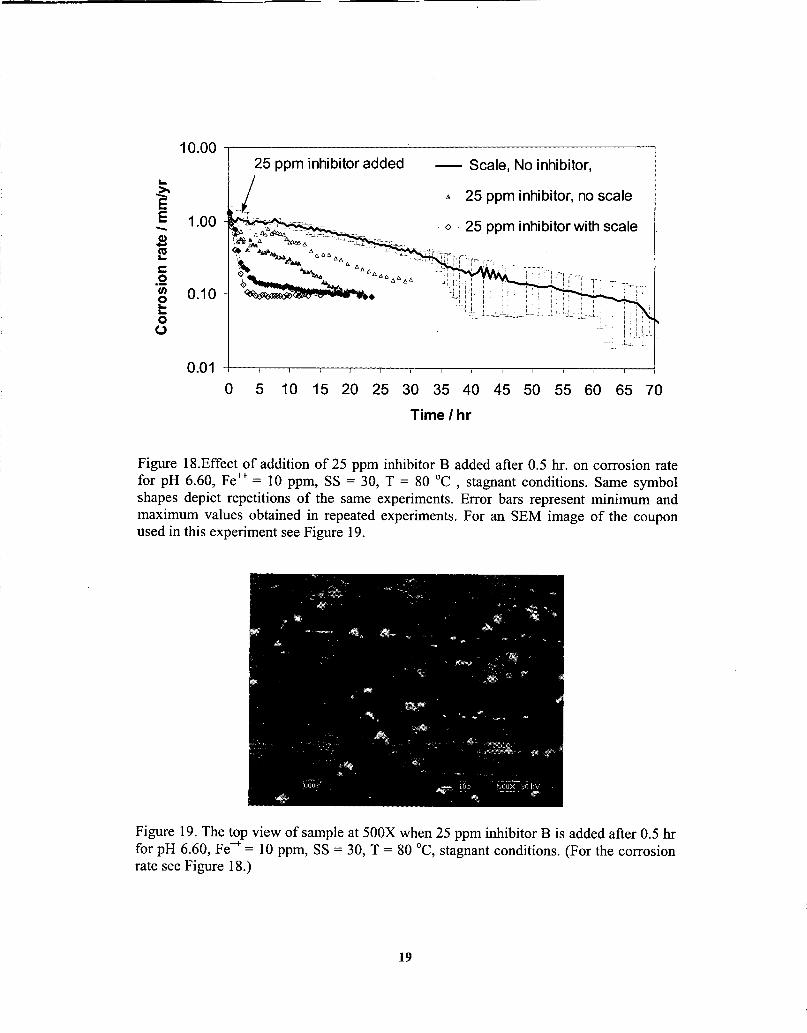
It can be seen that when 25 ppm inhibitor added under scaling conditions,decrease in the corrosion rate is faster than seen in the other two conditions. However,from the logarithmic graph of the above experiment (Figure 18), it is noticed that the finalcorrosion rate is similar to that without the inhibitor.
From the top view of the sample (Figure 19), it can be seen that very little ironcarbonate is seen on the surface of the metal. Therefore, it seems that the metal surface ismainly protected due to the presence of the inhibitor. Adding 25 ppm of inhibitor Bseems to hamper the growth of iron carbonate on the surface of the metal.
Inhibition ora scaled surface
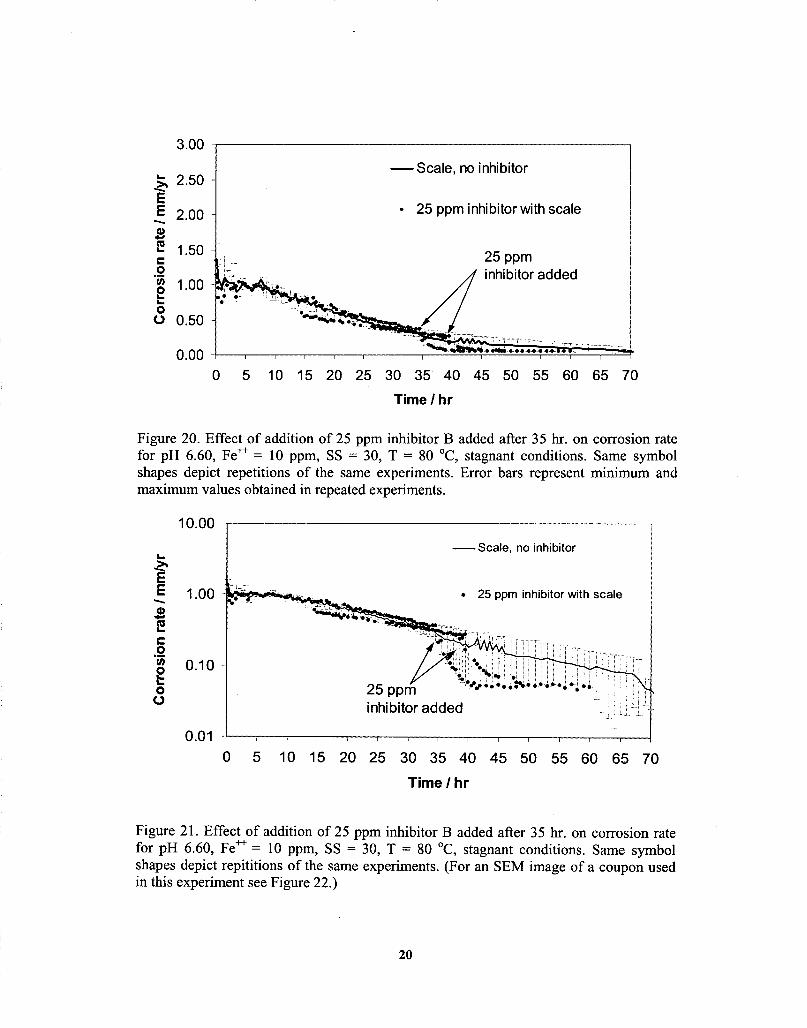
In these set of experiments, 25 ppm of inhibitor was added after 35 - 40 hours ofstarting the experiment that was at an initial supersaturation of 30. Comparison of theexperiments with and without inhibitor is shown in Figure 20. It is seen that as soon asthe inhibitor is added, the corrosion rate decreases drastically. However, from thelogarithmic graph of the same experiment (Figure 21), it is noticed that the final corrosionrate remains similar. From the top and the cross-sectional view of the sample Figure 22, aporous iron carbonate scale of thickness 10 Ilm is observed.
Inhibitor-scale Interactions at supersaturation of 7
Experiments at supersaturation of 7 were done to test the inhibitor-scaleinteraction at even slower iron carbonate precipitation rate. In this experiment, theinhibitor was added after creating a very porous iron carbonate scale (Figure 8).
6
Supersaturation of 7 was achieved in the beginning by adjusting the pH to 6.30 andadding 10 ppm of Fe++.Subsequently, 25 ppm inhibitor B was added after 47 hours.From the comparison of the experiments with and without inhibitor (Figure 23), it is seenthat as soon as the inhibitor is added, the corrosion rate decreases and no antagonisticbehavior is observed. On observing the scale (Figure 24), it was found that the porosity ofthe scale was very similar to that of one without inhibitor.MOdeling of inhibitor-scale interaction
From the experimental results it was observed that the protective effects of thecorrosion inhibitor and the scale were complementary and no antagonism was observed.However, some interference was seen: the presence of inhibitors hampered the growth ofiron carbonate scale. This was initially attributed to the scale inhibition properties of thecorrosion inhibitor. Upon a more in-depth analysis it was found that the concentration ofFe++ on the surface of the steel could be one of the major factors affecting scaleformation. The analysis is explained in the following paragraphs.
In the presence of the inhibitors, the corrosion rate of the metal decreases and thediffusion of Fe++from the bulk solution remains the only source of ions for precipitationat the metal surface. Since, the precipitation of the iron carbonate is much faster than therate of transportation ofFe++ from the bulk of the solution to the surface, the precipitationbecomes diffusion-controlled. This leads to slightly more acidic conditions at the metalsurface and consequently the supersaturation and the precipitation of iron carbonatedecreases.
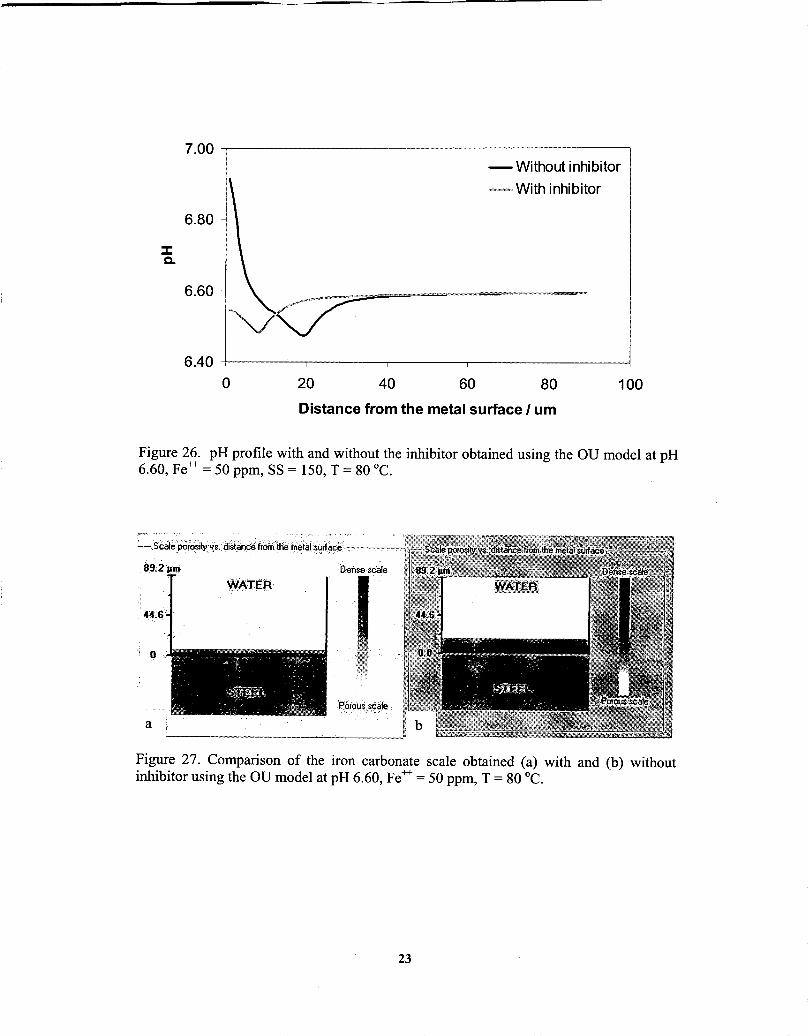
The above phenomenon can be simulated using Ohio University's MULTICORPV3.0 software package. The model was run under the following conditions: pH 6.60, Fe++concentration of 50 ppm, SS = 150, T = 80°C. One simulation was run with an inhibitor(assuming 99% efficiency) and another without the inhibitor. It is seen that in thepresence of the inhibitor the Fe++concentration (Figure 25) as well as the pH (Figure 26)near the surface of the metal is lower than that in the absence of the inhibitor. This leadsto a lower supersaturation and a slower precipitation rate near the metal surface when theinhibitor is added. From the comparison of the scales obtained using the model (Figure27), it is seen that the thickness of the iron carbonate scale formed in the presence of theinhibitor is approximately five times thinner when compared to the scale thicknessformed in the absence of the inhibitor.
Hence, in the absence of corroding conditions at the metal surface, there would beless scale formed at the steel surface. Similar phenomenon was also observed in a seriesof experiments on stainless steel (Sun, et al. 2004). At a supersaturation of 30, it wasfound that even after 3 days no iron carbonate scale was formed on the surface of steel. Inan experiment done at supersaturation of 150, scale precipitated on stainless steel wasapproximately 50% of that compared to corroding mild steel.
From the above analysis, it is deduced that the concentration of Fe++at the metalsurface might be the primary reason the growth of scale is hampered in the presence ofinhibitor. In addition, this could also be in part due to the scale inhibition properties of theinhibitor.
7

Conclusions
Iron carbonate scale precipitation and the interaction between the inhibitor filmand the iron carbonate scale have been studied under scaling conditions. The interactionwas tested using various concentrations of two imidazoline-based generic inhibitors in theiron carbonate supersaturation range of 7 - 150. Based on the experimental conditions,the main research findings are:
• The weight gain/loss method is a more reliable method for obtaining theprecipitation rate than the previously used techniques involving ferrous ionconcentration method. The calculated results obtained by previous kineticsexpressions using the traditional dissolved ferrous ion concentration methodoverestimate the precipitation rate.
• The generic corrosion inhibitors used in this study work by slowing down anodicas well as cathodic reactions.
• Above a certain threshold concentration, both inhibitors hamper the growth of theiron carbonate scale. This could be a result of a decreased concentration of Fe++ atthe surface of the steel and/or scale inhibition properties of the corrosion inhibitor.
• No conditions were found under which inhibitor and scale interacts in anantagonistic manner. i.e. in all of the conditions investigated, the combination ofinhibitor and iron carbonate scale never failed to reduce the corrosion rate.
References
1. Gulbrandsen E., S. Nesic, A. Stangeland, T Buchardt, B. Sundfaer, S. M.Hesjevik, S. Skjerve "Effect of precorrosion on the performance of inhibitors forCO2 corrosion of carbon steel," CORROSION/1998, paper no. 013, (Houston,TX: NACE International, 1998).
2. V. J. Drazic and D. M. Drazic, "Influence of the metal dissolution rate on theAnion and inhibitor adsorption", Proc. ih European Symposium on CorrosionInhibitors (7SEIC): Ann. Univ. Ferrara, N.S., Sez. V, Supp!. N. 9, 1990 (Ferrara,1990), p.99.
3. Nesic S., W. Wilhelmsen, S. Skjerve and S. M. Hesjevik "Testing of inhibitors forcarbon dioxide corrosion using the electrochemical techniques," Proceedings ofthe 8th European Symposium on Corrosion Inhibitors, Ann. Univ. Ferrara, N.S.,Sez. V, Supp!. N. 10, (1995): p.1163.
4. Malik H., "Influence of C16 Quaternary amine on surface films and polarizationresistance of mild steel in carbon dioxide saturated 5% sodium chloride,"Corrosion, Vo!.51 (1995): p.321.
5. Johnson, M. L., & Tomson, M. B. (1991). Ferrous carbonate precipitation kineticsand its impact CO2 corrosion. Corrosion/91, Paper No. 268, NACE International,Houston, Texas.
8
6. van Hunnik, E. W. J., & Hendriksen, E. L. J. A. (1996). The formation ofprotective FeC03 corrosion product layers. Corrosion/96, Paper No.6, NACEInternational, Houston, Texas.
7. Sun, W., Chokshi, K., Nesic, S., & D. Gulino (2004). A study of protective ironcarbonate scale formation in CO2 corrosion, AIChE, Austin, Texas.
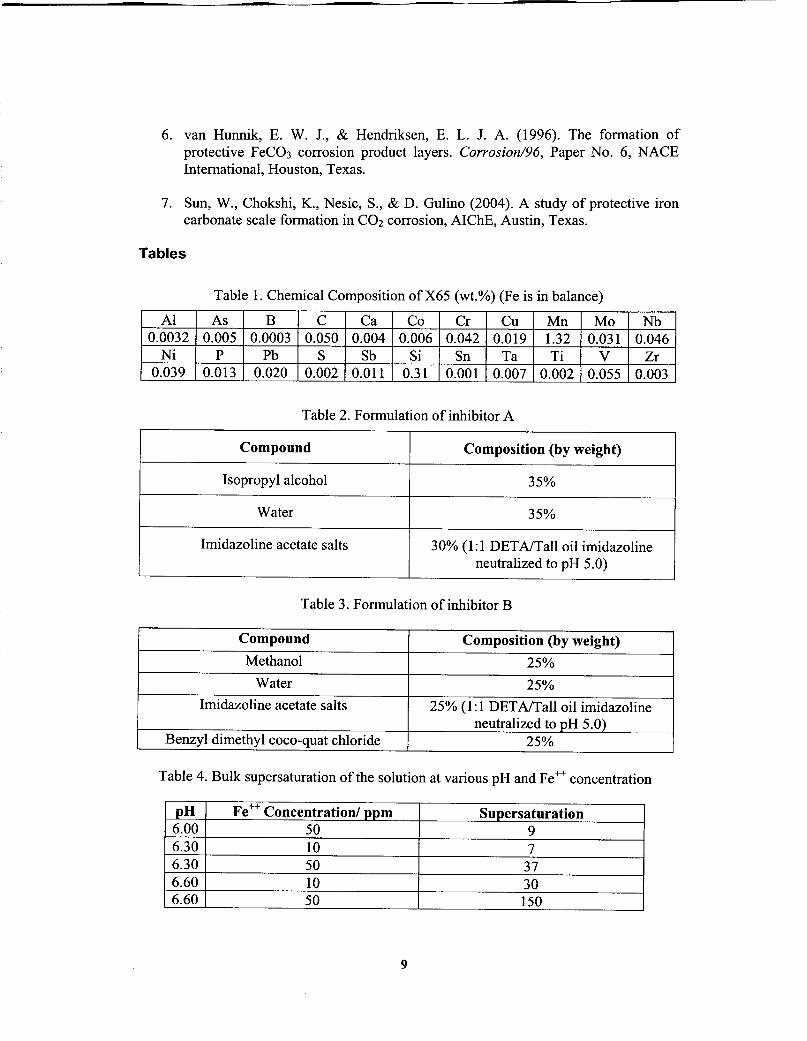
Tables
Table 1. Chemical Composition ofX65 (wt.%) (Fe is in balance)
Al As B C Ca Co Cr Cu Mn Mo Nb0.0032 0.005 0.0003 0.050 0.004 0.006 0.042 0.019 1.32 0.031 0.046Ni P Pb S Sb Si Sn Ta Ti V Zr
0.039 0.013 0.020 0.002 0.011 0.31 0.001 0.007 0.002 0.055 0.003
Table 2. Formulation of inhibitor A
Compound Composition (by weight)
Isopropyl alcohol 35%
Water 35%
Imidazoline acetate salts 30% (1:1 DETNTall oil irnidazolineneutralized to pH 5.0)
Table 3. Formulation of inhibitor B
Compound Composition (by weight)Methanol 25%Water 25%
Imidazoline acetate salts 25% (1:1 DETNTall oil imidazolineneutralized to pH 5.0)
Benzyl dimethyl coco-quat chloride 25%
Table 4. Bulk supersaturation of the solution at various pH and Fe++ concentration
pH Fe ++ Concentration! ppm Supersaturation6.00 50 96.30 10 76.30 50 376.60 10 306.60 50 150
9
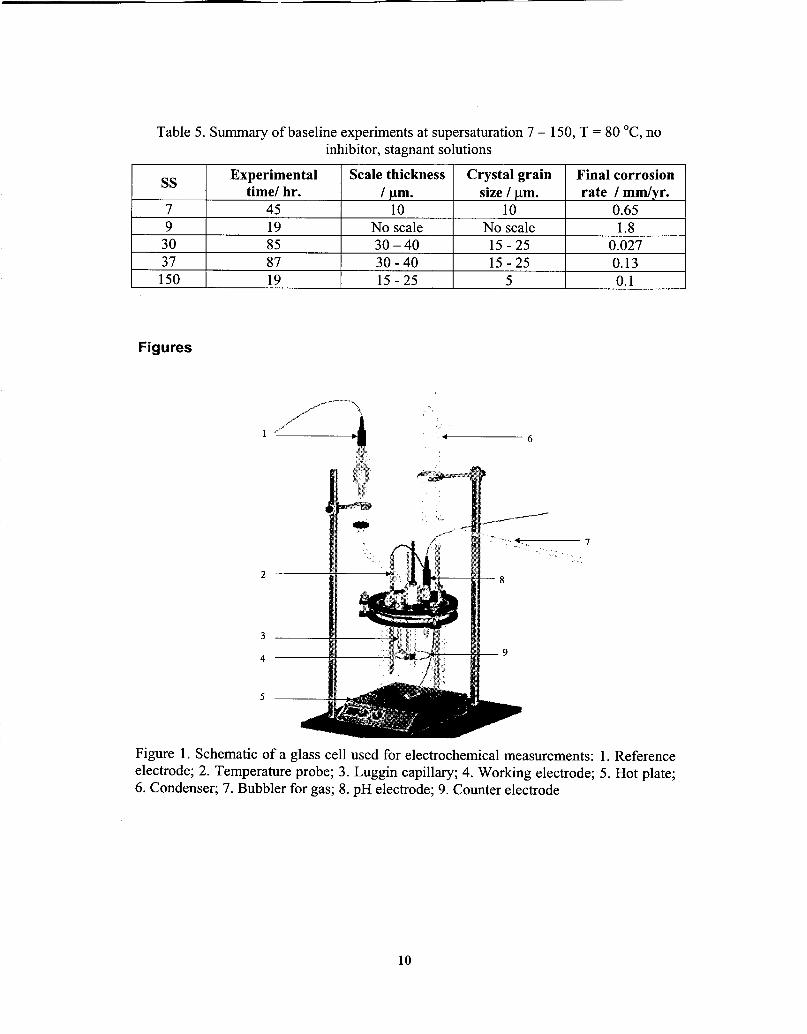
Table 5. Summary of baseline experiments at supersaturation 7 - 150, T = 80°C, noinhibitor, stagnant solutions
Experimental Scale thickness Crystal grain Final corrosionSS timet hr. / urn. size / urn. rate / mm/yr.7 45 10 10 0.659 19 No scale No scale 1.830 85 30-40 15 - 25 0.02737 87 30 - 40 15 - 25 0.13150 19 15 - 25 5 0.1
Figures
'~.----6
2
3
4
5
7
Figure 1. Schematic of a glass cell used for electrochemical measurements: 1. Referenceelectrode; 2. Temperature probe; 3. Luggin capillary; 4. Working electrode; 5. Hot plate;6. Condenser; 7. Bubbler for gas; 8. pH electrode; 9. Counter electrode
10
1 4
2 4
3
II
4 _4 -1,lf_
6
7
8
5
Figure 2. Schematic of a glass cell used for weight gain/loss method: 1. bubbler; 2.temperature probe; 3. rubber cork with nylon cord; 4. steel coupon; 5. hot plate; 6.condenser; 7. pH probe; 8. glass cell.
11
3.00
~ 2.50EE 2.00-Q)-n:J 1.50'-c0
"iii 1.000'-'-0(J 0.50
0.00o 5 10 15 20 25 30 35 40 45 50 55 60 65 70
Time I hr
Figure 3. Effect of supersaturation SS on corrosion rate at T = 80°C, no inhibitor,stagnant conditions. Error bars represent minimum and maximum values obtained inrepeated experiments.
1000 --....• • Experimental resultsE-.c • Calculated results •- •en 100-- •S~c 100 •~n:J-'Q. *'(j
1 •~c. •0.1 ,
0 30 60 90 120 150
Supersaturation
Figure 4. Both experimental and calculated (by using kinetics expression given by vanHunnik, 1996) precipitation rates of iron carbonate under supersaturations of 7 to 150 at atemperature of 80°C.
12
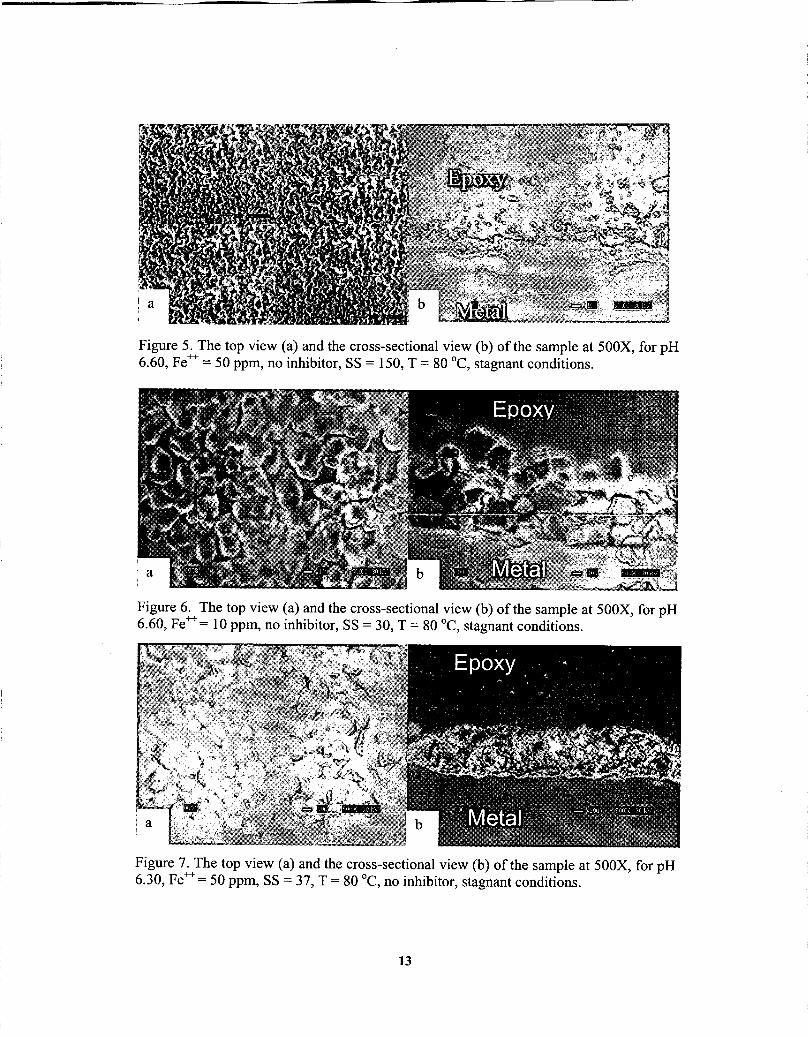
Figure 5. The top view (a) and the cross-sectional view (b) of the sample at 500X, for pH6.60, Fe++= 50 ppm, no inhibitor, SS = 150, T = 80°C, stagnant conditions.
Figure 6. The top view (a) and the cross-sectional view (b) of the sample at 500X, for pH6.60, Fe++= 10 ppm, no inhibitor, SS = 30, T = 80°C, stagnant conditions.
Figure 7. The top view (a) and the cross-sectional view (b) of the sample at 500X, for pH6.30, Fe++= 50 ppm, SS = 37, T = 80°C, no inhibitor, stagnant conditions.
13
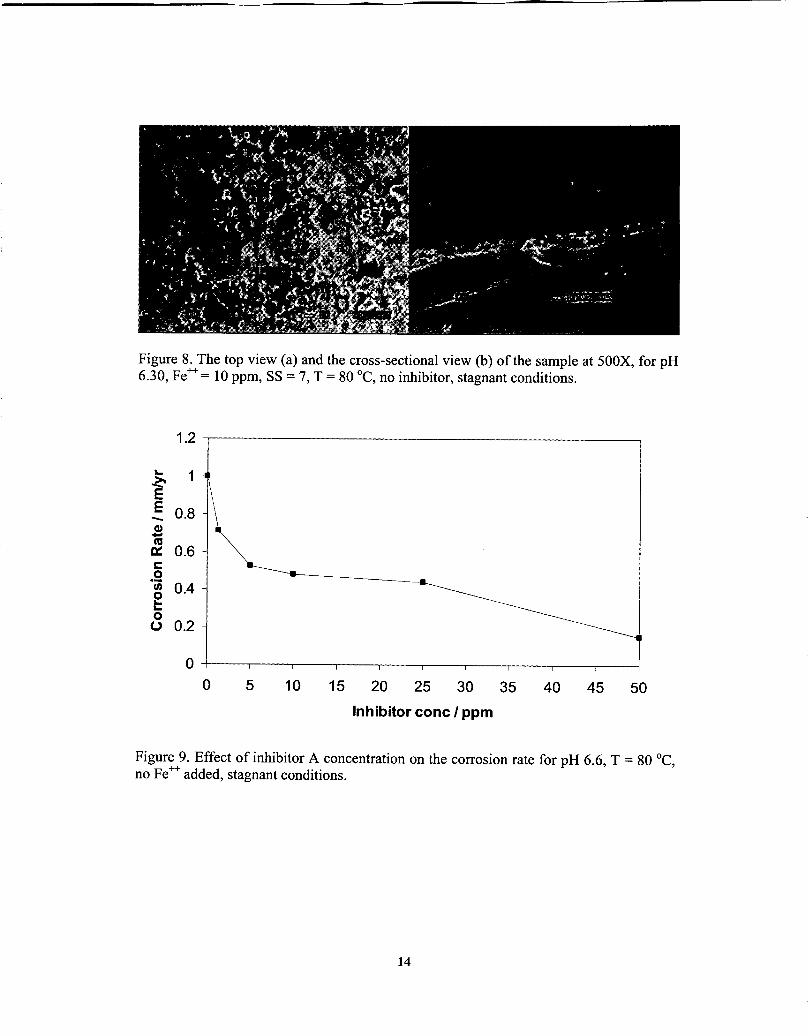
Figure 8. The top view (a) and the cross-sectional view (b) of the sample at 500X, for pH6.30, Fe++ = 10 ppm, SS = 7, T = 80°C, no inhibitor, stagnant conditions.
1.2
10. 1~EE_ 0.8.sca~co'iii 0.4goo 0.2
oo 5 10 15 20 25 30 35 40 45 50
Inhibitor cone I ppm
Figure 9. Effect of inhibitor A concentration on the corrosion rate for pH 6.6, T = 80°C,no Fe ++ added, stagnant conditions.
14

Tafel slopes
~0.50
0: -0.60-0)~II) -0.70 ..>>- -0.80ca;:cCD- -0.900D.
-1.000.001
50 ppm Inhibitor A
0.01
...............................••
0.1 1 10 100
CurrentDensity I Alm2
Figure 10. Polarization curves for 50 ppm inhibitor A at pH 6.6, T = 80°C, no Fe++added, stagnant conditions.
1
...~ 0.8E-CD 0.6-ca~c 0.40"eng0 0.20
00 10 20 30 40 50
Inhibitor cone I ppm
Figure 11. Effect of inhibitor B concentration on the corrosion rate between pH 6.0-6.6,T = 80°C, no Fe++ added, stagnant conditions.
15
-1.0 I
0.001
-0.9
-0.5
(J: -0.6-C)ct:II) -0.7>>-; -0.8:;::cSoD.
- - - - - --
0.01
+
Tafel slopes
50 ppm Inhibitor B
0.1 1
No Inhibitor
10 100
Current Density I Alm2
Figure 12. Polarization curves for 50 ppm inhibitor B showing the tafel slopes, at pH 6.6,T = 80 DC, no Fe++added, stagnant conditions.
3.00
•.• 2.50~~ 2.00
~~ 1.50co.~ 1.00l:::o(J 0.50
0.00
/,....,I
Ii, ,Ii ' ,
!IJ iiil ~
50 ppm inhibitoradded
• 50 ppm inhibitor--No inhibitor
o 2 4 6 8 10
Time/hr12 14 16 18 20
Figure 13. Effect of addition of 50 ppm inhibitor A (added initially) on the corrosion ratefor pH 6.60, Fe++ = 50 ppm, SS = 150, T = 80 DC, stagnant conditions. Error barsrepresent minimum and maximum values obtained in repeated experiments. (For an SEMimage of a coupon used in this experiment see Figure 14).
16
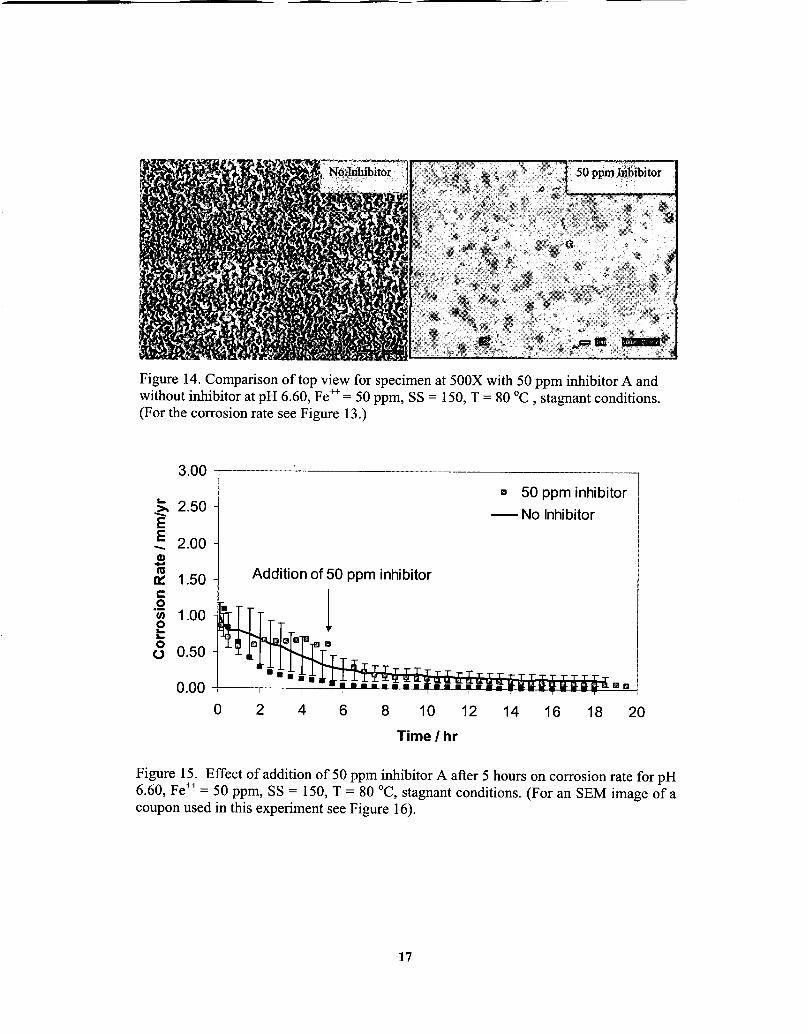
Figure 14. Comparison of top view for specimen at 500X with 50 ppm inhibitor A andwithout inhibitor at pH 6.60, Fe++= 50 ppm, SS = 150, T = 80°C, stagnant conditions.(For the corrosion rate see Figure 13.)
3.00
~ 2.50EE_ 2.00C1l1a0:: 1.50s::o"en 1.00goo 0.50
0.00
Addition of 50 ppm inhibitor
1
III 50 ppm inhibitor-No Inhibitor
111m
o 2 4 6 8 10
Time/hr
12 14 16 18 20
Figure 15. Effect of addition of 50 ppm inhibitor A after 5 hours on corrosion rate for pH6.60, Fe++= 50 ppm, SS = 150, T = 80°C, stagnant conditions. (For an SEM image ofacoupon used in this experiment see Figure 16).
17
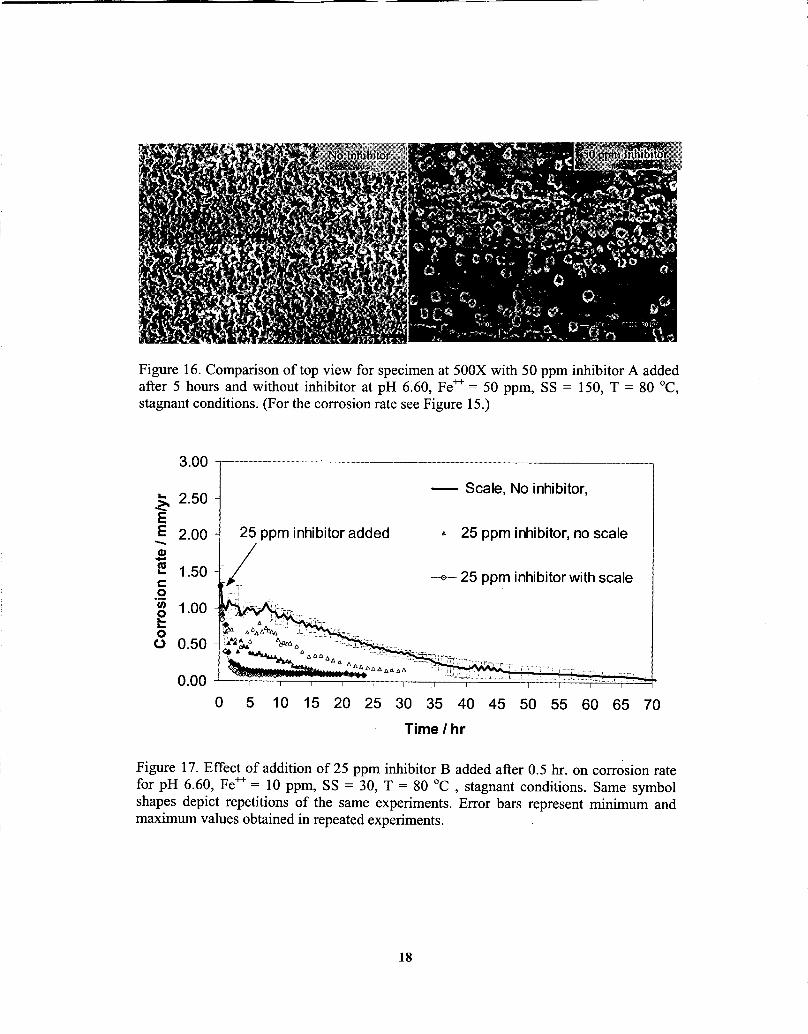
Figure 16. Comparison of top view for specimen at 500X with 50 ppm inhibitor A addedafter 5 hours and without inhibitor at pH 6.60, Fe++= 50 ppm, SS = 150, T = 80°C,stagnant conditions. (For the corrosion rate see Figure 15.)
-- Scale, No inhibitor,
•. 25 ppm inhibitor, no scale
" .. TO•• ,.',
-~- 25 ppm inhibitor with scale
~ ;""''''''''''~~tflM,,' ""'L;.,;: ...••......"'.~;I~:'~ :.~,,:':',,~':~..".,...,
25 ppm inhibitor added
I
3.00
~ 2.50EE 2.00-Se 1.50c0'iii 1.00g00 0.50
0.00o 5 10 15 20 25 30 35 40 45 50 55 60 65 70
Time Ihr
Figure 17. Effect of addition of 25 ppm inhibitor B added after 0.5 hr. on corrosion ratefor pH 6.60, Fe++= 10 ppm, SS = 30, T = 80°C , stagnant conditions. Same symbolshapes depict repetitions of the same experiments. Error bars represent minimum andmaximum values obtained in repeated experiments.
18
...<:-EE-~co"iii~...oo
10.00
1.00
0.10
0.01
25 ppm inhibitor added
/,-- Scale, No inhibitor,
.• 25 ppm inhibitor, no scale
_.<;>. 25 ppm inhibitor with scale
o 5 10 15 20 25 30 35 40 45 50 55 60 65 70
Time Ihr
Figure 18.Effect of addition of 25 ppm inhibitor B added after 0.5 hr. on corrosion ratefor pH 6.60, Fe++= 10 ppm, SS = 30, T = 80 DC , stagnant conditions. Same symbolshapes depict repetitions of the same experiments. Error bars represent minimum andmaximum values obtained in repeated experiments. For an SEM image of the couponused in this experiment see Figure 19.
Figure 19. The top view of sample at 500X when 25 ppm inhibitor B is added after 0.5 hrfor pH 6.60, Fe++= 10 ppm, SS = 30, T = 80 DC, stagnant conditions. (For the corrosionrate see Figure 18.)
19
.: .._~.~ .•~:~~~:..~~:..~_.•-.-. ~"""~"'.~ ..,
25 ppmd irllibitor added
• 25 ppm inhibitor with scale
-Scale, no inhibitor
3.00 -
... 2.50~EE 2.00-CI)-l! 1.50c .. r0"iii 1.00e...00 0.50
0.000 5 10 15 20 25 30 35 40 45 50 55 60 65 70
Time I hr
Figure 20. Effect of addition of 25 ppm inhibitor B added after 35 hr. on corrosion ratefor pH 6.60, Fe++= 10 ppm, SS = 30, T = 80°C, stagnant conditions. Same symbolshapes depict repetitions of the same experiments. Error bars represent minimum andmaximum values obtained in repeated experiments.
10.00
-.sl!co"iiigoo
1.00 -'~~:;.
0.10
- Scale, no inhibitor
• 25 ppm inhibitor with scale
0.01o 5 10 15 20 25 30 35 40 45 50 55 60 65 70
Time/hr
Figure 21. Effect of addition of 25 ppm inhibitor B added after 35 hr. on corrosion ratefor pH 6.60, Fe++= 10 ppm, SS = 30, T = 80°C, stagnant conditions. Same symbolshapes depict repititions of the same experiments. (For an SEM image of a coupon usedin this experiment see Figure 22.)
20
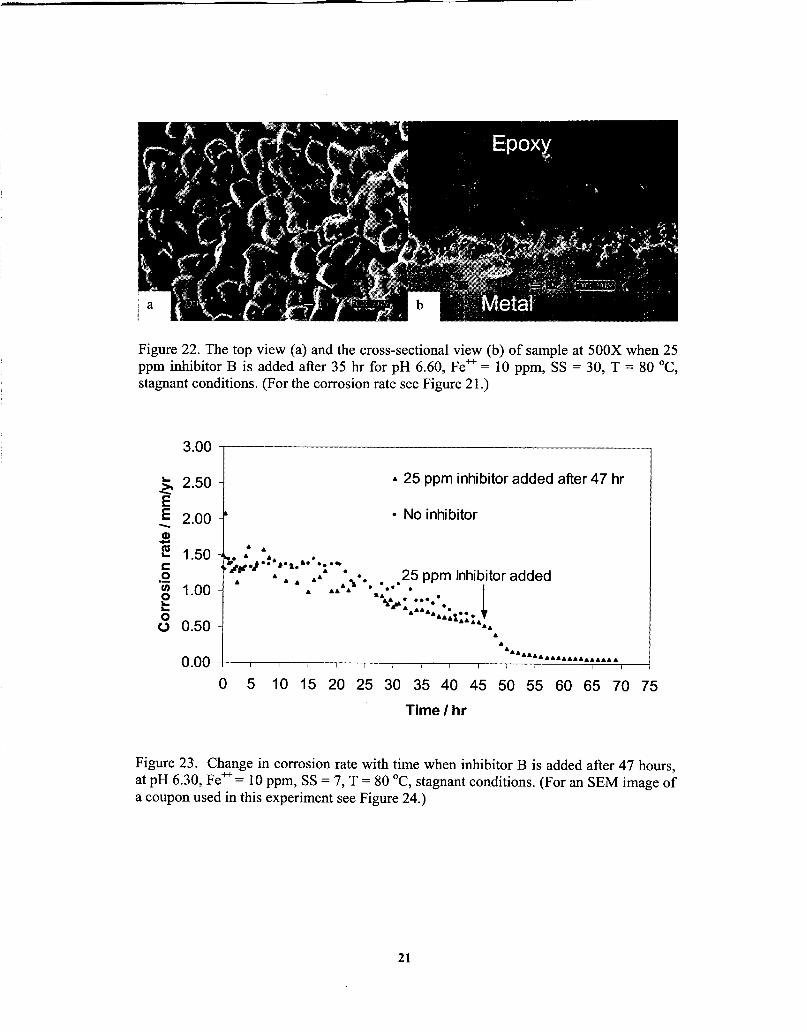
Figure 22. The top view (a) and the cross-sectional view (b) of sample at 500X when 25ppm inhibitor B is added after 35 hr for pH 6.60, Fe++= 10 ppm, SS = 30, T = 80°C,stagnant conditions. (For the corrosion rate see Figure 21.)
3.00 ,........--------------------------,
" 25 ppm inhibitor added after 47 hr
• No inhibitor
"
" "1.50 -~."" •,~.J...,..l.••......" " ",," •• •• 25 ppm Inhibitor added
& .a ••" """ · .. . t••••• JI' ••••••....." ..•.••1.•.•: .•
"""".......................................I
0.50
0.00
~ 2.50EE 200- ..sec.2U) 1.00goo
o 5 10 15 20 25 30 35 40 45 50 55 60 65 70 75
Time/hr
Figure 23. Change in corrosion rate with time when inhibitor B is added after 47 hours,at pH 6.30, Fe++= 10 ppm, SS = 7, T = 80°C, stagnant conditions. (For an SEM image ofa coupon used in this experiment see Figure 24.)
21

Figure 24. The top view (a) and the cross-sectional view (b) of sample at 500X when 25ppm inhibitor B is added after 47 hr. for pH 6.30, Fe++= 10 ppm, SS = 7, T = 80°C,stagnant conditions. (For the corrosion rate see Figure 23.)
50- Without inhibitor
E ~- With inhibitorQ,Q,-C0~ca~ 40-cCI)uc0u:CI)LL
300 20 40 60 80 100
Distance from the metal surface I urn
Figure 25. Fe++concentration profile with and without the inhibitor obtained using theau model at pH 6.60, Fe++= 50 ppm, SS = 150, T = 80°C.
22
7.00-Without inhibitor
With inhibitor
6.80
J:C.
6.60
6.40 ,o 20 40 60 80 100
Distance from the metal surface I um
Figure 26. pH profile with and without the inhibitor obtained using the au model at pH6.60, Fe++= 50 ppm, 55 = 150, T = 80°C.
89c2p.m
o
a
Figure 27. Comparison of the iron carbonate scale obtained (a) with and (b) withoutinhibitor using the au model at pH 6.60, Fe++= 50 ppm, T = 80°C.
23