
Financial Disclosure Fines Accrued Report - Fines Accrued as of October 25, 2013 720am.pdf

Introductory Section 3

Table of Contents1
TABLE OF CONTENTS
Introductory SectionCertificate of Achievement ...................................................................................................3Board of Trustees........... .......................................................................................................4Letter of Transmittal .............................................................................................................5Your Retirement System .......................................................................................................8System Assets ........................................................................................................................9Administrative Staff and Organization ................................................................................10Summary of Plan Provisions ...............................................................................................11
Investment Section
Financial SectionIndependent Auditors’ Report ............................................................................................14Management’s Discussion & Analysis (Unaudited)........... .................................................16Basic Financial Statements: Statement of Fiduciary Net Position ........................................................................................20 Statement of Changes in Fiduciary Net Position ......................................................................21 Notes to Financial Statements ..................................................................................................22Required Supplementary Information (Unaudited): Schedule of Changes in Employers’ and Nonemployers’ Net Pension Liability .......................36 Schedule of Employers’ and Nonemployers’ Net Pension Liability and Related Ratios ..........36 Schedule of Employer and Nonemployer Contributions..........................................................37 Schedule of Investment Returns ...............................................................................................37 Schedule of the System’s Proportionate Share of the Net Pension Liability to ERS ................37 Schedule of the System’s Contributions to ERS ........................................................................37 Notes to Required Supplementary Information .......................................................................38Additional Information: Schedule of Administrative Expenses .......................................................................................40 Schedule of Investment Expenses ............................................................................................40
Investment Overview ..........................................................................................................41Rates of Return........... ........................................................................................................42Asset Allocation ..................................................................................................................43Schedule of Fees and Commissions ...................................................................................43Investment Summary ..........................................................................................................43Portfolio Detail Statistics .....................................................................................................44

Table of Contents 2
Actuarial Section
Statistical Section
TABLE OF CONTENTS
Actuary’s Certification Letter ..............................................................................................45Summary of Actuarial Assumptions and Methods: ...........................................................47 Service Retirement ...................................................................................................................49 Separation Before Service Retirement ......................................................................................49Actuarial Valuation Data: Active Members ........................................................................................................................50 Retirees and Beneficiaries .........................................................................................................50 Solvency Test .............................................................................................................................51 Member & Employer Contribution Rates .................................................................................51 Schedule of Funding Progress ...................................................................................................52 Analysis of Financial Experience ...............................................................................................53
Statistical Section Overview ................................................................................................54Financial Trends: Additions by Source ..................................................................................................................54 Deductions by Type ...................................................................................................................54 Changes in Fiduciary Net Position ............................................................................................55Operating Information: Benefit Payment Statistics .........................................................................................................56 Member Withdrawal Statistics .................................................................................................57 Average Monthly Benefit Payments for New Retirees .............................................................58 Retired Members by Type of Benefit ........................................................................................59 Retirement Payments by County of Residence ........................................................................60 Principal Participating Employers..............................................................................................62 Reporting Entities ......................................................................................................................63

Introductory Section3
CERTIFICATE OF ACHIEVEMENT

Introductory Section 4
as of December 1, 2017**
BOARD OF TRUSTEES
* Investment Committee Member
**There is one vacancy on the Board.
Ms. Anne Cardella Classroom Teacher
Appointed by the GovernorTerm Expires 6/30/20
Mr. Steven N. McCoy*State Treasurer
Ex-Officio
Mr. Greg S. Griffin*State Auditor
Ex-Officio
Mr. J. Alvin Wilbanks*CHAIR
School AdministratorAppointed by the Governor
Term Expires 6/30/19
Ms. Deborah K. Simonds*Retired Teacher
Elected by the Board of TrusteesTerm Expires 6/30/18
Ms. Marion R. FedrickTRS Member
Appointed by the Board of Regents
Term Expires 6/30/18
Dr. William G. Sloan, Jr.*Member-at-Large
Appointed by the GovernorTerm Expires 6/30/20
Mr. Thomas W. Norwood*VICE-CHAIR
Investment ProfessionalElected by the Board of Trustees
Term Expires 6/30/20
Mr. Christopher M. SwansonClassroom Teacher
Appointed by the GovernorTerm Expires 3/31/18

Introductory Section5
LETTER OF TRANSMITTAL
Teachers Retirement System of Georgia L.C. (Buster) Evans, Ed.D.
Executive Director
I am pleased to present the Comprehensive Annual Financial Report of the Teachers Retirement System of Georgia (the System) for the fiscal year ended June 30, 2017. Responsibility for both the accuracy of the data, and completeness and fairness of the presentation, including all disclosures, rests with the management of the System. To the best of our knowledge and belief, the enclosed data is accurate in all material respects and is reported in a manner designed to present fairly the financial position and results of operations of the System. I trust that you will find this report helpful in understanding your retirement system.
Certificate of AchievementThe Government Finance Officers Association of the United States and Canada (GFOA) awarded a Certificate of Achievement for Excellence in Financial Reporting to the Teachers Retirement System of Georgia for its Comprehensive Annual Financial Report for the fiscal year ended June 30, 2016. This was the 29th consecutive year that the System has achieved this prestigious award.
In order to be awarded a Certificate of Achievement, a government unit must publish an easily readable and efficiently organized Comprehensive Annual Financial Report. This report must satisfy both generally accepted accounting principles and applicable legal requirements.
A Certificate of Achievement is valid for a period of one year only. We believe our current Comprehensive Annual Financial Report
continues to meet the Certificate of Achievement Program’s requirements, and we are submitting it to the GFOA to determine its eligibility for another certificate.
History and OverviewThe System was created in 1943, by an act of the Georgia General Assembly to provide retirement security to those individuals who choose to dedicate their lives to educating the children of the State of Georgia, and began operations in 1945. A summary of the System’s provisions is provided on pages 11-13 of this report.
The System is governed by a ten-member Board of Trustees which appoints the Executive Director who is responsible for the administration and operations of the System, which serves 447,071 active and retired members, and 310 employers.
Financial InformationThe management of the System is charged with the responsibility of maintaining a sound system of internal accounting controls. The objectives of such a system are to provide management with reasonable assurance that assets are safeguarded against loss from unauthorized use or disposition, that transactions are executed in accordance with management’s authorizations, and that they are recorded properly to permit the preparation of financial statements in accordance with generally accepted accounting principles. The concept of reasonable assurance recognizes the cost of a control should not exceed the benefits
December 11, 2017Board of TrusteesTeachers Retirement System of GeorgiaAtlanta, Georgia

Introductory Section 6
LETTER OF TRANSMITTAL
likely to be derived. Therefore, the objective is to provide reasonable, rather than absolute assurance, that the financial statements are free of any material misstatements. Even though there are inherent limitations in any system of internal control, the management of the System makes every effort to ensure that through systematic reporting and internal reviews, errors or fraud would be quickly detected and corrected.
Please refer to Management’s Discussion and Analysis beginning on page 16 of this report for an overview of the financial status of the System, including a summary of the System’s Fiduciary Net Position, Changes in Fiduciary Net Position, and Asset Allocations.
INVESTMENTS — The System has continued to invest in a mix of liquid, high quality bonds and stocks as it historically has done. These types of investments have allowed the System to participate in rising markets, while moderating the risks on the downside. A high quality balanced fund has proven to be a successful strategy in a variety of markets over a long period of time. A combination of improving economic growth, low inflation and low interest rates combined to boost U.S. equity returns to over 18% for the fiscal year. A comparative analysis of rates of return is presented on page 42. For additional information and analysis pertaining to investment policies and strategies, asset allocations, and yield, see Management’s Discussion and Analysis beginning on page 16 and the Investment Section beginning on page 41. The System addresses the safeguarding of investments by requiring that they be held by agent custodial banks in the name of the System and that deposits are insured by the Federal Deposit Insurance Corporation.
As in previous years, maintaining quality was a primary goal and was successfully met. “Conservation of Capital” and “Conservatism” continue to be the guiding principles for investment decisions. The System continued to use a diversified portfolio to accomplish these objectives.
FUNDING — The System’s funding policy provides for employee and employer contributions at rates, expressed as a percentage of annual covered payroll, that are sufficient to provide resources to pay benefits when due.
A useful indicator of the funded status of a retirement system is the relationship between the actuarial value of assets and the actuarial accrued liabilities. The System continues to remain strong as evidenced by the ratio of the actuarial value of assets to the actuarial accrued liabilities. This ratio was 74.3% for the fiscal year ended June 30, 2016. The ultimate test of the financial soundness
of a retirement system is its ability to pay all promised benefits when due. I am proud to say that through the continued wisdom and the support of Governor Nathan Deal and the Georgia General Assembly, the System has been and will continue to be funded on an actuarially sound basis, thus providing the membership the comfort and security they expect from their retirement system.
InitiativesTRS continuously monitors and works to improve all aspects of public pension management. Our executive management team worked closely with the Georgia State Financing and Investment Commission providing detailed pension, financial, and actuarial information for disclosure in the State’s bond offerings. TRS is pleased to work diligently with the State of Georgia to maintain the State’s coveted AAA bond ratings.
Maintaining our financial security and stability remained a top priority. The dedicated experts with our Division of Investment Services achieved a 12.5% rate of return, enhancing the System’s portfolio. The continued recovery in the financial markets is only one positive funding impact TRS monitored this last year. Actively contributing membership numbers increased, new retirement benefit payments and member withdrawals decreased slightly, and restored salary increases to public employees will have a positive impact on the System’s future financial stability and security.
The reporting of the System’s financial statements remained a priority, and I am pleased to report TRS received an unmodified opinion for both the financial statement audit as of June 30, 2017 and the audit of the Schedule of Employer and Nonemployer Allocations (GASB 68) as of June 30, 2016. The full report of the System’s financial audit is available on pages 14-15. The GASB 68 audit is available on our website at http://www.trsga.com/employer/pension-accounting-changes/gasb-68-audit-reports.
Knowing where an agency is heading in the future is vital to its success and TRS makes our future a priority. We successfully completed the Strategic Plan for FY 2017 - 2020 and developed an agency succession plan for implementation to maintain business continuity. TRS will welcome two new executives to our team this coming year: Randy Dennis, Chief Financial Officer and Brooke Lucas, Chief Operating Officer—both of whom will bring varying expertise and a number of years in state government administrative experience.
Security of the System’s technology system and member data is a vital component of our work here at TRS. TRS successfully
continued

Introductory Section7
LETTER OF TRANSMITTAL
passed two network security audits conducted by a private sector security firm and completed our annual IT audit with no issues identified. Network segmentation was designed and implemented to prevent access to resources and sensitive data and internal vulnerability scanning was implemented.
Customer access was enhanced with automated business processes, including improved response time and scalability on tablets and mobile devices. In an effort to increase communication with our members, TRS established a presence on social media via Twitter and Facebook. To continue our education efforts, we piloted two new programs: 1) group counseling and 2) mid-career counseling programs. Both programs were designed to effectively communicate with our members.
Other Information
INDEPENDENT AUDIT — The Board of Trustees requires an annual audit of the financial statements of the System by independent, certified public accountants. The accounting firm of KPMG LLP was selected by the Board. The independent auditors’ report on the statements of plan fiduciary net position and the related statements of changes in plan fiduciary net position is included in the Financial Section of this report.
ACKNOWLEDGMENTS — The compilation of this report reflects the combined effort of the staff under the leadership of the Board of Trustees. It is intended to provide complete and reliable information as a basis for making management decisions, as a means of determining compliance with legal provisions, and as a means for determining responsible stewardship of the assets contributed by the System’s members, their employers, and the State of Georgia.
Copies of this report can be obtained by contacting the System, or may be downloaded from the System’s website.
I would like to take this opportunity to express my gratitude to Governor Nathan Deal, members of the Georgia General Assembly, the staff, the advisors, and to the many people who have worked so diligently to ensure the successful operation of the System.
Sincerely,
L.C. (Buster) Evans, Ed.D.
Executive Director
continued

Introductory Section 8
YOUR RETIREMENT SYSTEM
Statistical Highlights2.21.24.01.4
+_ + +
Financial Highlights
June 30,
Member Contributions
Employer and Nonemployer Contributions Interest and Dividend Income
Benefits Paid to Retired Members
Member Withdrawals Interest Credited to Member Contributions
Active Membership Members Leaving the System Retired Members Average Monthly Benefit
4.5
4.7
3.3
5.5
3.8
4.6
222,9187,296
122,629$ 3,032
716,233,000
1,654,844,000
1,490,357,000
4,461,124,000
76,296,000
335,146,000
$$$
$
$
$
685,626,000
1,580,532,000
1,442,252,000
4,228,819,000
79,334,000
320,388,000
218,215
7,383117,918$ 2,989
++++_
+
% Change20162017
Financial & Statistical Highlights
$$$
$
$
$
Introductory Section9
SYSTEM ASSETS
2015 2016 20172012 2013
$ 46,422,82818,807,238
1,620,195
$ 66,850,261
$ 43,651,53619,979,237
2,087,314
$ 65,718,087
$ 49,236,29320,139,422
2,046,795
$ 71,422,510
$ 37,190,40015,188,293
1,154,311
$ 53,533,004
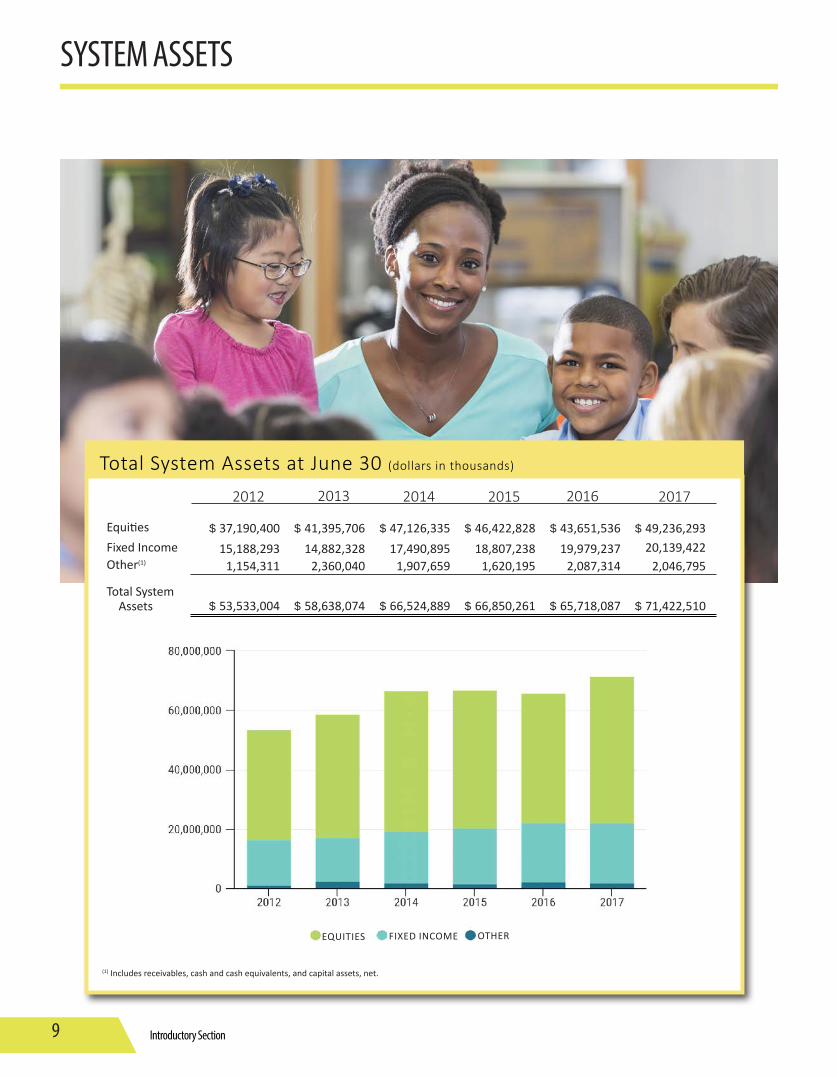
Total System Assets at June 30 (dollars in thousands)
2014
$ 47,126,33517,490,895
1,907,659
$ 66,524,889
Equities Fixed Income Other(1)
Total System Assets
(1) Includes receivables, cash and cash equivalents, and capital assets, net.
$ 41,395,70614,882,328
2,360,040
$ 58,638,074
EQUITIES FIXED INCOME OTHER

Introductory Section 10
ADMINISTRATIVE STAFF & ORGANIZATION
Dr. L.C. (Buster) Evans Executive Director
Stephen J. BoyersChief Financial Officer
Dina N. JonesDirector
Member Services
Laura L. LanierController
Financial Services
Lisa M. HajjDirector
Communications
R. Cory BuiceDirector
Retirement Services
Charles W. Cary, Jr.Chief Investment Officer
Investment Services
J. Gregory McQueenDirector
Information Technology
K. Paige DonaldsonDirector
Employer Services andContact Management
Investment Advisors*Albritton Capital ManagementBaillie Gifford Overseas LimitedBarrow, Hanley, Mewhinney & StraussCooke & BielerFisher Investments Mondrian Investment Partners LimitedSands Capital Management
* See page 43 in the Investment Section for a summary of fees paid to investment advisors.
Consulting ServicesActuaryCavanaugh Macdonald Consulting, LLC
AuditorKPMG LLP
Medical AdvisorsGordon J. Azar, M.D. Atlanta, GeorgiaWilliam Biggers, M.D. Atlanta, GeorgiaMarvin Bittinger, M.D. Gainesville, GeorgiaPedro Garcia, M.D. Atlanta, GeorgiaHarold Sours, M.D. Atlanta, GeorgiaJoseph W. Stubbs, M.D. Albany, Georgia
The Director of Human Resources position was vacant at June 30, 2017.

Introductory Section11
SUMMARY OF PLAN PROVISIONS
AdministrationState statutes provide that the administration of the System be vested in a ten-member Board of Trustees comprised as follows:
Ex-officio members:
• the State Auditor
• the State Treasurer
Governor’s appointees:
• two active members of the System who are classroom teachers and not employees of the Board of Regents
• one active member of the System who is a public school administrator
• one active member of the System who is not an employee of the Board of Regents
• one member-at-large
Board of Regents appointee:
• one active member of the System who is an employee of the Board of Regents
Trustee appointees:
• one member who has retired under the System
• one individual who is a citizen of the State, not a member of the System, and experienced in the investment of money
A complete listing of the current Board of Trustees is included on page 4 of this report.
Management of the System is the responsibility of the Executive Director who is appointed by the Board and serves at its pleasure. On behalf of the Board, the Executive Director is responsible for the proper operation of the System, engaging such actuarial and other services as shall be necessary to transact business, and paying expenses necessary for operations. A listing of the administrative staff is included on page 10 of this report.
MembershipAll personnel employed in a permanent status position, and not less than one-half time, with local boards of education, charter schools, universities and colleges, technical colleges, Board of Regents, county
The Teachers Retirement System of Georgia (the System) was established in 1943, by an act of the Georgia General Assembly for the purpose of providing retirement allowances and other benefits for teachers of the State, and began operations in 1945. The System has the power and privileges of a corporation and the right to bring and defend actions.
The major objectives of the System are (1) to pay monthly benefits due to retirees accurately and in a timely manner, (2) to soundly invest retirement funds to ensure adequate financing for future benefits due and for other obligations of the System, (3) to accurately account for the status and contributions of all active and inactive members, (4) to provide statewide educational and counseling services for System members, and (5) to process refunds due to terminated members.
Our Purpose

Introductory Section 12
SUMMARY OF PLAN PROVISIONS
and regional libraries, RESAs, and certain State of Georgia agencies are required to be members as a condition of employment. Exceptions to TRS membership include employees required to participate in another Georgia retirement plan or employees who may elect the Board of Regents Optional Retirement Plan in lieu of TRS membership.
EligibilityService RetirementActive members may retire and elect to receive monthly retirement benefits after one of the following conditions: 1) completion of 10 years of creditable service and attainment of age 60, or 2) completion of 25 years of creditable service.
Disability RetirementMembers are eligible to apply for monthly retirement benefits under the disability provision of the law if they are an active member, have at least 10 years of creditable service, and are permanently disabled.
The FormulaNormal RetirementAny member who has at least 30 years of creditable service or who has at least 10 years of creditable service and has attained age 60 will receive a benefit calculated by using the percentage of salary formula. Simply stated, two percent (2%) is multiplied by the member’s years of creditable service established with the System, including partial years (not to exceed 40 years). The product is then multiplied by the average monthly salary for the two highest consecutive membership years of service. The resulting product is the monthly retirement benefit under the maximum plan of retirement.
Early RetirementAny member who has not reached the age of 60 and has between 25 and 30 years of creditable service will receive a reduced benefit. The benefit will be calculated using the percentage of salary formula explained above. It will then be reduced by the lesser of 1/12 of 7% for each month the member is below age 60 or 7% for each year or fraction thereof the member has less than 30 years of creditable service. The resulting product is the monthly retirement benefit under the maximum plan of retirement.
Disability RetirementDisability retirement benefits are also calculated using the percentage of salary formula explained above. The resulting product
is the monthly disability retirement benefit under the maximum plan. You must have at least 10 years of creditable service to qualify; however, there is no age requirement for disability retirement.
Plan A - Maximum Plan of RetirementThis plan produces the largest possible monthly benefit payable to the member only during his or her lifetime. There are no survivorship benefits under this plan.
Plan B - Optional Plans of RetirementUpon retirement, a member of the System may elect one of six optional plans that provide survivorship benefits. The election of an optional form of payment is made upon application for retirement and it becomes irrevocable upon distribution of the first benefit check. The six options are as follows:
Option 1The retiring member accepts a relatively small reduction from the maximum monthly benefit in order to guarantee to the estate, beneficiary, or beneficiaries named on the retirement application, a lump-sum refund of any remaining portion of member contributions and interest.
Option 2This plan offers the retiring member a reduced monthly benefit, based on the ages of the member and the beneficiary, payable for life. It further provides a guarantee to the surviving named beneficiary that, at the death of the retired member, the beneficiary will receive the same basic monthly retirement allowance the member received at the date of retirement plus any cost-of-living increases the member received up to the time of death.
Option 2 Pop-UpAny member may elect a reduced retirement allowance to be designated “Option 2 Pop-Up” with the provision that if the beneficiary dies prior to the retiree that the basic benefit payable to the retiree shall increase to an amount the retiree would have received under Plan A - Maximum Plan.
Option 3This plan of retirement offers a reduced monthly benefit that is based on the ages of the member and the beneficiary. The resulting benefit is paid to the retired member for life, with the guarantee to the surviving named beneficiary that at the time of the retired member’s death, the beneficiary will receive a
continued

Introductory Section13
SUMMARY OF PLAN PROVISIONS
payment for life of one-half of the initial monthly benefit received by the member at the time of retirement plus one-half of any cost-of-living increases the member received up to the time of death.
Option 3 Pop-UpAny member may elect a reduced retirement allowance to be designated “Option 3 Pop-Up” with the provision that if the beneficiary dies prior to the retiree, the basic benefit payable to the retiree shall increase to the amount the retiree would have received under Plan A - Maximum Plan.
Option 4This option offers a reduced monthly lifetime benefit in exchange for the flexibility to designate a specific dollar amount or percentage of your monthly benefit to be paid to your beneficiary after your death. The beneficiary benefits you specify under this plan cannot cause your monthly benefit to be reduced below 50% of the maximum benefit available to you. If multiple beneficiaries predecease you, the dollar amounts for the percentages are not adjusted. Beneficiaries also receive a prorated share of any cost-of-living increases you received up to the date of death.
Partial Lump-Sum Option PlanTRS offers a Partial Lump-Sum Option Plan (PLOP) at retirement. In exchange for a permanently reduced lifetime benefit, a member
may elect to receive a lump-sum distribution in addition to a monthly retirement benefit. The age of the member and plan of retirement are used to determine the reduction in the benefit.
A member is eligible to participate in the Partial Lump-Sum Option Plan if he or she meets the following criteria. A member must:
• have 30 years of creditable service or 10 years of creditable service and attain age 60 (not early retirement).
• not retire with disability benefits.
At retirement, a member may elect a lump-sum distribution in an amount between 1 and 36 months of his or her normal monthly retirement benefit. This amount will be calculated under Plan A - Maximum Plan of Retirement and will be rounded up or down to be a multiple of $1,000. If a PLOP distribution is elected, the monthly benefit is actuarially reduced to reflect the value of the PLOP distribution. The combination of both the PLOP distribution and the reduced benefit are the same actuarial value as the unreduced normal benefit alone.
Financing the SystemThe funds to finance the System come from member contributions, 6.00% of annual salary; employer contributions, 14.27% of annual salary; and investment income.
continued

Financial Section 14
INDEPENDENT AUDITORS’ REPORT
KPMG LLPSuite 2000, 303 Peachtree Street, NEAtlanta, GA 30308www.kpmg.com
Report on the Financial Statements
We have audited the accompanying financial statements of the Teachers Retirement System of Georgia (the System), a component unit of the State of Georgia, as of and for the year ended June 30, 2017, and the related notes to the financial statements, which collectively comprise the System’s basic financial statements as listed in the table of contents.
Management’s Responsibility for the Financial Statements
Management is responsible for the preparation and fair presentation of these financial statements in accordance with U.S. generally accepted accounting principles; this includes the design, implementation, and maintenance of internal control relevant to the preparation and fair presentation of financial statements that are free from material misstatement, whether due to fraud or error.
Auditors’ Responsibility
Our responsibility is to express an opinion on these financial statements based on our audit. We conducted our audit in accordance with auditing standards generally accepted in the United States of America and the standards applicable to financial audits contained in Government Auditing Standards, issued by the Comptroller General of the United States. Those standards require that we plan and perform the audit to obtain reasonable assurance about whether the financial statements are free from material misstatement.
An audit involves performing procedures to obtain audit evidence about the amounts and disclosures in the financial statements. The procedures selected depend on the auditors’ judgment, including the assessment of the risks of material misstatement of the financial statements, whether due to fraud or error. In making those risk assessments, the auditor considers internal control relevant to the entity’s preparation and fair presentation of the financial statements in order to design audit procedures that are appropriate in the circumstances, but not for the purpose of expressing an opinion on the effectiveness of the entity’s internal control. Accordingly, we express no such opinion. An audit also includes evaluating the appropriateness of accounting policies used and the reasonableness of significant accounting estimates made by management, as well as evaluating the overall presentation of the financial statements.
We believe that the audit evidence we have obtained is sufficient and appropriate to provide a basis for our audit opinion.
OpinionIn our opinion, the financial statements referred to above present fairly, in all material respects, the fiduciary net position of the System as of June 30, 2017, and the changes in fiduciary net position for the year then ended in accordance with U.S. generally accepted accounting principles.
Other MattersRequired Supplementary Information
U.S. generally accepted accounting principles require that the management’s discussion and analysis, schedule of changes in employers’ and nonemployers’ net pension liability, schedule of employers’ and nonemployers’ net pension liability and related ratios, schedule of employer and nonemployer contributions, schedule of investment returns, schedule of the System’s proportionate share of the net pension liability to ERS, and schedule of the System’s contributions to ERS on pages 16 – 19 and 36-37 be presented to supplement the basic financial statements. Such information, although not a part of the basic financial statements, is required by the Governmental Accounting Standards Board who considers it to be an essential part of financial reporting for placing the basic financial statements in an appropriate operational, economic, or historical context. We have applied certain limited procedures to the required supplementary information in accordance with auditing standards generally accepted in the United States of America, which consisted of inquiries of management about the methods of preparing the information and comparing the information for consistency with management’s responses to our inquiries, the basic financial statements, and other knowledge we obtained during our audit of the basic financial statements. We do not express an opinion or provide any assurance on the information because the limited procedures do not provide us with sufficient evidence to express an opinion or provide any assurance.
Supplementary and Other Information
Our audit was conducted for the purpose of forming an opinion on the financial statements that collectively comprise the System’s basic financial statements. The schedules of administrative expenses and investment expenses, and introductory, investment, actuarial, and statistical sections are presented for purposes of additional analysis and are not a required part of the basic financial statements.

Financial Section15
INDEPENDENT AUDITORS’ REPORT
The schedules of administrative expenses and investment expenses are the responsibility of management and were derived from and relate directly to the underlying accounting and other records used to prepare the basic financial statements. Such information has been subjected to the auditing procedures applied in the audit of the basic financial statements and certain additional procedures, including comparing and reconciling such information directly to the underlying accounting and other records used to prepare the basic financial statements or to the basic financial statements themselves, and other additional procedures in accordance with auditing standards generally accepted in the United States of America. In our opinion, the schedules of administrative expenses and investment expenses are fairly stated in all material respects in relation to the basic financial statements as a whole.
The introductory, investment, actuarial, and statistical sections have not been subjected to the auditing procedures applied in the audit of the basic financial statements, and accordingly, we do not express an opinion or provide an assurance on them.
Other Reporting Required by Government Auditing StandardsIn accordance with Government Auditing Standards, we have also issued our report dated September 29, 2017 on our consideration of the System’s internal control over financial reporting and on our tests of its compliance with certain provisions of laws, regulations, contracts, and grant agreements and other matters. The purpose of that report is to describe the scope of our testing of internal control over financial reporting and compliance and the results of that testing, and not to provide an opinion on internal control over financial reporting or on compliance. That report is an integral part of an audit performed in accordance with Government Auditing Standards in considering the System’s internal control over financial reporting and compliance.
Atlanta, GeorgiaSeptember 29, 2017, except for the introductory, investment, actuarial and statistical sections and the schedule of investment expenses which are as of December 11, 2017
continued

Financial Section 16
(Unaudited)
MANAGEMENT’S DISCUSSION & ANALYSIS
Overview of the Financial Statements
The basic financial statements include (1) the statement of fiduciary net position, (2) the statement of changes in fiduciary net position, and (3) notes to the financial statements. The System also includes in this report additional information to supplement the financial statements.
The System prepares its financial statements on an accrual basis in accordance with U.S. generally accepted accounting principles promulgated by the Governmental Accounting Standards Board (GASB). These statements provide information about the System’s overall financial status.
In addition, the System presents six required supplementary schedules, which provide historical trend information about the plan. Four of these schedules are presented from the perspective of the System reporting as the plan and include (1) a schedule of changes in employers’ and nonemployers’ net pension liability;
• At June 30, 2017, the System’s assets exceeded its liabilities by $71.3 billion (reported as net position) as compared to the net position of $65.6 billion at June 30, 2016, representing an increase of $5.8 billion.
• Contributions from members increased by $30.6 million or 4.5% from $685.6 million in 2016 to $716.2 million in 2017. Employer and nonemployer contributing entity (Nonemployer) contributions increased by $74.3 million or 4.7% from $1.6 billion in 2016 to $1.7 billion in 2017. The increase in member and employer contributions is primarily due to an increase in the number of active members and higher average payroll during the year.
• Pension benefits paid to retirees and beneficiaries for the years ended June 30, 2017 and 2016 were $4.5 billion and $4.2 billion, respectively, representing an increase of 5.5%. This is due to an increase in the number of retirees and beneficiaries receiving benefit payments and postretirement benefit adjustments.
Financial Highlights
This section provides a discussion and analysis of the financial performance of the Teachers Retirement System of Georgia (the System) for the year ended June 30, 2017. The discussion and analysis of the System’s financial performance is within the context of the accompanying financial statements and disclosures following this section.

Financial Section17
MANAGEMENT’S DISCUSSION & ANALYSIS
Overview of the Financial Statements continued
(2) a schedule of employers’ and nonemployers’ net pension liability and related ratios; (3) a schedule of employer and nonemployer contributions; and (4) a schedule of investment returns. Two schedules are presented from the perspective of the System reporting as the employer for its employees who are participants in the Employees’ Retirement System of Georgia (ERS) and include (1) a schedule of the System’s proportionate share of the net pension liability to ERS and (2) a schedule of the System’s contributions to ERS.
The Statement of Fiduciary Net Position
The Statement of Fiduciary Net Position presents information that includes all of the System’s assets and liabilities, with the balance reported as and representing the Net Position Restricted for Pensions. The investments of the System in this statement are presented at fair value. This statement is presented on page 20.
The Statement of Changes in Fiduciary Net Position
The Statement of Changes in Fiduciary Net Position reports how the System’s net position changed during the fiscal year. The additions and the deductions to net position are summarized in this statement. The additions include contributions and investment income, which includes the net increase (decrease) in the fair value of investments. The deductions include benefit payments, refunds of member contributions, and administrative expenses. This statement is presented on page 21.
Notes to the Financial Statements
The accompanying notes to the financial statements provide information essential to a full understanding of the System’s financial statements. The notes to the financial statements begin on page 22 of this report.
Required Supplementary Information
A brief explanation of the six required schedules found beginning on page 36 of this report follows:
Schedule of Changes in Employers’ and Nonemployers’ Net Pension Liability: This schedule presents historical trend information about the changes in the net pension liability and includes the beginning and ending balances of the total pension liability and the plan’s fiduciary net position, the net pension
liability, and the effects of certain changes on those items. This trend information will be accumulated to display a 10-year presentation.
Schedule of Employers’ and Nonemployers’ Net Pension Liability and Related Ratios: This schedule presents historical trend information about the net pension liability and includes total pension liability, the plan’s fiduciary net position, net pension liability, covered-employee payroll, and the ratios of fiduciary net position to total pension liability and net pension liability to covered-employee payroll. This trend information will be accumulated to display a 10-year presentation.
Schedule of Employer and Nonemployer Contributions: This schedule presents historical trend information for the last ten consecutive fiscal years about the actuarially determined contributions of employers and nonemployers and the contributions made in relation to the requirement.
Schedule of Investment Returns: This schedule presents historical trend information about the annual money-weighted rate of return on plan investments, net of plan investment expense. This trend information will be accumulated to display a 10-year presentation.
Schedule of the System’s Proportionate Share of the Net Pension Liability to ERS: This schedule presents historical trend information about the System’s proportionate share of the net pension liability for its employees who participate in the ERS plan. This trend information will be accumulated to display a 10-year presentation.
Schedule of the System’s Contributions to ERS: This schedule presents historical trend information about the System’s contributions for its employees who participate in the ERS plan. This trend information will be accumulated to display a 10-year presentation.
(Unaudited) continued

Financial Section 18
MANAGEMENT’S DISCUSSION & ANALYSIS
This table presents the investment allocation at June 30, 2017 and 2016.
(Unaudited) continued
2017 2016
Asset allocation at June 30 (in percentages):Equities:
Domestic 53.2 % 52.7 %International 17.7 15.9
Domestic obligations:U.S. Treasuries 16.2 15.2Corporate and other bonds 11.2 14.5
International obligations:Governments 0.5 0.5Corporates 1.2 1.2
Asset allocation at June 30 (in thousands):Equities:
Domestic $ 36,932,301 33,530,541 International 12,303,992 10,120,995
Domestic obligations:U.S. Treasuries 11,243,449 9,693,234 Corporate and other bonds 7,757,487 9,228,519
International obligations:Governments 322,725 324,118 Corporates 815,761 733,366
$ 69,375,715 63,630,773
Investment Allocation
Financial Analysis of the System
This table presents a summary of the System’s net position at June 30, 2017 and 2016.
The $5.8 billion increase in net position from 2016 to 2017 is primarily due to the increase in equity markets.
Net position June 30 Amount Percentage2017 2016 change change
Assets:Cash and cash equivalents
and receivables $ 2,039,157 2,080,140 (40,983) (2.0)%Investments 69,375,715 63,630,773 5,744,942 9.0Capital assets, net 7,638 7,174 464 6.5
Total assets 71,422,510 65,718,087 5,704,423 8.7
Deferred outflows of resources 8,483 4,978 3,505 70.4
Liabilities:Net pension liability 33,057 27,702 5,355 19.3Due to brokers and accounts
payable 56,888 140,732 (83,844) (59.6)
Total liabilities 89,945 168,434 (78,489) (46.6)
Deferred inflows of resources 76 2,220 (2,144) (96.6)
Net position $ 71,340,972 65,552,411 5,788,561 8.8
Summary of TRS Net Position (dollars in thousands)
(dollars in thousands):
Net position June 30Net position June 30 Amount Percentage2017 2016 change change
Assets:Cash and cash equivalents
and receivables $ 2,039,157 2,080,140 (40,983) (2.0)%Investments 69,375,715 63,630,773 5,744,942 9.0Capital assets, net 7,638 7,174 464 6.5
Total assets 71,422,510 65,718,087 5,704,423 8.7
Deferred outflows of resources 8,483 4,978 3,505 70.4
Liabilities:Net pension liability 33,057 27,702 5,355 19.3Due to brokers and accounts
payable 56,888 140,732 (83,844) (59.6)
Total liabilities 89,945 168,434 (78,489) (46.6)
Deferred inflows of resources 76 2,220 (2,144) (96.6)
Net position $ 71,340,972 65,552,411 5,788,561 8.8
Net position June 30 Amount Percentage2017 2016 change change
Assets:Cash and cash equivalents
and receivables $ 2,039,157 2,080,140 (40,983) (2.0)%Investments 69,375,715 63,630,773 5,744,942 9.0Capital assets, net 7,638 7,174 464 6.5
Total assets 71,422,510 65,718,087 5,704,423 8.7
Deferred outflows of resources 8,483 4,978 3,505 70.4
Liabilities:Net pension liability 33,057 27,702 5,355 19.3Due to brokers and accounts
payable 56,888 140,732 (83,844) (59.6)
Total liabilities 89,945 168,434 (78,489) (46.6)
Deferred inflows of resources 76 2,220 (2,144) (96.6)
Net position $ 71,340,972 65,552,411 5,788,561 8.8
2017 2016
Asset allocation at June 30 (in percentages):Equities:
Domestic 53.2 % 52.7 %International 17.7 15.9
Domestic obligations:U.S. Treasuries 16.2 15.2Corporate and other bonds 11.2 14.5
International obligations:Governments 0.5 0.5Corporates 1.2 1.2
Asset allocation at June 30 (in thousands):Equities:
Domestic $ 36,932,301 33,530,541 International 12,303,992 10,120,995
Domestic obligations:U.S. Treasuries 11,243,449 9,693,234 Corporate and other bonds 7,757,487 9,228,519
International obligations:Governments 322,725 324,118 Corporates 815,761 733,366
$ 69,375,715 63,630,773
Financial Section19
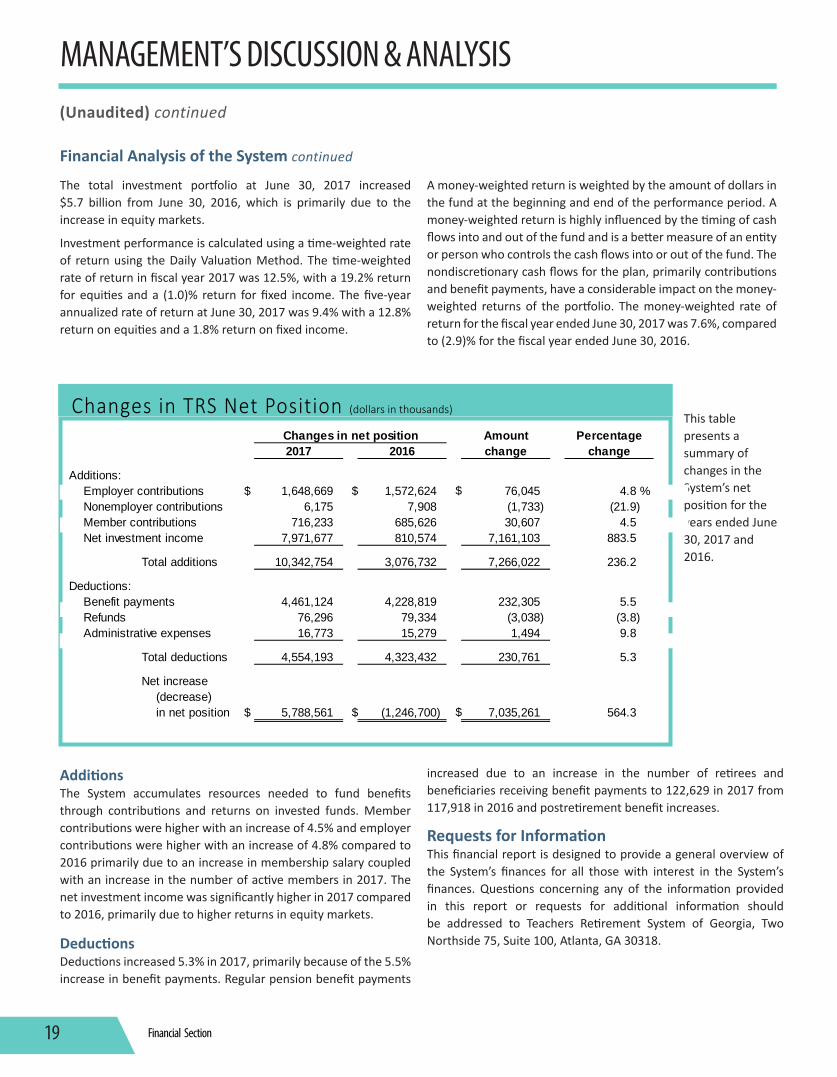
The total investment portfolio at June 30, 2017 increased $5.7 billion from June 30, 2016, which is primarily due to the increase in equity markets.
Investment performance is calculated using a time-weighted rate of return using the Daily Valuation Method. The time-weighted rate of return in fiscal year 2017 was 12.5%, with a 19.2% return for equities and a (1.0)% return for fixed income. The five-year annualized rate of return at June 30, 2017 was 9.4% with a 12.8% return on equities and a 1.8% return on fixed income.
A money-weighted return is weighted by the amount of dollars in the fund at the beginning and end of the performance period. A money-weighted return is highly influenced by the timing of cash flows into and out of the fund and is a better measure of an entity or person who controls the cash flows into or out of the fund. The nondiscretionary cash flows for the plan, primarily contributions and benefit payments, have a considerable impact on the money-weighted returns of the portfolio. The money-weighted rate of return for the fiscal year ended June 30, 2017 was 7.6%, compared to (2.9)% for the fiscal year ended June 30, 2016.
MANAGEMENT’S DISCUSSION & ANALYSIS
Additions The System accumulates resources needed to fund benefits through contributions and returns on invested funds. Member contributions were higher with an increase of 4.5% and employer contributions were higher with an increase of 4.8% compared to 2016 primarily due to an increase in membership salary coupled with an increase in the number of active members in 2017. The net investment income was significantly higher in 2017 compared to 2016, primarily due to higher returns in equity markets.
Deductions Deductions increased 5.3% in 2017, primarily because of the 5.5% increase in benefit payments. Regular pension benefit payments
increased due to an increase in the number of retirees and beneficiaries receiving benefit payments to 122,629 in 2017 from 117,918 in 2016 and postretirement benefit increases.
Requests for InformationThis financial report is designed to provide a general overview of the System’s finances for all those with interest in the System’s finances. Questions concerning any of the information provided in this report or requests for additional information should be addressed to Teachers Retirement System of Georgia, Two Northside 75, Suite 100, Atlanta, GA 30318.
This table presents a summary of changes in the System’s net position for the years ended June 30, 2017 and 2016.
(Unaudited) continued
Changes in net position Amount Percentage2017 2016 change change
Additions:Employer contributions $ 1,648,669 1,572,624 76,045 4.8 %Nonemployer contributions 6,175 7,908 (1,733) (21.9)Member contributions 716,233 685,626 30,607 4.5Net investment income 7,971,677 810,574 7,161,103 883.5
Total additions 10,342,754 3,076,732 7,266,022 236.2
Deductions:Benefit payments 4,461,124 4,228,819 232,305 5.5Refunds 76,296 79,334 (3,038) (3.8)Administrative expenses 16,773 15,279 1,494 9.8
Total deductions 4,554,193 4,323,432 230,761 5.3
Net increase(decrease)in net position $ 5,788,561 (1,246,700) 7,035,261 564.3
Changes in TRS Net Position (dollars in thousands)
Financial Analysis of the System continued
Changes in net position Amount Percentage2017 2016 change change
Additions:Employer contributions $ 1,648,669 1,572,624 76,045 4.8 %Nonemployer contributions 6,175 7,908 (1,733) (21.9)Member contributions 716,233 685,626 30,607 4.5Net investment income 7,971,677 810,574 7,161,103 883.5
Total additions 10,342,754 3,076,732 7,266,022 236.2
Deductions:Benefit payments 4,461,124 4,228,819 232,305 5.5Refunds 76,296 79,334 (3,038) (3.8)Administrative expenses 16,773 15,279 1,494 9.8
Total deductions 4,554,193 4,323,432 230,761 5.3
Net increase(decrease)in net position $ 5,788,561 (1,246,700) 7,035,261 564.3

Financial Section 20
June 30, 2017 (in thousands)
STATEMENT OF FIDUCIARY NET POSITION
See accompanying notes to financial statements.
Assets
Deferred Outflows of Resources
Liabilities
Net Position Restricted for Pensions
Deferred Inflows of Resources

Financial Section21
For the Year Ended June 30, 2017 (in thousands)
STATEMENT OF CHANGES IN FIDUCIARY NET POSITION
See accompanying notes to financial statements.
Additions:
Deductions:
Net Position Restricted for Pensions:

Financial Section 22
June 30, 2017
NOTES TO FINANCIAL STATEMENTS
1. Plan DescriptionTeachers Retirement System of Georgia (the System) was created in 1943 by an act of the Georgia Legislature (the Act) to provide retirement benefits for teachers who qualify under the Act. The System administers a cost-sharing, multiple-employer defined benefit pension plan as defined in Governmental Accounting Standards Board (GASB) Statement No. 67, Financial Reporting for Pension Plans. A Board of Trustees comprising two appointees by the Board, two ex-officio state employees, five appointees by the Governor, and one appointee of the Board of Regents is ultimately responsible for the administration of the System.
Eligibility and Membership
All teachers in the state public schools, the University System of Georgia (except those professors and principal administrators electing to participate in an optional retirement plan), and certain other designated employees in educational-related work are eligible for membership. There were 310 employers and 1 nonemployer contributing entity participating in the plan at June 30, 2017.
Retirement Benefits
that certain cost-of-living adjustments, based on the Consumer Price Index, may be made in future years. Retirement benefits are payable monthly for life. A member may elect to receive a partial lump-sum distribution in addition to a reduced monthly retirement benefit. Options are available for distribution of the member’s monthly pension, at a reduced rate, to a designated beneficiary on the member’s death.
Death and Disability Benefits
Retirement benefits also include death and disability benefits, whereby the disabled member or surviving spouse is entitled to receive annually an amount equal to the member’s service retirement benefit or disability retirement, whichever is greater. The benefit is based on the member’s creditable service (minimum of 10 years of service) and compensation up to the time of disability.
The death benefit is the amount that would be payable to the member’s beneficiary had the member retired on the date of death on either a service retirement allowance or a disability retirement allowance, whichever is larger. The benefit is based on the member’s creditable service (minimum of 10 years of service) and compensation up to the date of death. Contributions
The System is funded by member, employer, and nonemployer contributions. The contribution rates are adopted and amended by the Board of Trustees. Pursuant to O.C.G.A. §47-3-63, the employer contributions for certain full-time public school support personnel are funded on behalf of the employers by the State of Georgia.
Contributions, as a percentage of covered payroll, required for fiscal year 2017 were based on the June 30, 2014 actuarial valuation as follows:
As of June 30, 2017, participation in the System is as follows:
Inactive members and beneficiaries currently receiving benefits 122,629Inactive members not yet receiving benefits, vested 11,988Inactive members, nonvested 89,536Active plan members 222,918 Total 447,071
The System provides service retirement, disability retirement, and survivor’s benefits. Title 47 of the Official Code of Georgia Annotated (O.C.G.A.) assigns the authority to establish and amend the provisions of the System to the State Legislature. A member is eligible for normal service retirement after 30 years of creditable service, regardless of age, or after 10 years of service and attainment of age 60. A member is eligible for early retirement after 25 years of creditable service.
Normal retirement (pension) benefits paid to members are equal to 2% of the average of the member’s two highest paid consecutive years of service, multiplied by the number of years of creditable service up to 40 years. Early retirement benefits are reduced by the lesser of one-twelfth of 7% for each month the member is below age 60, or by 7% for each year or fraction thereof by which the member has less than 30 years of service. It is also assumed
Member 6.00 % Employer: Normal 6.56 % Unfunded accrued liability 7.71 % Total 14.27 %
Members become fully vested after 10 years of service. If a member terminates with less than 10 years of service, no vesting of employer contributions occurs, but the member’s contributions may be refunded with interest. Member contributions with accumulated interest are reported as net position restricted for pensions.

Financial Section23
NOTES TO FINANCIAL STATEMENTS
2. Summary of Significant Accounting Policies and Plan Asset Matters
Basis of Accounting
The System’s financial statements are prepared on the accrual basis of accounting. Contributions from the employers, nonemployers, and the members are recognized when due, based on statutory requirements. Retirement and refund payments are recognized as deductions when due and payable.
Reporting Entity
The System is a component unit of the State of Georgia; however, it is accountable for its own fiscal matters and presentation of its separate financial statements. The System has considered potential component units under GASB Statements No. 80, Blending Requirements for Certain Component Units, GASB Statement No. 61, The Financial Reporting Entity’s Omnibus – An Amendment of GASB Statements No. 14 and No. 34, and GASB Statement No. 39, Determining Whether Certain Organizations are Component Units, and determined there were no component units of the System.
Cash and Cash Equivalents
Cash and cash equivalents, reported at cost, include cash in banks and cash on deposit with the investment custodian.
Investments
Investments are reported at fair value. Securities traded on a national or international exchange are valued at the last reported sales price. There are no investments in, loans to, or leases with parties related to the System.
The System utilizes various investment instruments. Investment securities, in general, are exposed to various risks, such as interest rate, credit, foreign currency, and overall market volatility. Due to the level of risk associated with certain investment securities, it is reasonably possible that changes in the values of investment securities will occur in the near term and that such changes could materially affect the amounts reported in the financial statements.
The System’s policy in regard to the allocation of invested assets is established on a cost basis in compliance with Georgia Statute. Plan assets are managed on a total return basis with a long-term objective of achieving and maintaining a fully funded status for
Approximately 16.2% of the investments held for pension benefits are invested in debt securities of the U.S. government. The System has no investments in any one organization, other than those issued by the U.S. government, that represent 5% or more of the System’s net position restricted for pensions.
Asset Class Target Allocation
Fixed income 25% - 45%Equities 55%-75%Cashandcashequivalents —
Total 100%
For the fiscal year ended June 30, 2017, the annual money-weighted rate of return on pension plan investments, net of pension plan investment expense, was 7.62%. The money-weighted rate of return expresses investment performance, net of investment expense, adjusted for the changing amounts actually invested.
Capital Assets
Capital assets are stated at cost less accumulated depreciation. Capital assets costing $5,000 or more are capitalized. Depreciation on capital assets is computed using the straight-line method over estimated useful lives of three to forty years. Depreciation expense is included in administrative expenses, net. Maintenance and repairs are charged to administrative expenses when incurred. When assets are retired or otherwise disposed of, the costs and related accumulated depreciation are removed from the accounts, and any resulting gain or loss is reflected in the statement of changes in fiduciary net position in the period of disposal.
System Employee Pensions
For purposes of measuring the net pension liability, deferred outflows of resources and deferred inflows of resources related to pensions, and pension expense, information about the fiduciary net position of the ERS plan and additions to/deductions from the ERS fiduciary net position have been determined on the same basis as they are reported by ERS. For this purpose, benefit payments (including refunds of employee contributions) are recognized when due and payable in accordance with the benefit terms. Investments are reported at fair value.
Use of EstimatesThe preparation of financial statements in conformity with U.S. generally accepted accounting principles requires
June 30, 2017, continued
the benefits provided through the pension plan. The following was the System’s adopted asset allocation policy as of June 30, 2017:

Financial Section 24
NOTES TO FINANCIAL STATEMENTS
management to make estimates and assumptions that affect the reported amounts of fiduciary net position and changes therein. Actual results could differ from those estimates.
New Accounting PronouncementsPronouncements effective for the 2017 financial statements:
In June 2015, the GASB issued Statement No. 74, Financial Reporting for Postemployment Benefit Plans Other Than Pension Plans. This Statement improves the usefulness of other postemployment benefits (OPEB) information included in the general purpose external financial reports of state and local governmental OPEB plans for making decisions and assessing accountability. Implementation of this Statement by organizations that provide OPEB will require extensive note disclosures and required supplementary information (RSI) related to the measurement of the OPEB liabilities. There are no applicable reporting requirements for the System related to this Statement.
In August 2015, the GASB issued Statement No. 77, Tax Abatement Disclosures. This Statement defines tax abatement and provides disclosure guidance for governments that have granted tax abatements. There are no applicable reporting requirements for the System related to this Statement.
In December 2015, the GASB issued Statement No. 78, Pensions Provided through Certain Multiple-Employer Defined Benefit Pension Plans. The objective of this Statement is to amend the scope and applicability of Statement No. 68, Accounting and Financial Reporting for Pensions, to exclude pensions provided to employees of state or local governmental employers through certain multiple-employer defined benefit pension plans and to establish accounting and reporting requirements for those pensions. There are no applicable reporting requirements for the System related to this Statement.
In January 2016, the GASB issued Statement No. 80, Blending Requirements for Certain Component Units. The objective of this Statement is to improve financial reporting by clarifying the financial Statement presentation requirements for certain component units and to amend the blending requirements established in paragraph 53 of Statement No. 14, The Financial Reporting Entity, as amended. There are no applicable reporting requirements for the System related to this Statement.
In March 2016, the GASB issued Statement No. 82, Pension Issues – an Amendment of GASB Statements No. 67, 68, and No. 73. The objective of this Statement is to address issues regarding
(1) the presentation of payroll related measures in the required supplementary information, (2) the selection of assumptions and the treatment of deviations from the guidance in an Actuarial Standard of Practice for financial reporting purposes, and (3) the classification of payments made by employers to satisfy employee (plan member) contribution requirements. The implementation of GASB Statement No. 82 did not impact the amounts recorded or disclosures presented in the System’s financial Statements.
Pronouncements issued, but not yet effective:
In June 2015, the GASB issued Statement No. 75, Accounting and Financial Reporting for Postemployment Benefit Plans Other Than Pension Plans effective for fiscal years beginning after June 15, 2017. This Statement addresses accounting and financial reporting for OPEB that is provided to the employees of state and local governmental employers. This Statement establishes standards for recognizing and measuring liabilities, deferred outflows of resources, deferred inflows of resources, and expenses. This Statement also establishes requirements for note disclosures and required supplementary information for defined benefit OPEB plans. The System is in process of evaluating the impact of this pronouncement on its financial statements.
In March 2016, the GASB issued Statement No. 81, Irrevocable Split-Interest Agreements effective for fiscal years beginning after December 15, 2016. The objective of this Statement is to improve accounting and financial reporting for irrevocable split-interest agreements by providing recognition and measurement guidance for situations in which a government is a beneficiary of the agreement. There will be no applicable reporting requirements for the System related to this Statement.
In November 2016, the GASB issued Statement No. 83, Certain Asset Retirement Obligations effective for fiscal years beginning after June 15, 2018. This Statement addresses accounting and financial reporting for certain asset retirement obligations (AROs). An ARO is a legally enforceable liability associated with the retirement of a tangible capital asset. The System does not anticipate this statement to impact its financial statements and related reporting.
In January 2017, the GASB issued Statement No. 84, Fiduciary Activities effective for fiscal years beginning after December 15, 2018. The objective of this Statement is to improve guidance regarding the identification of fiduciary activities for accounting and financial reporting purposes and how those activities should be reported. The System is in process of evaluating the impact of this pronouncement on its financial statements.
In March 2017, the GASB issued Statement No. 85, Omnibus 2017 effective for fiscal years beginning after June 15, 2017. This Statement
June 30, 2017, continued
2. Summary of Significant Accounting Policies and Plan Asset Matters, continued

Financial Section25
NOTES TO FINANCIAL STATEMENTS
addresses practice issues that have been identified during implementation and application of certain GASB Statements. A variety of topics are addressed including issues related to blending component units, goodwill, fair value measurement and application, and OPEB. The System is in process of evaluating the impact of this pronouncement on its financial statements.
In May 2017, the GASB issued Statement No. 86, Certain Debt Extinguishment Issues effective for fiscal years beginning after June 15, 2017. The primary objective of this Statement is to improve consistency in accounting and financial reporting for in-substance defeasance of debt. There will be no applicable reporting requirements for the System related to this Statement.
3. Investment ProgramThe System maintains sufficient cash to meet its immediate liquidity needs. Cash not immediately needed is invested as directed by the Board of Trustees. All investments are held by agent custodial banks in the name of the System. State statutes and the System’s investment policy authorize the System to invest in a variety of short-term and long-term securities as follows:
Cash and Cash Equivalents
The carrying amount of the System’s deposits totaled approximately $1.6 billion at June 30, 2017, with actual bank balances of approximately $1.6 billion. The System’s cash balances are fully insured through the Federal Deposit Insurance Corporation, an independent agency of the U.S. government.
Short-term securities authorized but not currently used are:
• Repurchase and reverse repurchase agreements, whereby the System and a broker exchange cash for direct obligations of the U.S. government or obligations unconditionally guaranteed by agencies of the U.S. government or U.S. corporations. The System or broker promises to repay the cash received plus interest at a specific date in the future in exchange for the same securities.
• U.S. Treasury obligations.
• Commercial paper, with a maturity of 180 days or less. Commercial paper is an unsecured promissory note issued primarily by corporations for a specific amount and maturing on a specific day. The System considers for investment only commercial paper of the highest quality, rated P-1 and/or A-1 by national credit rating agencies.
• Master notes, an overnight security administered by a custodian bank, and an obligation of a corporation whose
commercial paper is rated P-1 and/or A-1 by national credit rating agencies.
Investments in commercial paper or master notes are limited to no more than $500 million in any one name.
Investments
Fixed income investments, managed by the Division of Investment Services (the Division), are authorized in the following instruments:
• U.S. and foreign government obligations. At June 30, 2017, the System held U.S. Treasury bonds of approximately $11.2 billion and international government bonds of approximately $322.7 million.
• U.S. and foreign corporate obligations. At June 30, 2017, the System held U.S. corporate bonds of approximately $7.8 billion and international corporate bonds of approximately $815.8 million.
• Obligations unconditionally guaranteed by agencies of the U.S. government. At June 30, 2017, the System did not hold agency bonds.
• Private placements are authorized under the same general restrictions applicable to corporate bonds. At June 30, 2017, the System did not hold private placements.
Mortgage investments are authorized to the extent that they are secured by first mortgages on improved real property located in the state of Georgia.
Equity securities are also authorized (in statutes) for investment as a complement to the System’s fixed income portfolio and as a long-term inflation hedge. By statute, no more than 75% of the total invested assets on a historical cost basis may be placed in equities. Equity holdings in any one corporation may not exceed 5% of the outstanding equity of the issuing corporation. The equity portfolio is managed by the Division in conjunction with independent advisors. Buy/sell decisions are based on securities meeting rating criteria established by the Board of Trustees; in-house research considering such matters as yield, growth, and sales statistics; and analysis of independent market research. Equity trades are approved and executed by the Division’s staff. Common stocks eligible for investment are approved by the Investment Committee of the Board of Trustees before being placed on an approved list. Equity investments are authorized in the following instruments:
• Domestic equities are those securities considered by the O.C.G.A. to be domiciled in the United States. At June 30, 2017, the System held domestic equities of approximately $36.9 billion.
June 30, 2017, continued
2. Summary of Significant Accounting Policies and Plan Asset Matters, continued

Financial Section 26
NOTES TO FINANCIAL STATEMENTS
• International equities, including American Depository Receipts (ADR), are not considered by the O.C.G.A. to be domiciled in the United States. At June 30, 2017, the System held ADRs of approximately $9.0 billion and international equities of approximately $3.3 billion.
Fair Value Measurements: The System categorizes its fair value measurements within the fair value hierarchy established by generally accepted accounting principles. The hierarchy is based on the inputs used in valuation and gives the highest priority to unadjusted quoted prices in active markets and requires that observable inputs be used in the valuations when available. The disclosure of fair value estimates in the hierarchy is based on whether the significant inputs into the valuations are observable. In determining the level of the hierarchy in which the estimate is disclosed, the highest level, Level 1, is given to unadjusted quoted prices in active markets and the lowest level, Level 3, to unobservable inputs.
Level 1 – Valuations based on unadjusted quoted prices for identical instruments in active markets that the System has the ability to access.
Level 2 – Valuations based on quoted prices for similar instruments in active markets; quoted prices for identical or similar instruments in markets that are not active; and model-derived valuations in which all significant inputs are observable.
Level 3 – Valuations based on inputs that are unobservable and significant to the overall fair value measurement.
In instances where inputs used to measure fair value fall into different levels in the fair value hierarchy, fair value measurements in their entirety are categorized based on the lowest level input that is significant to the valuation. The System’s assessment of the significance of particular inputs to these fair value measurements requires judgment and considers factors specific to each investment.
Equity securities classified in Level 1 are valued using prices quoted in active markets for those securities. Equity securities classified in Level 2 are valued using prices quoted for similar instruments in active markets. Equity securities classified in Level 3 are valued using third-party valuations not currently observable in the market.
Debt securities classified in Level 1 are valued using prices quoted in active markets. Debt securities classified in Level 2 are valued using either a bid evaluation or a matrix pricing technique. Bid evaluations may include market quotations, yields, maturities, call features, and ratings. Matrix pricing is used to value securities based on the securities’ relationship to benchmark quoted prices. These securities have nonproprietary information that was readily available to market participants, from multiple independent sources, which are known to be actively involved in the market.
This table shows the fair value leveling of the System’s investments.
Investments Measured at Fair Value as of June 30, 2017 (dollars in thousands)
3. Investment Program, continued
June 30, 2017, continued
Investments by fair value level
Equities: Domestic InternationalObligations: Domestic U.S. treasuries Corporate bonds International Governments Corporate bonds
Total investments by fair value level
Quoted prices in active markets for identical assets
Level 1
$ 36,931,98312,219,116
11,243,449__
____
$ 60,394,548
Significant other observable inputs
Level 2
Significant unobservable inputs
Level 3 Total
$ 318__
____
____
$ 318
$ __
84,876
__7,757,487
322,725815,761
$ 8,980,849
$ 36,932,30112,303,992
11,243,4497,757,487
322,725815,761
$ 69,375,715
Fair value measures using

Financial Section27
NOTES TO FINANCIAL STATEMENTS
Credit Risk: Credit risk is the risk that an issuer or other counterparty to an investment will not fulfill its obligations to the System. State law limits investments to investment grade securities. It is the System’s investment policy to require that the bond portfolio be of high quality and chosen with respect to maturity ranges, coupon levels, refunding characteristics, and marketability. The System’s policy is to require that new purchases of bonds be restricted
to high grade bonds rated no lower than “A” by any nationally recognized statistical rating organization. If a bond is subsequently downgraded to a rating below “A,” it is placed on a watch list. The System holds one bond, which was downgraded to a rating below “A.” Obligations of the U.S. government or obligations explicitly guaranteed by the U.S. government are not considered to have credit risk and do not require disclosure of credit quality.
Concentration of Credit Risk: Concentration of credit risk is the risk of loss that may be attributed to the magnitude of a goverment’s investment in a single issue. At June 30, 2017, the System did not have debt or equity investments in any one organization, other than those issued or guaranteed by the U.S. government or its agencies, which represented greater than 5% of plan net position.
Interest Rate Risk: Interest rate risk is the risk that changes in interest rates will adversely affect the fair value of an investment. While the System has no formal interest rate risk policy, active
management of the bond portfolio incorporates interest rate risk to generate improved returns. This risk is managed within the portfolio using the effective duration method. This method is widely used in the management of fixed income portfolios and quantifies to a much greater degree the sensitivity to interest rate changes when analyzing a bond portfolio with call options, prepayment provisions, and any other cash flows. Effective duration makes assumptions regarding the most likely timing and amounts of variable cash flows and is best utilized to gauge the effect of a change in interest rates on the fair value of a portfolio.
The quality ratings of investments in fixed income securities as described by Standard & Poor’s and by Moody’s Investor Ser v i ces , which are nationally recognized statistical rating organizations, at June 30, 2017, are shown in the chart.
Quality Ratings of Fixed Income Investments held at June 30, 2017 (dollars in thousands)
June 30, 2017, continued
3. Investment Program, continued
_______Investment Type________
Domestic obligations: U.S. treasuries
Corporates
Total domestic corporates
International obligations: Governments
Corporates
Total international corporates
Total fixed income investments
Standard and Poor’s/ _ Moody’s Quality Rating_
AAA/AaaAA/AaaAA/AaAA/AA/A
BBB/Baa
A/Aa
A/AaA/A
$ 11,243,449
727,150813,250
1,055,6851,958,9482,879,722
322,732
7,757,487
322,725
405,119410,642
815,761
$ 20,139,422
June 30, 2017 Fair Value

Financial Section 28
NOTES TO FINANCIAL STATEMENTS
Foreign Currency Risk: Foreign currency risk is the risk that changes in exchange rates will adversely impact the fair value of an investment. The System’s currency risk exposures, or exchange rate risks, primarily reside within the System’s international equity investment holdings. The System’s asset allocation and investment policies allow for active and passive investments in international securities. The System’s Board-adopted foreign exchange risk management policy is to minimize risk and protect
the investments from negative impact by hedging foreign currency exposures with foreign exchange instruments when market conditions and circumstances are deemed appropriate. Foreign exchange instruments are used to protect the value of noncash investments from currency movements, through the use of foreign exchange instruments. The System’s foreign exchange risk management policy does not quantify limitations on foreign currency-denominated investments.
Effective Duration of Fixed Income Assets by Security Type (dollars in thousands)Effective duration of fixed income assets by security type
Percentage EffectiveFair value of all fixed duration
Fixed income security type June 30, 2017 income assets (years)
Domestic obligations:U.S. Treasuries $ 11,243,449 55.8% 5.6Corporates 7,757,487 38.5 4.0
International obligations:Governments 322,725 1.6 0.3Corporates 815,761 4.1 1.8
Total $ 20,139,422 100.0% 4.7
International Investment Securities at Fair Value as of June 30, 2017 (dollars in thousands)
As of June 30, 2017, the System’s exposure to foreign currency risk in U.S. Dollars is highlighted in this table.
It is believed that the reporting of effective duration found in this table quantifies to the fullest extent possible the interest rate risk of the System’s fixed income assets.
June 30, 2017, continued
3. Investment Program, continued
$
Currency Australian DollarBrazilian RealBritish PoundCanadian DollarCzech KroneDanish KroneEuroHong Kong DollarIndian RupeeIndonesian RupiahJapanese YenMalaysian PesoMexican PesoNew Taiwan DollarPhilippine PesoPolish ZlotySingapore DollarSouth African RandSouth Korean WonSwedish Krona Swiss FrancThailand Baht
Total holdings subject to foreign currency risk
Investment securities payable in U.S. dollars
Total international investments - at fair value
Equities $ 144,531
80,222316,00843,3392,004
80,060502,805175,524190,16327,589
502,75343,70131,943
213,33624,00717,26888,682
164,847354,771154,60879,14584,876
3,322,182
8,981,810
$ 12,303,992
Fixed Income __
__________ __ __ __ __ __ __ __ __ __ __ __ __ __ __ __ __
__
1,138,486
$ 1,138,486
Total $ 144,531
80,222316,008
43,3392,004
80,060502,805175,524190,163
27,589502,753
43,70131,943
213,33624,00717,26888,682
164,847354,771154,608
79,14584,876
3,322,182
10,120,296
$ 13,442,478

Financial Section29
NOTES TO FINANCIAL STATEMENTS
4. Securities Lending Program
State statutes and Board of Trustees’ policies permit the System to lend its securities to broker/dealers with a simultaneous agreement to return the collateral for the same securities in the future. The System is presently involved in a securities lending program with major brokerage firms. The System lends equity and fixed income securities for varying terms and receives a fee based on the loaned securities’ value. During a loan, the System continues to receive dividends and interest as the owner of the loaned securities. The brokerage firms pledge collateral securities consisting of U.S. gov-ernment and agency securities, mortgage-backed securities issued by a U.S. government agency, corporate bonds, and equities. The collateral value must be equal to at least 102% to 109% of the loaned securities’ value, depending on the type of collateral security.
Securities loaned totaled approximately $16.3 billion at June 30, 2017. The collateral value was equal to 104.8% of the loaned secu-rities’ value at June 30, 2017. The System’s lending collateral was held in the System’s name by the tri-party custodian.
Loaned securities are included in the accompanying statement of fiduciary net position since the System maintains ownership. The related collateral securities are not recorded as assets on the System’s statement of fiduciary net position, and a corresponding liability is not recorded, since the System is deemed not to have the ability to pledge or trade the collateral securities. In accordance with the criteria set forth in GASB Statement No. 28, Accounting and Financial Reporting for Securities Lending Transactions, the System is deemed not to have the ability to pledge or sell collateral securities, since the System’s lending contracts do not address whether the lender can pledge or sell the collateral securities without a borrower default, the System has not previously demonstrated that ability, and there are no indications of the System’s ability to pledge or sell the collateral securities.
June 30, 2017, continued

Financial Section 30
NOTES TO FINANCIAL STATEMENTS
5. Capital Assets
6. Net Pension Liability of Employers and Nonemployers
This table summarizes the components of the net pension liability of the participating employers and nonemployers at June 30, 2017.
Actuarial assumptions: The total pension liability was determined by an actuarial valuation as of June 30, 2016, using the following actuarial assumptions, applied to all periods included in the measurement:
Balance Balanceat June 30, at June 30,
2016 Additions Disposals 2017
Capital assets:Land $ 4,342 — — 4,342 Building 2,800 — — 2,800 Furniture and fixtures 403 — (6) 397 Computer equipment 2,497 998 (601) 2,894 Computer software 14,980 — — 14,980
25,022 998 (607) 25,413
Accumulated depreciation for:Building $ (840) (70) — (910) Furniture and fixtures (310) (22) 6 (326) Computer equipment (1,718) (442) 601 (1,559) Computer software (14,980) — — (14,980)
(17,848) (534) 607 (17,775)
Capital assets, net $ 7,174 464 — 7,638
Summary of Capital Assets (dollars in thousands)
Total pension liability $ 89,926,280 Plan fiduciary net position 71,340,972
Employers’ and nonemployers’net pension liability $ 18,585,308
Plan fiduciary net position as a percentageof the total pension liability 79.33 %
Components of Net Pension Liability (dollars in thousands)
Inflation 2.75%Salary increases 3.25–9.00%, including inflationInvestment rate of return 7.50%, net of pension plan investment
expense, including inflation
This table summarizes the capital assets and depreciation information as of June 30 and for the year then ended.
June 30, 2017, continued
$ $
$
$
$ $ $
$$

Financial Section31
NOTES TO FINANCIAL STATEMENTS
Postretirement mortality rates were based on the RP-2000 White Collar Mortality Table with future mortality improvement projected to 2025 with the Society of Actuaries’ projection scale BB (set forward one year for males) for service retirements and dependent beneficiaries. The RP-2000 Disabled Mortality Table with future mortality improvement projected to 2025 with Society of Actuaries’ projection scale BB (set forward two years for males and four years for females) was used for death after disability retirement. There is a margin for future mortality improvement in the tables used by the System. Based on the results of the most recent experience study adopted by the Board on November 18, 2015, the numbers of expected future deaths are 8–11% less than the actual number of deaths that occurred during the study period for healthy retirees and 9–11% less than expected under the selected table for disabled retirees. Rates of mortality
in active service were based on the RP-2000 Employee Mortality Table projected to 2025 with projection scale BB.
The actuarial assumptions used in the June 30, 2016 valuation were based on the results of an actuarial experience study for the period July 1, 2009 – June 30, 2014.
The long-term expected rate of return on pension plan investments was determined using a log-normal distribution analysis in which best-estimate ranges of expected future real rates of return (expected nominal returns, net of pension plan investment expense and the assumed rate of inflation) are developed for each major asset class. These ranges are combined to produce the long-term expected rate of return by weighting the expected future real rates of return by the target asset allocation percentage and by adding expected inflation. The target asset allocation and best estimates of arithmetic real rates of return for each major asset class are summarized in the following table:
Discount rate: The discount rate used to measure the total pension liability was 7.50%. The projection of cash flows used to determine the discount rate assumed that plan member contributions will be made at the current contribution rate and that employer and nonemployer contributions will be made at rates equal to the difference between actuarially determined contribution rates and the member rate. Based on those assumptions, the pension plan’s fiduciary net position was projected to be available to make all projected future benefit payments of current plan members. Therefore, the long-term expected rate of return on pension plan investments was applied to all periods of projected benefit payments to determine the total pension liability.
Sensitivity of the net pension liability to changes in the discount rate: The following presents the net pension liability of the
employers and nonemployers, calculated using the discount rate of 7.50%, as well as what the net pension liability would be if it were calculated using a discount rate that is 1-percentage-point lower (6.50%) or 1-percentage-point higher (8.50%) than the current rate.
Actuarial valuation date: The total pension liability is based upon the June 30, 2016 actuarial valuation. An expected total pension liability is determined as of June 30, 2017 using standard
Long-termTarget expected real
Asset class allocation rate of return*
Fixed income 30.00 % (0.50)%Domestic large cap equities 39.80 9.00Domestic mid cap equities 3.70 12.00Domestic small cap equities 1.50 13.50International developed market equities 19.40 8.00International emerging market equities 5.60 12.00
Total 100.00 %
* Net of inflation
Target Allocation & Estimated Rates of Return by Asset Class
June 30, 2017, continued
6. Net Pension Liability of Employers and Nonemployers, continued
1% Current 1%Decrease discount rate Increase
(6.50%) (7.50%) (8.50%)
Employers’ and nonemployers’ net pensionliability $ 30,500,671 18,585,308 8,769,727
1% Current 1%Decrease discount rate Increase
(6.50%) (7.50%) (8.50%)
Employers’ and nonemployers’ net pensionliability $ 30,500,671 18,585,308 8,769,727
1% Current 1%Decrease discount rate Increase
(6.50%) (7.50%) (8.50%)
Employers’ and nonemployers’ net pensionliability $ 30,500,671 18,585,308 8,769,727
1% Current 1%Decrease discount rate Increase
(6.50%) (7.50%) (8.50%)
Employers’ and nonemployers’ net pensionliability $ 30,500,671 18,585,308 8,769,727
Employers’ and Nonemployers’ Net Pension Liability(dollars in thousands)

Financial Section 32
NOTES TO FINANCIAL STATEMENTS
roll-forward techniques. The roll-forward calculation adds the annual normal cost (also called service cost), subtracts the actual benefit payments and refunds for the plan year, and then applies the expected investment rate of return for the year.
7. System Employees’ Retirement Benefits
The System’s employees are members of the ERS plan. The notes to the financial statements that follow and required supplementary information on page 37 are presented from the perspective of the System as an employer.
General Information about the Employees’ Retirement System of Georgia
Plan description: ERS is a cost-sharing multiple-employer defined benefit pension plan established by the Georgia General Assembly during the 1949 Legislative Session for the purpose of providing retirement allowances for employees of the State of Georgia and its political subdivisions. ERS is directed by a Board of Trustees. Title 47 of the O.C.G.A. assigns the authority to establish and amend the benefit provisions to the State Legislature. ERS issues a publicly available financial report that can be obtained at www.ers.ga.gov/formspubs/formspubs.html.
Benefits provided: The ERS Plan supports three benefit tiers: Old Plan, New Plan, and Georgia State Employees’ Pension and Savings Plan (GSEPS). Employees under the Old Plan started membership prior to July 1, 1982 and are subject to plan provisions in effect prior to July 1, 1982. Members hired on or after July 1, 1982 but prior to January 1, 2009 are New Plan members subject to modified plan provisions. Effective January 1, 2009, new state employees and rehired state employees who did not retain membership rights under the Old or New Plans are members of GSEPS. ERS members hired prior to January 1, 2009 also have the option to irrevocably change their membership to GSEPS.
Under the Old Plan, the New Plan, and GSEPS, a member may retire and receive normal retirement benefits after completion of 10 years of creditable service and attainment of age 60 or 30 years of creditable service regardless of age. Additionally, there are some provisions allowing for early retirement after 25 years of creditable service for members under age 60.
Retirement benefits paid to members are based upon the monthly average of the member’s highest 24 consecutive calendar months, multiplied by the number of years of creditable service, multiplied by the applicable benefit factor. Annually, postretirement cost-of-living adjustments may also be made to members’ benefits, provided the members were hired prior to July 1, 2009. The normal retirement pension is payable monthly for life; however, options are available
June 30, 2017, continued
6. Net Pension Liability of Employers and Nonemployers, continued
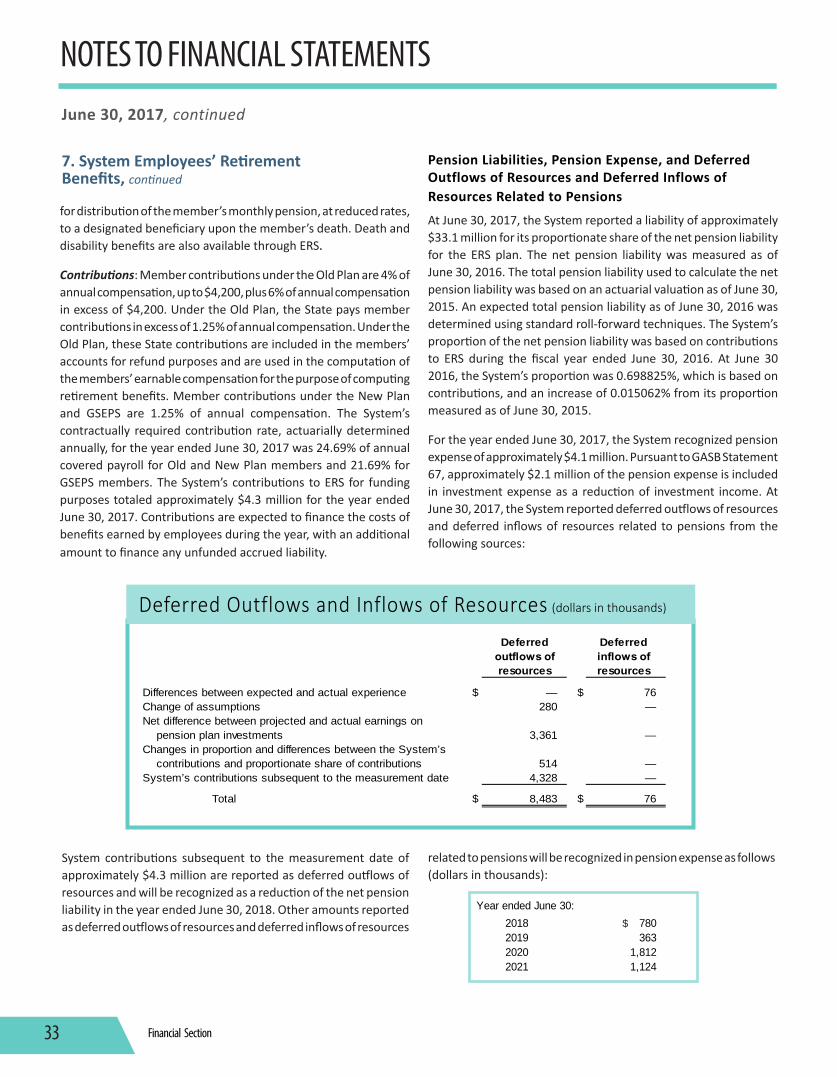
Financial Section33
NOTES TO FINANCIAL STATEMENTS
for distribution of the member’s monthly pension, at reduced rates, to a designated beneficiary upon the member’s death. Death and disability benefits are also available through ERS.
Contributions: Member contributions under the Old Plan are 4% of annual compensation, up to $4,200, plus 6% of annual compensation in excess of $4,200. Under the Old Plan, the State pays member contributions in excess of 1.25% of annual compensation. Under the Old Plan, these State contributions are included in the members’ accounts for refund purposes and are used in the computation of the members’ earnable compensation for the purpose of computing retirement benefits. Member contributions under the New Plan and GSEPS are 1.25% of annual compensation. The System’s contractually required contribution rate, actuarially determined annually, for the year ended June 30, 2017 was 24.69% of annual covered payroll for Old and New Plan members and 21.69% for GSEPS members. The System’s contributions to ERS for funding purposes totaled approximately $4.3 million for the year ended June 30, 2017. Contributions are expected to finance the costs of benefits earned by employees during the year, with an additional amount to finance any unfunded accrued liability.
Pension Liabilities, Pension Expense, and Deferred Outflows of Resources and Deferred Inflows of Resources Related to Pensions
At June 30, 2017, the System reported a liability of approximately $33.1 million for its proportionate share of the net pension liability for the ERS plan. The net pension liability was measured as of June 30, 2016. The total pension liability used to calculate the net pension liability was based on an actuarial valuation as of June 30, 2015. An expected total pension liability as of June 30, 2016 was determined using standard roll-forward techniques. The System’s proportion of the net pension liability was based on contributions to ERS during the fiscal year ended June 30, 2016. At June 30 2016, the System’s proportion was 0.698825%, which is based on contributions, and an increase of 0.015062% from its proportion measured as of June 30, 2015.
For the year ended June 30, 2017, the System recognized pension expense of approximately $4.1 million. Pursuant to GASB Statement 67, approximately $2.1 million of the pension expense is included in investment expense as a reduction of investment income. At June 30, 2017, the System reported deferred outflows of resources and deferred inflows of resources related to pensions from the following sources:
Deferred Deferredoutflows of inflows ofresources resources
Differences between expected and actual experience $ — 76 Change of assumptions 280 — Net difference between projected and actual earnings on
pension plan investments 3,361 — Changes in proportion and differences between the System’s
contributions and proportionate share of contributions 514 — System’s contributions subsequent to the measurement date 4,328 —
Total $ 8,483 76
Deferred Outflows and Inflows of Resources (dollars in thousands)
June 30, 2017, continued
7. System Employees’ Retirement Benefits, continued
System contributions subsequent to the measurement date of approximately $4.3 million are reported as deferred outflows of resources and will be recognized as a reduction of the net pension liability in the year ended June 30, 2018. Other amounts reported as deferred outflows of resources and deferred inflows of resources
related to pensions will be recognized in pension expense as follows (dollars in thousands):
Deferred Deferredoutflows of inflows ofresources resources
Differences between expected and actual experience $ — 76 Change of assumptions 280 — Net difference between projected and actual earnings on
pension plan investments 3,361 — Changes in proportion and differences between the System’s
contributions and proportionate share of contributions 514 — System’s contributions subsequent to the measurement date 4,328 —
Total $ 8,483 76
Year ended June 30:2018 $ 780 2019 363 2020 1,812 2021 1,124
Year ended June 30:2018 $ 780 2019 363 2020 1,812 2021 1,124
Year ended June 30:2018 $ 780 2019 363 2020 1,812 2021 1,124
$

Financial Section 34
NOTES TO FINANCIAL STATEMENTS
future mortality improvement in the tables used by the System. Based on the results of the most recent experience study adopted by the Board on December 17, 2015, the numbers of expected future deaths are 9–12% less than the actual number of deaths that occurred during the study period for service retirements and beneficiaries and for disability retirements. Rates of mortality in active service were based on the RP-2000 Employee Mortality Table projected to 2025 with projection scale BB.
The actuarial assumptions used in the June 30, 2015 valuation were based on the results of an actuarial experience study for the period July 1, 2009 – June 30, 2014.
The long-term expected rate of return on pension plan investments was determined using a log-normal distribution analysis in which best-estimate ranges of expected future real rates of return (expected nominal returns, net of pension plan investment expense and the assumed rate of inflation) are developed for each major asset class. These ranges are combined to produce the long-term expected rate of return by weighting the expected future real rates of return by the target asset allocation percentage and by adding expected inflation.
Long-termTarget expected real
Asset class allocation rate of return*
Fixed income 30.00 % (0.50)%Domestic large cap equities 37.20 9.00Domestic mid cap equities 3.40 12.00Domestic small cap equities 1.40 13.50International developed market equities 17.80 8.00International emerging market equities 5.20 12.00Alternatives 5.00 10.50
Total 100.00 %
* Net of inflation
Target Allocation & Estimated Rates of Return by Asset Class
June 30, 2017, continued
7. System Employees’ Retirement Benefits, continued
Actuarial assumptions: The total pension liability as of June 30, 2016 was determined by an actuarial valuation as of June 30, 2015 using the following actuarial assumptions, applied to all periods included in the measurement:
Inflation 2.75%Salary increases 3.25 – 7.00%, including inflationInvestment rate of return 7.50%, net of pension plan investment
expense, including inflation
Post-retirement mortality rates were based on the RP-2000 Combined Mortality Table with future mortality improvement projected to 2025 with the Society of Actuaries’ projection scale BB and set forward 2 years for both males and females for service retirements and dependent beneficiaries. The RP-2000 Disabled Mortality Table with future mortality improvement projected to 2025 with Society of Actuaries’ projection scale BB and set back seven years for males and set forward three years for females was used for death after disability retirement. There is a margin for
The target allocation and best estimates of arithmetic real rates of return for each major asset class are summarized in this table:
Discount rate: The discount rate used to measure the total pension liability was 7.50%. The projection of cash flows used to determine the discount rate assumed that plan member contributions will be made at the current contribution rate and that employer and
State of Georgia contributions will be made at rates equal to the difference between actuarially determined contribution rates and the member rate. Based on those assumptions, the ERS fiduciary net position was projected to be available to make all projected

Financial Section35
NOTES TO FINANCIAL STATEMENTS
7. System Employees’ Retirement Benefits, continued
future benefit payments of current plan members. Therefore, the long-term expected rate of return on pension plan investments was applied to all periods of projected benefit payments to determine the total pension liability.
Sensitivity of the System’s proportionate share of the net pension liability to changes in the discount rate: The following presents the System’s proportionate share of the net pension liability calculated using the discount rate of 7.50%, as well as what the System’s proportionate share of the net pension liability would be if it were Pension plan fiduciary net position: Detailed information about
the ERS plan’s fiduciary net position is available in the separately issued ERS financial report, which is publically available at www.ers.ga.gov/formspubs/formspubs.html.
June 30, 2017, continued
calculated using a discount rate that is 1-percentage-point lower (6.50%) or 1-percentage-point higher (8.50%) than the current rate (dollars in thousands):
1% Current 1%Decrease discount rate Increase
(6.50%) (7.50%) (8.50%)
System’s proportionate share of the netpension liability $ 44,799 33,057 23,051
1% Current 1%Decrease discount rate Increase
(6.50%) (7.50%) (8.50%)
System’s proportionate share of the netpension liability $ 44,799 33,057 23,051
1% Current 1%Decrease discount rate Increase
(6.50%) (7.50%) (8.50%)
System’s proportionate share of the netpension liability $ 44,799 33,057 23,051
1% Current 1%Decrease discount rate Increase
(6.50%) (7.50%) (8.50%)
System’s proportionate share of the netpension liability $ 44,799 33,057 23,051
1% Current 1%Decrease discount rate Increase
(6.50%) (7.50%) (8.50%)
System’s proportionate share of the netpension liability $ 44,799 33,057 23,051
System’s Propotionate Share of the Net Pension Liability

Financial Section 36
REQUIRED SUPPLEMENTARY INFORMATION
Schedule of Changes in Employers’ & Nonemployers’ Net Pension Liability (dollars in thousands)
Schedule of Employers’ & Nonemployers’ Net Pension Liability & Related Ratios (dollars in thousands)
Note: Schedule is intended to show information for 10 years. Additional years will be displayed as they become available.
1 The System is a participating employer in the Employees’ Retirement System of Georgia. Pursuant to the requirements of GASB Statement No. 68, the fiscal year 2015 beginning Fiduciary Net Position was restated by $27,705,937 for reporting purposes to reflect the impact of recording the initial deferred outflows of resources and the net pension liability. For actuarial purposes, this adjustment is being recognized in fiscal year 2015 and beginning fiduciary net position was not restated.
Note: Schedule is intended to show information for 10 years. Additional years will be displayed as they become available.
For the Year Ended June 30 (Unaudited)

Financial Section37
REQUIRED SUPPLEMENTARY INFORMATION
Schedule of the System’s Contributions to ERS (dollars in thousands)
Schedule of Employer and Nonemployer Contributions (dollars in thousands)
For the Year Ended June 30 (Unaudited), continued
Schedule of Investment Returns
Note: Schedule is intended to show information for 10 years. Additional years will be displayed as they become available.
Schedule of the System’s Proportionate Share of the Net Pension Liability to ERS (dollars in thousands)
Note: Schedule is intended to show information for 10 years. Additional years will be displayed as they become available.
Note: Schedule is intended to show information for 10 years. Additional years will be displayed as they become available.
Actuarially Determined Employer and Nonemployer ContributionContributions in Relation to Actuarially Determined Contribution Contribution Deficiency (Excess)Covered-Empolyee PayrollContributions as a Percentage of Covered-Employee Payroll
$ 1,654,844
1,654,844
$ ___
$ 11,596,664
14.27%
$ 1,580,532
1,580,532
$ ___
$ 11,075,907
14.27%
$ 1,406,706
1,406,706
$ ___
$ 10,697,384
13.15%
$ 1,279,963
1,279,963
$ ___
10,349,862
12.28%
$ 1,180,469
1,180,469
$ ___
$ 10,345,916
11.41%
$ 1,082,224
1,082,224
$ ___
$ 10,527,471
10.28%
$ 1,089,912
1,089,912
$ ___
$ 10,602,257
10.28%
$ 1,057,416
1,057,416
$ ___
$ 10,856,427
9.74%
$ 1,026,287
1,026,287
$ ___
$ 11,059,127
9.28%
$ 986,759
986,759
$ ___
$ 10,633,179
9.28%
2017 2016 2015 2014 2013 2012 2011 2010 2009 2008
$ $ $

Financial Section 38
Schedule of Employer and Nonemployer Contributions (dollars in thousands)
NOTES TO REQUIRED SUPPLEMENTARY INFORMATION
Valuation date: Actuarial cost method:
Amortization method:
Remaining amortization period:
Asset valuation method:
Inflation rate:
Salary increases: Investment rate of return:
The total pension liability contained in this schedule was provided by the System’s actuary, Cavanaugh Macdonald Consulting, LLC. The net pension liability is measured as the total pension liability less the amount of the fiduciary net position of the System.
Schedule of Changes in the Employers’ and Nonemployers’ Net Pension Liability
Schedule of Employer and Nonemployer ContributionsThe required employer and nonemployer contributions and percentage of those contributions actually made are presented in the schedule.
Actuarial Methods and Assumptions
Changes of assumptions: On November 18, 2015, the Board adopted recommended changes to the economic and demographic assumptions utilized by the System. Primary among the changes were the updates to rates of mortality, retirement, withdrawal, and salary increases.
Method and assumptions used in calculations of actuarially determined contributions: The actuarially determined contribution rates in the schedule of employer and nonemployer contributions are calculated as of June 30, three years prior to the end of the fiscal year in which contributions are reported (June 30, 2017 employer contributions are based on June 30, 2014 valuation).
Required Supplementary Information for the System as the Plan The following actuarial methods and assumptions
were used to determine the most recent contribution rate reported in that schedule:
June 30, 2014
Entry age
Level percent of payroll, closed 29 Years Five-year smoothed market
3.00%
3.75 to 7.00%, including inflation
7.50%, net of pension plan investment expense, including inflation
June 30, 2017 (Unaudited)

Financial Section39
NOTES TO REQUIRED SUPPLEMENTARY INFORMATION
Required Supplementary Information for the System as a Participating Employer in ERS
Schedule of the System’s Proportionate Share of the Net Pension Liability to ERS
This schedule presents historical trend information about the System’s proportionate share of the net pension liability for its employees who participate in the ERS plan. GASB Statement No. 68 was implemented in 2015. Information related to previous years is not available; therefore, trend information will be accumulated going forward to display a 10-year presentation.
Schedule of the System’s Contributions to ERS
This schedule presents historical trend information about the System’s contributions for its employees who participate in the ERS plan. GASB Statement No. 68 was implemented in 2015. Information related to previous years is not available; therefore, trend information will be accumulated going forward to display a 10-year presentation.
Changes in Benefit Terms and Assumptions
Changes of benefit terms: There were no changes in benefit terms that affect the measurement of the total pension liability since the prior measurement date.
Changes of assumptions: On December 17, 2015, the Board adopted recommended changes to the economic and demographic assumptions utilized by the System. Primary among the changes were the updates to rates of mortality, retirement, disability, withdrawal, and salary increases.
June 30, 2017 (Unaudited)

Financial Section 40
See accompanying independent auditors’ report.
ADDITIONAL INFORMATION
Schedule of Administrative Expenses (dollars in thousands)
Schedule of Investment ExpensesInvestment Advisory and Custodial Fees $ 28,319,467Miscellaneous 13,002,632
Total Investment Expenses $ 41,322,099
For the Year Ended June 30, 2017
Personal Services:
Communications:
Professional Services:
Management Expenses:
Other Services and Charges:

Investmant Section41
INVESTMENT OVERVIEW
There has certainly been a lot of news and noise during the past year. Throughout it all, economic growth as measured by Real GDP improved modestly to a 2.2% pace. Global growth broadened out with Europe and Japan showing additional signs of improving health. A combination of improving economic growth, low inflation and low interest rates combined to boost U.S. equity returns to over 18% for the fiscal year.
We continually emphasize that the pension plan has a long-term investment horizon, and that short-term concerns should not drive the investment decisions. The System continues to invest in a mix of liquid, high quality bonds and stocks. These types of investments allow the System to participate in rising markets while moderating the risks on the downside. A high quality balanced fund has proven to be a successful strategy in a variety of markets over long periods of time.
As in previous years, the bias to quality was a primary goal and was successfully met. “Conservation of Capital” and “Conservatism” remain the guiding principles for investment decisions. The Board of Trustees continues to use a diversified portfolio to accomplish these objectives.
The domestic economy continued to grow during the fiscal year. Employment growth averaged a healthy 185,000 new jobs per month. Industrial production rebounded, inflation was contained and housing prices improved. Although one can find exceptions, foreign economies continued to improve, in large part due to easy central bank policies in Japan and Europe. In contrast, the Federal Reserve has begun to raise interest rates.
Studies undertaken to evaluate the investment returns of pension funds over very long time horizons indicate that the asset allocation decision has the largest impact on the fund’s returns. Although the returns for the various asset categories vary from year to year, over the long term equities typically outperform fixed income and cash by a very wide margin. For that reason, the System has generally maintained a significant equity exposure with the remainder of the fund invested in fixed income securities designed to generate income and preserve capital.
Returns for one-three-five-ten and twenty-year periods are presented in this section. Longer time periods, such as the twenty-year period, allow for more valid evaluation of returns, both in absolute terms and relative to an asset class index, by reducing emphasis on the short-term volatility of markets. The Daily Valuation Method, a time-weighted rate of return, was
used to calculate returns in a manner consistent with the CFA Institute’s objectives as stated in its publication “Global Investment Performance Standards Handbook,” third edition.
The return for the S&P 500 was 17.9%. U.S. small cap and mid cap stocks outperformed large cap stocks last year. The S&P MidCap 400 and the S&P SmallCap 600 indexes had returns of 18.6% and 22.5%, respectively. The Financial and Technology sectors had the highest returns for the 12 month period posting returns of over 28%, while Energy and Telecom Services were flat.
International markets also had strong returns. The MSCI EAFE Index returned 20.3% and the MSCI Emerging Market Index had a return of 23.7%. The dollar was down fractionally for the fiscal year.
Interest rates increased across the board during the first six months of the fiscal year and then flattened out resulting in negative bond returns. The total return on the 10-year Treasury Note was (5.6)% and the 30-year Treasury Bond had a (9.1)% return. The return on short-term Treasury bills was 0.4%.
We look at two fixed income indexes to measure the bond market’s performance. The Barclays Government / Credit Index had a return of (0.41)%. It is a broad index containing corporate and government sponsored bonds as well as Treasuries. The Citigroup Treasury / Sponsored / AAA/AA had a return of (1.9)% and is a broad index containing higher rated corporate bonds as well as Treasuries and Government securities. The spread between corporate bonds and Treasury bonds tightened during the year leading to relatively better performance in corporate bonds.
In summary, the investment status of the System is excellent. The high quality of the System’s investments is in keeping with the continued policy of “Conservatism” and “Conservation of Capital.”
Prepared by the Division of Investment Services

Investment Section 42
RATES OF RETURN
Note: Time-weighted rates of return are calculated using the Daily Valuation Method based on market rates of return.
MSCI
S&P ACWI Equities 1500 ex US
1 Year 19.2% 18.1% 20.5%
3 Year 7.4 9.5 0.8
5 Year 12.8 14.7 7.2
10 Year 5.9 7.3 1.1
20 Year 6.6 7.5 —
Barclays
Fixed Govt/ 1 Month Income Credit T Bills
1 Year (1.0) (0.4) 0.4
3 Year 2.2 2.6 0.2
5 Year 1.8 2.3 0.1
10 Year 4.4 4.6 0.4
20 Year 5.6 5.3 1.9
Total Portfolio CPI
1 Year 12.5% 1.6%
3 Year 5.8 0.9
5 Year 9.4 1.3
10 Year 6.1 1.6
20 Year 6.7 2.1
Equities
Fixed Income
Total Portfolio
BARCLAYS GOV’T / CREDIT 1 MONTH T BILLSFIXED INCOME
CPITOTAL PORTFOLIO
% % %
EQUITIES S&P 1500 MSCI ACWI EX US
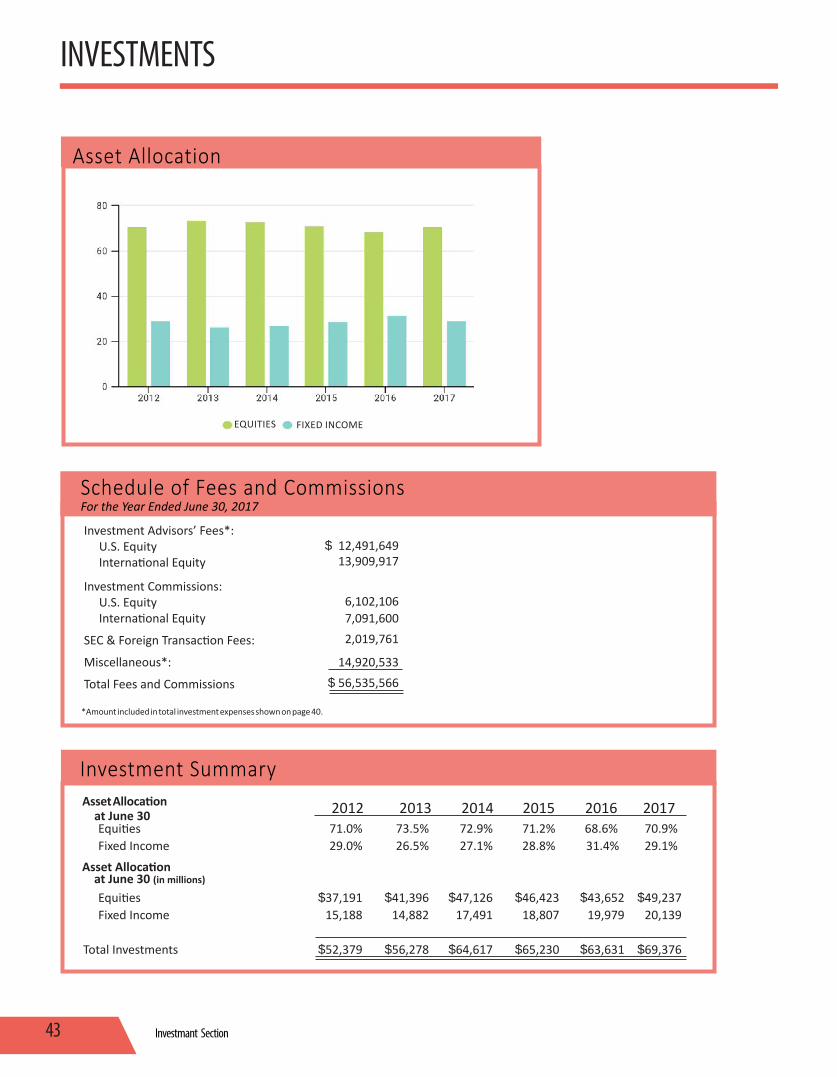
Investmant Section43
INVESTMENTS
Schedule of Fees and Commissions For the Year Ended June 30, 2017
Investment Advisors’ Fees*: U.S. Equity International Equity
Investment Commissions: U.S. Equity International Equity
SEC & Foreign Transaction Fees:
Miscellaneous*:
Total Fees and Commissions
$ 12,491,64913,909,917
6,102,106 7,091,600 2,019,761
14,920,533 $ 56,535,566
*Amount included in total investment expenses shown on page 40.
Asset Allocation
Investment Summary
2012 2013 2014 2015 2016 2017 Equities 71.0% 73.5% 72.9% 71.2% 68.6% 70.9% Fixed Income 29.0% 26.5% 27.1% 28.8% 31.4% 29.1%
Equities $37,191 $41,396 $47,126 $46,423 $43,652 $49,237 Fixed Income 15,188 14,882 17,491 18,807 19,979 20,139 Total Investments $52,379 $56,278 $64,617 $65,230 $63,631 $69,376
Asset Allocation at June 30
Asset Allocation at June 30 (in millions)
EQUITIES FIXED INCOME

Investment Section 44
PORTFOLIO DETAIL STATISTICS
6,193,748860,932
10,516,942582,254
3,670,3203,933,9306,086,8775,051,6092,404,1806,624,0283,686,200
13,684,6103,715,3809,606,4062,035,400
10,571,5626,366,2092,706,8771,515,6367,392,517
Apple IncAlphabet Inc.Microsoft Corp.Amazon.Com Inc.Facebook Inc.Johnson & JohnsonExxon Mobil Corp. JPMorgan Chase & Co. Berkshire Hathway Inc.Wells Fargo & Co. Visa Inc. Bank of America Corp. Procter & Gamble Co.Pfizer Inc.Alibaba Group Holding Ltd.General Electric Co.Verizon Communications Inc. Chevron Corp. UnitedHealth Group Inc.AT&T Inc.
$ 892,023,587791,998,398724,932,812563,621,872554,144,914520,419,600491,393,580461,717,063407,195,967367,037,391345,691,836331,988,639323,795,367322,679,177286,787,860285,537,890284,314,894282,408,477281,029,227278,919,666
$ 8,797,638,217
$ 49,236,292,890
Total of 20 Largest Equity Holdings
Total Equity Holdings
Company Fair Value
Twenty Largest Equity Holdings*Shares
* A complete listing is available upon written request, subject to restrictions of O. C. G. A. Section 47-1-14.
U.S. Treasury NoteU.S. Treasury NoteU.S. Treasury NoteU.S. Treasury NoteU.S. Treasury NoteGeneral Electric CompanyU.S. Treasury NoteU.S. Treasury BondU.S. Treasury Bond U.S. Treasury Note
11/15/243/31/239/30/174/30/198/15/2110/9/228/15/24
11/15/282/15/391/31/19
2.25 1.5 1.875 1.625 2.125 2.7 2.375 5.25 3.5 1.125
$ 1,297,000,0001,105,000,0001,068,000,000
768,000,000647,000,000609,000,000567,000,000428,000,000482,000,000500,000,000
$ 1,304,146,4701,074,700,9001,070,050,560
771,333,120656,096,820619,432,170575,635,410550,981,520544,568,420498,185,000
$ 7,665,130,390
$ 20,139,422,200
Maturity DateDescription
Ten Largest Fixed-Income Holdings*
Fair ValueInterest Rate % Par Value
Total of 10 Largest Fixed-Income Holdings
Total Fixed-Income Holdings
Actuarial Section45
ACTUARY’S CERTIFICATION LETTER
May 10, 2017
Board of TrusteesTeachers Retirement System of GeorgiaSuite 100, Two Northside 75Atlanta, GA 30318
Members of the Board:
Section 47-3-23 of the law governing the operation of the Teachers Retirement System of Georgia provides that the actuary shall make annual valuations of the contingent assets and liabilities of the Retirement System on the basis of regular interest and the tables last adopted by the Board of Trustees. We have submitted the report giving the results of the actuarial valuation of the System prepared as of June 30, 2016. The report indicates that annual employer contributions at the rate of 20.90% of compensation for the fiscal year ending June 30, 2019 are sufficient to support the benefits of the System. Our firm, as actuary, is responsible for all of the actuarial trend data in the financial section of the annual report and the supporting schedules in the actuarial section of the annual report.
In our opinion, the valuation is complete and accurate, and the methodology and assumptions are reasonable as a basis for the valuation. The valuation takes into account the effect of all amendments to the System enacted through the 2016 Session of the General Assembly. In preparing the valuation, the actuary relied on data provided by the System. While not verifying data at the source, the actuary performed tests for consistency and reasonableness.
The System is funded on an actuarial reserve basis. The actuarial assumptions recommended by the actuary and adopted by the Board are both individually and in the aggregate reasonably related to the experience under the System and to reasonable expectations of anticipated experience under the System. The assumptions and methods used for financial reporting purposes meet the parameters set by Actuarial Standards of Practice (ASOPS). The funding objective of the plan is that contribution rates over time will remain level as a percent of payroll. The valuation method used is the entry age normal cost method. The normal contribution rate to cover current cost has been determined as a level percent of payroll. Gains and losses are reflected in the unfunded accrued liability, which is amortized as a level percent of payroll in accordance with the funding policy adopted by the Board.
The Plan and the employers are required to comply with the financial reporting requirements of GASB Statements No. 67 and 68. The necessary disclosure information is provided in separate supplemental reports.
We have provided the following information and supporting schedules for the Actuarial Section of the Comprehensive Annual Financial Report:
• Summary of Actuarial Assumptions and Methods• Schedule of Active Members • Schedule of Retirees and Beneficiaries Added to and Removed from Rolls• Schedule of Funding Progress• Analysis of Financial Experience

Actuarial Section 46
ACTUARY’S CERTIFICATION LETTER
Edward A. Macdonald, ASA, FCA, MAAA President
Cathy TurcotPrincipal and Managing Director
John J. Garrett, ASA, FCA, MAAAPrincipal and Consulting Actuary
The System is being funded in conformity with the minimum funding standard set forth in Code Section 47-20-10 of the Public
Retirement Systems Standards Law. In our opinion, the System is operating on an actuarially sound basis. Assuming that contributions to the System are made by the employer from year to year in the future at the rates recommended on the basis of the successive actuarial valuations, the continued sufficiency of the retirement fund to provide the benefits called for under the System may be safely anticipated.
Future actuarial results may differ significantly from the current results presented in this report due to such factors as the following: plan experience differing from that anticipated by the economic or demographic assumptions; changes in economic or demographic assumptions; increases or decreases expected as part of the natural operation of the methodology used for these measurements (such as the end of an amortization period or additional cost or contribution requirements based on the plan’s funded status); and changes in plan provisions or applicable law. Since the potential impact of such factors is outside the scope of a normal annual actuarial valuation, an analysis of the range of results is not presented herein.
The actuarial computations presented in this report are for purposes of determining the recommended funding amounts for the System. Use of these computations for purposes other than meeting these requirements may not be appropriate.
This is to certify that the independent consulting actuary is a member of the American Academy of Actuaries and has experience in performing valuations for public retirement systems, that the valuation was prepared in accordance with principles of practice prescribed by the Actuarial Standards Board, and that the actuarial calculations were performed by qualified actuaries in accordance with accepted actuarial procedures, based on the current provisions of the retirement system and on actuarial assumptions that are internally consistent and reasonably based on the actual experience of the System.
Sincerely yours,
continued

Actuarial Section47
SUMMARY OF ACTUARIAL ASSUMPTIONS & METHODS
The laws governing the Teachers Retirement System of Georgia (the System) provide that an actuary perform an annual valuation of the contingent assets and liabilities of the System and perform at least once every five years an actuarial investigation of the mortality, service, and compensation experience of the members and beneficiaries of the System. The latest actuarial valuation of the System, prepared as of June 30, 2016, was made on the basis of the funding policy adopted by the Board on November 20, 2013 and the 5-year experience study adopted by the Board on November 18, 2015. The Board is responsible for maintaining this funding policy. A summary of plan provisions can be found in the Introductory Section beginning on page 11, and a plan description can be found in the Financial Section beginning on page 14.
The more pertinent facts and significant assumptions underlying the computations included in the June 30, 2016 valuation are as follows:
a) Actuarial Method Used
The actuarial cost method used for funding purposes is the Entry Age Normal method, which is the same cost method used for financial reporting purposes. The Entry Age Normal method is the most commonly used funding method among public retirement plans. This cost method allocates the cost of benefits over each member’s expected career as a level percentage of their expected salary and demonstrates the highest degree of stability in the calculation of a plan’s normal cost over time. Gains and losses are reflected in the unfunded accrued liability. Adopted November 20, 2013.
b) Ultimate Investment Return
7.50% compounded annually, which consists of a 4.75% assumed real rate of return and a 2.75% assumed annual rate of inflation. This long-term expected rate of return is used to determine the total pension liability for financial reporting purposes. Adopted November 18, 2015.
c) Salary Increases
Salaries are expected to increase 3.25% to 9.00% annually depending upon the members’ years of creditable service. The salary increase includes a 0.50% assumed real rate of wage inflation and a 2.75% assumed annual rate of inflation. Adopted November 18, 2015.
d) Death, Disability and Withdrawal Rates
Death, disability and withdrawal rates for active employees and service retirement tables are based upon the System’s historical experience. The death-after-retirement rates are based on the RP-2000 White Collar Mortality Table projected to 2025 with projection scale BB (set forward one year for males). The death-after-disability retirement rates are based on the RP-2000 Disabled Mortality Table projected to 2025 with projection scale BB (set forward two years for males and four years for females). Adopted November 18, 2015.
e) Asset Valuation Method
In accordance with the funding policy, the actuarial value of the assets was set equal to the fair value of assets on June 30, 2013. Five-year smoothing of investment gains and losses commenced in the subsequent year. The actuarial value of assets recognizes a portion of the difference between the fair value of the assets and the expected fair value of assets, based on the assumed valuation rate of return. The amount recognized is one-fifth of the difference between fair value and actuarial expected value. Adopted November 20, 2013. The actuarial value of assets is limited to a range between 75% and 125% of fair value. Adopted July 27, 2011.
f) Service Retirement Benefit
The service benefit (pension) paid to members is an annuity that is owed to them at retirement that will provide a total annual pension equal to 2% of the member’s average compensation over the two consecutive years of membership service producing the highest such average, multiplied by the number of years of creditable service up to 40 years. It is also assumed that certain cost-of-living adjustments will be made in future years.
g) Actuarially Determined Unfunded Accrued Liability
The present value of the unfunded accrued liability, based on unaudited data provided the actuary by the System, was approximately $23.6 billion at June 30, 2016.

Actuarial Section 48
SUMMARY OF ACTUARIAL ASSUMPTIONS & METHODS
h) Valuation Interest Rate Smoothing
The valuation liabilities are calculated using a smoothed interest rate method. The interest rate assumed during the look-forward period (currently 23 years from the valuation date) is the investment rate of return expected to be earned during the look-forward period based on the actual rate of return earned during the look-back period (currently 7 years) such that the average assumed rate of return over the combined 30-year period is equivalent to the assumed ultimate investment rate of return (currently 7.50%). The interest rate after the 23-year look-forward period is the ultimate investment rate of return of 7.50%. Adopted November 20, 2013. The smoothed interest rate used during the 23-year look-forward period is subject to a corridor around the annual expected rate of return to limit the extent that the calculated smoothed rate can vary from the long-term investment rate of return. Adopted November 20, 2013.
(1) Member 6.00%
(2) Employer:
Normal 7.77%
Unfunded Accrued Liability 13.13%
Total 20.90%
i) Required Contributions (% of compensation)
Contributions required by the annual actuarial valuation as of June 30, 2016, to be made for the year ended June 30, 2019:
continued

Actuarial Section49
SUMMARY OF ACTUARIAL ASSUMPTIONS & METHODS
Service Retirement Adopted November 18, 2015
< 30 years > 30 years < 30 years > 30 years Age of service of service of service of service
Male Female
50 3.50% 60.00% 3.00% 55.00% 55 5.00 40.00 5.50 37.00 60 20.00 36.00 25.00 43.00 61 18.00 32.00 25.00 43.00 62 26.00 36.00 25.00 43.00 63 22.00 33.00 25.00 43.00 64 22.00 32.00 25.00 43.00 65 30.00 30.00 31.00 31.00 66 32.00 32.00 33.00 33.00 67 30.00 30.00 30.00 30.00 68 30.00 30.00 30.00 30.00 69 28.00 28.00 30.00 30.00 70 30.00 30.00 30.00 30.00
– –
Separation Before Service Retirement Adopted November 18, 2015
0-4 Yrs 5-9 Yrs 10+ YrsMale
20 0.0320% 0.0135% 25.00% — % — % 25 0.0349 0.0135 17.00 12.00 — 30 0.0412 0.0210 13.50 7.00 8.00 35 0.0717 0.0330 13.50 6.00 3.00 40 0.1001 0.0550 13.00 6.00 2.50 45 0.1399 0.0900 12.00 6.00 2.30 50 0.1983 0.1700 11.00 5.50 2.50 55 0.2810 0.3000 11.00 5.50 3.00 60 0.4092 — 12.00 5.50 — 64 0.5330 — 13.00 6.50 —
Female 20 0.0177% 0.0100% 28.00% — % — % 25 0.0192 0.0130 13.50 16.00 — 30 0.0245 0.0140 13.50 8.00 6.00 35 0.0441 0.0190 13.00 7.00 3.50 40 0.0655 0.0390 11.00 6.50 3.00 45 0.1043 0.0650 10.50 6.00 2.30 50 0.1555 0.1400 10.00 5.00 2.40 55 0.2228 0.3400 10.00 5.00 2.75 60 0.3058 — 10.50 5.50 — 64 0.4015 — 13.00 6.50 —
Annual Rate of
Withdrawal Years of Service Age Death Disability
continued

Actuarial Section 50
ACTUARIAL VALUATION DATA
Active Members
Number of Annual Fiscal Participating Payroll(2) Average % Year(1) Employers Members (000’s) Pay Increase
2007 385 215,566 $ 9,492,003 $ 44,033 3.5%
2008 389 224,993 10,197,584 45,324 2.9
2009 392 226,537 10,641,543 46,975 3.6
2010 386 222,020 10,437,703 47,012 0.1
2011 399 216,137 10,099,278 46,726 (0.6)
2012 404 213,648 10,036,023 46,975 0.5
2013 401 209,854 9,924,682 47,293 0.7
2014 405 209,828 9,993,686 47,628 0.7
2015 414 213,990 10,347,332 48,354 1.5
2016 416 218,193 10,783,277 49,421 2.2
Retirees and Beneficiaries Added to Roll Removed from Roll Roll-End of Year
Annual Annual Annual % Increase AverageFiscal Allowances Allowances Allowances in Annual AnnualYear(1) Number (000’s) Number (000’s) Number (000’s) Allowances Allowances2007 5,858 $ 230,924 1,656 $ 39,293 74,421 $ 2,232,102 9.4% $ 29,993
2008 5,817 238,137 1,655 39,808 78,583 2,430,431 8.9 30,928
2009 5,543 245,006 1,768 45,116 82,358 2,630,321 8.2 31,938
2010 6,383 279,009 1,763 46,853 86,978 2,862,477 8.8 32,910
2011 7,136 295,192 1,937 55,062 92,177 3,102,607 8.4 33,659
2012 7,055 298,471 1,915 55,565 97,317 3,345,513 7.8 34,377
2013 7,937 322,853 1,983 59,453 103,271 3,608,913 7.9 34,946
2014 7,078 291,066 2,195 68,324 108,154 3,831,655 6.2 35,428
2015 7,207 306,751 2,237 72,818 113,124 4,065,588 6.1 35,939
2016 7,225 312,063 2,392 80,359 117,957 4,297,292 5.7 36,431
(1) Fiscal year refers to the actuarial valuation performed as of June 30 of that year and determines the funding necessary for the fiscal year beginning two years after the valuation date. An actuarial valuation for the fiscal year ended June 30, 2017 is currently in process and was not available for this analysis.
(2) The annual payroll shown in the schedule of active member valuation data is the annual compensation of the active members at the date of the valuation. The covered payroll reported in the financial section represents the payroll during the fiscal year upon which employer contributions were made.
continued
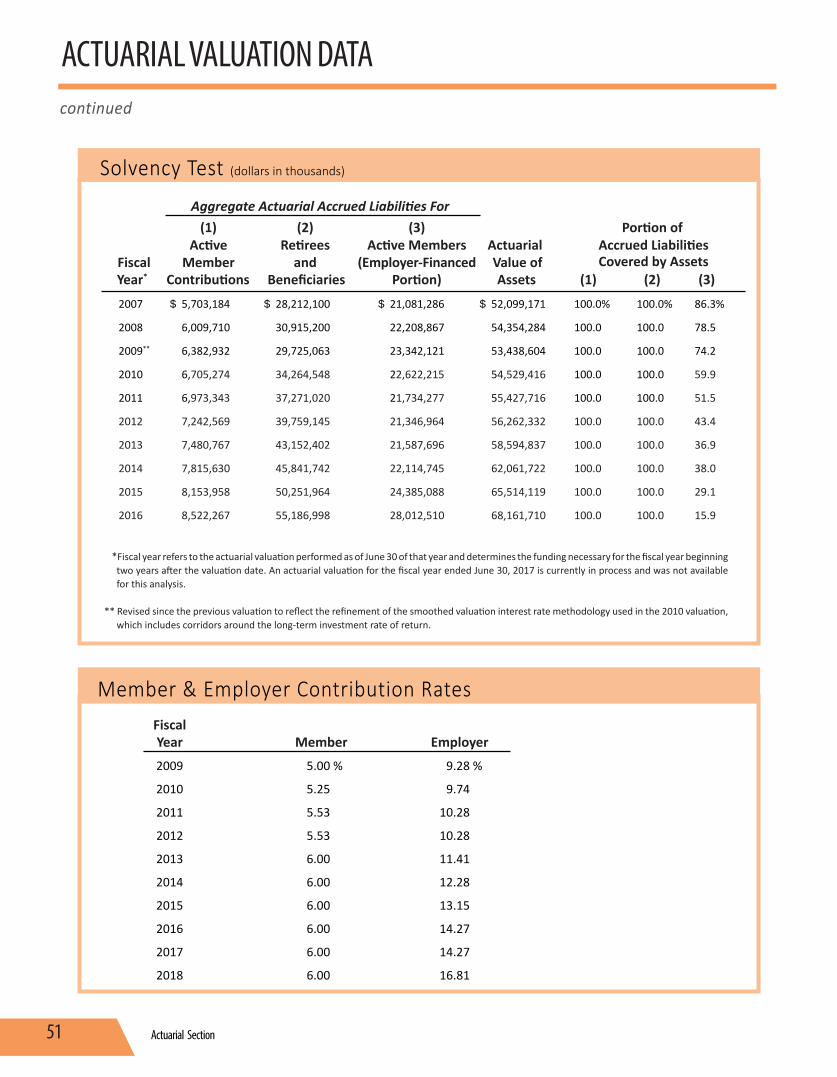
Actuarial Section51
ACTUARIAL VALUATION DATA
Solvency Test (dollars in thousands)
Aggregate Actuarial Accrued Liabilities For (1) (2) (3) Portion of Active Retirees Active Members Actuarial Accrued Liabilities Fiscal Member and (Employer-Financed Value of Covered by Assets Year* Contributions Beneficiaries Portion) Assets (1) (2) (3)
2007 $ 5,703,184 $ 28,212,100 $ 21,081,286 $ 52,099,171 100.0% 100.0% 86.3%
2008 6,009,710 30,915,200 22,208,867 54,354,284 100.0 100.0 78.5
2009** 6,382,932 29,725,063 23,342,121 53,438,604 100.0 100.0 74.2
2010 6,705,274 34,264,548 22,622,215 54,529,416 100.0 100.0 59.9
2011 6,973,343 37,271,020 21,734,277 55,427,716 100.0 100.0 51.5
2012 7,242,569 39,759,145 21,346,964 56,262,332 100.0 100.0 43.4
2013 7,480,767 43,152,402 21,587,696 58,594,837 100.0 100.0 36.9
2014 7,815,630 45,841,742 22,114,745 62,061,722 100.0 100.0 38.0
2015 8,153,958 50,251,964 24,385,088 65,514,119 100.0 100.0 29.1
2016 8,522,267 55,186,998 28,012,510 68,161,710 100.0 100.0 15.9
* Fiscal year refers to the actuarial valuation performed as of June 30 of that year and determines the funding necessary for the fiscal year beginning two years after the valuation date. An actuarial valuation for the fiscal year ended June 30, 2017 is currently in process and was not available for this analysis.
** Revised since the previous valuation to reflect the refinement of the smoothed valuation interest rate methodology used in the 2010 valuation, which includes corridors around the long-term investment rate of return.
Member & Employer Contribution Rates Fiscal Year Member Employer
2009 5.00 % 9.28 %
2010 5.25 9.74
2011 5.53 10.28
2012 5.53 10.28
2013 6.00 11.41
2014 6.00 12.28
2015 6.00 13.15
2016 6.00 14.27
2017 6.00 14.27
2018 6.00 16.81
continued

Actuarial Section 52
ACTUARIAL VALUATION DATA
Schedule of Funding Progress (dollars in thousands)
UAAL Actuarial Unfunded (Funding Excess) Actuarial Accrued AAL Annual as a Actuarial Value of Liability (AAL) (UAAL) Funded Covered Percentage of Valuation Plan Assets -Entry Age (Funding Excess) Ratio Payroll Covered Payroll Date (a) (b) (b-a) (a/b) (c) [(b-a)/c] 6/30/07 $ 52,099,171 $ 54,996,570 $ 2,897,399 94.7% $ 9,482,003 30.5% 6/30/08 54,354,284 59,133,777 4,779,493 91.9 10,197,584 46.9 6/30/09* 53,438,604 59,450,116 6,011,512 89.9 10,641,543 56.5 6/30/10 54,529,416 63,592,037 9,062,621 85.7 10,437,703 86.8 6/30/11 55,427,716 65,978,640 10,550,924 84.0 10,099,278 104.5 6/30/12 56,262,332 68,348,678 12,086,346 82.3 10,036,023 120.4 6/30/13 58,594,837 72,220,865 13,626,028 81.1 9,924,682 137.3 6/30/14 62,061,722 75,772,117 13,710,395 81.9 9,993,686 137.2 6/30/15 65,514,119 82,791,010 17,276,891 79.1 10,347,332 167.0 6/30/16 68,161,710 91,721,775 23,560,065 74.3 10,783,277 218.5
*Revised since the previous valuation to reflect the refinement of the “smoothed valuation interest rate” methodology used in the 2010 valuation, which includes
corridors around the long-term investment rates of return.
This data, except for annual covered payroll, was provided by the System’s actuary.
continued

Actuarial Section53
ACTUARIAL VALUATION DATA
(1) Amendments 2007 - Reflects the impact of the first phase of the Plymel lawsuit. 2008 - Reflects the impact of the final Plymel lawsuit. 2011 - Reflects the impact of discontinuing the one-time 3% increase on the first $37,500 of members’ allowances for all
members who retire on or after January 1, 2013.
(2) Assumption Changes 2010 - The assumed rates of withdrawal, disability, retirement, and mortality and the assumed rates of salary increase have been
revised to more closely reflect the actual and anticipated experience of the System.
2015 - The assumed rates of withdrawal, disability, retirement, and mortality and the assumed rates of salary increase have been revised to more closely reflect the actual and anticipated experience of the System. In addition, assumptions related to percent married, unused sick leave, and termination benefits were also revised.
(3) Member Contribution Rate 2007 - Reflects an increase in the member contribution rate from 5.00% to 5.25% effective July 1, 2009. 2008 - Reflects an increase in the member contribution rate from 5.25% to 5.53% effective July 1, 2010. 2010 - Reflects an increase in the member contribution rate from 5.53% to 6.00% effective July 1, 2012.
(4) Method Changes 2009 - Reflects change to a valuation interest rate smoothing methodology and a change to include a corridor around the
long-term investment rate of return. 2013 - Reflects change to asset smoothing methodology where the final actuarial value of assets used for the current valuation
was set to the fair value of assets as of June 30, 2013. Five-year smoothing of investment gains and losses will commence in subsequent years.
Analysis of Financial Experience (dollars in millions)
Analysis of the Change in Unfunded Accrued Liability Increase (Decrease) During the Years Ended June 30,
Item 2016 2015 2014 2013 2012 2011 2010 2009 2008 2007Interest Added to Previous Unfunded Accrued Liability $1,300.9 $1,077.6 $1,084.6 $977.8 $846.2 $733.2 $486.3 $358.5 $217.3 $134.7Accrued Liability Contribution (985.4) (796.1) (662.0) (604.7) (443.5) (396.3) (312.0) (125.0) (118.5) 57.2Experience: Valuation Asset Growth 150.9 (677.3) (836.1) 1,241.1 1,855.1 2,018.7 1,674.9 2,433.5 548.9 (132.3) Pensioners’ Mortality (13.4) 37.7 35.3 52.7 51.6 24.2 89.8 50.1 58.4 25.6 Turnover and Retirements 209.2 335.9 119.6 378.2 319.1 195.3 269.5 307.1 291.4 213.3 New Entrants 153.1 138.9 115.3 96.2 101.2 89.6 123.7 185.1 258.8 212.6 Salary Increases 72.3 (227.6) (624.9) (715.2) (709.9) (1,132.2) (1,040.5) 14.1 162.8 294.5 Method Changes (4) — — — (926.7) — — — (2,062.3) — Interest Smoothing 5,286.1 2,861.2 739.8 915.9 (627.0) 412.8 — — — — Amendments (1) — — — — — (685.5) — — 386.3 252.3 Change in Member Contribution Rate (3) — — — — — — (15.7) (8.4) Assumption Changes (2) — 688.3 — — — — 1,472.4 — — — Miscellaneous 109.5 127.9 112.8 124.4 142.6 228.5 274.2 70.9 92.4 51.2Total Increase $ 6,283.2 $ 3,566.5 $ 84.4 $1,539.7 $ 1,535.4 $ 1,488.3 $ 3,051.1 $ 1,232.0 $ 1,882.1 $ 1,100.7
12.8 —
—
continued

Statistical Section 54
STATISTICAL SECTION OVERVIEW & FINANCIAL TRENDS
The statistical section presents additional information to provide financial statement users with added historical perspective, context, and detail to assist in using the information in the financial statements, notes to financial statements, and required supplementary information to understand and assess the System’s financial condition.
Financial TrendsThe schedules presented on page 54 and page 55 contain trend
Additions by Source (dollars in thousands)
Total Employer and Net Additions to Fiscal Member Nonemployer Investment (Deductions from)
Year Contributions Contributions Income (Loss) Fiduciary Net Position
2008200920102011201220132014201520162017
$ 554,027567,635592,264604,126601,512640,745640,120661,835685,626716,233
$ 986,7591,026,2871,057,4161,089,9121,082,2241,180,4691,270,9631,406,7061,580,5321,654,844
$ (1,775,578) (6,572,435) 4,671,571 9,594,994
1,090,900 6,938,349 9,826,743 2,384,145 810,574 7,971,677
$ (234,792) (4,978,513) 6,321,251 11,289,032
2,774,636 8,759,563 11,737,826 4,452,686 3,076,732 10,342,754
Contributions were made in accordance with actuarially determined contribution requirements.
information to help the reader understand how the System’s financial position has changed over time.
Operating InformationThe schedules presented on pages 56 through 66 contain benefits, service and employer data to help the reader understand how the System’s financial report relates to the services of the System and the activities it performs.
Deductions by Type (dollars in thousands)
2008 2,527,156 40,820 89,348 95,452 1,648 2,059 2,756,483 23,744 54,482 2,834,7092009 2,385,561 37,191 72,028 36,922 1,414 1,371 2,534,487 22,603 49,414 2,606,504 2010 2,639,144 34,530 74,998 49,290 1,122 1,340 2,800,424 20,223 53,638 2,874,285 2011 2,868,815 37,652 80,393 52,122 922 1,599 3,041,503 20,986 67,916 3,130,4052012 3,091,370 42,441 85,830 55,328 754 1,829 3,277,552 21,954 72,157 3,371,663 2013 3,353,295 42,259 91,727 58,234 633 2,001 3,548,149 22,584 81,142 3,651,875 2014 3,569,374 33,148 98,145 61,203 508 2,074 3,764,452 15,025 87,095 3,866,5722015 3,791,526 34,494 103,483 64,911 379 2,086 3,996,879 14,996 80,085 4,091,9602016 4,015,786 33,929 109,669 67,013 312 2,110 4,228,819 15,279 79,334 4,323,4322017 4,241,760 31,839 114,813 70,179 297 2,236 4,461,124 16,773 76,296 4,554,193
Fiscal Year Service
PartialLump-Sum
Option DisabilitySurvivorBenefits
Supplemental Payments (1)
Lump-SumDeath
Settlement
Benefit Payments
Total Benefit
Payments
NetAdministrative
Expenses Refunds
TotalDeductions
From Fiduciary Net Position
(1) Supplemental payments to retirees who belong to a local retirement system.
$ $ $ $ $ $ $ $ $ $

Statistical Section55
FINANCIAL TRENDS
Total Total Additions to Deductions Changes Fiscal (Deductions from) from Fiduciary in Fiduciary Year Fiduciary Net Position Net Position Net Position
2008 $ (234,792) $ 2,834,709 $ (3,069,501)
2009 (4,978,513) 2,606,504 (7,585,017)
2010 6,321,251 2,874,285 3,446,966
2011 11,289,032 3,130,405 8,158,627
2012 2,774,636 3,371,663 (597,027)
2013 8,759,563 3,651,875 5,107,688
2014 11,737,826 3,866,572 7,871,254
2015 4,452,686 4,091,960 360,726
2016 3,076,732 4,323,432 (1,246,700)
2017 10,342,754 4,554,193 5,788,561
Changes in Fiduciary Net Position (dollars in thousands)
continued

Statistical Section 56
OPERATING INFORMATION
Annual Benefit (dollars in millions)
$3,997 $4,229$4,461
$2,757 $2,535$2,800
$3,042$3,278
$3,548
$3,764
117,918
78,633 82,382 87,017 92,180 97,323 101,139108,100 113,066
Number of Retirees
Benefit Payment Statistics
Average Monthly Benefit $2,946 $2,989
$3,032
$2,528$2,620
$2,682$2,750 $2,807
$2,923$2,902
Retirees who belonged to a local retirement system and who received supplemental payments are not included.
122,629
continued

Statistical Section57
OPERATING INFORMATION
Member Withdrawal Statistics
Number of Members8,687
7,383 7,2968,148 6,939 6,944
8,106 8,423 8,3948,011
Annual Withdrawal (dollars in millions)
$79
$55$49
$54
$68$72
$81$87
$80
$10,700 $10,417
$6,689 $7,119$7,719
$8,389 $8,548$9,650
Average Withdrawal$10,015 $9,986
$76
continued

Statistical Section 58
OPERATING INFORMATION
Average Monthly Benefit Payments for New Retirees
Years Credited Service Effective Retirement Dates for Fiscal Years Ended June 30, 10 - 15 16 - 20 21 - 25 26 - 30 Over 30 Total 2008 Average monthly benefit $ 809.08 $ 1,324.02 $ 1,866.99 $ 2,466.86 $ 3,488.62 $ 2,424.71Average final average salary $ 3,404.28 $ 3,734.90 $ 4,283.55 $ 4,797.61 $ 5,676.32 $ 4,755.66Number of retirees 1,010 726 777 686 2,665 5,864
2009Average monthly benefit $ 812.18 $ 1,293.52 $ 1,892.41 $ 2,564.06 $ 3,603.15 $ 2,456.32Average final average salary $ 3,430.35 $ 3,676.14 $ 4,302.88 $ 4,938.17 $ 5,785.56 $ 4,794.47Number of retirees 1,008 701 774 601 2,480 5,564
2010Average monthly benefit $ 859.93 $ 1,433.00 $ 1,931.22 $ 2,624.98 $ 3,655.74 $ 2,479.89Average final average salary $ 3,651.87 $ 4,095.26 $ 4,366.28 $ 5,142.35 $ 5,820.83 $ 4,902.99Number of retirees 1,195 786 1,018 690 2,736 6,425
2011Average monthly benefit $ 879.11 $ 1,483.30 $ 1,963.77 $ 2,719.55 $ 3,735.70 $ 2,456.69Average final average salary $ 3,753.60 $ 4,216.80 $ 4,461.70 $ 5,175.76 $ 5,940.78 $ 4,943.41Number of retirees 1,455 954 1,150 812 2,797 7,168
2012Average monthly benefit $ 900.60 $ 1,417.23 $ 2,008.09 $ 2,723.70 $ 3,764.35 $ 2,425.05 Average final average salary $ 3,813.60 $ 4,070.28 $ 4,564.72 $ 5,250.18 $ 5,995.69 $ 4,948.47Number of retirees 1,532 920 1,125 885 2,589 7,051
2013Average monthly benefit $ 881.25 $ 1,465.23 $ 1,979.00 $ 2,626.66 $ 3,642.94 $ 2,335.21Average final average salary $ 3,720.18 $ 4,200.63 $ 4,506.44 $ 5,060.19 $ 5,811.25 $ 4,821.63Number of retirees 1,721 1,107 1,279 1,060 2,762 7,929
2014Average monthly benefit $ 877.35 $ 1,410.94 $ 1,902.93 $ 2,515.64 $ 3,556.03 $ 2,152.62Average final average salary $ 3,801.40 $ 4,136.09 $ 4,454.29 $ 4,962.86 $ 5,868.78 $ 4,736.63Number of retirees 1,744 1,066 1,169 994 2,099 7,072
2015Average monthly benefit $ 897.66 $ 1,416.36 $ 2,008.34 $ 2,566.87 $ 3,573.41 $ 2,217.71Average final average salary $ 3,818.45 $ 4,161.17 $ 4,635.36 $ 5,007.10 $ 5,900.24 $ 4,812.42Number of retirees 1,659 1,119 1,164 1,035 2,190 7,167
2016 Average monthly benefit $ 883.07 $ 1,447.47 $ 1,979.68 $ 2,582.75 $ 3,496.30 $ 2,207.94Average final average salary $ 3,786.36 $ 4,215.09 $ 4,558.19 $ 5,046.61 $ 5,796.47 $ 4,786.10Number of retirees 1,695 1,094 1,130 1,001 2,297 7,217
2017 Average monthly benefit $ 870.72 $ 1,455.45 $ 1,997.91 $ 2,588.80 $ 3,535.59 $ 2,220.50Average final average salary $ 3,778.31 $ 4,230.72 $ 4,657.44 $ 5,139.34 $ 5,877.02 $ 4,839.84Number of retirees 1,692 1,120 1,089 973 2,300 7,174
continued

Statistical Section59
OPERATING INFORMATION
Retired Members by Type of Benefit
Amount of Type of Retirement (1) Option Selected (2)
Monthly Number of Opt-2 Opt-3 Benefit Retirees A B C D Max Opt-1 Opt-2 Opt-3 Opt-4 Pop-Up Pop-Up
$ 1–250 542 339 48 115 40 184 11 193 69 43 31 11
250–500 4,710 3,913 391 404 2 2,884 159 897 202 106 346 116
500–750 6,665 5,650 610 401 4 4,160 250 1,146 281 76 559 193
750–1000 7,238 6,300 536 400 2 4,397 284 1,243 282 59 723 250
1000–1250 7,290 6,391 524 369 6 4,437 275 1,228 316 39 684 311
1,250–1,500 6,357 5,596 471 289 1 3,819 236 1,002 258 55 698 289
1,500–1,750 5,453 4,819 375 258 1 3,099 212 905 307 45 596 289
1,750–2,000 5,019 4,457 343 218 1 2,876 215 768 269 50 542 299
2,000–2,250 4,870 4,372 317 180 1 2,722 189 761 293 46 529 330
2,250–2,500 4,573 4,156 285 131 1 2,521 197 670 262 46 558 319
2,500–2,750 4,777 4,402 270 105 - 2,645 213 671 292 52 591 313
2,750–3,000 4,902 4,510 295 97 - 2,768 212 638 282 53 628 321
3,000–3,250 5,527 5,180 259 88 - 3,197 261 656 277 88 673 375
3,250–3,500 5,862 5,617 169 76 - 3,527 266 671 285 69 680 364
3,500–3,750 5,985 5,791 135 59 - 3,642 272 643 261 87 705 375
3,750–4,000 6,436 6,310 84 42 - 4,150 353 541 279 86 620 407
4,000–4,250 5,953 5,852 69 32 - 3,855 307 483 284 97 566 361
4,250–4,500 5,204 5,142 35 27 - 3,428 284 441 223 73 439 316
4,500–4,750 4,429 4,368 29 32 - 2,977 258 353 208 64 343 226
4,750–5,000 3,550 3,508 15 27 - 2,383 181 310 173 53 264 186
Over 5,000 17,287 17,126 47 114 - 10,516 979 2,047 1,191 462 1,145 947
TOTALS 122,629 113,799 5,307 3,464 59 74,187 5,614 16,267 6,294 1,749 11,920 6,598
(1) Type of Retirement A - Service B - Disability C - Survivor benefit D - Supplemental payments to retirees who belonged to a local retirement system.(2) Refer to Summary of Plan Provisions, beginning on page 11 for descriptions of Options.
continued
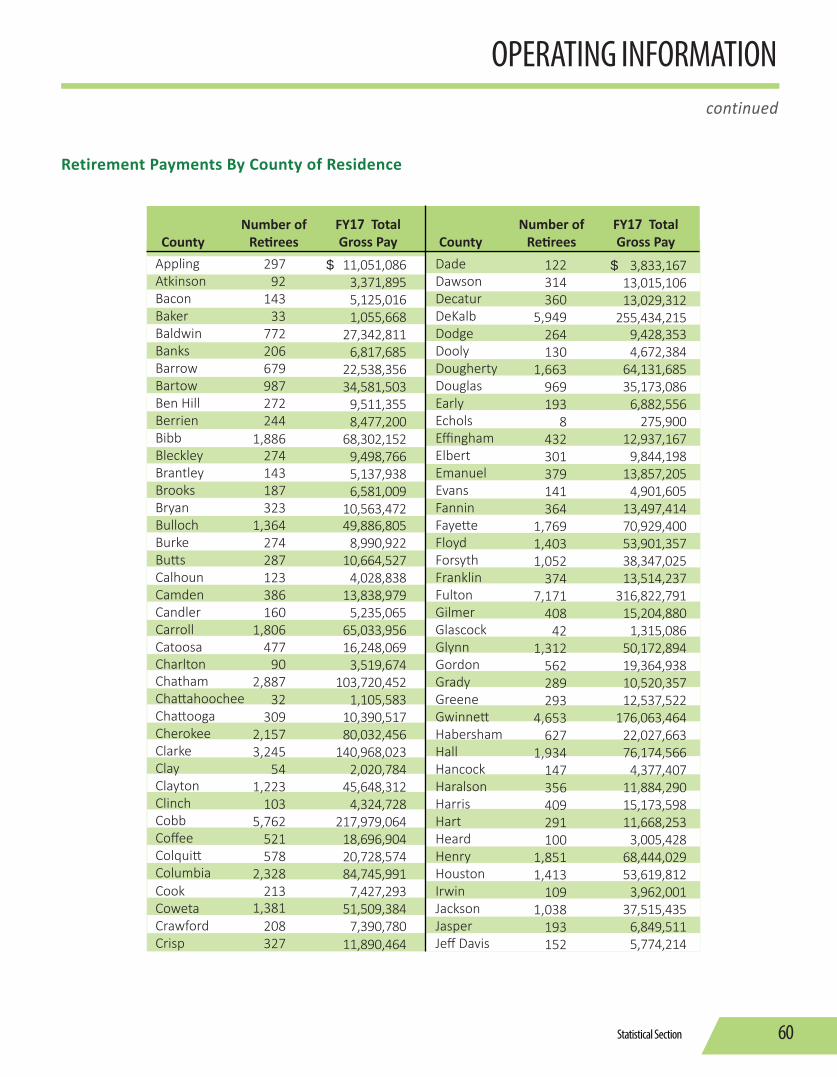
Statistical Section 60
$ 11,051,0863,371,8955,125,0161,055,668
27,342,8116,817,685
22,538,35634,581,503
9,511,3558,477,200
68,302,1529,498,7665,137,9386,581,009
10,563,47249,886,805
8,990,92210,664,527
4,028,83813,838,979
5,235,06565,033,95616,248,069
3,519,674103,720,452
1,105,58310,390,51780,032,456
140,968,0232,020,784
45,648,3124,324,728
217,979,06418,696,90420,728,57484,745,991
7,427,29351,509,384
7,390,78011,890,464
ApplingAtkinsonBaconBakerBaldwinBanksBarrowBartowBen HillBerrienBibbBleckleyBrantleyBrooksBryanBullochBurkeButtsCalhounCamdenCandlerCarrollCatoosaCharltonChathamChattahoocheeChattoogaCherokeeClarkeClayClaytonClinchCobbCoffeeColquittColumbiaCookCowetaCrawfordCrisp
29792
14333
772206679987272244
1,886274143187323
1,364274287123386160
1,806477
902,887
32309
2,1573,245
541,223
1035,762
521578
2,328213
1,381208327
CountyNumber of
Retirees
FY17 Total Gross Pay
DadeDawsonDecaturDeKalbDodgeDoolyDoughertyDouglasEarlyEcholsEffinghamElbertEmanuelEvansFanninFayetteFloydForsythFranklinFultonGilmerGlascockGlynnGordonGradyGreeneGwinnettHabershamHallHancockHaralsonHarrisHartHeardHenryHoustonIrwinJacksonJasperJeff Davis
122314360
5,949264130
1,663969193
8432301379141364
1,7691,4031,052
3747,171
40842
1,312562289293
4,653627
1,934147356409291100
1,8511,413
1091,038
193152
$ 3,833,16713,015,10613,029,312
255,434,2159,428,3534,672,384
64,131,68535,173,086
6,882,556275,900
12,937,1679,844,198
13,857,2054,901,605
13,497,41470,929,40053,901,35738,347,02513,514,237
316,822,79115,204,880
1,315,08650,172,89419,364,93810,520,35712,537,522
176,063,46422,027,66376,174,566
4,377,40711,884,29015,173,59811,668,253
3,005,42868,444,02953,619,812
3,962,00137,515,435
6,849,5115,774,214
CountyNumber of
Retirees
FY17 Total Gross Pay
continued
OPERATING INFORMATION
Retirement Payments By County of Residence
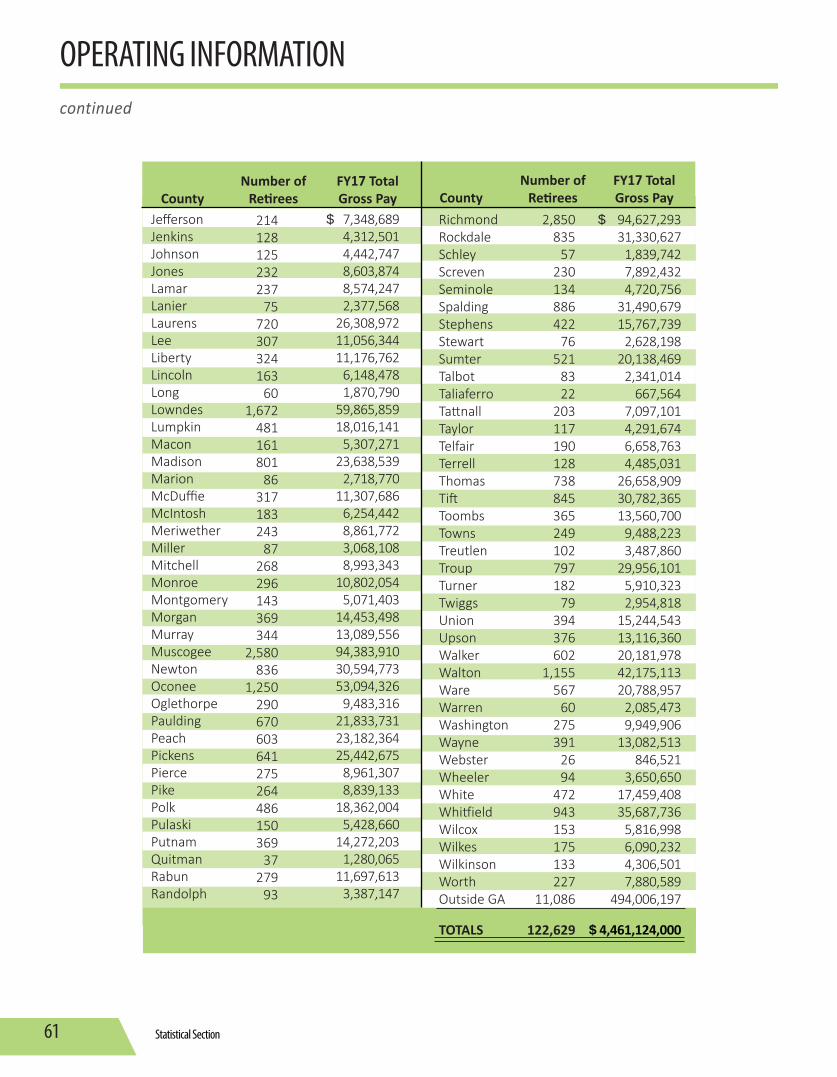
Statistical Section61
CountyNumber of
Retirees
FY17 Total Gross Pay County
Number ofRetirees
FY17 Total Gross Pay
JeffersonJenkinsJohnsonJonesLamarLanierLaurensLeeLibertyLincolnLongLowndesLumpkinMaconMadisonMarionMcDuffieMcIntoshMeriwetherMillerMitchellMonroeMontgomeryMorganMurrayMuscogeeNewtonOconeeOglethorpePauldingPeachPickensPiercePikePolkPulaskiPutnamQuitmanRabunRandolph
214128125232237
75720307324163
601,672
481161801
86317183243
87268296143369344
2,580836
1,250290670603641275264486150369
37279
93
$ 7,348,6894,312,5014,442,7478,603,8748,574,2472,377,568
26,308,97211,056,34411,176,762
6,148,4781,870,790
59,865,85918,016,141
5,307,27123,638,539
2,718,77011,307,686
6,254,4428,861,7723,068,1088,993,343
10,802,0545,071,403
14,453,49813,089,55694,383,91030,594,77353,094,326
9,483,31621,833,73123,182,36425,442,675
8,961,3078,839,133
18,362,0045,428,660
14,272,2031,280,065
11,697,6133,387,147
RichmondRockdaleSchleyScrevenSeminoleSpaldingStephensStewartSumterTalbotTaliaferroTattnallTaylorTelfairTerrellThomasTiftToombsTownsTreutlenTroupTurnerTwiggsUnionUpsonWalkerWaltonWareWarrenWashingtonWayneWebsterWheelerWhiteWhitfieldWilcoxWilkesWilkinsonWorthOutside GA
TOTALS
2,850835
57230134886422
76521
8322
203117190128738845365249102797182
79394376602
1,155567
60275391
2694
472943153175133227
11,086
122,629
$ 94,627,29331,330,627
1,839,7427,892,4324,720,756
31,490,67915,767,739
2,628,19820,138,469
2,341,014667,564
7,097,1014,291,6746,658,7634,485,031
26,658,90930,782,36513,560,700
9,488,2233,487,860
29,956,1015,910,3232,954,818
15,244,54313,116,36020,181,97842,175,11320,788,957
2,085,4739,949,906
13,082,513846,521
3,650,65017,459,40835,687,736
5,816,9986,090,2324,306,5017,880,589
494,006,197
$ 4,461,124,000
continued
OPERATING INFORMATION

Statistical Section 62
Principal Participating Employers
2017 2008 Covered Percentage of Covered Percentage ofEmployers Employees Rank Total System Employees Rank Total System
State of Georgia 37,961 1 17.03 % 31,777 1 14.12 %Gwinnett County Schools 16,978 2 7.62 % 16,448 2 7.31 %Cobb County Schools 11,466 3 5.14 % 12,314 3 5.47 %DeKalb County Schools 11,048 4 4.96 % 11,774 4 5.23 %Fulton County Schools 10,043 5 4.51 % 9,912 5 4.40 %Atlanta Public Schools 5,339 6 2.40 % 5,563 7 2.47 %Clayton County Schools 5,083 7 2.28 % 5,804 6 2.58 %Chatham County Schools 4,525 8 2.03 % 4,272 8 1.90 %Henry County Schools 4,231 9 1.90 % 3,915 10 1.74 %Forsyth County Schools 3,955 10 1.77 % — — —Muscogee County School District — — — 3,974 9 1.77 %
Top 10 110,629 49.63 % 105,753 47.00 %
Total 222,918 100.0 % 225,023 100.00 %
Note: GASB Statement No. 67 was implemented during the fiscal year ended June 30, 2014 and required legally separate employers within the same financial reporting entity to be treated as a single employer for reporting purposes. Therefore, information presented for fiscal years prior to implementation is not comparable with information presented for fiscal years after implementation.
continued
OPERATING INFORMATION

Statistical Section63
OPERATING INFORMATION
Reporting EntitiesUniversities and Colleges
Abraham Baldwin Agricultural CollegeAlbany State UniversityArmstrong Atlantic State UniversityAtlanta Metropolitan State CollegeAugusta UniversityBainbridge CollegeClayton College & State UniversityCollege of Coastal GeorgiaColumbus State UniversityCooperative Extension ServiceDalton State CollegeDarton CollegeEast Georgia State CollegeFort Valley State UniversityGeorgia College & State UniversityGeorgia Gwinnett CollegeGeorgia Highlands CollegeGeorgia Institute of TechnologyGeorgia Southern UniversityGeorgia Southwestern State UniversityGeorgia State UniversityGordon CollegeKennesaw State UniversityMiddle Georgia State CollegeSavannah State UniversitySouth Georgia State CollegeThe University of GeorgiaUniversity of North GeorgiaUniversity of West GeorgiaValdosta State University
Boards of Education
Appling CountyAtkinson CountyAtlanta PublicBacon CountyBaker CountyBaldwin CountyBanks CountyBarrow CountyBartow CountyBen Hill CountyBerrien CountyBibb CountyBleckley County
Brantley CountyBremen CityBrooks CountyBryan CountyBuford CityBulloch CountyBurke CountyButts CountyCalhoun CityCalhoun CountyCamden CountyCandler CountyCarroll CountyCarrollton City SchoolsCartersville CityCatoosa CountyCharlton CountyChatham CountyChattahoochee CountyChattooga CountyCherokee CountyChickamauga CityClarke CountyClay CountyClayton CountyClinch CountyCobb CountyCoffee CountyColquitt CountyColumbia CountyCommerce CityCook CountyCoweta CountyCrawford CountyCrisp CountyDade CountyDalton CityDawson CountyDecatur CityDecatur CountyDeKalb CountyDodge CountyDooly CountyDougherty CountyDouglas CountyDublin CityEarly CountyEchols CountyEffingham County
Elbert CountyEmanuel CountyEvans CountyFannin CountyFayette CountyFloyd CountyForsyth CountyFranklin CountyFulton CountyGainesville CityGilmer CountyGlascock CountyGlynn CountyGordon CountyGrady CountyGreene CountyGriffin-Spalding CountyGwinnett CountyHabersham CountyHall CountyHancock CountyHaralson CountyHarris CountyHart CountyHeard CountyHenry CountyHouston CountyIrwin CountyJackson CountyJasper CountyJeff Davis CountyJefferson CityJefferson CountyJenkins CountyJohnson CountyJones CountyLamar CountyLanier CountyLaurens CountyLee CountyLiberty CountyLincoln CountyLong CountyLowndes CountyLumpkin CountyMacon CountyMadison CountyMarietta CityMarion County
continued

Statistical Section 64
OPERATING INFORMATION
McDuffie CountyMcIntosh County Meriwether CountyMiller CountyMitchell CountyMonroe CountyMontgomery CountyMorgan CountyMurray CountyMuscogee County Newton CountyOconee CountyOglethorpe CountyPaulding CountyPeach CountyPelham CityPickens CountyPierce CountyPike CountyPolk School DistrictPulaski CountyPutnam CountyQuitman CountyRabun CountyRandolph CountyRichmond CountyRockdale CountyRome CitySchley CountyScreven CountySeminole CountySocial Circle CityStephens CountyStewart CountySumter CountyTalbot CountyTaliaferro CountyTattnall CountyTaylor CountyTelfair CountyTerrell CountyThomas CountyThomaston-Upson County Thomasville CityTift CountyToombs CountyTowns CountyTreutlen County
Trion CityTroup CountyTurner CountyTwiggs CountyUnion CountyValdosta CityVidalia CityWalker CountyWalton CountyWare CountyWarren CountyWashington CountyWayne CountyWebster CountyWheeler CountyWhite CountyWhitfield CountyWilcox CountyWilkes CountyWilkinson CountyWorth County
Public Libraries
Athens Regional LibraryAugusta Richmond County LibraryBarnesville-Lamar County LibraryBartow County LibraryBartram Trail Regional LibraryBrooks County LibraryCamden County LibraryCatoosa County LibraryChattooga County Public Library Cherokee Regional LibraryChestatee Regional LibraryClayton County Regional LibraryCoastal Plains Regional LibraryCobb County Public LibraryConyers-Rockdale Library SystemCoweta Public LibraryDeKalb County Public LibraryDeSoto Trail Regional LibraryDougherty County Public LibraryElbert County LibraryFitzgerald-Ben Hill County LibraryFlint River Regional LibraryForsyth County Public LibraryGwinnett County Public LibraryHall County Library
Hart County LibraryHenry County LibraryHouston County Public LibraryJefferson County Library SystemKinchafoonee Regional LibraryLake Blackshear Regional Library Lee County LibraryLincoln County LibraryLive Oak Public LibrariesMary Vinson Memorial LibraryMiddle Georgia Regional LibraryMoultrie-Colquitt County LibraryMountain Regional LibraryNortheast Georgia Regional LibraryNewton County LibraryNortheast Georgia Regional LibraryNorthwest Georgia Regional LibraryOcmulgee Regional LibraryOconee Regional LibraryOhoopee Regional Library Okefenokee Regional Library Peach Public LibraryPiedmont Regional LibraryPine Mountain Regional LibraryRoddenbery Memorial LibrarySara Hightower Regional LibrarySatilla Regional LibraryScreven-Jenkins Regional LibrarySequoyah Regional LibrarySouth Georgia Regional LibrarySouthwest Georgia Regional LibraryStatesboro Regional LibraryThomas County Public LibraryThree Rivers Regional LibraryTroup-Harris-Coweta Regional LibraryUncle Remus Regional LibraryWarren County Public LibraryWest Georgia Regional LibraryWorth County Library System
Technical Colleges
Albany Technical InstituteAthens Technical CollegeAtlanta Technical CollegeAugusta Technical InstituteCentral Georgia Technical CollegeChattahoochee Technical CollegeCoastal Pines Technical College
continued

Statistical Section65
OPERATING INFORMATION
Columbus Technical InstituteGeorgia Northwestern Technical CollegeGeorgia Piedmont Technical CollegeGwinnett Technical CollegeLanier Technical CollegeNorth Georgia Technical InstituteOconee Fall Line Technical CollegeOgeechee Technical CollegeSavannah Technical CollegeSouth Georgia Technical CollegeSoutheastern Technical CollegeSouthern Crescent Technical CollegeSouthern Regional Technical CollegeWest Georgia Technical CollegeWiregrass Georgia Technical College
Regional Educational Service Agencies
Central Savannah River Area RESAChattahoochee Flint RESACoastal Plains RESAFirst District RESAGriffin RESAHeart of Georgia RESAMetro RESAMiddle Georgia RESANorth Georgia RESANortheast Georgia RESANorthwest Georgia RESAOconee RESAOkefenokee RESAPioneer RESASouthwest Georgia RESAWest Georgia RESA
Charter Schools
Academy for Classical Education, Inc.Amana AcademyAtlanta Classical AcademyAtlanta Heights Charter SchoolAtlanta Neighborhood Charter School, Inc.Baconton Community Charter SchoolBrighten AcademyBrookhaven Innovation AcademyCentennial AcademyCharles Drew Charter School
Purpose Built Schoolsof AtlantaSavannah Classical AcademyScintilla Charter AcademySouthwest Georgia STEM CharterTapestry Public Charter SchoolThe Globe AcademyThe Kindezi SchoolUtopian Academy for the ArtsWesley International AcademyWestside Atlanta Charter School
State Agencies
Department of Administrative ServicesDepartment of Agriculture Department of Community HealthDepartment of CorrectionsDepartment of Human ServicesDepartment of Natural ResourcesDepartment of Public HealthDepartment of Public SafetyDepartment of Behavioral Health and Development DisabilityGeorgia Agricultural Exposition AuthorityGeorgia Building AuthorityGeorgia Bureau of InvestigationGeorgia Department of AuditsGeorgia Department of Community SupervisionGeorgia Department of DefenseGeorgia Department of Driver ServicesGeorgia Department of Early Care and LearningGeorgia Department of EducationGeorgia Department of Economic DevelopmentGeorgia Department of Juvenile JusticeGeorgia Department of LaborGeorgia Department of LawGeorgia Department of RevenueGeorgia General AssemblyGeorgia Public Defender Standards CouncilGeorgia Public Telecommunications CommissionGeorgia Student Finance CommissionGovernor’s Office of Planning and Budget
Charter Conservatory for Liberal Arts and Technology Chattahoochee Hills Charter School, Inc. Cherokee Charter AcademyCirrus AcademyCoweta Charter AcademyDeKalb Academy of Technology and EnvironmentDeKalb Path AcademyDeKalb Preparatory AcademyDestiny Achievers Academy of ExcellenceDubois Integrity AcademyFoothills Education Charter High SchoolFulton Academy of Science and TechnologyFulton Leadership AcademyFurlow Charter SchoolGeorgia Connections AcademyGeorgia Cyber AcademyGeorgia High School for Accelerated LearningGeorgia Magnet Charter SchoolGeorgia Online Academy, Inc.Georgia School for Innovation and the ClassicsInternational Academy of Smyrna Charter SchoolInternational Charter School of AtlantaInternational Community SchoolIvy Preparatory Academy for GirlsIvy Preparatory AcademyKennesaw Charter Science and Math AcademyKipp Metro Atlanta CollaborativeLatin College PrepLatin Grammar SchoolLeadership Preparatory Academy Charter SchoolLiberty Technical Charter SchoolMain Street AcademyMountain Education Center Inc.Museum School of AvondaleNew Life Academy of Excellence Inc.North Metro Academy of Performing ArtsOdyssey Charter SchoolPataula Charter Academy
continued

Statistical Section 66
OPERATING INFORMATION
Georgia Technology AuthorityProsecuting Attorneys’ Council of GeorgiaSecretary of StateState Accounting OfficeState Road Tollway and AuthorityTechnical College System of Georgia
Other
Baldwin County Board of HealthClarke County Health DepartmentClayton Center Community Service BoardDeKalb County DFACSEffingham County Tax Commissioner OfficeFloyd County DFACSGeorgia Military CollegeGlynn County Health Dept Tift County Board of HealthTwiggs County Board of HealthWare County Health DepartmentWhitfield County Board of Health
continued


A C O M P O N E N T U N I T O F T H E S T A T E O F G E O R G I A
T W O N O R T H S I D E 7 5 , S U I T E 1 0 0A T L A N T A G A 3 0 3 1 8
( 4 0 4 ) 3 5 2 - 6 5 0 0( 8 0 0 ) 3 5 2 - 0 6 5 0
w w w . T R S G A . c o m


![Accrued Interest en[1]](https://static.fdocuments.in/doc/165x107/577d231d1a28ab4e1e99053c/accrued-interest-en1.jpg)