Irish E-Commerce · PDF fileIrish E-Commerce Report April 22 2011 Information on results from...
41
Irish E-Commerce Report April 22 2011 Information on results from the first annual 2011 Irish E- Commerce Survey. Discusses e-commerce, social media, and marketing spend data from Financial Year 2010 as it pertains to Irish businesses with a company e-commerce website. Results and Analysis of the Irish E-Commerce Survey Published by: StudioForty9 2 nd Floor, 34 Grand Parade Cork City, Ireland +353 87 225 1250
Transcript of Irish E-Commerce · PDF fileIrish E-Commerce Report April 22 2011 Information on results from...

Irish E-Commerce Report
April 22
2011 Information on results from the first annual 2011 Irish E-Commerce Survey. Discusses e-commerce, social media, and marketing spend data from Financial Year 2010 as it pertains to Irish businesses with a company e-commerce website.
Results and Analysis of the Irish E-Commerce Survey
Published by: StudioForty9
2nd Floor, 34 Grand Parade Cork City, Ireland +353 87 225 1250
April 13, 2011 Irish E-Commerce Report 2
Executive Summary
Project Overview The 2011 Irish E-Commerce Survey was undertaken by StudioForty9 as part of a standalone project to
gather current and relevant statistics pertaining to the state of e-commerce in Ireland in the Financial
Year of 2010. There is presently a lack of information available on a sector that is becoming increasingly
important not only to the Irish market but to the global economy. The survey explored different
business outcomes related to operating an e-commerce website, including average conversion rate and
basket value. It also delved somewhat into marketing costs and social media usage.
The main goal of the survey was to address the following: (1) As an Irish company considering selling
online to the Irish market, what are the opportunities? What are realistic achievement figures? (2) As an
established Irish e-commerce merchant, what’s the benchmark? How well is the company competing?
Survey Methodology Because of the complete lack of existing statistical data pertaining to specific Irish e-commerce statistics,
primary research was a necessary means of data collection. With a focus on companies competing in the
e-commerce sphere, an online survey created using Qualtrics was chosen as the best means of survey
distribution. This low cost option enabled simple and quick creation of the survey and had the ability to
reach the largest amount of relevant potential participants. It also allowed for the collection and
recording of responses in real time. A database of companies to contact was compiled using Google
searches and web directories.
Results For companies headquartered in Ireland, 17% of the 2010 Financial Year total turnover was derived
through online sales: average total turnover was €432,085.78 and average turnover through e-
commerce sites was €74,445.40.
The average conversion rate input by companies was 3.47% while the one manually calculated by
dividing total orders by total website visits (previously entered) was 1.92%.
Similarly, the average basket value, calculated by dividing total website turnover by total orders, was
also different, albeit reversed, between input values (€85.78) and calculated values (€107.80).
To further understand companies’ perception of e-commerce sales generation, participants were asked
to rank 9 different channels. The top two, direct traffic and search engine traffic, were relatively close in
ranking, email newsletter followed at a distant third. 64% of respondents ranked affiliate last.
AMAS recently conducted a survey asking marketers why social media is used. This survey solicited the
same information in order to understand if those dealing primarily with e-commerce, in small
companies, would feel the same. The ranking followed a similar pattern: building brand awareness
(67%), building relationships (63%), listening and monitoring (37%), commenting (30%), and gathering
customer information (17%).

April 13, 2011 Irish E-Commerce Report 3
Contents Executive Summary ....................................................................................................................................... 2
Project Overview ....................................................................................................................................... 2
Survey Methodology ................................................................................................................................. 2
Results ....................................................................................................................................................... 2
Contents: Tables ........................................................................................................................................... 4
Contents: Figures .......................................................................................................................................... 5
Project Description........................................................................................................................................ 6
Survey Methodology ..................................................................................................................................... 6
Research Limitations ..................................................................................................................................... 7
Results: Individual Questions ........................................................................................................................ 7
Company Background ............................................................................................................................... 7
Participant Experience ............................................................................................................................ 10
E-Commerce Website ............................................................................................................................. 10
E-Commerce Statistics ............................................................................................................................ 11
Source of E-Commerce Revenue ............................................................................................................ 15
Market Size ............................................................................................................................................. 16
Expenditures ........................................................................................................................................... 17
Support Programs ................................................................................................................................... 18
Social Media ............................................................................................................................................ 20
Outsource ................................................................................................................................................ 23
Challenges ............................................................................................................................................... 24
Results: Grouped Questions ....................................................................................................................... 24
Headquarters and Size ............................................................................................................................ 24
% of Revenue from Online ...................................................................................................................... 25
Turnover by Industry ............................................................................................................................... 25
Conversion Rate and Basket Value by Industry ...................................................................................... 26
Future Research .......................................................................................................................................... 26
Appendix A: Questionnaire ......................................................................................................................... 27
Appendix B: Sub-Industry Breakdown ........................................................................................................ 39
Appendix C: Graphs of Conversion Rate and Basket Value by Industry ..................................................... 41

April 13, 2011 Irish E-Commerce Report 4
Contents: Tables Table 1: Industry Participation ...................................................................................................................... 8
Table 2: Specialisation Selections for Apparel and Online Services Industries............................................. 8
Table 3: Total Company Turnover ............................................................................................................... 10
Table 4: Participants' Years of Experience .................................................................................................. 10
Table 5: E-Commerce Website Turnover .................................................................................................... 12
Table 6: Total Website Traffic ..................................................................................................................... 12
Table 7: Total Orders Transacted ................................................................................................................ 12
Table 8: Input & Calculated Conversion Rates ............................................................................................ 13
Table 9: Input & Calculated Basket Values ................................................................................................. 13
Table 10: Web Page Interaction Data ......................................................................................................... 14
Table 11: Data on Type of Conversions Tracked ......................................................................................... 15
Table 12: Revenue from Countries Listed in Top 3 ..................................................................................... 15
Table 13: Percent Revenue from Top Country ........................................................................................... 15
Table 14: Importance of Channels on Sales ................................................................................................ 16
Table 15: Online Marketing Spending ......................................................................................................... 17
Table 16: Offline Marketing Spending for Website .................................................................................... 17
Table 17: Spending on Website Overhead Costs ........................................................................................ 18
Table 18: Percentage Breakdown of Reasons for Social Media Use........................................................... 23
Table 19: Company Headquarters & Size ................................................................................................... 24
Table 20: Percentage of Revenue from Online ........................................................................................... 25
Table 21: Online & Offline Turnover by Industry ........................................................................................ 25
Table 22: Conversion Rate & Basket Value by Industry .............................................................................. 26

April 13, 2011 Irish E-Commerce Report 5
Contents: Figures Figure 1: Percentage Breakdown by Respondents’ Industry Participation .................................................. 8
Figure 2: Respondents' Headquarter Location ............................................................................................. 9
Figure 3: Respondents' Company Size .......................................................................................................... 9
Figure 4: Time Operating an E-Commerce Website ................................................................................... 10
Figure 5: E-Commerce Analytics Software Usage ....................................................................................... 11
Figure 6: E-Commerce Tracking Usage ....................................................................................................... 11
Figure 7: Respondent Selection of Type of Conversion Tracked ................................................................ 14
Figure 8: Use of Affiliate Programs ............................................................................................................. 19
Figure 9: Use of a Social Commerce Store .................................................................................................. 19
Figure 10: Use of Company Blog ................................................................................................................. 19
Figure 11: Amount of Company Newsletter Subscribers ............................................................................ 20
Figure 12: Use of Facebook and Twitter ..................................................................................................... 20
Figure 13: Frequency of Social Media Use .................................................................................................. 21
Figure 14: Reasons Companies use Social Media ....................................................................................... 22
Figure 15: Website Services Outsourced .................................................................................................... 23
Figure 16: Challenges Faced Operating E-Commerce Websites ................................................................. 24
Figure 17: Online & Offline Company Turnover ......................................................................................... 25

April 13, 2011 Irish E-Commerce Report 6
Project Description As a web design company that specialises in e-commerce development, StudioForty9 frequently
encounters clients interested in statistics related to the Irish online market. When clients are considering
launching an e-commerce website, they want to know what to expect in terms of return on investment.
However, currently, numbers relating to an average conversion rate or basket value specific to
industries in the Irish market do not exist. This deficiency creates difficulty when companies wish to
make forecasts and predictions of future online sales.
The purpose of this project is to help Irish companies involved in the e-commerce sector better
benchmark current competitive positions and evaluate future growth opportunities. The end goal is to
further the overall knowledge available on an increasingly important national and global industry sector.
This data will allow companies to better measure the effectiveness of current e-commerce strategies. As
e-commerce success is ever more dependent on integration with social media activity, additional
insights on social media usage by Irish companies were also gathered. Lastly, the survey also looked at
spending in regards to online and offline marketing for the e-commerce site along with website
overhead costs to understand the interaction between marketing expenditures and online turnover.
Survey Methodology Because of the complete lack of existing statistical data pertaining to specific Irish e-commerce statistics,
primary research was a necessary means of data collection. With a focus on companies competing in the
e-commerce sphere, an online survey was chosen as the best means of survey distribution. This low cost
option enabled simple and quick creation of the survey and had the ability to reach the largest amount
of relevant potential participants. It also allowed for the collection and recording of responses in real
time and the ability to export data to Excel for analysis. Qualtrics, a U.S. based company specialising in
market research and enterprise feedback management, was used to create and launch the survey.
Using Google searches and web directories, a list of 1,308 companies was assembled. Emails notifying
companies of the upcoming survey, along with a follow-up email with a direct link to the survey, were
sent to the complete list. Additionally, during the survey development process, a website and Twitter
account were created to inform businesses in the Irish e-commerce sphere of different aspects of the
upcoming survey and develop interest in participation. Upon the launch of the survey, the direct link
was posted on the Irish E-Commerce Survey blog website, LinkedIn group, and Twitter account. The
survey was open for three weeks from March 9 – April 1. Over 113 people clicked to begin the survey;
however, only 64 companies started the survey by answering the first question. A total of 33 companies
provided e-commerce figures, and 29 participants fully completed the survey.
Unfortunately, this small sample size limits the amount of statistical significance that can be placed on
the data gained through the survey. Using a sample size calculator, with a 90% confidence interval
allowing for a 10% margin of error, 68 respondents were needed. To decrease the margin of error to 5%,
the ideal sample size jumps to 268 companies. These numbers were calculated using a population of
21,000 e-commerce companies determined by the following: 153,419 .ie domains registered at the end
of 2010, 66% of which were business, of which 21% had an e-commerce site.

April 13, 2011 Irish E-Commerce Report 7
However, despite the small sample, the information gathered is interesting and among the first of its
kind in the Irish market. It is the hope that companies will begin to see the importance of operating with
this knowledge and take a more active role in future research.
Research Limitations While over 1,000 e-commerce companies were contacted through email, this left a large portion of the
relevant population who were not reached. Additionally, as the companies were selected from Google
searches and web directories, convenience sampling was used. Therefore, the sample was not
representative of the Irish e-commerce market as a whole, particularly in terms of company size and
industry. Small companies were more likely to respond, and there was not an even distribution of
companies across the different industry sectors.
Contact information was at times difficult to locate. For many companies, information about the survey
was sent to the general ‘info’ email address and not directly to the person best suited to address survey
questions. Based off of statistics from our email distributor, over half of the emails were never opened,
and it is assumed that a great number of them were automatically deleted.
Because this project was being conducted independently by a small company, there was no funding
behind the project to develop the necessary amount of interest and authority. Due to the researcher’s
schedule, there were also time constraints to develop the survey as well as gather and analyse the
responses. Lastly, the use of an online survey limits the ability of researchers to monitor participants,
address any confusion, and encourage completion of the survey. A large number of responders who
clicked to open the survey did not answer any questions or only answered the first few before exiting
the survey.
Results: Individual Questions Tables and/or graphs will be provided in conjunction with the verbal description of results for most
questions. A Micro/Ireland heading represents those companies that have less than 10 employees and
are headquartered in Ireland. Ireland refers to all companies headquartered in Ireland – including micro
companies. Total includes all the question respondents.
Company Background Question 1: In which general industry sector does this company compete?
As the first question of the survey, all participants were asked to specify the industry in which their
company competes. There were a total of 64 responses, the maximum amount of responses obtained
throughout the survey. The question style was multiple choice with a list of 13 different broad industry
categories and the option to input text into the answer selection of ‘Other.’ Participants could only
select a single answer choice. An answer selection to this question was required.
April 13, 2011 Irish E-Commerce Report 8
16%
2%
11%
9%
3%9%11%2%
14%
9%
3% 11%
Apparel
Charity/Non-Profit
Electronics
Food & Beverage
Health & Beauty
Home & Garden
Niche Retail
Office Supply
Online Services
Sports & Outdoors
Travel & Tourism
Other
Specialisation Category N % of
Responses* % of
Answers*
Apparel
Women's 3 30.00% 25.00%
Shoes 1 10.00% 8.33%
Jewellery and Accessories 2 20.00% 16.67%
Kid's 3 30.00% 25.00%
Men's 2 20.00% 16.67%
Other 1 10.00% 8.33%
Online Services
Software Products / Licenses 1 11.11% 10.00%
Internet Service Providers 2 22.22% 20.00%
Hosting Services 3 33.33% 30.00%
Other 4 44.44% 40.00%
* total >100% because of multiple answers
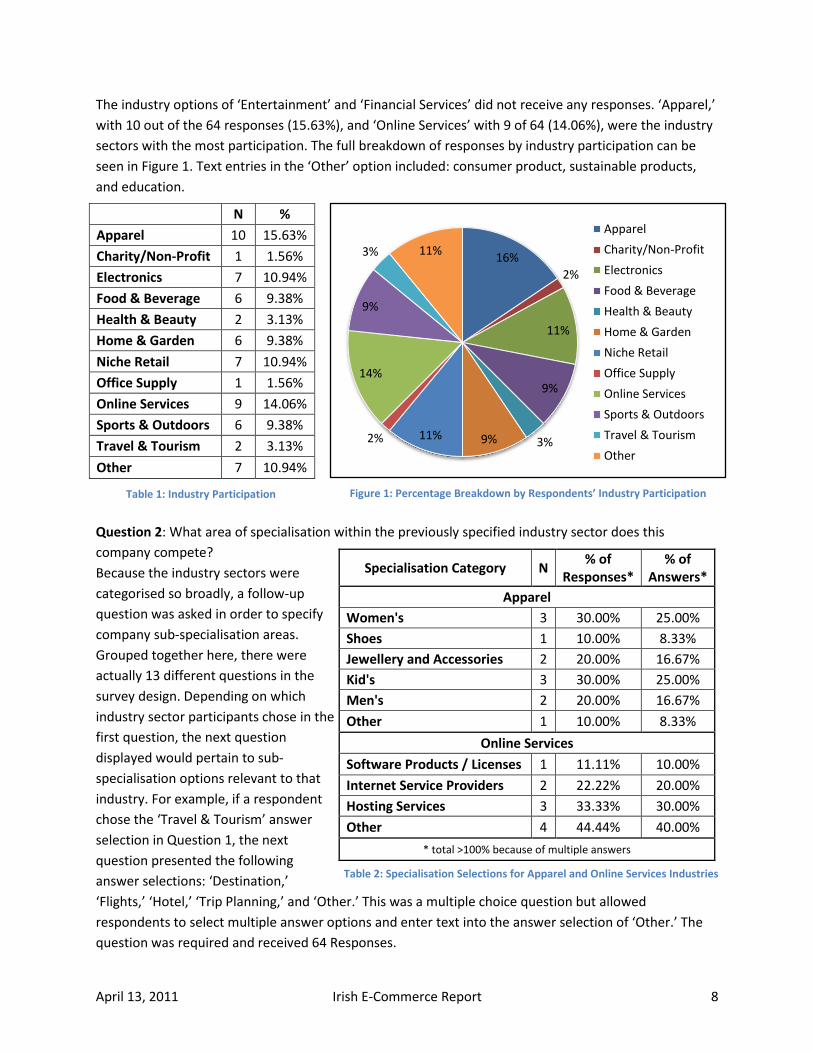
The industry options of ‘Entertainment’ and ‘Financial Services’ did not receive any responses. ‘Apparel,’
with 10 out of the 64 responses (15.63%), and ‘Online Services’ with 9 of 64 (14.06%), were the industry
sectors with the most participation. The full breakdown of responses by industry participation can be
seen in Figure 1. Text entries in the ‘Other’ option included: consumer product, sustainable products,
and education.
Question 2: What area of specialisation within the previously specified industry sector does this
company compete?
Because the industry sectors were
categorised so broadly, a follow-up
question was asked in order to specify
company sub-specialisation areas.
Grouped together here, there were
actually 13 different questions in the
survey design. Depending on which
industry sector participants chose in the
first question, the next question
displayed would pertain to sub-
specialisation options relevant to that
industry. For example, if a respondent
chose the ‘Travel & Tourism’ answer
selection in Question 1, the next
question presented the following
answer selections: ‘Destination,’
‘Flights,’ ‘Hotel,’ ‘Trip Planning,’ and ‘Other.’ This was a multiple choice question but allowed
respondents to select multiple answer options and enter text into the answer selection of ‘Other.’ The
question was required and received 64 Responses.
N %
Apparel 10 15.63%
Charity/Non-Profit 1 1.56%
Electronics 7 10.94%
Food & Beverage 6 9.38%
Health & Beauty 2 3.13%
Home & Garden 6 9.38%
Niche Retail 7 10.94%
Office Supply 1 1.56%
Online Services 9 14.06%
Sports & Outdoors 6 9.38%
Travel & Tourism 2 3.13%
Other 7 10.94%
Figure 1: Percentage Breakdown by Respondents’ Industry Participation Table 1: Industry Participation
Table 2: Specialisation Selections for Apparel and Online Services Industries

April 13, 2011 Irish E-Commerce Report 9
94%
3% 3%
Ireland
United States
United Kingdom
Figure 2: Respondents' Headquarter Location
81%
11%
3%
5%
Micro <10
Small <50
Medium <250
Large >250
While there may have been other answer options for each specialization category, the table only
displays those choices which were actually selected by survey participants. For a full list of categories,
refer to the full questionnaire in Appendix A. Table 2 displays the percentage of responses and answers
for the ‘Apparel’ and ‘Online Services’ industries. For a full breakdown of answer selections for industry
specializations, see Appendix B.
Question 3: Where is this company headquartered?
Participants were then asked to specify where their company is headquartered. This question was
displayed to all participants and, again, had
64 responses. This was a multiple choice
question with the option to select a single
answer from the following: ‘Ireland,’ ‘United
Kingdom,’ ‘United States,’ or ‘Other.’ In the
case of ‘Other,’ a text entry option was
available. The question was optional for
participants.
Seen in Figure 2, 94% (60 of 64) of
respondents were headquartered in Ireland.
The remaining 6% were split between the
United Kingdom and the United States.
Question 4: In terms of number of employees, what is the size of this company?
The question was displayed to all participants
and referred to how large the responding
company was based off the amount of people
employed. The question was presented as
multiple choice with a single answer option.
The answer choices included: ‘Micro <10,’
‘Small <50,’ ‘Medium <250,’ and ‘Large >250.’
The question was optional for answer.
As seen in Figure 3, with 64 responses, the
vast majority at 81% (52 of 64) were micro
companies with less than 10 employees. An
additional 11% were small companies with
fewer than 50 employees.
Question 5: What was the company's total online and offline turnover in Euro for Financial Year 2010?
The last question dealing with company background asked participants for the total business turnover.
The question was displayed to all participants and responses were optional. The format was open-ended
as the researches wanted to obtain a full range of responses to allow for the most valid average
calculation.
Figure 3: Respondents' Company Size
April 13, 2011 Irish E-Commerce Report 10
Micro/Ireland Ireland
Average € 257,705.00 € 432,085.78
Minimum € 2,500.00 € 2,500.00
Maximum € 3,000,000.00 € 5,200,000.00
Respondents 29 32
Company Industry
Average 5.15 7.78
Minimum 0.5 1
Maximum 30 30
Responses 62 61
2.683.19 3.41
0.00
0.50
1.00
1.50
2.00
2.50
3.00
3.50
4.00
Micro/Ireland Ireland Total
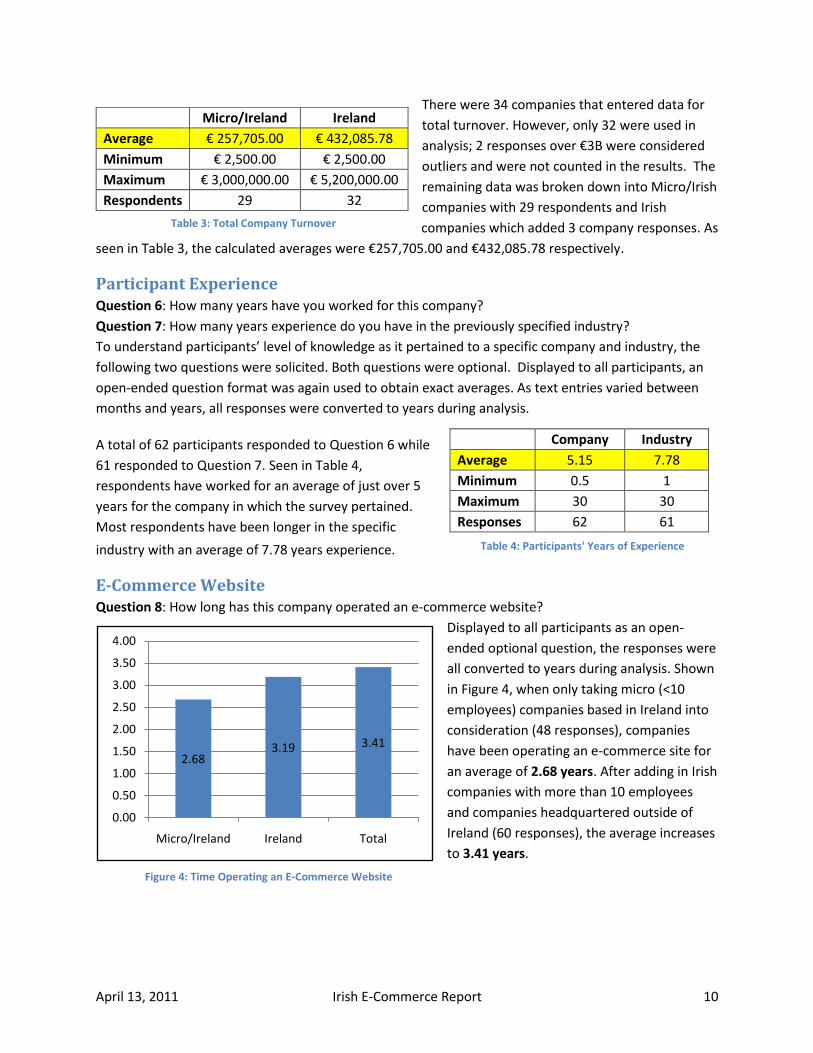
There were 34 companies that entered data for
total turnover. However, only 32 were used in
analysis; 2 responses over €3B were considered
outliers and were not counted in the results. The
remaining data was broken down into Micro/Irish
companies with 29 respondents and Irish
companies which added 3 company responses. As
seen in Table 3, the calculated averages were €257,705.00 and €432,085.78 respectively.
Participant Experience Question 6: How many years have you worked for this company?
Question 7: How many years experience do you have in the previously specified industry?
To understand participants’ level of knowledge as it pertained to a specific company and industry, the
following two questions were solicited. Both questions were optional. Displayed to all participants, an
open-ended question format was again used to obtain exact averages. As text entries varied between
months and years, all responses were converted to years during analysis.
A total of 62 participants responded to Question 6 while
61 responded to Question 7. Seen in Table 4,
respondents have worked for an average of just over 5
years for the company in which the survey pertained.
Most respondents have been longer in the specific
industry with an average of 7.78 years experience.
E-Commerce Website Question 8: How long has this company operated an e-commerce website?
Displayed to all participants as an open-
ended optional question, the responses were
all converted to years during analysis. Shown
in Figure 4, when only taking micro (<10
employees) companies based in Ireland into
consideration (48 responses), companies
have been operating an e-commerce site for
an average of 2.68 years. After adding in Irish
companies with more than 10 employees
and companies headquartered outside of
Ireland (60 responses), the average increases
to 3.41 years.
Figure 4: Time Operating an E-Commerce Website
Table 3: Total Company Turnover
Table 4: Participants' Years of Experience
April 13, 2011 Irish E-Commerce Report 11
84%
2%
3%
5%6%
Google Analytics
Statcounter
Adobe Omniture
I don't know
Other
57%
13%
19%
5%6%
Yes
No
I don't know
Yes, don’t use it
No, plan to get it
Question 9: How many e-commerce websites does this company operate?
Asked in an open-ended format, the question was displayed to all participants as an optional question.
Across all 61 respondents, there was an average of 1.79 websites. A majority of companies at 72.58%
(45 of 61) only operate one e-commerce site. Considering only Micro/Irish companies, 74% (34 of 50)
operate one e-commerce site. One respondent who operated 50 websites was considered an outlier and
not included in analysis.
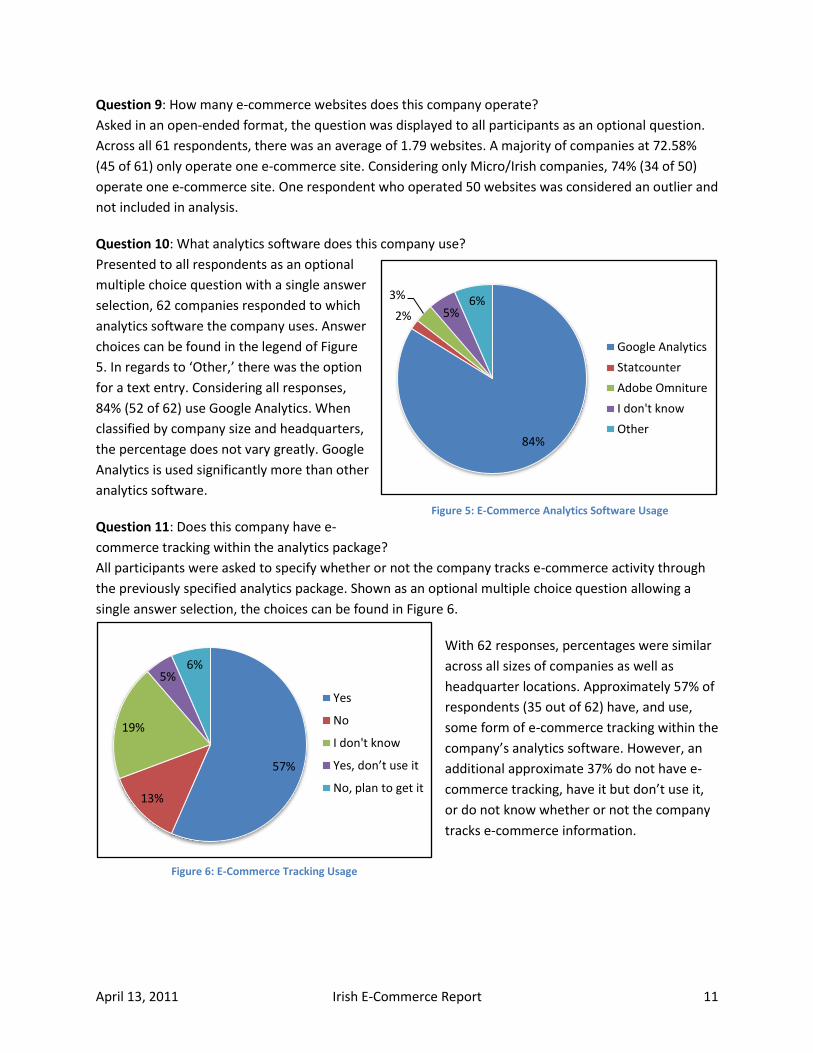
Question 10: What analytics software does this company use?
Presented to all respondents as an optional
multiple choice question with a single answer
selection, 62 companies responded to which
analytics software the company uses. Answer
choices can be found in the legend of Figure
5. In regards to ‘Other,’ there was the option
for a text entry. Considering all responses,
84% (52 of 62) use Google Analytics. When
classified by company size and headquarters,
the percentage does not vary greatly. Google
Analytics is used significantly more than other
analytics software.
Question 11: Does this company have e-
commerce tracking within the analytics package?
All participants were asked to specify whether or not the company tracks e-commerce activity through
the previously specified analytics package. Shown as an optional multiple choice question allowing a
single answer selection, the choices can be found in Figure 6.
With 62 responses, percentages were similar
across all sizes of companies as well as
headquarter locations. Approximately 57% of
respondents (35 out of 62) have, and use,
some form of e-commerce tracking within the
company’s analytics software. However, an
additional approximate 37% do not have e-
commerce tracking, have it but don’t use it,
or do not know whether or not the company
tracks e-commerce information.
Figure 5: E-Commerce Analytics Software Usage
Figure 6: E-Commerce Tracking Usage

April 13, 2011 Irish E-Commerce Report 12
Micro/Ireland Ireland
Average € 74,303.16 € 74,445.40
Minimum € 520.00 € 520.00
Maximum € 380,000.00 € 380,000.00
Respondents 31 33
Micro/Ireland Ireland
Average 128,706 122,543
Minimum 646 646
Maximum 900,000 900,000
Respondents 30 32
Micro/Ireland Ireland
Average 968 914
Minimum 0 0
Maximum 7,500 7,500
Respondents 30 32
E-Commerce Statistics Marking the start of the questions regarding e-commerce site performance, the following three
questions were displayed to all participants as open-ended questions to obtain as accurate an average
as possible. As the statistics on e-commerce were the incentive behind launching the survey, these three
questions required a response from participants. The questions regarding website turnover, visits and
orders also allowed for the manual calculation of average conversion rates and basket value.
Question 12: What was the turnover through the website(s) in Financial Year 2010?
There were no countries headquartered outside of Ireland that responded to this question. The 33 valid
responses were broken down by Micro/Ireland,
making up 94% (31 of 33) of the participants, and
Ireland. Because of the minimal difference in number
of responses between the two groups, the averages
calculated were similar. Micro/Irish companies had
an average e-commerce website turnover in
Financial Year 2010 of €74,303.16. As seen in Table
5, this average increased slightly to €74,445.40 after adding the 2 larger companies. These averages
equate to a turnover of approximately €204/day for both groups. The maximum website turnover
among all respondents was €380,000 from a Micro/Irish company operating an e-commerce site for the
past 4 years.
Question 13: What was the traffic in terms of total visits in Financial Year 2010 to the company’s
website(s)?
Following a breakdown similar to the previous question,
there were 32 responses, 94% (30 of 32) were Micro/Irish
businesses. In Financial Year 2010, these companies had
an average of 128,706 total visits to the e-commerce site.
This means that, on average, there were 353 visits per
day to e-commerce websites owned by Irish companies
with less than 10 employees. Referring to Table 6, adding in the larger companies actually drops the
average to 122,543 total visits or approximately 336 visits per day.
Question 14: How many total orders were transacted through the website(s) in Financial Year 2010?
The last question requiring a response asked companies for the total orders transacted through the
company e-commerce site. For Micro/Irish companies (30 of 32), there was an average of 936 orders
transacted through e-commerce websites in Financial Year
2010. On a daily basis, this would mean 2-3 orders
transacted. Again, seen in Table 7, when including the 2
larger companies, the average decreases slightly to 914
orders transacted through the company website.
Table 5: E-Commerce Website Turnover
Table 6: Total Website Traffic
Table 7: Total Orders Transacted

April 13, 2011 Irish E-Commerce Report 13
CR Calculated CR
Average 3.47% 1.92%
Minimum 0.03% 0.03%
Maximum 15.00% 4.52%
Responses 22 30
BV Calculated BV
Average € 85.78 € 107.80
Minimum € 10.68 € 20.00
Maximum € 360.00 € 533.33
Responses 31 29
There was one company who has operated an e-commerce site over a year and specified that no orders
had been transacted through the site. Upon eliminating that survey response, the average number of
annual orders for Micro/Irish and Ireland companies increase to 1,002 and 945 respectively.
Question 15: What was the average conversion rate for this company’s website(s) in Financial Year
2010?
Because of the large range of potential responses, and the
fact that each percentage point can represent a substantial
revenue difference, this question was also displayed as
open-ended; however, a response was not required by
survey participants. There were 22 companies who input an
average conversion rate for Financial Year 2010. From
these responses, an average conversion rate of 3.47% was calculated.
From the previous questions on website visits and orders, conversion rates were able to be manually
calculated based off of those 32 entered responses. Table 8 displays the difference between the
conversion rates entered by the company and those determined by information from prior questions.
After calculating the rate by dividing the total orders by total website visits, an average conversion rate
of 1.92% was established. Thus, companies are converting website visits into actual orders an average of
1.92% of the time. The high end of the range also changed substantially. The calculated minimum
conversion rate was still .03%, a company in the online services industry. However, the maximum
decreased by over 10% to 4.52%, a company participating in the home & garden industry. Therefore,
from this information, it seems companies overestimate the actual conversion rate percentage.
Question 16: What was the average basket value for this company's website(s) in Financial Year 2010?
This question also did not require a response, as the information could be calculated from previously
entered information pertaining to total website turnover and orders. It was, however, displayed to all
participants as an open-ended question. With 31 responses input by companies, the average was
€85.78, meaning that per website transaction, customers were spending an average of €85.78, across all
industries. The input values ranged from €10.68 to €360.00.
The researcher was able to manually calculate 29
participants’ basket values based off of previously
entered information. Table 9 displays the difference
between the two basket value quantities. After
calculating by dividing total website turnover by total
orders, the average basket value actually increased to
€107.80. Thus, for every order transacted through the website, customers spend on average over €100.
When calculated, the range also changed from €20.00 for a company competing in the niche retail
industry to €533.33 for a food & beverage business.
Table 8: Input & Calculated Conversion Rates
Table 9: Input & Calculated Basket Values

April 13, 2011 Irish E-Commerce Report 14
Bounce Rate # Pages Viewed Average Time
Average 40.13% 5.69 0:04:25
Minimum 14.16% 3.00 0:01:50
Maximum 66.70% 12.92 0:20:00
Responses 25 25 26
303
1
7
1 12
2Sales
Subscriptions
Donations
Registrations
Reservations
Ticket Sales
Voucher Sales
Other
Question 17: What was the total bounce rate for this company's website(s) in Financial Year 2010?
Question 18: What was the average number of pages viewed per visit on the company's website(s)?
Question 19: What was the average time spent on the company's website(s) per visit?
These three questions relate to other e-commerce website statistics pertaining to how much time
people spend on the website and how many pages are viewed each visit. The questions were displayed
to all participants as open-ended with an optional response. Table 10 exhibits the results.
With 25 responses, the average
bounce rate, or percentage of
visitors to the e-commerce site who
are only viewing one webpage
before exiting the site, was
determined to be 40.13%. Again,
based off of 25 responses, customers are viewing an average of 5.69 web pages every time they visit the
company e-commerce site. Lastly, with 26 survey participants responding, an average time spent on the
website was calculated. It seems that per visit, users are spending an average of 4 minutes and 25
seconds on an Irish e-commerce website.
Question 20: What conversions do the website(s) track?
As there are different conversion options – convincing people to purchase, register or subscribe – the
survey aimed to see which types e-commerce companies were tracking through the websites. The
question was optional and displayed to all
participants as a multiple choice question
allowing for the selection of multiple
answers. The answer choices included the
following: ‘Sales,’ ‘Subscriptions,’
‘Donations,’ ‘Registrations,’ ‘Reservations,’
‘Ticket Sales,’ ‘Voucher Sales,’ and ‘Other’
which permitted a text entry.
There were 32 responses determining that
the majority at 93.74% (30 of 32) of Irish e-
commerce websites track ‘Sales.’ Seen in
Figure 7, this option was followed distantly
by ‘Registrations’ with 21.88% (7 of 32) of
respondents. Of the 32, there were 8 respondents (25%) who track more than one type of conversion.
There were also 2 businesses who responded that the company does not track conversions of any sort.
Table 11, below, shows the percentage of respondents who chose each answer option as well as the
percentage of how often each answer choice was selected.
Table 10: Web Page Interaction Data
Figure 7: Respondent Selection of Type of Conversion Tracked

April 13, 2011 Irish E-Commerce Report 15
N % of Respondents * % of Answers*
Sales 30 93.75% 63.83%
Subscriptions 3 9.38% 6.38%
Donations 1 3.13% 2.13%
Registrations 7 21.88% 14.89%
Reservations 1 3.13% 2.13%
Ticket Sales 1 3.13% 2.13%
Voucher Sales 2 6.25% 4.26%
Other 2 6.25% 4.26%
* total >100% because of multiple answers
Ireland 83.33%
USA 13.33%
UK 3.33%
Responses 30
% Responses
Ireland 75.78% 28
UK 14.80% 18
USA 39.19% 8
Source of E-Commerce Revenue Question 21: In which three countries does most of this company's e-commerce business originate?
What percentage of annual revenue is generated by each country?
To further understand the impact of Irish e-commerce, companies were asked to explain where its
major sources of revenue originated. As the majority who answered were Micro/Irish companies, it
follows that most of the revenue generated comes from Ireland. The question was displayed to all
participants as an open-ended form. It first asked for the top three countries and then inserted those
entered responses into the next form asking for revenue generated by each country.
With a total of 30 responses, 83% (25 of 30) of businesses listed Ireland as the number one source of
revenue. Ireland alone generates an average of 84% of those companies’ revenue. An additional 13% (4
of 30) of respondents listed the United States as the number one location source for revenue with the
country generating 71% of those companies’ revenue. Table 13 displays the percentage of participants
who chose Ireland, the United Kingdome, or the United States as the number one geographic source of
company online revenue. Table 12 shows how many companies entered Ireland, the United Kingdom,
and the United States in one of the top three country sources of e-commerce revenue. From each of
those responses, an average percentage of revenue was then calculated. With 28 respondents listing
Ireland as one of the top three countries, 76% of revenue for these companies comes from Ireland.
There were 18 respondents who listed the United Kingdom in the top 3, and these companies had an
average of 14.80% of revenue derived from that location. Other countries listed in the top 3 included
Canada (2), Denmark (1), France (1), Germany (4), Northern Ireland (1), and the Netherlands (1).
Table 11: Data on Type of Conversions Tracked
Table 13: Percent Revenue from Top Country Table 12: Revenue from Countries Listed in Top 3

April 13, 2011 Irish E-Commerce Report 16
From Most Important Impact on Sales to Least Important
Mean
Direct traffic 1.82
Search engine traffic 1.95
Email newsletter 4.68
Referral traffic from other websites 5.00
Facebook 5.09
Paid search engine traffic from Google AdWords 5.55
Other social media (ie. Twitter, YouTube) 6.14
Paid search engine traffic from other search engines 6.41
Affiliate 8.36
Question 29: Rank the following channels in the order in which they generate sales for this company.
As another means of understanding where sales originated for e-commerce companies competing in
Ireland, this question was displayed to all participants as an optional, ranking question. Participants
were asked to click and drag answer choices into the proper order, according to their opinion. The 9
different answer choices for ranking can be seen in Table 14 along with the associated mean.
Respondents were asked to rank
the 9 different channels in order
from the channel which generated
the most sales (1) to the channel
that generated the least (9). An
average for each channel option
was then taken from the rankings
of 22 responses. Coded, the
average closest to 1 is the option
that was considered the most
important, and the average closest
to 9 is the channel with the least
importance. A t-test was
conducted to determine whether or not the means between each of the channels were significantly
different to allow for the establishment of an actual ranking order. With a hypothesis that there was no
difference, a p-value of greater than .05 proved that hypothesis false meaning that there is a statistically
significant difference between the means of each channel. While the top two were relatively close in
ranking, email newsletter followed at a distant third with most others not far behind. Affiliate was
noticeably last with 64% of respondents raking it in the 9th position.
Market Size Question 22: In your opinion, what is the annual value in Euro of the previously specified industry's sub-
specialisation’s online market in Ireland?
Question 23: In your opinion, in terms of annual revenue generated in Euro, how much is the total
online and offline industry sub-specialisation market in Ireland worth?
These questions were asked in hopes of getting an estimated size for the total, as well as online only,
market for specific sub-industries in Ireland. From these numbers, gathered from those participating in
the industry, companies would be able to better benchmark market share and other performance
metrics. However, displayed to all participants as an optional open-ended question, there were only 28
responses. Additionally, 67.86% (19 of 28) responded with ‘Don’t Know.’ Because of the small number of
responses, with minimal values for each individual industry, an average online market size was not able
to be generated for specific sub-industries.
Table 14: Importance of Channels on Sales
April 13, 2011 Irish E-Commerce Report 17
Total Google AdWords Search Engine Optimisation Facebook Advertising
Average € 4,477 € 1,338 € 3,514 € 444
Minimum € 55 € 15 € 500 € 50
Maximum € 17,500 € 3,000 € 15,000 € 1,000
Responses 15 14 7 8
Total Television Radio Newspapers
Average € 3,911 € 8,567 € 500 € 1,872
Minimum € 250 € 300 € 500 € 250
Maximum € 21,400 € 21,400 € 500 € 9,000
Responses 9 3 1 9
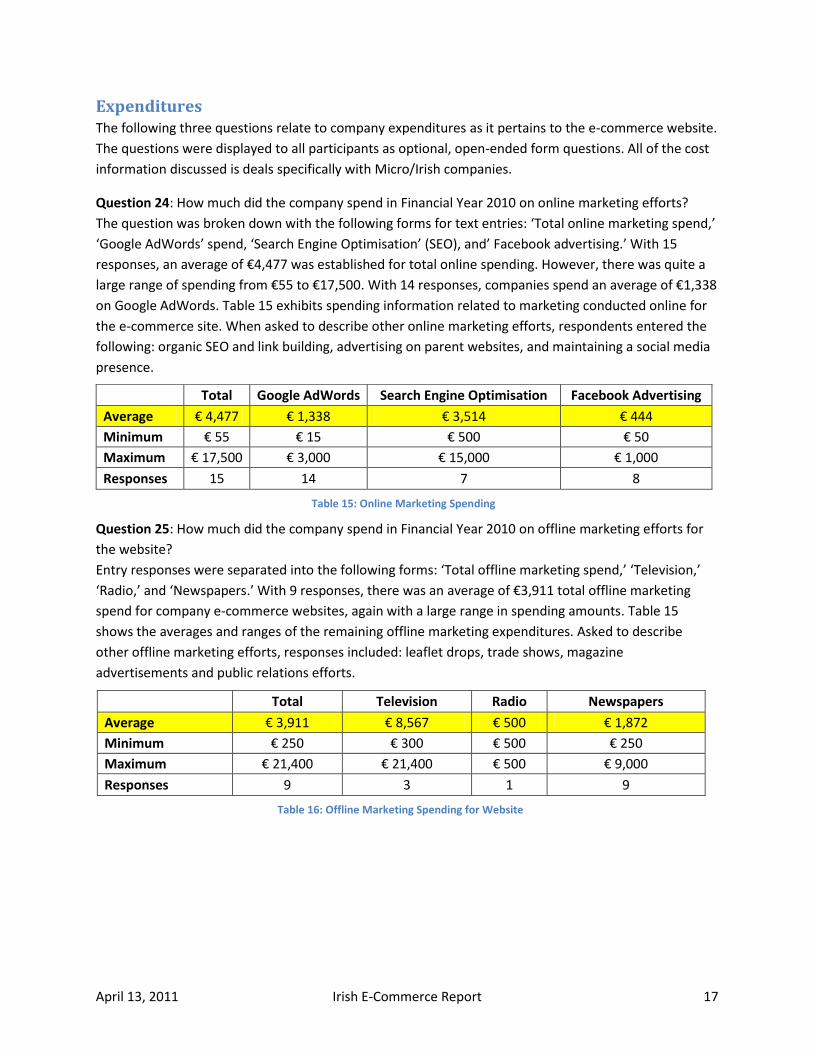
Expenditures The following three questions relate to company expenditures as it pertains to the e-commerce website.
The questions were displayed to all participants as optional, open-ended form questions. All of the cost
information discussed is deals specifically with Micro/Irish companies.
Question 24: How much did the company spend in Financial Year 2010 on online marketing efforts?
The question was broken down with the following forms for text entries: ‘Total online marketing spend,’
‘Google AdWords’ spend, ‘Search Engine Optimisation’ (SEO), and’ Facebook advertising.’ With 15
responses, an average of €4,477 was established for total online spending. However, there was quite a
large range of spending from €55 to €17,500. With 14 responses, companies spend an average of €1,338
on Google AdWords. Table 15 exhibits spending information related to marketing conducted online for
the e-commerce site. When asked to describe other online marketing efforts, respondents entered the
following: organic SEO and link building, advertising on parent websites, and maintaining a social media
presence.
Question 25: How much did the company spend in Financial Year 2010 on offline marketing efforts for
the website?
Entry responses were separated into the following forms: ‘Total offline marketing spend,’ ‘Television,’
‘Radio,’ and ‘Newspapers.’ With 9 responses, there was an average of €3,911 total offline marketing
spend for company e-commerce websites, again with a large range in spending amounts. Table 15
shows the averages and ranges of the remaining offline marketing expenditures. Asked to describe
other offline marketing efforts, responses included: leaflet drops, trade shows, magazine
advertisements and public relations efforts.
Table 15: Online Marketing Spending
Table 16: Offline Marketing Spending for Website

April 13, 2011 Irish E-Commerce Report 18
Total
Web Development
& Design
Website Maintenance
Hosting and Hosting
Related Costs
Transaction Related
Fees
Website Staffing
Costs
Average € 5,751 € 3,398 € 1,673 € 645 € 2,357 € 15,333
Minimum € 40 € 20 € 50 € 40 € 90 € 500
Maximum € 42,000 € 15,000 € 7,000 € 5,000 € 12,000 € 35,000
Responses 22 14 12 25 18 6
Question 26: How much did the company spend in Financial Year 2010 on website overhead costs?
Participants were asked to input spending in regards to the following: ‘Total website overhead costs,’
‘Web development and design,’ ‘Website maintenance,’ ‘Hosting related costs,’ ‘Transaction related
fees,’ and ‘Website staffing costs.’ With 22 responses, companies spend an average of €5,751 on total
website overhead costs, more than either online or offline marketing efforts. With 6 responses,
companies spent an average of €15,333 on website staffing costs. The remaining spending averages, as
well as the ranges of expenditures related to website overhead for e-commerce sites, can be seen in
Table 17. When asked about any other website costs, one respondent replied that the company spends
€20,000 on back end software.
Support Programs The following questions pertain to different potential efforts a company could take to support, promote,
or enhance its e-commerce website and customer experience. All questions in this section were
displayed to all participants but were optional to answer.
Question 27: Does this company use Google AdWords?
Asked as a multiple choice question with a single answer option, participants could choose ‘Yes’ or ‘No.’
There were 31 total responses and 55% (17 of 30) of company respondents use Google AdWords. The
remaining 45% (14 of 30) of respondents do not use Google AdWords to have the company website
appear as a sponsored link in Google search results.
Question 28: What was the Financial Year 2010 conversion rate for Google AdWords?
This open-ended question was displayed only to those survey participants who chose ‘Yes’ as the answer
choice in the previous question on whether or not the company uses AdWords. Although there were
only 9 responses, these produced an average conversion rate of 2.74%. Of those user visits driven to the
site by Google AdWords, only 2.74% were converted into purchases.
Table 17: Spending on Website Overhead Costs

April 13, 2011 Irish E-Commerce Report 19
16%
68%
3% 13%
Yes
No
Don't know what it is
Plan to launch
29%
58%
13%
Yes
No
Plan to launch
6%
80%
7%7%
Yes
No
Don't know what it is
Plan to launch one
Question 29: Does this company have an
affiliate program?
Presented to participants as a multiple choice
question with a single answer option, the
choices included: ‘Yes,’ ‘No,’ ‘Don’t know
what an affiliate program is,’ and ‘No – plan
to launch one in the next 12 months.’ Of the
total 30 responses, only 7% (2 of 30)
companies currently have an affiliate
program. Seen in Figure 8, the majority of
respondents at 80% (24 of 30) currently do
not have an affiliate program and have no
plans to launch one in the near future.
Question 38: Does this company currently
run a social e-commerce store?
Survey participants were shown this question
in a multiple choice format with a single
answer option. Answer options and
percentages of selections can be seen in
Figure 9. With 31 responses, the majority at
68% (21 of 31) do not currently run a social e-
commerce store. However, almost a third of
the respondents at 29% (9 of 31) either
already operate a store (16%) or plan to
launch one in the next year (13%),
demonstrating the growth of this trend.
Question 39: Does this company have a
blog?
Similar to previous questions, this was asked
in multiple choice format in which
participants could select a single answer. As
seen in Figure 10, choices included: ‘Yes,’
‘No,’ ‘Don’t know what a blog is,’ and ‘No –
plan to launch one in the next 12 months.’ Of
the 31 responses, every participant knew
what a blog was; however, a majority 58%
(18 of 31), do not currently have a blog. The
remaining 42% (13 of 31) either currently
operate a blog (29%) or plan to launch one in
the next year (13%).
Figure 8: Use of Affiliate Programs
Figure 9: Use of a Social Commerce Store
Figure 10: Use of Company Blog

April 13, 2011 Irish E-Commerce Report 20
65%6%
16%
13%
FB & Twitter
Twitter Only
FB Only
Neither
22%
28%
6%
22%
11%
11%<100
100-500
501-1000
1001-3000
3001-10000
10000+
Question 40: Does this company have a newsletter it sends to customers?
The last support program examined was the use of a company newsletter. This question only had the
answer choices of ‘Yes’ or ‘No.’ The majority of respondents at 61% (19 of 31) do have a company
newsletter that is sent out to customers.
Question 41: How many subscribers has this newsletter produced?
This question was displayed only to
participating companies who publish a
company newsletter based off the answer to
the previous question. It was multiple choice
and participants could choose a single
answer choice between the following
subscription numbers: ‘<100,’ ‘100-500,’
‘501-1000,’ ‘1001-3000,’ ‘3001-10000,’
‘10000+.’ Figure 11 shows that 56% of
respondents (10 of 18) have less than 1000
subscribers and 22% have between 1000 and
3000 newsletter subscriptions.
Social Media The following group of questions relates to social media participation and usage by the responding
companies. Because the area of social media has become an increasingly important factor in online
strategies for companies, the survey sought to find statistics and information relevant to the e-
commerce sector in Ireland. All questions in this section were optional.
Question 30: Does this company have a
Facebook and /or Twitter account?
The first question posed asked whether or not
companies were using either of the two most
popular platforms. The question was multiple
choice. Participants could choose one option
from the following: ‘Facebook & Twitter,’
‘Facebook only,’ ‘Twitter only,’ and ‘Neither.’
There were 31 company responses to the
question, and a majority of respondents at 65%
(20 of 31) operate both Facebook & Twitter
company accounts. However, seen in Figure 12,
there are still 13% (4 of 31) of responding
companies who have neither a Facebook nor
Twitter account.
Figure 11: Amount of Company Newsletter Subscribers
Figure 12: Use of Facebook and Twitter

April 13, 2011 Irish E-Commerce Report 21
37%
41%
18%
4%
Less than 1 per week
10 times per week
11-50 times per week
50+ times per week
Question 31: How important to your online business is this company's Facebook page?
Displayed only to those participants who selected ‘Facebook & Twitter’ or ‘Facebook Only’ previously,
the question was presented as a 5-point Likert scale. The range was from ‘Not at all important’ to
‘Extremely important’ and was coded from 1 to 5 respectively. From the 24 responses, an average of
3.58 was calculated. A t-test was conducted to compare the calculated average against 3, the neutral
Likert scale position of ‘Neither unimportant nor important.’ The hypothesis performed assumed no
difference, and a p-value of less than .05 supported the tested hypothesis. Therefore, these company
respondents have neutral feelings as to the importance of how Facebook impacts online business.
Question 32: How important to your online business is this company's Twitter account?
A similar question was asked in regards to company Twitter profiles. The question was again displayed
only to those survey participants who had previously selected that the company operates a Twitter
account. It was again presented in a 5-point Likert scale format with the same options. From the 22
responses, an average of 2.73 was obtained. Another t-test was conducted to compare this average
against the neutral average of 3 which was ‘Neither important nor unimportant’ on the Likert scale. The
hypothesis of the test assumed no difference and a p-value greater than .05 meant the hypothesis could
not be confirmed. Therefore, the actual average is statistically significantly less than 3 and falls in the
‘Very unimportant’ area on the scale. Companies do not currently see a significant importance of a
Twitter account on online business.
Question 33: How often does this company use Facebook and/or Twitter?
To see how much time and energy Irish e-commerce companies are placing on these two social media
platforms, a frequency of usage was requested. This question was not displayed to those participants
who selected ‘Neither’ in response to the
question of whether or not the company had a
Facebook and/or Twitter account. Presented
as a multiple choice question, participants
could choose one of the options displayed in
the legend of Figure 13. According to the 27
responses obtained, Irish e-commerce
companies using Facebook and Twitter do so
with minimal frequency. There were 37% (10
of 27) of companies who use Facebook and/or
Twitter less than once a week, and 41% (11 of
27) of respondents use Facebook and/or
Twitter approximately 10 times per week.
Question 34: How many Twitter followers does this company have?
Posed as an open-ended question, this was only presented to participants who had previously selected
that the company had a Twitter account. Based off of 20 responses, Micro/Irish companies with a
Twitter account have an average of 257 followers.
Figure 13: Frequency of Social Media Use

April 13, 2011 Irish E-Commerce Report 22
20 19
119
50
5
10
15
20
25
Building brand awareness
Building relationships
Listening and monitoring
Commenting Gathering customer
information
Question 35: How many Facebook fans does this company have?
Only shown to those participants who previously selected the company operated a Facebook page, the
question allowed for an open-ended text entry. Derived from 24 responses, Irish companies with less
than 10 employees have an average of 509 Facebook fans.
Question 36: Does this company advertise through Facebook?
Again, only displayed to participants who had selected that the company had a Facebook page, the
question allowed for a ‘Yes’ or ‘No’ response. According to 25 responses, 40% (10 of 25) of companies
advertise through Facebook. The remaining 60% (15 of 25) of survey participants, who have a Facebook
account, do not advertise through the platform.
Question 37: What was the company’s Facebook click-through-rate in Financial Year 2010?
Displayed only to those participants who selected previously that the company advertises through
Facebook, there were only 5 responses to the open-ended question. Because the response entries were
inconsistent – some companies gave the actual number of clicks, and some entered a percentage – and
the small sample size, researchers were unable to report relevant information for this question.
Question 39: Why does this company use social media channels (i.e. Facebook, Twitter, etc)?
This question was displayed to all participants as the researchers did not want to exclude survey
participants who use social media forms other than Facebook and Twitter. Presented as a multiple
choice question, respondents could choose multiple answers from the following list: ‘Building brand
awareness,’ ‘Building relationships,’ ‘Listening and monitoring,’ ‘Commenting,’ and’ Gathering customer
information.’ Selections for each answer choice can be seen below in Figure 14.
Figure 14: Reasons Companies use Social Media

April 13, 2011 Irish E-Commerce Report 23
35%
19%
30%
8%
8%
Graphic design
Online marketing
E-commerce development
Email marketing
Content writing
N % of Responses * % of Answers*
Building brand awareness 20 66.67% 31.25%
Building relationships 19 63.33% 29.69%
Listening and monitoring 11 36.67% 17.19%
Commenting 9 30.00% 14.06%
Gathering customer information 5 16.67% 7.81%
* total >100% because of multiple answers
AMAS recently conducted a survey which asked marketers why they used social media. The Irish E-
Commerce Survey solicited the same information. It used the same answer choices in order to
understand if those dealing primarily with the e-commerce side of business, in small companies, would
feel the same. While this survey had significantly fewer respondents to the question, interestingly, the
ranking of reasons to use social media followed a similar pattern. With a total of 30 responses, the
majority of respondents at 57% (17 of 30) use social media for multiple reasons while 13% (4 of 30) do
not use social media at all. The 2 most frequent uses of social media were ‘Building brand awareness,’
selected by 67% (20 of 30) of respondents, and ‘Building relationships,’ selected by 63% (19 of 30) of
respondents. For full details of why companies use social media, refer to Table 18.
Outsource Question 42: What areas of online business does this company outsource?
Because e-commerce is a new method of
conducting businesses for many Irish
companies, there are areas companies may
not feel comfortable handling in-house.
Therefore, this question was asked to
determine which areas companies are
outsourcing to other firms. As it was relevant
to all participants, there were no restrictions
on who saw the questions. It was displayed
as a multiple choice question, and survey
respondents could choose multiple options
from the following list: ‘Graphic design,’
‘Online marketing,’ ‘E-commerce
development,’ ‘Email marketing,’ ‘Content
writing,’ and ‘None.’ Derived from 22 responses, and seen in Figure 15, the top 2 areas outsourced were
‘Graphic design’ with 59% (13 of 22) of respondents’ selections and ‘E-commerce development’ with
50% (11 of 22) of respondents selecting it as an area to outsource. There were 2 participating companies
who do not outsource any of the above tasks.
Figure 15: Website Services Outsourced
Table 18: Percentage Breakdown of Reasons for Social Media Use

April 13, 2011 Irish E-Commerce Report 24
Headquarters
Ireland United States
United Kingdom
Total
Size
Micro 51 0 1 52
Small 7 0 0 7
Medium 1 0 1 2
Large >250
1 2 0 3
Total 60 2 2 64
Challenges Question 43: What is the biggest challenge this company faces in operating an e-commerce site?
Because e-commerce is a relatively new means of conducting business for small Irish companies, and it
is increasingly important, the researchers asked for insight into the challenges companies are facing with
the operation of the site. The question was displayed to all participants and received 27 responses to
the open-ended essay question. Answers were coded by the researchers by grouping similar keywords
responses. The coded results were then entered into Wordle to produce a word cloud (Figure 16)
illustrating the frequency of terms used to describe company challenges. Seen below, main issues center
on SEO and search rankings as well as marketing within small budgets.
Results: Grouped Questions
Headquarters and Size Of the 64 participants who responded to the
questions regarding headquarters and
company size, 51 respondents (80%) were
companies headquartered in Ireland with less
than 10 employees. Table 19 exhibits the
remaining breakdown. This percentage
increases through the survey with 94% (31 of
33) of companies who responded to questions
regarding e-commerce statistics (website
turnover, orders, visits) being micro
companies headquartered in Ireland.
Figure 16: Challenges Faced Operating E-Commerce Websites
Table 19: Company Headquarters & Size

April 13, 2011 Irish E-Commerce Report 25
Micro/Ireland Ireland
Offline Turnover € 183,346 € 208,678.52
Online Turnover € 81,893 € 81,473.48
Total € 265,239.13 € 290,152.00
% Online 30.88% 28.08%
Responses 23 25
30.88%28.08%
€ 0
€ 50,000
€ 100,000
€ 150,000
€ 200,000
€ 250,000
€ 300,000
€ 350,000
Micro/Ireland Ireland
Online Turnover
Offline Turnover
Offline Turnover Online Turnover N Total Turnover N % from Web
Apparel € 138,176.83 € 23,489.83 5 € 161,666.67 3 14.53%
Charity/Non Profit € 0 € 43,000 1 € 43,000 1 100.00%
Electronics € 32,768.22 € 52,231.78 5 € 85,000.00 3 61.45%
F&B € 1,470,500.00 € 39,500.00 1 € 1,510,000.00 1 2.62%
Health & Beauty € 0 € 52,000 1 € 52,000 1 100.00%
Home & Garden € 238,028.57 € 79,800.00 6 € 317,828.57 7 25.11%
Niche Retail € 80,808.67 € 160,858.00 5 € 241,666.67 3 66.56%
Online Services € 46,500.00 € 156,000.00 3 € 202,500.00 4 77.04%
Sports & Outdoor € 142,472.50 € 50,000 1 € 192,472.50 2 25.98%
Travel & Tourism € 0 € 85,000 2 € 85,000 2 100.00%
% of Revenue from Online When taking the average website turnover of the
Micro/Irish companies and dividing it by the
average total turnover of those same companies,
it is determined that over a quarter (29%) of total
revenue comes from online sales. When including
companies of other sizes but still headquartered
in Ireland, the percentage drops to 17%. Table
20 and Figure 17 display information
regarding only those companies that
input information for both total online
turnover and e-commerce website
turnover. The percentage of revenue
from online sales for Micro/Ireland
companies is 31%, based off of 23
responses. Considering the same for all
Irish based companies, the percentage
of revenue from online sales is 28%,
according to 25 responses.
Turnover by Industry For analysis purposes, it was difficult
to break down total and e-commerce turnover by industry because of the limited number of responses.
The ‘Charity/Non-Profit’ and ‘Health & Beauty’ industries each only had one response in regards to
turnover questions. The ‘Sports & Outdoors’ and ‘Travel & Tourism’ industries each only had 2
responses. The ‘Home & Garden’ industry had the most responses with 7 pertaining to total turnover
and 6 related to website turnover. From these numbers, an average total turnover of €317,828.57 and
average web turnover of €79,800.00 were calculated, meaning 25% of company sales came from online.
For a full breakdown, refer to Table 21.
Table 20: Percentage of Revenue from Online
Figure 17: Online & Offline Company Turnover
Table 21: Online & Offline Turnover by Industry

April 13, 2011 Irish E-Commerce Report 26
CR N Basket Value N
Apparel 1.56% 5 € 67.57 5
Charity/Non Profit 3.21% 1 € 79.63 1
Electronics 1.92% 5 € 56.89 4
F&B 1.58% 1 € 293.45 2
Health & Beauty 1.20% 1 € 83.33 1
Home & Garden 2.09% 6 € 101.51 6
Niche Retail 2.32% 5 € 120.40 5
Online Services 1.53% 3 € 146.67 3
Sports & Outdoor 3.60% 1
0
Travel & Tourism 0.45% 1 € 50.00 1
Conversion Rate and Basket Value by Industry A similar problem was encountered when
determining conversion rate and basket value by
specific industry. As shown in Table 22, five of
the industries only had one response in relation
to conversion rate. ‘Home & Garden’ had 6
responses with an average conversion rate of
2.09%. ‘Apparel,’ ‘Electronics,’ and ‘Niche Retail’
each had 5 responses, making for averages of
1.56%, 1.92%, and 2.32% respectively. Again,
with 6 responses, it was determined that the
‘Home & Garden’ industry had an average basket
value of €101.51 in Financial Year 2010. With 5
responses each, ‘Apparel’ had an average
basket value of €67.57, and ‘Niche Retail’ had
an average basket value of €120.40.
Future Research After the release of the full report, the survey will be re-launched and remain open to continue to collect
information pertaining to the 2010 Financial Year. Because e-commerce is rapidly changing and has high
growth and revenue potential, the Irish E-Commerce Survey will also be conducted annually to monitor
and report on the sector. However, in future years, there will be two separate surveys, one focusing on
e-commerce information and one pertaining strictly to social media usage.
Also, it was the researchers’ hope to gauge how social media usage affected e-commerce performance.
However, due to the small sample size, any cross-analysis between questions was difficult. The results
would not have been significant making them invalid and unreliable. Therefore, there is potential for a
future study to further understand the interaction between social media usage and e-commerce
performance to understand whether or not the integration of a social media into an e-commerce
strategy impacts the bottom line for Irish companies.
Table 22: Conversion Rate & Basket Value by Industry

April 13, 2011 Irish E-Commerce Report 27
Appendix A: Questionnaire Irish E-Commerce Survey
Thank you for participating in this survey. Please note, your responses are completely anonymous, and
the data collected will be stored securely. Answers will be used to develop statistical reports regarding
the state of Irish e-commerce.
Please also note, the survey is for the 2010 Financial Year, and all responses should be in Euro where
applicable.
It is recommended to have the following e-commerce information accessible before beginning the
survey - total website turnover, total orders, and total visits.
If you operate more than one e-commerce website, you may fill out this survey once for all websites, or
separately for each website you operate. Later in the survey, you will be asked to indicate whether the
data you provide is aggregated or not.
Your time and insights are greatly appreciated.
In which general industry sector does this company compete?
Apparel
Charity / Non-Profit
Electronics
Entertainment
Financial Services
Food and Beverage
Health and Beauty
Home and Garden
Niche Retail
Office Supply
Online Services
Sports and Outdoor
Travel and Tourism
Other ____________________

April 13, 2011 Irish E-Commerce Report 28
What areas of specialisation within the Apparel sector does this company compete?
Women's
Shoes
Intimate Apparel
Jewellery and Accessories
Kid's
Men's
Other ____________________
What areas of specialisation within the Charity / Non-Profit sector does this company compete?
Civic, Social, and Youth Organisation
Philanthropic Organisation
Religious Organisation
Social Advocacy Organisation
Other ____________________
What areas of specialisation within the Electronics sector does this company compete?
Cameras
Computing and Accessories
Gaming
Home Entertainment
Phones and Accessories
Other ____________________
What areas of specialisation within the Entertainment sector does this company compete?
Art
Books
Movies
Music
Theatre
Other ____________________
April 13, 2011 Irish E-Commerce Report 29
What areas of specialisation within the Financial Services sector does this company compete?
Accounting Services
Company Formations
Consulting
Insurance
Tax
Other ____________________
What areas of specialisation within the Food and Beverage sector does this company compete?
Beer and Wine
Confectionery
Gourmet
Groceries
Hampers
Organic
Other ____________________
What areas of specialisation within the Heath and Beauty sector does this company compete?
Organic
Bath and Body
Fragrance
Health-care
Makeup and Cosmetics
Other ____________________
What areas of specialisation within the Home and Garden sector does this company compete?
Do-It-Yourself and Tools
Electrical and Home Appliances
Furniture
Garden and Outdoor
Kitchenware
Soft Furnishings
Other ____________________

April 13, 2011 Irish E-Commerce Report 30
What areas of specialisation within the Niche Retail sector does this company compete?
Antiques
Arts and Crafts
Flowers
Gifts
Pets
Special Occasions
Other ____________________
What areas of specialisation within the Office Supply sector does this company compete?
Furniture
Gadgets
Stationary
Supplies
Other ____________________
What areas of specialisation within the Online Services sector does this company compete?
Online Dating
Software Products / Licenses
Telecommunications
Internet Service Providers
Hosting Services
Online Auctions
Online Education Courses
Other ____________________
What areas of specialisation within the Sports and Outdoor sector does this company compete?
Equipment
Exercise and Fitness
Sports and Leisurewear
Other ____________________

April 13, 2011 Irish E-Commerce Report 31
What areas of specialisation within the Travel and Tourism sector does this company compete?
Destination
Flights
Hotel
Trip Planning
Other ____________________
What area(s) of specialisation within the previously selected industry does this company compete?
Where is this company headquartered?
Ireland
United States
United Kingdom
Other ____________________
In terms of number of employees, what is the size of this company?
Micro
Small
Medium
Large >250
What was the company's total online and offline turnover in Euro for Financial Year 2010? (Please
remember this survey is completely anonymous, and this question is optional should you not wish to
answer)

April 13, 2011 Irish E-Commerce Report 32
Participant’s Experience
How many years have you worked for this company?
How many years experience do you have in the previously specified industry?
How long has this company operated an e-commerce website?
What analytics software does this company use?
Google Analytics
Statcounter
Adobe Omniture
I don't know
Other ____________________
Does this company have e-commerce tracking within the analytics package?
Yes
No
I don't know
Yes, but we don't use it
No, but we plan to get it within the next 12 months
What was the turnover through the website(s) in Financial Year 2010? (Euro)
What was the traffic in terms of total visits in Financial Year 2010 to the company’s website(s)?
How many total orders were transacted through the website(s) in Financial Year 2010?
April 13, 2011 Irish E-Commerce Report 33
What was the average conversion rate for this company’s website(s) in Financial Year 2010? (As a
percentage)
What was the average basket value for this company's website(s) in Financial Year 2010? (Euro)
What was the total bounce rate for this company's website(s) in Financial Year 2010?
What was the average number of pages viewed per visit on the company's website(s)?
What was the average time spent on the company's website(s) per visit?
What conversions do the website(s) track?
Sales
Subscriptions
Donations
Registrations
Reservations
Ticket Sales
Voucher Sales
Other ____________________
In which three countries does most of this company's e-commerce business originate? What percentage
of annual revenue is generated by each country?
Country 1
Country 2
Country 3
In your opinion, what is the annual value in Euro of the specialised industry's online market in Ireland?
(i.e. your sub-specialisation)

April 13, 2011 Irish E-Commerce Report 34
In your opinion, in terms of annual revenue generated in Euro, how much is the total online and offline
specialised market in Ireland worth? (i.e. your sub-specialisation)
How much did the company spend in Financial Year 2010 on online marketing efforts? (Euro)
Total Online Marketing Spend
Google Adwords
Search Engine Optimisation
Facebook Advertising
Describe any other online marketing efforts:
How much did the company spend in Financial Year 2010 on offline marketing efforts for the website?
(Euro)
Total Offline Marketing Spend
Television
Radio
Newspapers
Describe any other offline marketing efforts:
How much did the company spend in Financial Year 2010 on website overhead costs? (Euro)
Total Website Overhead Costs
Web Development & Design
Website Maintenance
Hosting and Hosting Related Costs
Transaction Related Fees
Website Staffing Costs
Any other costs?
Does this company use Google AdWords?
Yes
No

April 13, 2011 Irish E-Commerce Report 35
What was the Financial Year 2010 conversion rate for Google AdWords?
Does this company have an affiliate program?
Yes
No
I don't know what an affiliate program is
No, but we plan to launch one within the next 12 months
Rank these channels in the order in which they generate sales for this company. (Most to Least)
______ Direct traffic
______ Search engine traffic
______ Paid search engine traffic from Google AdWords
______ Paid search engine traffic from other search engines (i.e. Yahoo, Bing)
______ Email newsletter
______ Facebook
______ Social Media (i.e. Twitter, YouTube, etc)
______ Referral traffic from other websites
______ Affiliate
Does this company have a Facebook and / or Twitter account?
Facebook and Twitter
Twitter Only
Facebook Only
Neither
How important to your online business is this company's Facebook page?
Not at all Important
Very Unimportant
Neither Important nor Unimportant
Very Important
Extremely Important

April 13, 2011 Irish E-Commerce Report 36
How important to your online business is this company's Twitter account?
Not at all Important
Very Unimportant
Neither Important nor Unimportant
Very Important
Extremely Important
How often does this company use Facebook and / or Twitter?
Less than Once a Week
10 Times a Week
11-50 Times a Week
50+ Times a Week
How many Twitter followers does this company have?
How many Facebook fans does this company have?
Does this company advertise through Facebook?
Yes
No
What was the company’s Facebook click-through-rate in Financial Year 2010?
Does this company currently run a social e-commerce store? (For example, e-commerce within
Facebook)
Yes
No
I don't know what a social e-commerce store is
No, but we plan to launch one in the next 12 months

April 13, 2011 Irish E-Commerce Report 37
Does this company have a blog?
Yes
No
I don't know what a blog is
No, but we plan to launch one in the next 12 months
Why does this company use social media channels (i.e. Facebook, Twitter, etc)?
Building brand awareness
Building relationships
Commenting
Gathering customer information
Listening and monitoring
Other ____________________
The company does not use social media
Does this company have a newsletter it sends to customers?
Yes
No
How many subscribers has this newsletter produced?
100-500
501-1000
1001-3000
3001-10000
10000+

April 13, 2011 Irish E-Commerce Report 38
What areas of online business does this company outsource?
Graphic design
Online marketing
E-commerce development
Email marketing
Content writing
Other ____________________
What is the biggest challenge this company faces is operating an e-commerce site?
If you would like to receive a personalised report that includes your company's statistics to compare to
industry and country averages, please enter your email address below. Please not this is entirely
confidential, and we will not use your email for any other reason than to send the report.
Thank you for taking the time to participate in this survey on the state of Irish e-commerce. Please allow
3 weeks for survey analysis and report generation. If you have requested a personalised report, it will be
sent to the e-mail address provided. Otherwise, a general report will be posted on
www.irishecommercesurvey.com.

April 13, 2011 Irish E-Commerce Report 39
Appendix B: Sub-Industry Breakdown
Specialisation Category N % of Responses* % of Answers*
Apparel
Women's 3 30.00% 25.00%
Shoes 1 10.00% 8.33%
Jewellery and Accessories 2 20.00% 16.67%
Kid's 3 30.00% 25.00%
Men's 2 20.00% 16.67%
Other 1 10.00% 8.33%
Charity / Non-Profit
Other 1 100.00% 100.00%
Electronics
Cameras 2 28.57% 11.11%
Computing and Accessories 4 57.14% 22.22%
Gaming 2 28.57% 11.11%
Home Entertainment 4 57.14% 22.22%
Phones and Accessories 4 57.14% 22.22%
Other 2 28.57% 11.11%
Food and Beverage
Beer and Wine 4 66.67% 66.67%
Gourmet 1 16.67% 16.67%
Other 1 16.67% 16.67%
Health and Beauty
Fragrance 1 50.00% 33.33%
Makeup and Cosmetics 1 50.00% 33.33%
Other 1 50.00% 33.33%
Home and Garden
Furniture 2 33.33% 18.18%
Garden and Outdoor 2 33.33% 18.18%
Kitchenware 1 16.67% 9.09%
Soft Furnishings 4 66.67% 36.36%
Other 2 33.33% 18.18%
Niche Retail
Arts and Crafts 2 28.57% 16.67%
Flowers 1 14.29% 8.33%
Gifts 3 42.86% 25.00%
Special Occasions 1 14.29% 8.33%
Other 5 71.43% 41.67%
Office Supply
Stationary 1 100.00% 100.00%
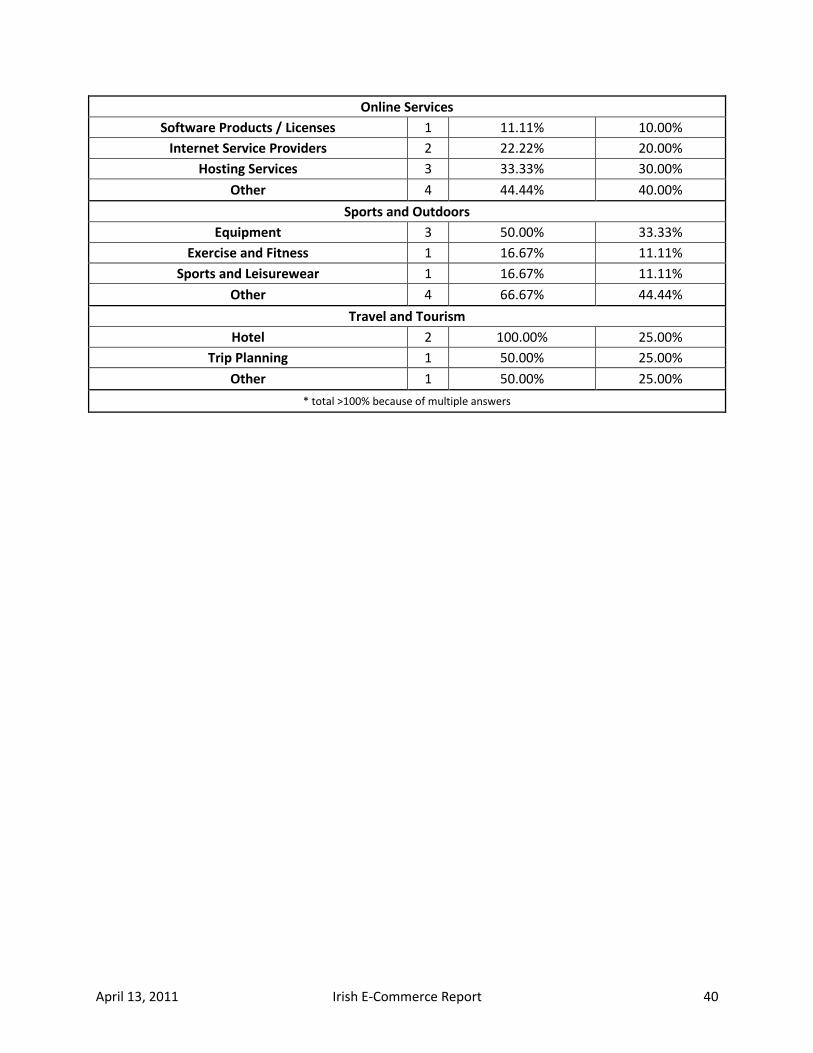
April 13, 2011 Irish E-Commerce Report 40
Online Services
Software Products / Licenses 1 11.11% 10.00%
Internet Service Providers 2 22.22% 20.00%
Hosting Services 3 33.33% 30.00%
Other 4 44.44% 40.00%
Sports and Outdoors
Equipment 3 50.00% 33.33%
Exercise and Fitness 1 16.67% 11.11%
Sports and Leisurewear 1 16.67% 11.11%
Other 4 66.67% 44.44%
Travel and Tourism
Hotel 2 100.00% 25.00%
Trip Planning 1 50.00% 25.00%
Other 1 50.00% 25.00%
* total >100% because of multiple answers

April 13, 2011 Irish E-Commerce Report 41
Appendix C: Graphs of Conversion Rate and Basket Value by Industry
1.56%
3.21%
1.92%
1.58%
1.20%
2.09%
2.32%
1.53%
3.60%
0.45%
0.00%
0.50%
1.00%
1.50%
2.00%
2.50%
3.00%
3.50%
4.00%
Conversion Rate
Apparel
Charity/Non Profit
Electronics
F&B
Health & Beauty
Home & Garden
Niche Retail
Online Services
Sports & Outdoor
Travel & Tourism
€ 67.57€ 79.63
€ 56.89
€ 293.45
€ 83.33
€ 101.51
€ 120.40
€ 146.67
€ 50.00
€ 0.00
€ 50.00
€ 100.00
€ 150.00
€ 200.00
€ 250.00
€ 300.00
€ 350.00
Basket Value
Apparel
Charity/Non Profit
Electronics
F&B
Health & Beauty
Home & Garden
Niche Retail
Online Services
Travel & Tourism