Iris Network Intelligence Solution Getting Started Guide
28
Software Version 7.13.2 Iris Network Intelligence Solution Getting Started Guide Iris TM A Guide for Iris Users covering: - Iris Overview - Iris Applications Overview - Iris Getting Started For Licensed Users Only | Unauthorized Duplication or Distribution Prohibited
Transcript of Iris Network Intelligence Solution Getting Started Guide
Software Version 7.13.2 Iris Network Intelligence SolutionGetting Started GuideIrisTM
A Guide for Iris Users covering: - Iris Overview- Iris Applications Overview- Iris Getting Started
For Licensed Users Only | Unauthorized Duplication or Distribution Prohibited
Copyright © Tektronix Communications, Inc. All rights reserved. Printed in the USA. Tektronix Communications products are covered by U.S. and foreign patents, issued and pending. Information in this publication supersedes that in all previously published material. Specification and price change privileges reserved. TEKTRONIX and GeoProbe are registered trademarks of Tektronix Communications, Inc. DirectQuality and Power Probe are registered trademarks of Tektronix Canada, Inc. FastPath, Iris, and IrisView are trademarks of Tektronix Communications, Inc. All other trade names referenced are the service marks, trademarks or registered trademarks of their respective companies.
Tektronix Communications3033 W President George Bush HighwayPlano, Texas 75075+1 469-330-4000 (voice)www.tekcomms.com Web site
[email protected] (Technical Publications email)
Tektronix Communications, Inc. Proprietary Information992-0431-08-001-140228
The products and specifications, configurations, and other technical information regarding the services described or referenced in this document are subject to change without notice. All statements, technical information, and recommendations contained in this document are believed to be accurate and reliable but are presented “as is” without warranty of any kind, express or implied. Users must take full responsibility for their application of any products specified in this document. Tektronix Communications, Inc. makes no implied warranties of merchantability or fitness for a purpose as a result of this document or the information described or referenced within, and all other warranties, express or implied, are excluded.
Except where otherwise indicated, the information contained in this document represents the planned capabilities and intended functionality offered by the product and version number identified on the front of this document. Screen images depicted in this document are representative and intended to serve as example images only. Wherever possible, actual screen images are included.
For Licensed Users Only | Unauthorized Duplication or Distribution Prohibited
Iris Network Intelligence Solution 7.13.2 3Getting Started Guide
User Documentation
Chapter 1 Iris Network Intelligence Solution ......................................................................................... 5
Overview—Tektronix Network Intelligence .................................................................... 5
The Iris Family Solution........................................................................................... 6
GeoProbe Family ............................................................................................. 6
PowerProbe Family.......................................................................................... 7
IrisView ............................................................................................................ 7
Iris Analyzer Toolset ......................................................................................... 8
Iris Assurance Toolset...................................................................................... 8
IrisView Network Maps .................................................................................... 9
myIrisView ....................................................................................................... 9
KPI Studio ....................................................................................................... 9
Chapter 2 Getting Started.................................................................................................................. 10
Overview .................................................................................................................... 10
IrisView Framework..................................................................................................... 11
Iris Client System Requirements.................................................................................. 11
Accessing IrisView ...................................................................................................... 12
IrisView Main Page...................................................................................................... 13
User Management ...................................................................................................... 14
Chapter 3 IrisView Application Features ............................................................................................. 15
Overview .................................................................................................................... 15
Iris Online Help ........................................................................................................... 16
Iris Session Analyzer ................................................................................................... 17
Features and Benefits .......................................................................................... 17
Protocol Analyzer........................................................................................................ 19
Features and Benefits .......................................................................................... 19
Iris Traffic Analyzer ...................................................................................................... 20
Features and Benefits .......................................................................................... 20
Iris Performance Intelligence ....................................................................................... 21
Features and Benefits .......................................................................................... 21
Iris Alarms................................................................................................................... 23
Features and Benefits .......................................................................................... 23
Table of Contents
For Licensed Users Only | Unauthorized Duplication or Distribution Prohibited
Table of Contents
Iris Network Intelligence Solution 7.13.2 4Getting Started Guide
Rev. 001-140228
User Interface........................................................................................................23
Historical Reporting .....................................................................................................24
Features and Benefits ...........................................................................................24
Management Reports .....................................................................................24
Query Reports ................................................................................................24
Automated Controller Engine.......................................................................................25
Features and Benefits ...........................................................................................25
IrisView Network Maps ................................................................................................25
Features and Benefits ...........................................................................................26
myIrisView ...................................................................................................................26
Features and Benefits ...........................................................................................26
KPI Studio ...................................................................................................................27
Features and Benefits ...........................................................................................27
For Licensed Users Only | Unauthorized Duplication or Distribution Prohibited
Iris Network Intelligence Solution 7.13.2 5Getting Started Guide
User Documentation
Iris Network Intelligence Solution
OVERVIEW—TEKTRONIX NETWORK INTELLIGENCE
As the leader in network management, Tektronix Communications assists the world’s leading wireless and wireline operators with unrivaled network monitoring. With the availability of GeoProbe G10, IrisView, Iris Analyzer Toolset, and Iris Assurance Toolset, Tektronix Communications introduces a new breed of monitoring systems to empower network operators with an actionable path for delivering high quality, secure, and personalized services to end customers.
Utilizing a suite of collection, correlation, and analysis components, Tektronix Communications’ offering may be used to extract critical information—Network Intelligence—from monitored voice, video, and data traffic.
Multiple groups within a carrier’s organization can benefit from having access to more accurate real-time information, enabling them to make better business decisions. The Iris product family benefits key organizations including: network operations, network planning and engineering, and IT organizations responsible for the management and operation of the data center.
Expanded solution capabilities gracefully handle the swell of mobile IP data traffic
Improved workflows and enhanced usability easily accommodate changing operational support models
An enriched product mix increases focus on managing the customer experience
For Licensed Users Only | Unauthorized Duplication or Distribution Prohibited
Iris Network Intelligence Solution 7.13.2 6Getting Started Guide
1Iris Network Intelligence SolutionRev. 001-140228
The Iris Family Solution
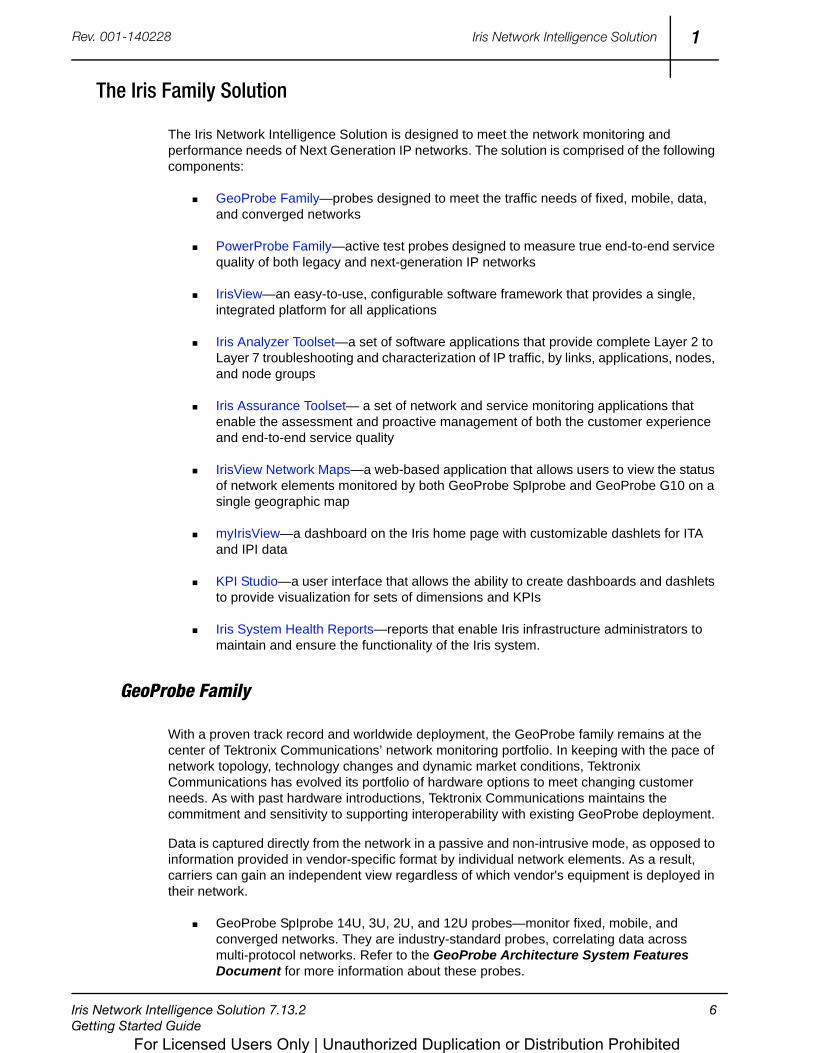
The Iris Network Intelligence Solution is designed to meet the network monitoring and performance needs of Next Generation IP networks. The solution is comprised of the following components:
GeoProbe Family—probes designed to meet the traffic needs of fixed, mobile, data, and converged networks
PowerProbe Family—active test probes designed to measure true end-to-end service quality of both legacy and next-generation IP networks
IrisView—an easy-to-use, configurable software framework that provides a single, integrated platform for all applications
Iris Analyzer Toolset—a set of software applications that provide complete Layer 2 to Layer 7 troubleshooting and characterization of IP traffic, by links, applications, nodes, and node groups
Iris Assurance Toolset— a set of network and service monitoring applications that enable the assessment and proactive management of both the customer experience and end-to-end service quality
IrisView Network Maps—a web-based application that allows users to view the status of network elements monitored by both GeoProbe SpIprobe and GeoProbe G10 on a single geographic map
myIrisView—a dashboard on the Iris home page with customizable dashlets for ITA and IPI data
KPI Studio—a user interface that allows the ability to create dashboards and dashlets to provide visualization for sets of dimensions and KPIs
Iris System Health Reports—reports that enable Iris infrastructure administrators to maintain and ensure the functionality of the Iris system.
GeoProbe Family
With a proven track record and worldwide deployment, the GeoProbe family remains at the center of Tektronix Communications’ network monitoring portfolio. In keeping with the pace of network topology, technology changes and dynamic market conditions, Tektronix Communications has evolved its portfolio of hardware options to meet changing customer needs. As with past hardware introductions, Tektronix Communications maintains the commitment and sensitivity to supporting interoperability with existing GeoProbe deployment.
Data is captured directly from the network in a passive and non-intrusive mode, as opposed to information provided in vendor-specific format by individual network elements. As a result, carriers can gain an independent view regardless of which vendor's equipment is deployed in their network.
GeoProbe SpIprobe 14U, 3U, 2U, and 12U probes—monitor fixed, mobile, and converged networks. They are industry-standard probes, correlating data across multi-protocol networks. Refer to the GeoProbe Architecture System Features Document for more information about these probes.
For Licensed Users Only | Unauthorized Duplication or Distribution Prohibited
Iris Network Intelligence Solution 7.13.2 7Getting Started Guide
1Iris Network Intelligence SolutionRev. 001-140228
GeoProbe G10—the newest member of the GeoProbe family, designed to specifically address high bandwidth IP interfaces with a distributed architecture optimized to handle high volume traffic. The GeoProbe G10 is optimized for portions of the operator networks with high volumes of voice and data IP traffic. Refer to the G10 Probe System Features Document for more information.
GeoSoft RAN probes—the Tektronix implementation of the Trace Collection Entity (TCE) defined by 3GPP. TCE describes a probeless way of network monitoring currently focused on eNodeB Traceports which provide Uu signaling data and may include also S1 and X2 signaling data. GeoSoft RAN probes provide the capability to accept either a direct eNodeB feed or a eNode server.The GeoSoft RAN can use these inputs for integrated call tracing capability, or invoke a call to the Network Surveillance Application (NSA) or TrendNavigate Server (TNS) to perform radio access network optimization, troubleshooting analysis, or review trend campaign KPIs as required. Refer to the Mobile Radio Access Solutions LTE System Features Document for more details about the GeoSoft RAN probe.
PowerProbe Family
As part of the Active Assurance product line, the PowerProbe active test probes are designed for advanced Quality of Experience (QoE) testing over PSTN and next-generation networks. With a broad range of interfaces supporting all standard signaling protocols, the PowerProbes support a growing library of over 40 test agents to cover evolving service quality testing needs.
Remotely managed and highly secure, the PowerProbes enable scalable end-to-end,bi-directional voice, fax, video, and IP tests that measure over 300 user-perceived service quality metrics using an array of standards-based and patented algorithms. Controlled by Tektronix’ DirectQuality active test automation OSS, the PowerProbes perform on-demand and scheduled tests for proactive service monitoring, SLA validation, carrier benchmarking, and troubleshooting applications.
IrisView
As the framework behind the Network Intelligence portfolio, IrisView fine-tunes existing GeoProbe deployments with a seamless user experience for targeted IrisView applications within the framework, regardless of the underlying GeoProbe data source. Enabling the integration and co-existence of GeoProbe SpIprobes and GeoProbe G10s, IrisView allows operators to utilize the right probe for the job. This flexibility accommodates a “best-of-breed” solution with optimized hardware and an overall lower total cost of ownership. Scalability is further ensured with a distributed architecture of multiple servers that can grow gracefully with probe expansions.
From an applications perspective, IrisView’s data adaptation layer ensures seamless end-to-end support across GeoProbe SpIprobe and G10 hardware for a targeted suite of network management tools. Single sign-on access to these tools and G10 administration is made possible through a modern Web user interface which consolidates applications into a manageable portal display.
For Licensed Users Only | Unauthorized Duplication or Distribution Prohibited
Iris Network Intelligence Solution 7.13.2 8Getting Started Guide
1Iris Network Intelligence SolutionRev. 001-140228
Iris Analyzer Toolset
The Iris Analyzer Toolset is focused on traffic characterization, network troubleshooting, and threshold-based alarm capabilities. While packaged in combination as the “Iris Analyzer Toolset,” the individual product offerings are purpose-driven and designed to address specific departments and roles within an operator’s organization:
Iris Session Analyzer—provides an enhanced user experience for real-time, historical, and combination session trace options; leverages data from both SpIprobe and GeoProbe G10s with improved workflows and enhanced usability. Refer to the Iris Session Analyzer System Features Document for details.
Iris Traffic Analyzer—utilizes data collected by the G10, and facilitates performance monitoring and root cause analysis of mobile IP data service degradation. Refer to the Iris Traffic Analyzer System Features Document for details.
Protocol Analyzer—leverages data from both SpIprobe 2U and 14U and GeoProbe G10s, and provides advanced troubleshooting for network engineers, offering a set of protocol analyzer features designed to bring focus to relevant protocol-based information. Refer to the Iris Protocol Analyzer System Features Document for details.
Iris Assurance Toolset
In addition to the Iris Analyzer Toolset, network and service monitoring applications are also supported on the IrisView platform. Utilizing the same GeoProbe G10 and SpIprobe data sources, these Assurance Toolset applications enable the assessment and proactive management of both the customer experience and end-to-end service quality.
Through the flexible, model-driven transformation of information to intelligence, Iris Assurance Toolset applications enable a better understanding of subscriber experience, application performance, and network resource utilization.
Iris Performance Intelligence—provides model-driven analysis of data service and Network performance. Iris Performance Intelligence provides simple reporting for business owners and a simple yet powerful real-time dashboard and alarming system. IPI enables network operators to proactively identify service performance problems and narrow down their cause and origin. Refer to the Iris Performance Intelligence System Features Document for details.
Automated Controller Engine—going far beyond simple GUI integration, the new Automated Controller Engine (ACE) application enables automated, intelligent interworking between Tektronix Communications’ best-in-class network monitoring and active test solutions. ACE provides the ability to automatically launch actions, such as active tests, driven by the network intelligence data monitored and correlated by the GeoProbe family of passive probes.
For Licensed Users Only | Unauthorized Duplication or Distribution Prohibited
Iris Network Intelligence Solution 7.13.2 9Getting Started Guide
1Iris Network Intelligence SolutionRev. 001-140228
Automating troubleshooting workflows with ACE allows Service Providers to resolve issues faster by focusing resources on analyzing root causes, rather than on time-consuming data collection tasks and manual trial-and-error testing. Users configure the rules-based IrisView Policy Engine to define the specific network conditions and events which will trigger ACE to take action. ACE provides users with a dashboard showing a summary of the incoming events correlated with the results of the corresponding active tests. Refer to the Automated Controller Engine System Features Document for details.
IrisView Network Maps
IrisView Network Maps is a web-based application that shows the status of network elements on a geographic map using GIS—geographic information system. Users can look at the status of network elements monitored by both SpIprobe and GeoProbe G10 on a single map. Well-known map visualization tools such as zooming and panning provide intuitive mechanisms to explore the available data. Users can view portions of the network with the selection of map layers. The geo referenced support is an important aid in troubleshooting network issues from a geographical view.
The IrisView Network Maps application allows operators to proactively monitor the status of the network with real-time feedback. Users can take corrective actions by seamlessly accessing other IrisView tools such as Iris Session Analyzer (ISA), Protocol Analyzer (PA), and Alarm Dashboard to determine the root cause of network problems. IrisView Network Maps supports Iris Traffic Analyzer (ITA), system-level, and GeoProbe alarms. Refer to the IrisView Network Maps System Features Document for details.
myIrisView
myIrisView is a licensable feature enabling users to see a customized dashboard on the IrisView home page containing dashlets for ITA and IPI data. This feature gives users an up-to-date view of data of interest on a single page. Such direct access to network status dashboards will aid in troubleshooting by allowing users to more quickly see and respond to issues that will impact a customer’s network. Refer to the myIrisView System Features Document for details.
KPI Studio
KPI Studio is designed to allow customized changes to KPIs outside of the release cycle without requiring core software updates. The KPI Studio user interface provides the ability to create Dashboards and Dashlets that provide visualization for sets of dimensions and KPIs. This means, that for a given service model (which defines the set of KPIs and dimensions available to the user), customers can create a Dashboard or a Dashlet that displays dimension instances and service KPIs according to the customer's selection. The user can open and access multiple Dashboards and Dashlets at the same time.
The primary use case for the KPI Studio application interface is to:
Enable rapid access and root cause analysis
Provide customers with the flexibility to create Dashboards and drill-down capabilities that meet their specific requirements
For Licensed Users Only | Unauthorized Duplication or Distribution Prohibited
Iris Network Intelligence Solution 7.13.2 10Getting Started Guide
1Iris Network Intelligence SolutionRev. 001-140228
Iris System Health Reports
Iris System Health reports enable Iris infrastructure administrators to maintain and ensure the functionality of the Iris system. With these reports, Iris infrastructure administrators can proactively manage probes, servers, and Data Record (XDR) capacity.
Accessed from IrisView by users with System Health UUMS privileges, Iris System Health Reports provide a front-end web interface that enables users to access vital probe statistics such as line rates without having to log in to probes. Line rates be measured in megabits per second or packets per second.
Iris System Health reports include predefined Management Reports and customizable Query Reports that can be created when needed.
For Licensed Users Only | Unauthorized Duplication or Distribution Prohibited
Iris Network Intelligence Solution 7.13.2 10Getting Started Guide
User Documentation
Getting Started
OVERVIEW
This chapter introduces you to the Iris framework and how to access IrisView applications. Refer to the following sections for more information:
IrisView Framework
Iris Client System Requirements
User Management
For Licensed Users Only | Unauthorized Duplication or Distribution Prohibited
Iris Network Intelligence Solution 7.13.2 11Getting Started Guide
2Getting StartedRev. 001-140228
IRISVIEW FRAMEWORK
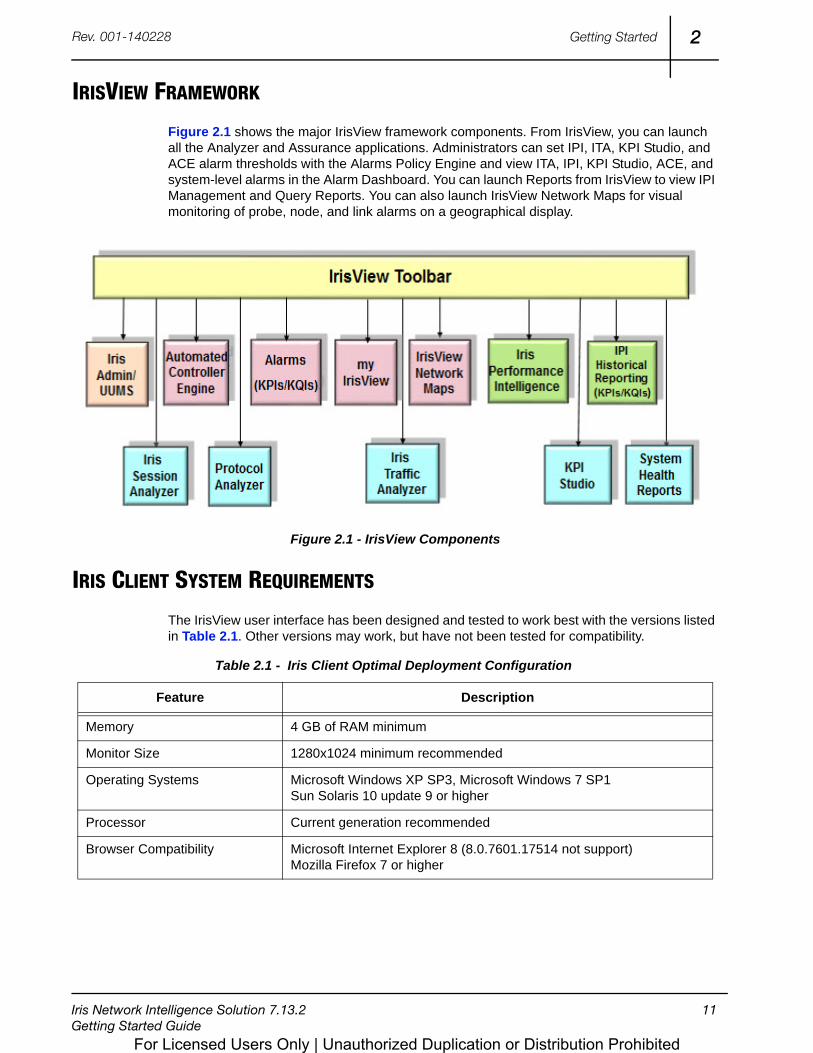
Figure 2.1 shows the major IrisView framework components. From IrisView, you can launch all the Analyzer and Assurance applications. Administrators can set IPI, ITA, KPI Studio, and ACE alarm thresholds with the Alarms Policy Engine and view ITA, IPI, KPI Studio, ACE, and system-level alarms in the Alarm Dashboard. You can launch Reports from IrisView to view IPI Management and Query Reports. You can also launch IrisView Network Maps for visual monitoring of probe, node, and link alarms on a geographical display.
Figure 2.1 - IrisView Components
IRIS CLIENT SYSTEM REQUIREMENTS
The IrisView user interface has been designed and tested to work best with the versions listed in Table 2.1. Other versions may work, but have not been tested for compatibility.
Table 2.1 - Iris Client Optimal Deployment Configuration
Feature Description
Memory 4 GB of RAM minimum
Monitor Size 1280x1024 minimum recommended
Operating Systems Microsoft Windows XP SP3, Microsoft Windows 7 SP1Sun Solaris 10 update 9 or higher
Processor Current generation recommended
Browser Compatibility Microsoft Internet Explorer 8 (8.0.7601.17514 not support)Mozilla Firefox 7 or higher
For Licensed Users Only | Unauthorized Duplication or Distribution Prohibited
Iris Network Intelligence Solution 7.13.2 12Getting Started Guide
2Getting StartedRev. 001-140228
ACCESSING IRISVIEW
IrisView enables you to access all Iris applications. Your system administrator provides you the URL to access IrisView and your user ID and password.
Perform the following steps to access IrisView.
Step Action
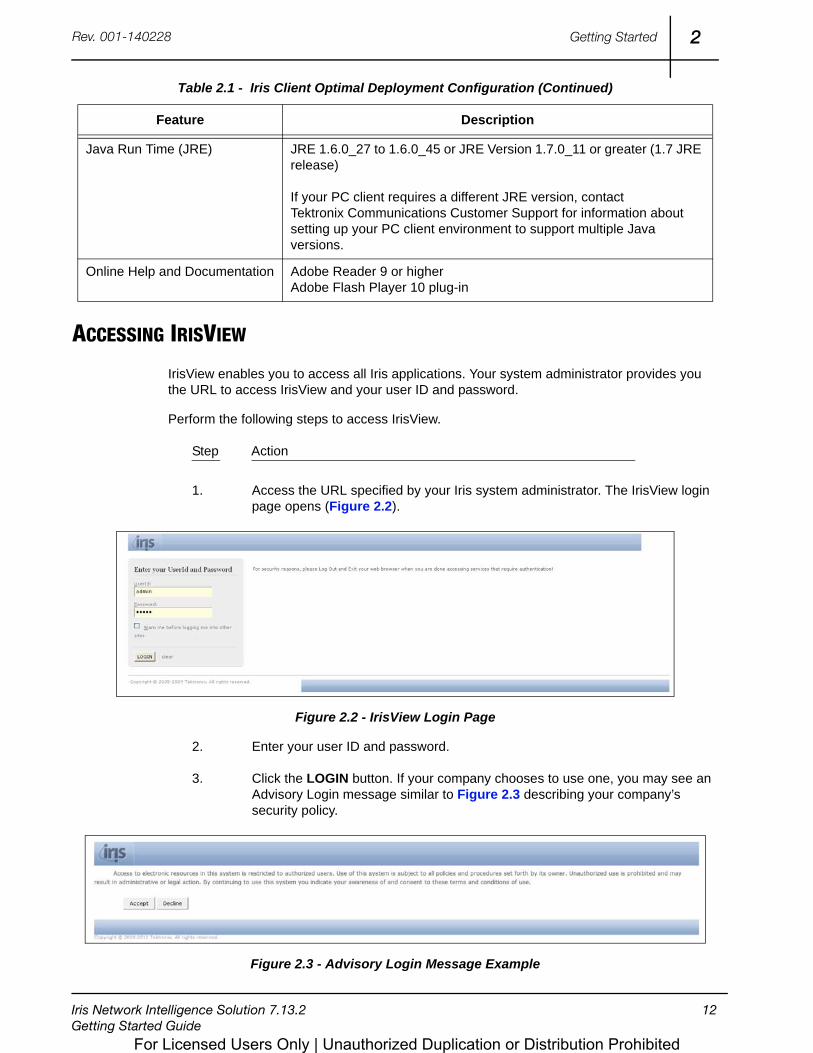
1. Access the URL specified by your Iris system administrator. The IrisView login page opens (Figure 2.2).
Figure 2.2 - IrisView Login Page
2. Enter your user ID and password.
3. Click the LOGIN button. If your company chooses to use one, you may see an Advisory Login message similar to Figure 2.3 describing your company’s security policy.
Figure 2.3 - Advisory Login Message Example
Java Run Time (JRE) JRE 1.6.0_27 to 1.6.0_45 or JRE Version 1.7.0_11 or greater (1.7 JRE release)
If your PC client requires a different JRE version, contactTektronix Communications Customer Support for information about setting up your PC client environment to support multiple Java versions.
Online Help and Documentation Adobe Reader 9 or higherAdobe Flash Player 10 plug-in
Table 2.1 - Iris Client Optimal Deployment Configuration (Continued)
Feature Description
For Licensed Users Only | Unauthorized Duplication or Distribution Prohibited
Iris Network Intelligence Solution 7.13.2 13Getting Started Guide
2Getting StartedRev. 001-140228
4. Click the Accept button. The IrisView main page appears.
If you have any problems accessing the system, contact your system administrator.
IRISVIEW MAIN PAGE
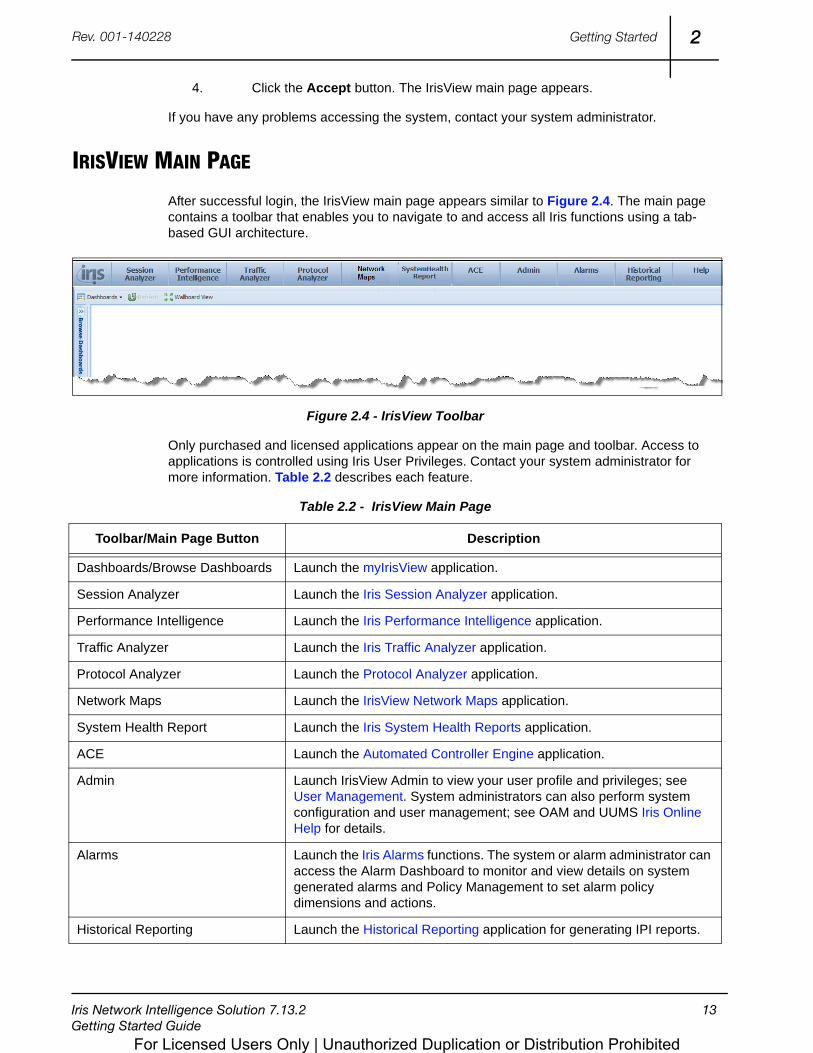
After successful login, the IrisView main page appears similar to Figure 2.4. The main page contains a toolbar that enables you to navigate to and access all Iris functions using a tab-based GUI architecture.
Figure 2.4 - IrisView Toolbar
Only purchased and licensed applications appear on the main page and toolbar. Access to applications is controlled using Iris User Privileges. Contact your system administrator for more information. Table 2.2 describes each feature.
Table 2.2 - IrisView Main Page
Toolbar/Main Page Button Description
Dashboards/Browse Dashboards Launch the myIrisView application.
Session Analyzer Launch the Iris Session Analyzer application.
Performance Intelligence Launch the Iris Performance Intelligence application.
Traffic Analyzer Launch the Iris Traffic Analyzer application.
Protocol Analyzer Launch the Protocol Analyzer application.
Network Maps Launch the IrisView Network Maps application.
System Health Report Launch the Iris System Health Reports application.
ACE Launch the Automated Controller Engine application.
Admin Launch IrisView Admin to view your user profile and privileges; see User Management. System administrators can also perform system configuration and user management; see OAM and UUMS Iris Online Help for details.
Alarms Launch the Iris Alarms functions. The system or alarm administrator can access the Alarm Dashboard to monitor and view details on system generated alarms and Policy Management to set alarm policy dimensions and actions.
Historical Reporting Launch the Historical Reporting application for generating IPI reports.
For Licensed Users Only | Unauthorized Duplication or Distribution Prohibited
Iris Network Intelligence Solution 7.13.2 14Getting Started Guide
2Getting StartedRev. 001-140228
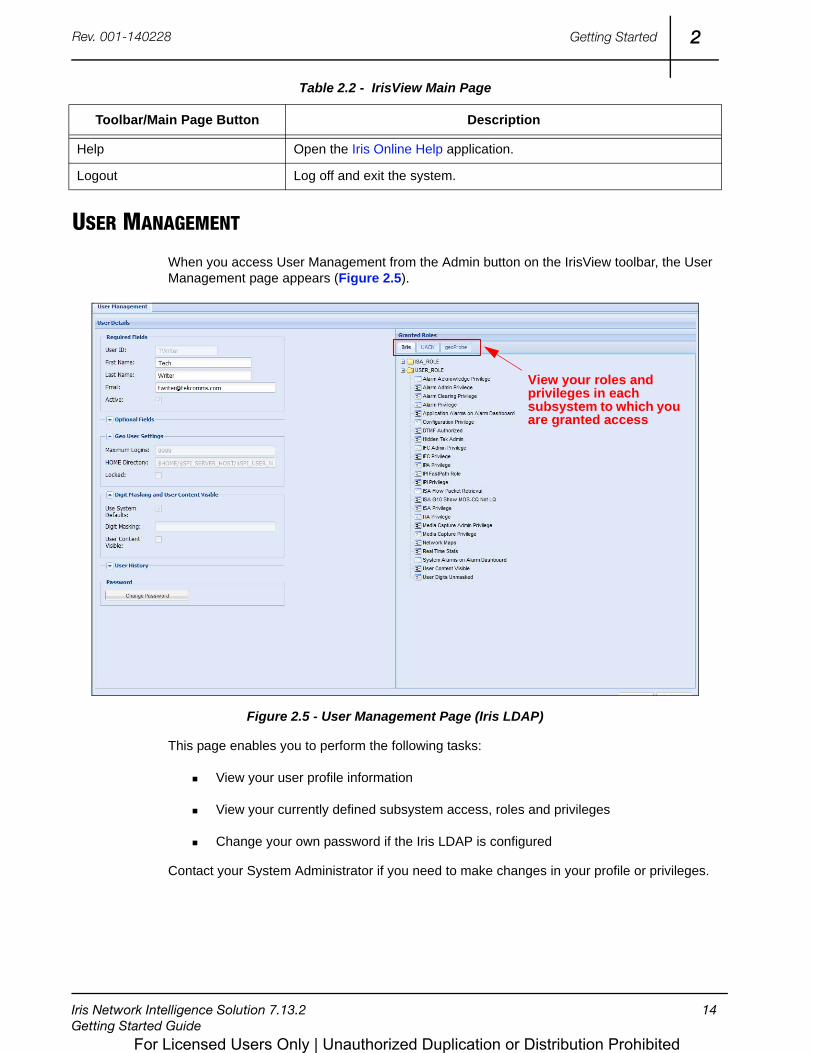
USER MANAGEMENT
When you access User Management from the Admin button on the IrisView toolbar, the User Management page appears (Figure 2.5).
Figure 2.5 - User Management Page (Iris LDAP)
This page enables you to perform the following tasks:
View your user profile information
View your currently defined subsystem access, roles and privileges
Change your own password if the Iris LDAP is configured
Contact your System Administrator if you need to make changes in your profile or privileges.
Help Open the Iris Online Help application.
Logout Log off and exit the system.
Table 2.2 - IrisView Main Page
Toolbar/Main Page Button Description
View your roles and privileges in each subsystem to which you are granted access
For Licensed Users Only | Unauthorized Duplication or Distribution Prohibited

Iris Network Intelligence Solution 7.13.2 15Getting Started Guide
User Documentation
IrisView Application Features
OVERVIEW
The IrisView suite provides network operators an unparalleled suite of network management solutions for fixed, mobile, IP, and converged multi-service networks. This comprehensive set of solutions supports a range of architectures and applications such as mobile LTE data, fixed mobile convergence, IMS, and VoIP. You can access the Iris Online Help for detailed information including use cases, procedures, and GUI descriptions of each IrisView application. You can find high-level overviews of each application in the following sections:
Iris Online Help
Iris Session Analyzer
Protocol Analyzer
Iris Traffic Analyzer
Iris Performance Intelligence
Iris Alarms
Historical Reporting
Automated Controller Engine
IrisView Network Maps
myIrisView
KPI Studio
For Licensed Users Only | Unauthorized Duplication or Distribution Prohibited
Iris Network Intelligence Solution 7.13.2 16Getting Started Guide
3IrisView Application FeaturesRev. 001-140228
IRIS ONLINE HELP
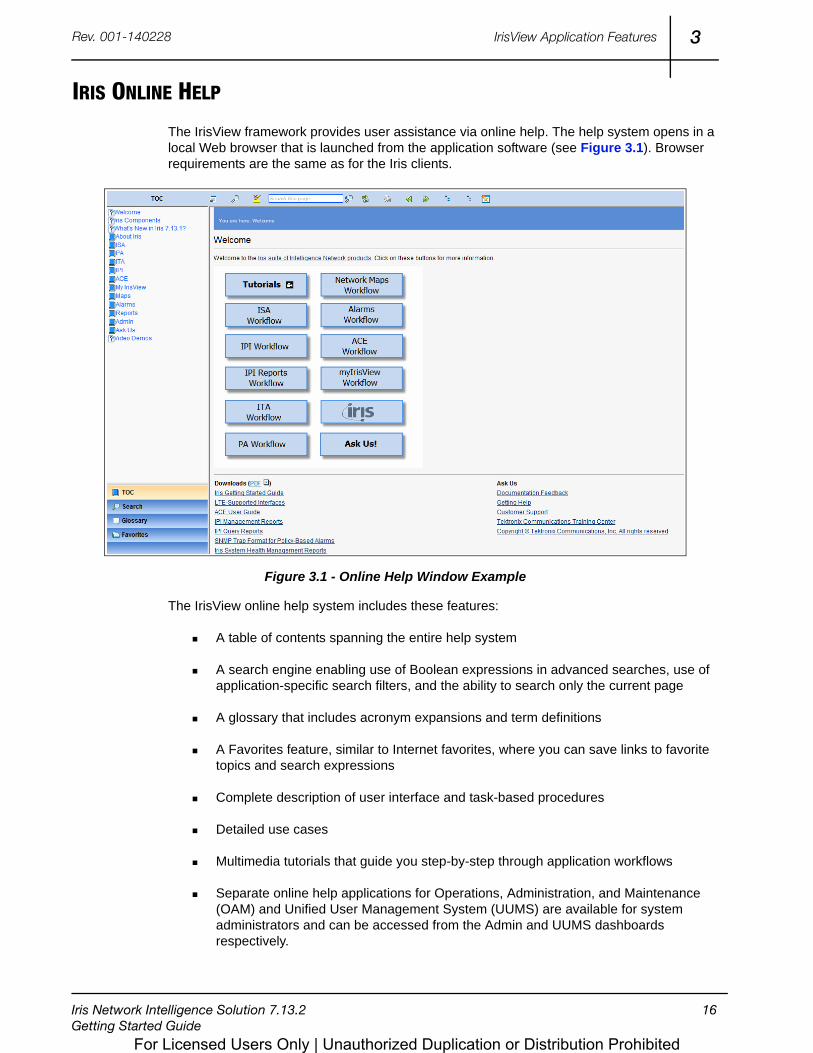
The IrisView framework provides user assistance via online help. The help system opens in a local Web browser that is launched from the application software (see Figure 3.1). Browser requirements are the same as for the Iris clients.
Figure 3.1 - Online Help Window Example
The IrisView online help system includes these features:
A table of contents spanning the entire help system
A search engine enabling use of Boolean expressions in advanced searches, use of application-specific search filters, and the ability to search only the current page
A glossary that includes acronym expansions and term definitions
A Favorites feature, similar to Internet favorites, where you can save links to favorite topics and search expressions
Complete description of user interface and task-based procedures
Detailed use cases
Multimedia tutorials that guide you step-by-step through application workflows
Separate online help applications for Operations, Administration, and Maintenance (OAM) and Unified User Management System (UUMS) are available for system administrators and can be accessed from the Admin and UUMS dashboards respectively.
For Licensed Users Only | Unauthorized Duplication or Distribution Prohibited
Iris Network Intelligence Solution 7.13.2 17Getting Started Guide
3IrisView Application FeaturesRev. 001-140228
IRIS SESSION ANALYZER
Iris Session Analyzer (ISA) leverages a proven multi-protocol correlation engine for real time, historical, and combination session trace options from a single application. ISA utilizes the best of GeoProbe technology, building on the same powerful multi-protocol correlation engine used by the original GeoProbe Call Trace application, but with enhancements designed to optimize the user experience.
The following sections provide an overview of the main features of ISA. Refer to the Iris Online Help for video demos, use cases, in-depth description of user interface, and concept information.
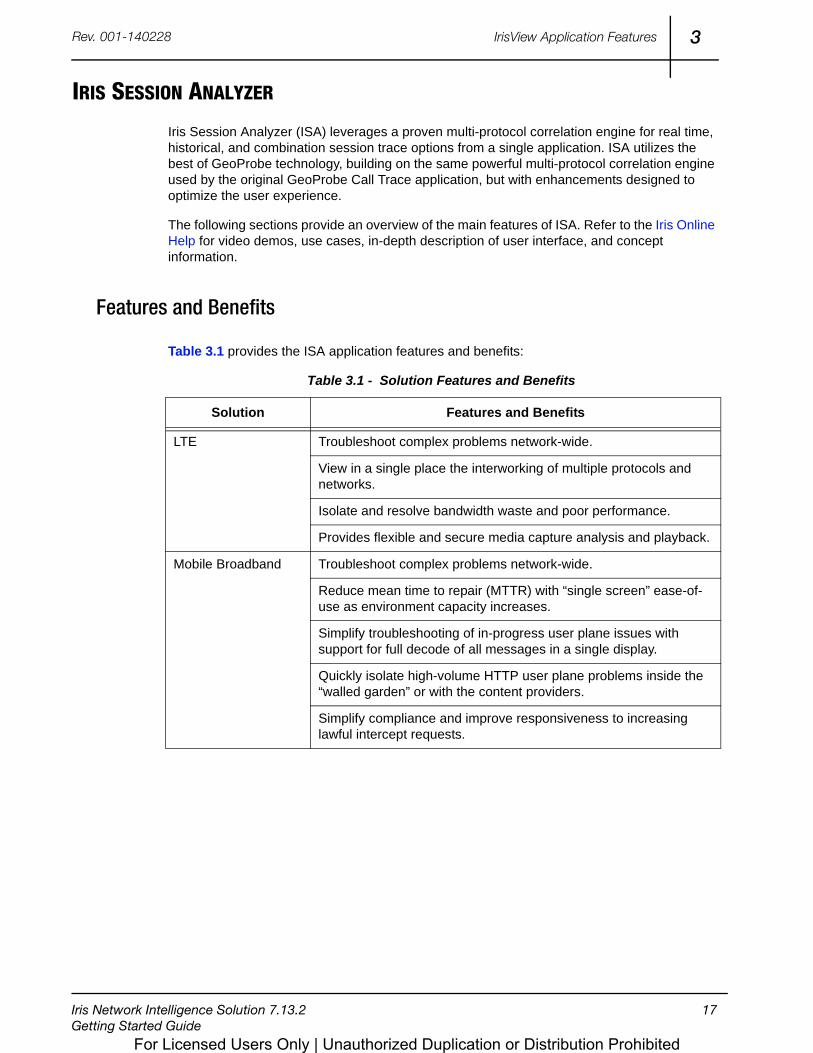
Features and Benefits
Table 3.1 provides the ISA application features and benefits:
Table 3.1 - Solution Features and Benefits
Solution Features and Benefits
LTE Troubleshoot complex problems network-wide.
View in a single place the interworking of multiple protocols and networks.
Isolate and resolve bandwidth waste and poor performance.
Provides flexible and secure media capture analysis and playback.
Mobile Broadband Troubleshoot complex problems network-wide.
Reduce mean time to repair (MTTR) with “single screen” ease-of-use as environment capacity increases.
Simplify troubleshooting of in-progress user plane issues with support for full decode of all messages in a single display.
Quickly isolate high-volume HTTP user plane problems inside the “walled garden” or with the content providers.
Simplify compliance and improve responsiveness to increasing lawful intercept requests.
For Licensed Users Only | Unauthorized Duplication or Distribution Prohibited
Iris Network Intelligence Solution 7.13.2 18Getting Started Guide
3IrisView Application FeaturesRev. 001-140228
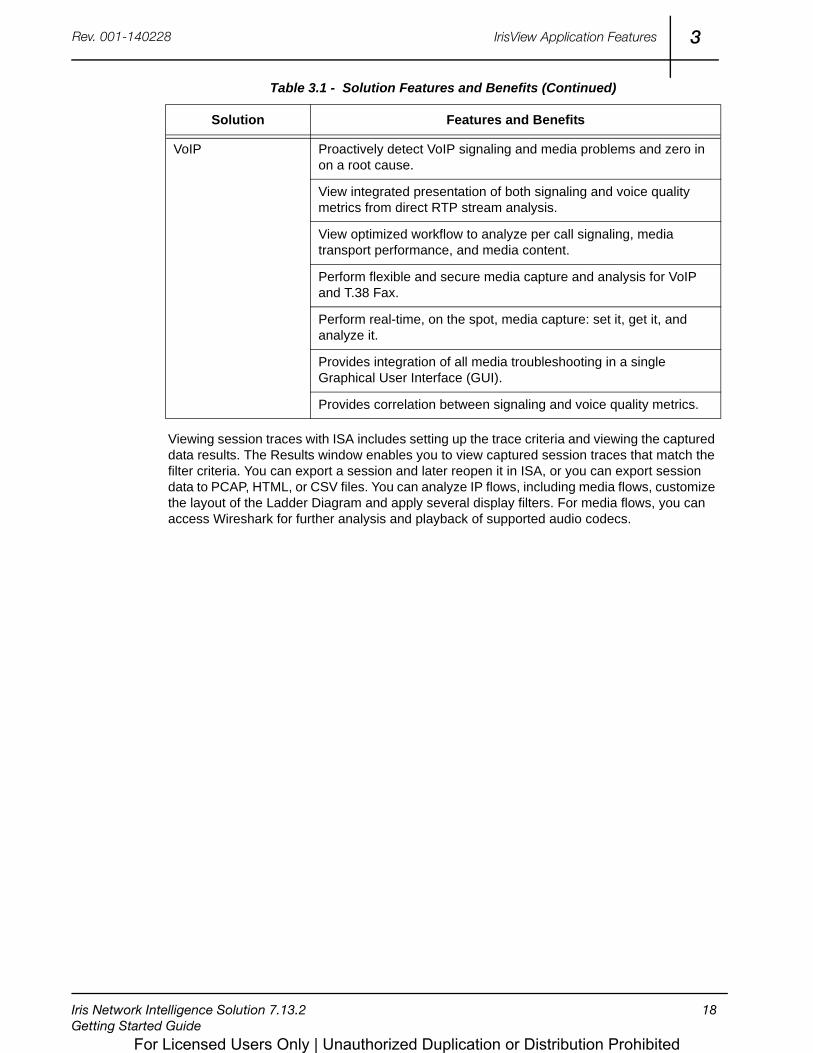
Viewing session traces with ISA includes setting up the trace criteria and viewing the captured data results. The Results window enables you to view captured session traces that match the filter criteria. You can export a session and later reopen it in ISA, or you can export session data to PCAP, HTML, or CSV files. You can analyze IP flows, including media flows, customize the layout of the Ladder Diagram and apply several display filters. For media flows, you can access Wireshark for further analysis and playback of supported audio codecs.
VoIP Proactively detect VoIP signaling and media problems and zero in on a root cause.
View integrated presentation of both signaling and voice quality metrics from direct RTP stream analysis.
View optimized workflow to analyze per call signaling, media transport performance, and media content.
Perform flexible and secure media capture and analysis for VoIP and T.38 Fax.
Perform real-time, on the spot, media capture: set it, get it, and analyze it.
Provides integration of all media troubleshooting in a single Graphical User Interface (GUI).
Provides correlation between signaling and voice quality metrics.
Table 3.1 - Solution Features and Benefits (Continued)
Solution Features and Benefits
For Licensed Users Only | Unauthorized Duplication or Distribution Prohibited
Iris Network Intelligence Solution 7.13.2 19Getting Started Guide
3IrisView Application FeaturesRev. 001-140228
PROTOCOL ANALYZER
Protocol Analyzer (PA) enables you to capture and view Protocol Data Unit (PDU) traffic from a combination of interfaces or monitored nodes in the network. PA leverages data from GeoProbe 2U, 14U, and G10 to provide advanced troubleshooting for network engineers.
Refer to the Iris Online Help for use cases, detailed description of user interface, video demos, examples, workflows, and reference topics.
Features and Benefits
Protocol Analyzer provides the following features and benefits:
Provides a single, common view across networks and sub-networks that may involve multiple SpIprobes and G10 probes
Provides a common view across mixed protocol stacks including TDM, ATM, and IP Ethernet
Provides a real-time capture of PDU traffic from G10 probes and SpIprobe 2Us and 14Us
Provides historical storage of PDU traffic from G10 probes and SpIprobe 2Us and 14Us by streaming messages directly to the probe for later recall
Provides a Wireshark display option that combines the power and reach of PA probes with the advanced display capabilities of Wireshark
Provides right-click filtering that enables you to easily filter a transaction in both directions and quickly create and apply display filters
Allows traffic from multiple links to be captured and monitored simultaneously providing a “time-stitched” view of network activity
Provides large buffer storage (up to one gigabyte per G10 probe/user session) that significantly improves the probability of capturing customer-impacting issues
Provides the opportunity to view multiple protocols for legacy and next-generation networks, providing you with the workflow convenience and power to view all protocols associated with an end-to-end call or data session
Provides advanced filtering capabilities used to quickly and efficiently pinpoint service delivery and quality issues that might negatively impact your customer's end-user experience
Provides industry standard format options (including RF5 and PCAP) to ensure captured data is compatible for use with 3rd party tools for additional analysis and reporting
For Licensed Users Only | Unauthorized Duplication or Distribution Prohibited
Iris Network Intelligence Solution 7.13.2 20Getting Started Guide
3IrisView Application FeaturesRev. 001-140228
IRIS TRAFFIC ANALYZER
Iris Traffic Analyzer (ITA) enables you to view the performance of your network and application resources. Deployed in conjunction with GeoProbe G10, it provides an intuitive and integrated end-to-end view of network traffic, protocol types, and application and host bandwidth usage.
ITA provides visibility into a carrier’s network traffic to categorize and monitor the following Top N (N=10) network resources. From these you can drill down to details including VLANs and Node and Node Group transactions, and even launch PA.
Links
Applications
Nodes and Node Groups
Refer to the Iris Online Help for use cases, detailed description of the user interface, ITA mind map, dashlet and KPI descriptions, and ITA workflow.
Features and Benefits
ITA provides the following features and benefits:
Assists operations and engineering teams with visibility into the network for advanced identification and resolution of network, service, and infrastructure performance issues, often before end users are impacted
Provides expanded solution capabilities that effectively handle the swell of mobile IP data traffic through improved workflows and enhanced usability that accommodates changing operational support models
Provides aggregated and real-time views of an extensive set of KPIs to measure performance of all aspects of IP traffic
Provides an opportunity to optimize manageability of traffic on a network by monitoring and profiling network traffic and minimizing churn exposure
Includes alarm capabilities to guard against the impact of emerging and unplanned performance issues
Enables you to set complex thresholds for specific KPIs to notify you when link, application, and node and node group benchmarks, volumes, or traffic rates are crossed
Monitors individual nodes for performance based on transactional metrics including volume, response code distribution, and latency by specific transaction types
Provides in near real-time all of the applications consuming bandwidth on the network
Provides the ability to deliver L2-L7 metrics which makes it possible to identify peak traffic volumes and address suspicious traffic patterns that could negatively impact the end user’s experience
For Licensed Users Only | Unauthorized Duplication or Distribution Prohibited
Iris Network Intelligence Solution 7.13.2 21Getting Started Guide
3IrisView Application FeaturesRev. 001-140228
Provides drill-through investigation tools allowing you to analyze UNKNOWN bandwidth utilization
IRIS PERFORMANCE INTELLIGENCE
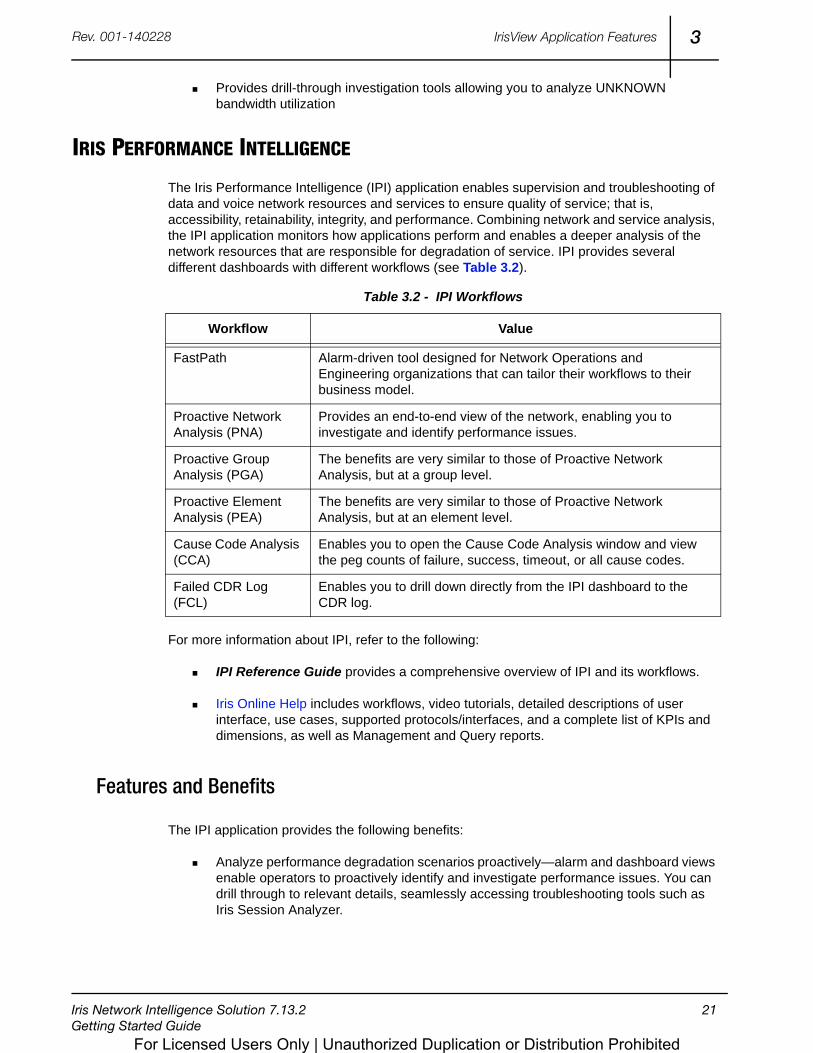
The Iris Performance Intelligence (IPI) application enables supervision and troubleshooting of data and voice network resources and services to ensure quality of service; that is, accessibility, retainability, integrity, and performance. Combining network and service analysis, the IPI application monitors how applications perform and enables a deeper analysis of the network resources that are responsible for degradation of service. IPI provides several different dashboards with different workflows (see Table 3.2).
For more information about IPI, refer to the following:
IPI Reference Guide provides a comprehensive overview of IPI and its workflows.
Iris Online Help includes workflows, video tutorials, detailed descriptions of user interface, use cases, supported protocols/interfaces, and a complete list of KPIs and dimensions, as well as Management and Query reports.
Features and Benefits
The IPI application provides the following benefits:
Analyze performance degradation scenarios proactively—alarm and dashboard views enable operators to proactively identify and investigate performance issues. You can drill through to relevant details, seamlessly accessing troubleshooting tools such as Iris Session Analyzer.
Table 3.2 - IPI Workflows
Workflow Value
FastPath Alarm-driven tool designed for Network Operations and Engineering organizations that can tailor their workflows to their business model.
Proactive Network Analysis (PNA)
Provides an end-to-end view of the network, enabling you to investigate and identify performance issues.
Proactive Group Analysis (PGA)
The benefits are very similar to those of Proactive Network Analysis, but at a group level.
Proactive Element Analysis (PEA)
The benefits are very similar to those of Proactive Network Analysis, but at an element level.
Cause Code Analysis (CCA)
Enables you to open the Cause Code Analysis window and view the peg counts of failure, success, timeout, or all cause codes.
Failed CDR Log (FCL)
Enables you to drill down directly from the IPI dashboard to the CDR log.
For Licensed Users Only | Unauthorized Duplication or Distribution Prohibited
Iris Network Intelligence Solution 7.13.2 22Getting Started Guide
3IrisView Application FeaturesRev. 001-140228
Complete visibility into service performance—User and Control Plane KPIs provide extensive metrics to enable multi-dimensional analysis of service performance. You can quickly identify impacted URLs due to under-performing nodes.
Comprehensive service modeling—Customized KPIs, nodes, and thresholds are available to model any service. First, select a node type to isolate specific KPI threshold violations. Then pinpoint the most impacted objects and drill down to isolate the root cause. From alarms to root cause in three clicks.
Measure network quality—The IPI Proactive Network Analysis workflows support operators to ensure the network is operating at peak performance to better serve corporate accounts and individual consumer subscribers.
Optimize performance based on use—Discover untapped revenue opportunities and maximize customer experience using Handset and Device analysis. Benchmark the impact on services by vendor and device/handset type, such as Transactions versus Volume. Measure the impact of operator settings on handset and device performance.
Flexible information sharing between systems—Today Carriers operate in an environment where multiple operations support systems (OSS) provide information that help users do their jobs. The KPI Export feature facilitates information sharing among systems, which is essential when many OSSs are involved. The KPI Export feature allows more precise, flexible information sharing among systems, by allowing carriers to configure the information they need and export it routinely.
Track end-to-end service usage—The IPI application Performance Analysis workflows help operators validate market forecasts and benchmark actual service uptake for more informed expansion planning. When paired with FastPath, the end-to-end customer experience with new services may be proactively monitored to throttle usage, uptake, and customer satisfaction—ensuring profit targets are met.
Lower the total cost of ownership—A single tool for both network and application performance monitoring, IPI features integrated workflows designed to reduce analysis and troubleshooting time. Independent of the underlying network technology, IPI is easily extended for use with new protocols and new applications, reducing employee training time and enhancing overall productivity.
Prioritize High Value Account Subscriber analysis—Focus troubleshooting analysis on groups of High Value Account subscribers which are identified as IMSI groups, Mobile Station IP address Pool, or in-roamers characterized by PLMN and Country. Thanks to a Proactive Group Analysis workflow, you can easily identify the HVA groups with the worst performance and quickly identify the root cause when they experience poor service.
Focus the analysis on specific node groups—Filtering on specific flat or hierarchical network node groups enables you to quickly identify the network portion that is more relevant for the different departments that are using IPI. This enables different users to work more efficiently, allowing them to focus on the network portion for which they are responsible or in which they are interested.
The Failure Cause Analysis dashboard provides operators with a network-level view of all failures across the network at any given instance over time. Operators can use this dashboard to proactively troubleshoot and resolve network issues as they arise, before a large network outage occurs.
For Licensed Users Only | Unauthorized Duplication or Distribution Prohibited
Iris Network Intelligence Solution 7.13.2 23Getting Started Guide
3IrisView Application FeaturesRev. 001-140228
The Proactive Element Analysis workflow enables you to analyze the behavior of the network focusing on specific elements, such as APNs, Handset, or Network nodes.
IRIS ALARMS
The Alarms feature enables you to manage alarm policies and monitor existing ITA, IPI, ACE, KPI Studio, and system-level alarms. The Policy Management area enables you to define performance thresholds for supported Iris applications.
Refer to Iris Online Help for use cases, video tutorials, and detailed GUI descriptions. Refer to IPI Reference Guide for overview information about Alarms.
Features and Benefits
The IrisView Alarm application provides the following benefits:
Modern UI framework—provides a unified, consistent framework using the latest Web and GUI technologies
Centralized policy management—provides a common alarming configuration framework across Iris applications
A unified view across Iris applications—you can view alarms/events from different applications as well as system-level alarms simultaneously in an alarm dashboard
A standardized way of defining policies (complex rule sets) and alarms across multiple applications
A way to evaluate threshold violations on complex combinations of KPIs and KQIs—all dimensions available for a specific KPI or KQI can be used to trigger an alarm.
User Interface
Alarms are managed through the IrisView Alarms Management application, which provides critical information to carriers on the performance of provisioned network elements through the use of Alarm Policies. With Alarm Policies, carriers can establish a set of guiding principles to manage KPI threshold configuration to optimize the performance of network elements. The system administrator can define policies using the Policy Management dashboard.
For Licensed Users Only | Unauthorized Duplication or Distribution Prohibited
Iris Network Intelligence Solution 7.13.2 24Getting Started Guide
3IrisView Application FeaturesRev. 001-140228
HISTORICAL REPORTING
The historical reporting feature enables you to track and analyze what applications are used, how much they are used, where they are used, with what device they are used, what load they generate on the network, and how well the network supports the load. For more information about historical reporting, refer to the following:
IPI Reference Guide includes an overview of IPI Historical Reports.
Iris Online Help includes video tutorials, detailed descriptions of user interface, sample reports, and workflows
Features and Benefits
IrisView enables you to generate two different types of reports using the Cognos reporting engine: Management Reports which are predefined for each supported IPI interface and Query Reports, which you can define using IPI KPIs and dimensions.
Management Reports
The Iris system leverages collected data for longer term reporting with a reporting component that includes predefined reports. These Management Reports provide you with the following capabilities:
Deliver simple reports to key business owners on demand
Schedule routine reports to meet the needs of downstream organizations
Gain valuable insight into traffic trends with short- and long-term reporting options
Build the case for further investigation of network hot spots, validation of capacity spending allocations or selection of regions for service introductions
Query Reports
Using the Cognos Query Studio application, you can visually build reports that meet your organization’s needs. Query Reports provide you with the following capabilities:
Create custom reports on demand using drag/drop functionality
Customize column calculations using your own equations for more in-depth analysis of your output data
Set your own preferences for presentation format, scheduling, delivery, output media, and many other options
For Licensed Users Only | Unauthorized Duplication or Distribution Prohibited
Iris Network Intelligence Solution 7.13.2 25Getting Started Guide
3IrisView Application FeaturesRev. 001-140228
AUTOMATED CONTROLLER ENGINE
The Automated Controller Engine (ACE) enables automated interworking between Tektronix network management and active test solutions. ACE enables Service Providers to automatically initiate actions, such as active tests, driven by the data monitored and correlated by the GeoProbe family. Automating routine actions helps to resolve issues faster by focusing resources on root cause analysis, rather than on data collection tasks or manual trial-and-error testing. The rules-based IrisView Policy Engine enables users to define the specific network conditions or events which trigger ACE to take action.
Refer to Iris Online Help for use cases, video demos, and to download the ACE User Guide.
Features and Benefits
The ACE application provides the following features and benefits:
Define policies that identify specific network events, such as low MOS or one-way audio problems.
Automatically launch active tests to validate, isolate, and quantify the impact of these network events.
View a summary of the events that occurred together with the results of the tests.
Resolve issues faster and with fewer resources by automating routine troubleshooting procedures and test plans to confirm or rule out common faults.
Automate workflows that include custom script actions.
You use the Iris Policy Management application to define the network conditions that will trigger ACE to initiate an action. Network conditions are determined by setting performance thresholds on the KPIs. You can add GeoProbe Statistical Event Alarm KPIs and IPI KPIs to ACE policies.
IRISVIEW NETWORK MAPS
With the integration of IrisView Network Maps into the Iris suite of products, Tektronix Communications has provided the next step in monitoring real-time status of network elements. IrisView Network Maps is a web-based application that shows the status of network elements on a geographic map using GIS—geographic information system. Users can look at the status of network elements monitored by both GeoProbe SpIprobe and GeoProbe G10 on a single map. Well-known map visualization tools such as zooming and panning provide intuitive mechanisms to explore the available data. Users can view portions of the network with the selection of map layers. The georeferenced support is an important aid in troubleshooting network issues from a geographical view.
The IrisView Network Maps application allows operators to proactively monitor the status of the network with real-time feedback. Users can take corrective actions by seamlessly accessing other IrisView tools such as Iris Session Analyzer (ISA), Protocol Analyzer (PA), and Alarm Dashboard to determine the root cause of network problems. IrisView Network Maps supports Iris Traffic Analyzer (ITA), system-level, and GeoProbe alarms. Any alarm displayed in the Alarm Dashboard can be cleared and acknowledged in the Alarm Browser; see Iris Alarms.
For Licensed Users Only | Unauthorized Duplication or Distribution Prohibited
Iris Network Intelligence Solution 7.13.2 26Getting Started Guide
3IrisView Application FeaturesRev. 001-140228
Features and Benefits
IrisView Network Maps provides the following features and benefits:
Easy and comprehensive network status for all SPI and G10 elements
One-click access to the IrisView Alarm Dashboard, ISA, and PA
Web-based platform
Minimal configuration to migrate from GeoProbe Network Status
IrisView Network Maps provides users with a geographical display of the network. All provisioned probes are automatically displayed on the map per geographical coordinates. Users can have a summary or detailed view using the GIS zooming capabilities.
MYIRISVIEW
The myIrisView application enables the creation of a personalized IrisView homepage for selected Iris Performance Intelligence and Iris Traffic Analyzer dashlets. With this functionality users can preset dashlet filters and screen locations that may be recalled with each login. When a network issue is detected, users can drill down to the native application and drive to the root cause of the failure.
Features and Benefits
myIrisView allows users to focus on specific network nodes, interfaces, statistics, and KPIs which streamlines the troubleshooting process and leads to lower Mean Time to Resolve (MTTR). myIrisView is especially useful during maintenance windows where operators need to monitor the effects of specific network upgrades. Maintenance changes increase the probability of network outages and myIrisView enables the user to determine if the upgrade has impacted network performance.
The myIrisView user interface includes the following features:
Customizable dashboard containing IPI and/or ITA dashlets that provide information about network components. Users can reposition and resize dashlets and zoom in or out on the chart data.
Global Filters pane that enables users to set the time filter. The pane is displayed after at least one dashlet has been created.
Export feature to export the dashboard or dashlets to a CSV file or PDF.
For Licensed Users Only | Unauthorized Duplication or Distribution Prohibited

Iris Network Intelligence Solution 7.13.2 27Getting Started Guide
3IrisView Application FeaturesRev. 001-140228
KPI STUDIO
KPI Studio is designed to allow customized changes to KPIs outside of the release cycle without requiring core software updates. KPI Studio is based on the concept of the Service Model, which enables you to leverage the available data stored within your network by defining in a transparent, flexible manner, the KPIs you need to make technical and business decisions.
Features and Benefits
KPI Studio Service Models allow experts to design customized KPIs that address questions such as:
Are my network assets assuring my services?
What was the impact of the temporary failure or downtime of node ABC on the service integrity for my subscriber base between 4 and 5 P.M. yesterday?
Can I find a trend in the usage pattern of subscriber demographic A using handset B in location area C between the evening peak hour every weekday?
Are my highest revenue-generating subscribers accessing their services and with the optimal QoS parameters in 90% of the time?
Did the new handset I launched last month warrant a revision of provisioned QoS parameters based on the service usage the handset exhibits?
IRIS SYSTEM HEALTH REPORTS
Iris System Health reports enable Iris infrastructure administrators to maintain and ensure the functionality of the Iris system.
Features and Benefits
Iris System Health reports provide the following benefits:
Reports that enable Iris infrastructure administrators to proactively manage probes, servers, and XDR capacity.
Front-end web interface from which Iris infrastructure administrators can access vital probe statistics such as line rates without having to log in to probes.
Customizable querying and notification capabilities.
For Licensed Users Only | Unauthorized Duplication or Distribution Prohibited