IrIs Gardens
41
OFFERING MEMORANDUM IRIS GARDENS 341 NORTH ROCKVALE AVENUE | AZUSA, CA CAPITAL MARKETS | INVESTMENT PROPERTIES
Transcript of IrIs Gardens

OFFERING MEMORANDUM
IrIs Gardens341 North rockvale aveNue | azusa, ca
CAPITAL MARKETS | INVESTMENT PROPERTIES

3 EXECUTIVE SUMMARY
14 FINANCIAL ANALYSIS
24 RENT COMPARABLES
33 SALE COMPARABLES
TABLE OF CONTENTS
© 2020 CBRE, INC. ALL RIGHTS RESERVED.

eXecutIve suMMarY
INVESTMENT HIGHLIGHTS• opportunity to assume favorable financing with interest only
payments due through maturity
• high historical occupancy of 95% or higher over the past three years
• only nine years left in extended use period with opportunity to convert to market rate
• rents well below market rate rents by an average of $393 and below maximum allowable lIhtc rents by an average of $103
• historical aMI growth has averaged 6.34% annually over the past three years
PROPERTY FEATURES• a mix of one-, two-, and three-bedroom units featuring
garbage disposal and air conditioning
• community amenities include gated access, on-site laundry facility, courtyards, and leasing office
DESIRABLE LOCATION• centrally located, Iris Gardens is less than two miles away
from downtown azusa and azusa Pacific university, as well as only 35 minutes from downtown los angeles
• easy access to los angeles proper through the nearby bus stops and adjacent train station in covina, just three miles away
IrIs Gardens341 NORTH ROCkVALE AVENUE
AzUSA, CA 91702
Price: $23,000,000
Price per unit: $191,667
Price per square foot: $247
lIhtc - Family
units: 120
rentable square feet: 93,282
Year built: 1961 & 1962
Year renovated: 2000
Year 0 cap rate: 5.24%
12-year leveraged Irr: 13.89%
12-year average cash-on-cash: 8.64%
Initial tccP ended: 2014
Final year of lIhtc restrictions: 2029
eXecutIve suMMarY
IrIs GardeNs | 4

AFFORDABLE RESTRICTIONS
PROPERTY DETAILS
INItIal tccP eNded: 2014
FINal Year oF restrIctIoNs: 2029
• lIhtc lura: restricts 118 units at 60% aMI. two units will be occupied as staff units
• 56 units are occupied by residents utilizing section 8 vouchers
Iris Gardens currently operates under the section 42 low Income housing tax credit (lIhtc) program, and has the following restrictions. Buyer must agree to maintain the affordable restrictions through the extended use period, including operating the property in compliance with state and federal regulatory agreements.
los aNGeles couNtY, ca (los aNGeles - loNG Beach - GleNdale, ca
hud Metro FMr area, state Msa)
2020 4-PersoN aMI: $77,300
2020 INCOME L IMITS 60% AMI
1 person $47,340
2 people $54,060
3 people $60,840
4 people $67,560
5 people $73,020
6 people $78,420
YEAR BUILT 1961 & 1962
YEAR RENOVATED 2000
NUMBER OF BUILDINGS 5 (4 residential | 1 leasing office)
NUMBER OF UNITS 120
NUMBER OF STORIES 2
PARCEL NUMBER 8612-020-027
8612-020-019
8612-020-006
zONING Multi-Family residential
LOT SIzE 2.29 acres
DENSITY 51.96 units/acre
PARkING SPACES 138
PARkING RATIO 1.15 spaces/unit
LANDSCAPING trees, shrubs, grass, bushes, and flowers
TOPOGRAPHY Flat
IN-UNIT WASHER/DRYER No
WASHER/DRYER CONNECTIONS No
RENTAL WASHERS/DRYERS No
WATER azusa light and Water company
ELECTRIC azusa light and Water company
GAS socal Gas company
FOUNDATION slab on grade
EXTERIOR stucco and siding
PARkING SURFACE asphalt
ROOF Flat
HVAC Wall units
eXecutIve suMMarY
IrIs GardeNs | 5

IrIs Gardens
IrIs Gardens
REGIONAL MAP
LOCAL MAP
aZUsa PaCIFIC UnIVersITY
UnIVersITY OF CaLIFOrIna, LOs anGeLes
UnIVersITY OF sOUTHern CaLIFOrnIa
MaGnOLIa eLeMenTarY sCHOOL
aZUsa HIGH sCHOOL
CITrUs COLLeGe
FOOTHILL MIddLe sCHOOL
eManaTe HeaLTH FOOTHILL PresBYTerIan HOsPITaL
HansOn dIsTrIBUTInG CO
TarGeT HeadQUarTers
WaLT dIsneY sTUdIOs
sanTa Fe daM reCreaTIOn area
COsTCO
COsTCO
sUPerIOr GrOCers
HOMe dePOT COVIna sQUare sHOPPInG CenTer
aZUsa
LOnG BeaCH
Pasadena
aZUsa InTerMOdaL TransIT CenTer
COVIna sTaTIOn
raGInG WaTers LOs anGeLes
KnOTT’s BerrY FarM
210
210
GLendOra COUnTrY
CLUB
CHInO HILLs sTaTe ParK
OnTarIO InTernaTIOnaL aIrPOrT
LOs anGeLes InTernaTIOnaL aIrPOrT
aZUsa
anaHeIM
rIVersIde
LOs anGeLes
dIsneYLand ParK
aZUsa rIVersIdeLOs anGeLes Ir Is GardeNs | 6
eXecutIve suMMarY
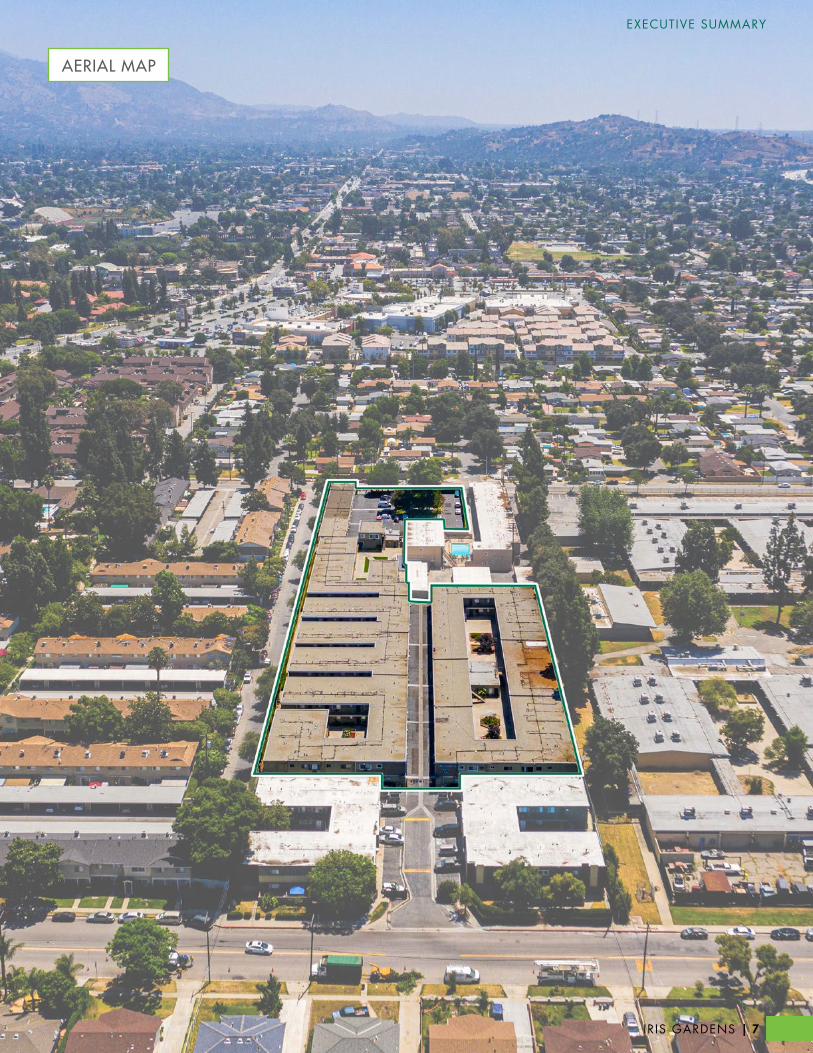
AERIAL MAP
eXecutIve suMMarY
IrIs GardeNs | 7

UNIT AMENITIESGarbage disposal | air conditioning
CLICK Here TO aCCess VIrTUaL UnIT TOUr
eXecutIve suMMarY
IrIs GardeNs | 8

COMMUNITY AMENITIESGated access | on-site laundry facility | courtyards | leasing office
eXecutIve suMMarY
IrIs GardeNs | 9
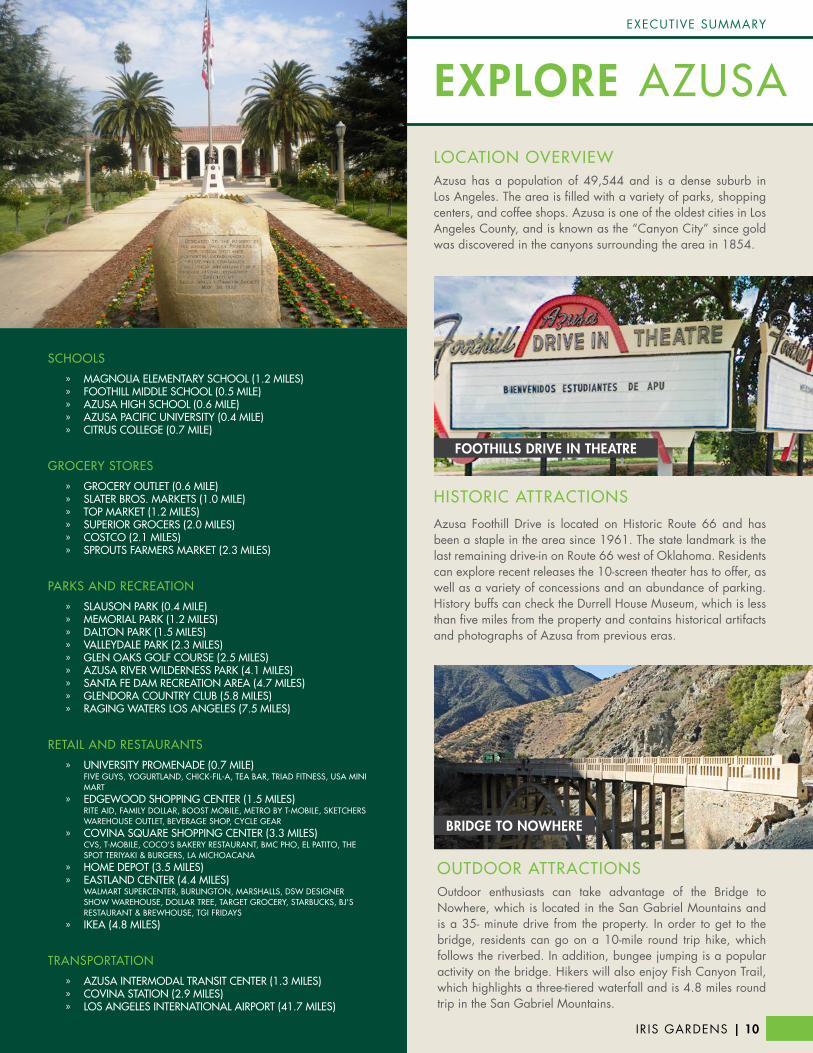
SCHOOLS
» MAGNOLIA ELEMENTARY SCHOOL (1.2 MILES) » FOOTHILL MIDDLE SCHOOL (0.5 MILE) » AzUSA HIGH SCHOOL (0.6 MILE) » AzUSA PACIFIC UNIVERSITY (0.4 MILE) » CITRUS COLLEGE (0.7 MILE)
GROCERY STORES
» GROCERY OUTLET (0.6 MILE) » SLATER BROS. MARkETS (1.0 MILE) » TOP MARkET (1.2 MILES) » SUPERIOR GROCERS (2.0 MILES) » COSTCO (2.1 MILES) » SPROUTS FARMERS MARkET (2.3 MILES)
PARkS AND RECREATION
» SLAUSON PARk (0.4 MILE) » MEMORIAL PARk (1.2 MILES) » DALTON PARk (1.5 MILES) » VALLEYDALE PARk (2.3 MILES) » GLEN OAkS GOLF COURSE (2.5 MILES) » AzUSA RIVER WILDERNESS PARk (4.1 MILES) » SANTA FE DAM RECREATION AREA (4.7 MILES) » GLENDORA COUNTRY CLUB (5.8 MILES) » RAGING WATERS LOS ANGELES (7.5 MILES)
RETAIL AND RESTAURANTS
» UNIVERSITY PROMENADE (0.7 MILE)FIVE GUYS, YOGURTLAND, CHICk-FIL-A, TEA BAR, TRIAD FITNESS, USA MINI MART
» EDGEWOOD SHOPPING CENTER (1.5 MILES)RITE AID, FAMILY DOLLAR, BOOST MOBILE, METRO BY T-MOBILE, SkETCHERS WAREHOUSE OUTLET, BEVERAGE SHOP, CYCLE GEAR
» COVINA SQUARE SHOPPING CENTER (3.3 MILES)CVS, T-MOBILE, COCO’S BAkERY RESTAURANT, BMC PHO, EL PATITO, THE SPOT TERIYAkI & BURGERS, LA MICHOACANA
» HOME DEPOT (3.5 MILES) » EASTLAND CENTER (4.4 MILES)
WALMART SUPERCENTER, BURLINGTON, MARSHALLS, DSW DESIGNER SHOW WAREHOUSE, DOLLAR TREE, TARGET GROCERY, STARBUCkS, BJ’S RESTAURANT & BREWHOUSE, TGI FRIDAYS
» IkEA (4.8 MILES)
TRANSPORTATION
» AzUSA INTERMODAL TRANSIT CENTER (1.3 MILES) » COVINA STATION (2.9 MILES) » LOS ANGELES INTERNATIONAL AIRPORT (41.7 MILES)
eXPLOre AzUSALOCATION OVERVIEWazusa has a population of 49,544 and is a dense suburb in los angeles. the area is filled with a variety of parks, shopping centers, and coffee shops. azusa is one of the oldest cities in los angeles county, and is known as the “canyon city” since gold was discovered in the canyons surrounding the area in 1854.
HISTORIC ATTRACTIONS
azusa Foothill drive is located on historic route 66 and has been a staple in the area since 1961. the state landmark is the last remaining drive-in on route 66 west of oklahoma. residents can explore recent releases the 10-screen theater has to offer, as well as a variety of concessions and an abundance of parking. history buffs can check the durrell house Museum, which is less than five miles from the property and contains historical artifacts and photographs of azusa from previous eras.
OUTDOOR ATTRACTIONSoutdoor enthusiasts can take advantage of the Bridge to Nowhere, which is located in the san Gabriel Mountains and is a 35- minute drive from the property. In order to get to the bridge, residents can go on a 10-mile round trip hike, which follows the riverbed. In addition, bungee jumping is a popular activity on the bridge. hikers will also enjoy Fish canyon trail, which highlights a three-tiered waterfall and is 4.8 miles round trip in the san Gabriel Mountains.
FOOTHILLs drIVe In THeaTre
BrIdGe TO nOWHere
eXecutIve suMMarY
IrIs GardeNs | 10

OVERVIEWazusa Pacific university (aPu) offers over 150 degree options from bachelor’s to doctorate and is located 26 miles northeast of los angeles. aPu offers seven other locations in southern california: orange county, los angeles, san diego, Inland empire, high desert, Monrovia, and Murrieta.
the campus offers a variety of events, programs, and resources to enhance the college experience for students. aPu gives the opportunity to join a plethora of undergraduate clubs and organizations like aPu dance team, asl club, club social Work, the dream Project, aPu robotics, and much more. students can stay active by participating in the intramural sports programs the university has to offer, including men’s flag football, co-ed indoor volleyball, co-ed softball, and group fitness classes like zumba and cardio kickboxing.
For performing arts and social events, students can attend Fall Fest, which is a concert and festival hosted during the beginning of the year. also, expression Nights take place during the evenings where the aPu community can learn about other cultures through music, performances, and food.
aZUsa PaCIFIC UNIVERSITY
1 OF 124 InsTITUTIOns IN “BesT WesTern COLLeGes” OF THE 2019 BEST COLLEGES GUIDE BY THE PRINCETON REVIEW
NAMED ONE OF U.S. NEWS & WORLD REPORT’S aMerICa’s BesT COLLeGes 2020 edITIOn LIsT
QUICK FaCTsFOUNDED: 1899
TOTAL ENROLLMENT: 9,501
DEGREES OFFERED: 68 BaCHeLOrs, 48
MasTer’s, 18 CerTIFICaTes, 10 CredenTIaLs, and 9 dOCTOraL PrOGraMs
ACCEPTANCE RATE: 60%
eXecutIve suMMarY
IrIs GardeNs | 11
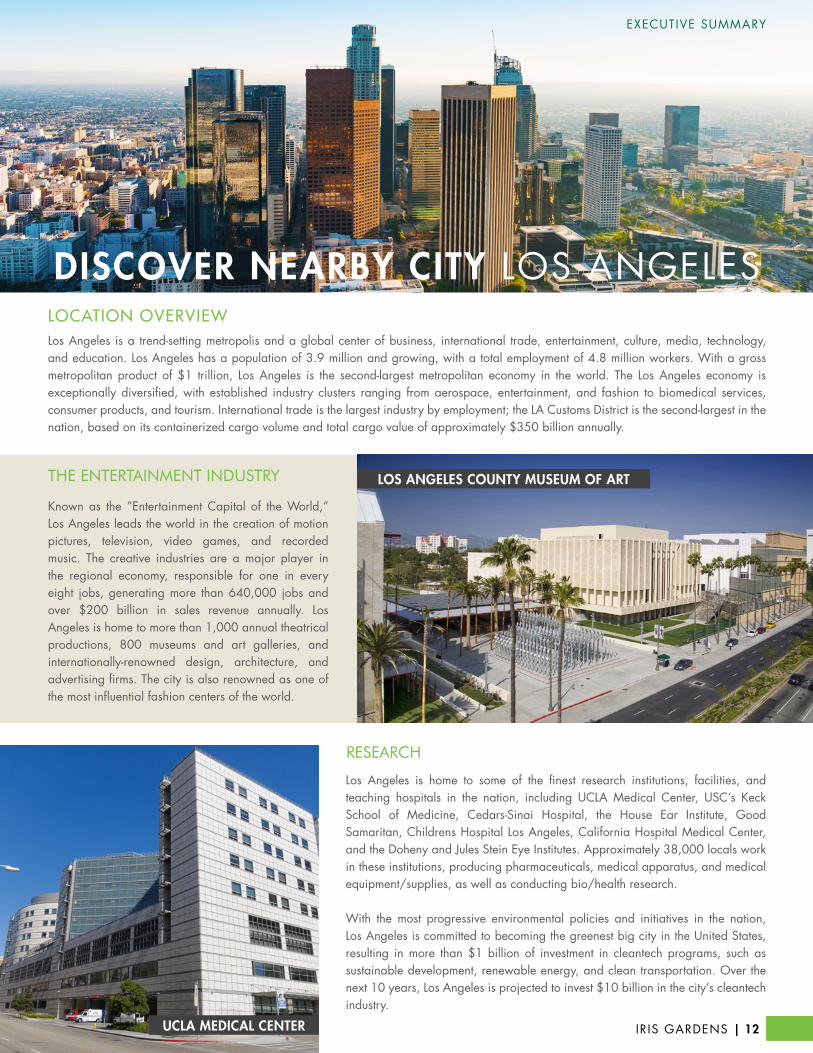
dIsCOVer nearBY CITY los aNGelesLOCATION OVERVIEWlos angeles is a trend-setting metropolis and a global center of business, international trade, entertainment, culture, media, technology, and education. los angeles has a population of 3.9 million and growing, with a total employment of 4.8 million workers. With a gross metropolitan product of $1 trillion, los angeles is the second-largest metropolitan economy in the world. the los angeles economy is exceptionally diversified, with established industry clusters ranging from aerospace, entertainment, and fashion to biomedical services, consumer products, and tourism. International trade is the largest industry by employment; the la customs district is the second-largest in the nation, based on its containerized cargo volume and total cargo value of approximately $350 billion annually.
los angeles is home to some of the finest research institutions, facilities, and teaching hospitals in the nation, including ucla Medical center, usc’s keck school of Medicine, cedars-sinai hospital, the house ear Institute, Good samaritan, childrens hospital los angeles, california hospital Medical center, and the doheny and Jules stein eye Institutes. approximately 38,000 locals work in these institutions, producing pharmaceuticals, medical apparatus, and medical equipment/supplies, as well as conducting bio/health research.
With the most progressive environmental policies and initiatives in the nation, los angeles is committed to becoming the greenest big city in the united states, resulting in more than $1 billion of investment in cleantech programs, such as sustainable development, renewable energy, and clean transportation. over the next 10 years, los angeles is projected to invest $10 billion in the city’s cleantech industry.
UCLa MedICaL CenTer
RESEARCH
known as the ”entertainment capital of the World,” los angeles leads the world in the creation of motion pictures, television, video games, and recorded music. the creative industries are a major player in the regional economy, responsible for one in every eight jobs, generating more than 640,000 jobs and over $200 billion in sales revenue annually. los angeles is home to more than 1,000 annual theatrical productions, 800 museums and art galleries, and internationally-renowned design, architecture, and advertising firms. the city is also renowned as one of the most influential fashion centers of the world.
THE ENTERTAINMENT INDUSTRY LOs anGeLes COUnTY MUseUM OF arT
eXecutIve suMMarY
IrIs GardeNs | 12
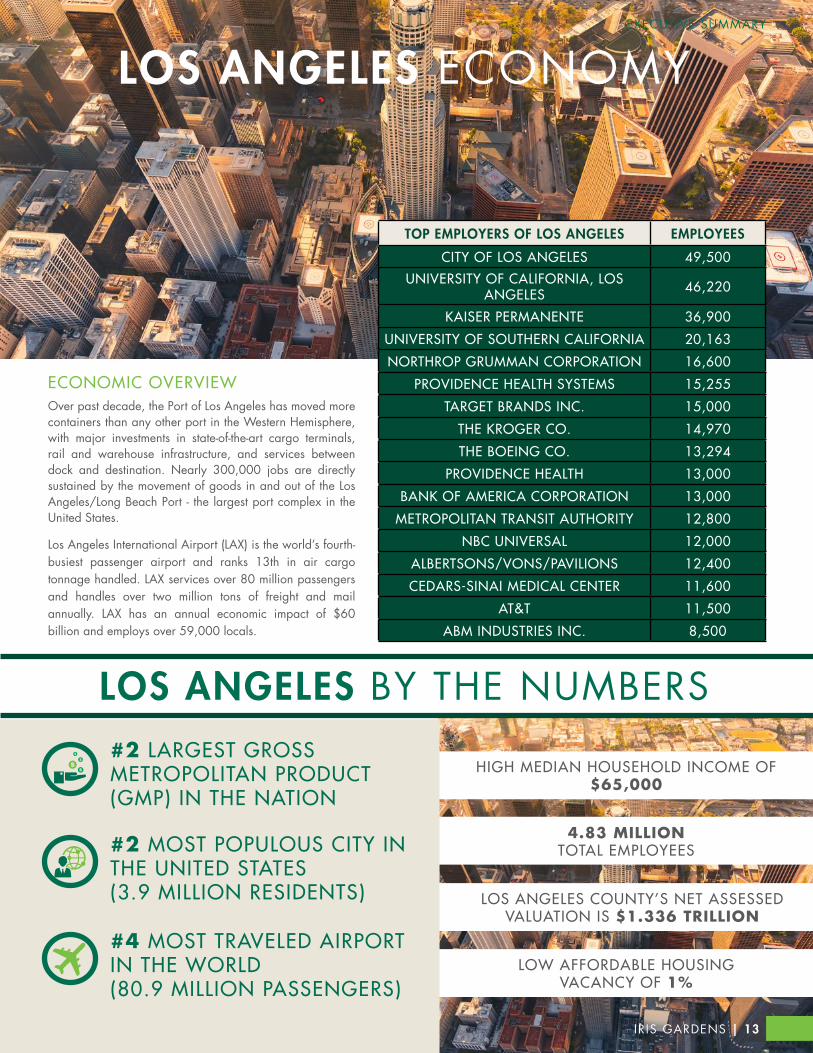
TOP eMPLOYers OF LOs anGeLes eMPLOYees
CITY OF LOS ANGELES 49,500
UNIVERSITY OF CALIFORNIA, LOS ANGELES 46,220
kAISER PERMANENTE 36,900
UNIVERSITY OF SOUTHERN CALIFORNIA 20,163
NORTHROP GRUMMAN CORPORATION 16,600
PROVIDENCE HEALTH SYSTEMS 15,255
TARGET BRANDS INC. 15,000
THE kROGER CO. 14,970
THE BOEING CO. 13,294
PROVIDENCE HEALTH 13,000
BANk OF AMERICA CORPORATION 13,000
METROPOLITAN TRANSIT AUTHORITY 12,800
NBC UNIVERSAL 12,000
ALBERTSONS/VONS/PAVILIONS 12,400
CEDARS-SINAI MEDICAL CENTER 11,600
AT&T 11,500
ABM INDUSTRIES INC. 8,500
LOs anGeLes ecoNoMY
ECONOMIC OVERVIEWover past decade, the Port of los angeles has moved more containers than any other port in the Western hemisphere, with major investments in state-of-the-art cargo terminals, rail and warehouse infrastructure, and services between dock and destination. Nearly 300,000 jobs are directly sustained by the movement of goods in and out of the los angeles/long Beach Port - the largest port complex in the united states.
los angeles International airport (laX) is the world’s fourth-busiest passenger airport and ranks 13th in air cargo tonnage handled. laX services over 80 million passengers and handles over two million tons of freight and mail annually. laX has an annual economic impact of $60 billion and employs over 59,000 locals.
LOs anGeLes BY the NuMBers
HIGH MEDIAN HOUSEHOLD INCOME OF $65,000
4.83 MILLION TOTAL EMPLOYEES
LOS ANGELES COUNTY’S NET ASSESSED VALUATION IS $1.336 TRILLION
LOW AFFORDABLE HOUSING VACANCY OF 1%
Ir Is GardeNs | 13
eXecutIve suMMarY
#4 MOST TRAVELED AIRPORT IN THE WORLD (80.9 MILLION PASSENGERS)
#2 MOST POPULOUS CITY IN THE UNITED STATES (3.9 MILLION RESIDENTS)
#2 LARGEST GROSS METROPOLITAN PRODUCT (GMP) IN THE NATION

FINaNcIal aNalYsIs

PROPERTY INFORMATION
Iris Gardens General Partner341 North Rockvale Avenue Limited PartnerAzusa, CA 91702 ManagementLos Angeles County
Placed In ServiceYear Built/Renovated End of TCCPNumber of Units Final Year of LIHTC RestrictionsProperty Type Final Year of Other Restrictions
Qualified Contract EligibleProjected Closing Date Right of First RefusalHold Period Opportunity Zone
Unhide for Multiple Phases
YIELD ANALYSIS
Purchase PricePer UnitPer SF Total Debt
Aggregate LTVTotal Acquisition Costs Aggregate LTCCost Per UnitCost Per SF Equity
ProfitExit Cap Rate MultipleExit Cost of Sale
Current Year 0 Year 1 Year 2 Year 3 Year 4 Year 5 Year 6 Year 7 Year 8 Year 9 Year 10 Year 11 Year 12
Cash-on-Cash Return 5.00% 5.62% 6.29% 6.79% 7.32% 7.87% 8.31% 8.76% 9.23% 9.71% 6.01%
Cash-on-Cash Post Refinance 6.20% 11.25% 15.99%
Cap Rate 4.96% 5.24% 5.53% 5.76% 6.00% 6.24% 6.44% 6.64% 6.85% 7.06% 7.28% 6.89% 8.02% 9.08%
Cap Rate on Cost 4.89% 5.16% 5.45% 5.68% 5.91% 6.15% 6.34% 6.54% 6.75% 6.96% 7.17% 6.78% 7.90% 8.95%
Average Loan Constant 4.80% 4.80% 4.80% 4.80% 4.80% 4.80% 4.80% 4.80% 4.80% 4.80% 6.35% 6.45% 6.57% 6.69%
Cap Rate on Cost Arbitrage 0.09% 0.36% 0.65% 0.88% 1.11% 1.35% 1.54% 1.74% 1.95% 2.16% 0.83% 0.33% 1.33% 2.26%
Amortizing DSCR 1.82 1.92 2.03 2.11 2.20 2.28 2.36 2.43 2.51 2.59 1.33 1.25 1.46 1.65
Internal Rate of Return 19.21% 17.00% 16.12% 15.18% 14.58% 14.16% 13.84% 13.58% 10.60% 12.74% 13.97% 13.89%
Cash-on-Cash
Adjusted Equity (Year 9)
56.9%56.1%
$10,258,870
3.42x$24,852,234
Year 1 Cap Rate
5.53%$1,272,979 NOI
1961 & 1962 / 2000120
LIHTC - Family
November 1, 202012 Years
December 31, 2014June 30, 2000
2029 (Ext Use: 15 Yrs)
NoNoYes
IRR
$13,087,000
$1,205,102 NOI
Year 10 Cash-on-Cash
6.20%8.64% 12-Yr Avg Cash-on-Cash $23,000,000 Price
Year 0 Cap Rate
13.89%12-Yr Leveraged IRR
Adjusted Multiple 5.81x
Fountain Management, LLCNone
FPI Management
$247
$23,345,870$194,549
$250
5.25%2.25%
5.24%$23,000,000 Price
$23,000,000$191,667
Year 9 Cash-on-Cash
6.01%6.80% 3-Yr Avg
$5,167,001
0%
2%
4%
6%
8%
10%
12%
14%
16%
18%
YR 1 YR 2 YR 3 YR 4 YR 5 YR 6 YR 7 YR 8 YR 9 YR 10 YR 11 YR 12
Cash-on-Cash Return
0%
5%
10%
15%
20%
25%
YR 1 YR 2 YR 3 YR 4 YR 5 YR 6 YR 7 YR 8 YR 9 YR 10 YR 11 YR 12
Internal Rate of Return
Ir Is GardeNs | 15 CLICk HERE TO ACCESS DUE DILIGENCE
FINaNcIal aNalYsIs
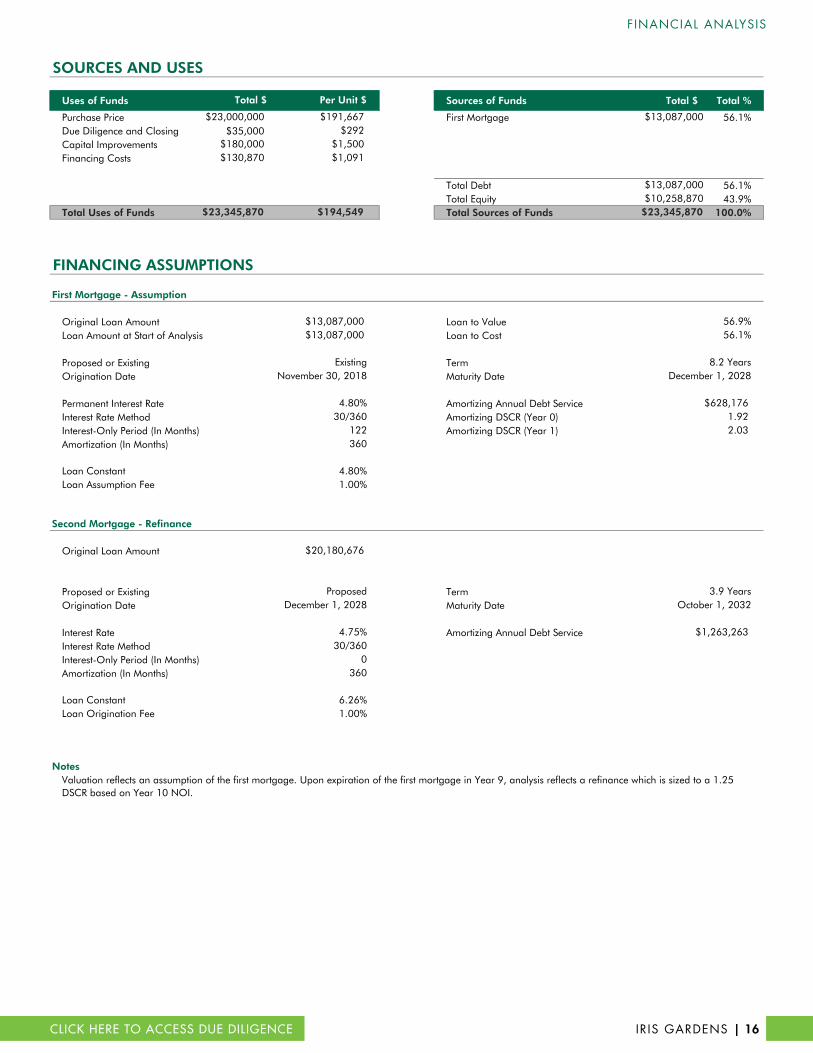
SOURCES AND USES
Uses of Funds Sources of Funds Total $ Total %
Purchase Price First Mortgage 56.1%Due Diligence and Closing $35,000 Second Mortgage 0.0%Capital Improvements Third Mortgage 0.0%Financing Costs Fourth Mortgage 0.0%
Fifth Mortgage 0.0%Total Debt 56.1%Total Equity 43.9%
Total Uses of Funds Total Sources of Funds 100.0%
FINANCING ASSUMPTIONS
First Mortgage - Assumption
Original Loan Amount Loan to ValueLoan Amount at Start of Analysis Loan to Cost
Proposed or Existing TermOrigination Date Maturity Date
Permanent Interest Rate Amortizing Annual Debt ServiceInterest Rate Method Amortizing DSCR (Year 0)Interest-Only Period (In Months) Amortizing DSCR (Year 1)Amortization (In Months)
Second Mortgage - Refinance
Original Loan Amount Loan to ValueLoan Amount at Start of Analysis Loan to Cost
Proposed or Existing TermOrigination Date Maturity Date
Interest Rate Amortizing Annual Debt ServiceInterest Rate MethodInterest-Only Period (In Months)Amortization (In Months) Recurring Loan Fees (Included Above)
Annual Fixed SumAnnual % of Outstanding Balance
NotesValuation reflects an assumption of the first mortgage. Upon expiration of the first mortgage in Year 9, analysis reflects a refinance which is sized to a 1.25 DSCR based on Year 10 NOI.
Loan Origination FeeLoan Constant
Per Unit $Total $
$23,000,000 $191,667
$180,000$130,870
Loan Assumption FeeLoan Constant
1.00%
$20,180,676$0
$23,345,870
$292$1,500$1,091
$194,549
$13,087,000$0$0$0$0
$13,087,000$10,258,870
$23,345,870
$13,087,000$13,087,000
ExistingNovember 30, 2018
4.80%30/360
122360
4.80%
56.9%56.1%
8.2 YearsDecember 1, 2028
$628,1761.922.03
December 1, 2028
4.75%30/360
0360
6.26%1.00%
0.0%0.0%
3.9 YearsOctober 1, 2032
$1,263,263
$00.00%
Proposed
Ir Is GardeNs | 16 CLICk HERE TO ACCESS DUE DILIGENCE
FINaNcIal aNalYsIs
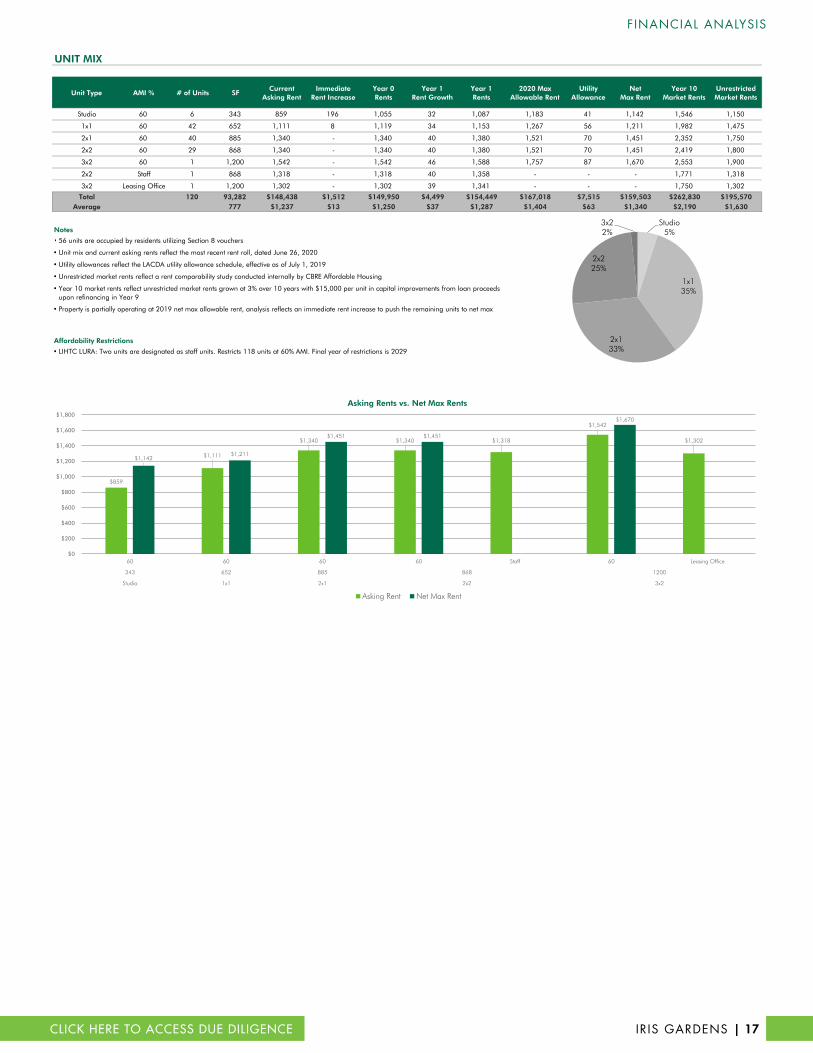
UNIT MIX
Unit Type AMI % # of Units SFCurrent
Asking RentImmediate
Rent IncreaseYear 0Rents
Year 1Rent Growth
Year 1Rents
2020 Max Allowable Rent
Utility Allowance
NetMax Rent
Year 10 Market Rents
UnrestrictedMarket Rents
S Studio 60 6 343 859 196 1,055 32 1,087 1,183 41 1,142 1,546 1,150
1 1x1 60 42 652 1,111 8 1,119 34 1,153 1,267 56 1,211 1,982 1,475
2 2x1 60 40 885 1,340 - 1,340 40 1,380 1,521 70 1,451 2,352 1,750
2 2x2 60 29 868 1,340 - 1,340 40 1,380 1,521 70 1,451 2,419 1,800
3 3x2 60 1 1,200 1,542 - 1,542 46 1,588 1,757 87 1,670 2,553 1,900
2 2x2 Staff 1 868 1,318 - 1,318 40 1,358 - - - 1,771 1,318
3 3x2 Leasing Office 1 1,200 1,302 - 1,302 39 1,341 - - - 1,750 1,302
Total 120 93,282 $148,438 $1,512 $149,950 $4,499 $154,449 $167,018 $7,515 $159,503 $262,830 $195,570Average 777 $1,237 $13 $1,250 $37 $1,287 $1,404 $63 $1,340 $2,190 $1,630
Notes
•
•
•
•
•
•
Affordability Restrictions
•
Property is partially operating at 2019 net max allowable rent, analysis reflects an immediate rent increase to push the remaining units to net max
Unit mix and current asking rents reflect the most recent rent roll, dated June 26, 2020
Unrestricted market rents reflect a rent comparability study conducted internally by CBRE Affordable Housing
Utility allowances reflect the LACDA utility allowance schedule, effective as of July 1, 2019
56 units are occupied by residents utilizing Section 8 vouchers
Year 10 market rents reflect unrestricted market rents grown at 3% over 10 years with $15,000 per unit in capital improvements from loan proceeds upon refinancing in Year 9
LIHTC LURA: Two units are designated as staff units. Restricts 118 units at 60% AMI. Final year of restrictions is 2029
$859
$1,111
$1,340 $1,340 $1,318
$1,542
$1,302
$1,142 $1,211
$1,451 $1,451
$1,670
$0
$200
$400
$600
$800
$1,000
$1,200
$1,400
$1,600
$1,800
60 60 60 60 Staff 60 Leasing Office
343 652 885 868 1200
Studio 1x1 2x1 2x2 3x2
Asking Rents vs. Net Max Rents
Asking Rent Net Max Rent
Studio5%
1x135%
2x133%
2x225%
3x22%
Ir Is GardeNs | 17 CLICk HERE TO ACCESS DUE DILIGENCE
FINaNcIal aNalYsIs

OPERATING HISTORY AND PRO FORMA
Income Per Unit Per Unit Per Unit Per Unit Per Unit
Market Rent 1,600,116 13,334 1,745,738 14,548 1,781,256 14,844 1,799,400 14,995 1,853,382 15,445 (1)(Section 8 Voucher Overhang) -6.32% (113,640) (947) -6.99% (129,590) (1,080) (2)Loss-to-Lease (Gain) -3.87% (61,964) (516) -3.01% (52,519) (438) -3.54% (63,130) (526) 2.07% 37,200 310 1.00% 18,534 154 (3)
Gross Potential Rent $1,662,080 13,851 $1,798,257 14,985 $1,844,386 15,370 $1,875,840 15,632 $1,964,438 16,370 (4)
Vacancy (-) 4.16% 69,183 3.73% 67,136 2.57% 47,387 4.00% 75,034 4.00% 78,578 (5)Model/Office (-) 0.94% 15,624 0.87% 15,624 0.85% 15,624 0.83% 15,624 0.83% 16,362 (6)Bad Debt (-) 0.59% 9,794 0.00% 27 0.05% 1,008 0.00% 0 0.00% 0Concessions (-) 0.01% 127 0.00% (80) 0.00% (80) 0.00% 0 0.00% 0
Total Economic Loss 5.70% $94,728 789 4.60% $82,707 689 3.47% $63,939 533 4.83% $90,658 755 4.83% $94,939 791Net Rental Income $1,567,352 13,061 $1,715,550 14,296 $1,780,447 14,837 $1,785,182 14,877 $1,869,499 15,579
Bad Debt Recovery 11.12% 1,089 100.00% 2,942 39.88% 402 0.00% 0 0.00% 0Damages/Cleaning/Forf. Dep. 5,379 6,006 2,200 2,200 2,265Laundry and Vending 8,130 6,378 12,348 12,348 12,718Termin./MTM/Late/NSF 6,725 8,975 5,725 5,725 5,897Utility Reimbursements 0 184 184 184 189Misc. Income (App, Pet, Other) 2,310 2,100 1,575 1,575 1,622
Total Other Income $23,633 197 $26,585 222 $22,433 187 $22,031 184 $22,692 189Effective Gross Income $1,590,985 13,258 $1,742,135 14,518 $1,802,880 15,024 $1,807,214 15,060 $1,892,191 15,768
Operating ExpensesReal Estate and Other Taxes
Real Estate Taxes 25,041 26,208 26,317 24,273 24,758 (7)
Personal Property/Other 21,743 6,792 47,346 47,346 48,293Total Real Estate Taxes $46,784 390 $33,000 275 $73,663 614 $71,618 597 $73,051 609Insurance
Property 20,476 25,866 27,558 27,558 28,384Total Insurance $20,476 171 $25,866 216 $27,558 230 $27,558 230 $28,384 237Utilities
Electricity 13,155 13,623 10,971 10,971 11,300Gas 2,494 3,625 2,380 2,380 2,452Water 21,591 27,897 27,503 27,503 28,328Sewer 6,643 7,183 3,750 3,750 3,863Garbage Collection 1,830 3,071 479 479 494
Total Utilities $45,713 381 $55,399 462 $45,084 376 $45,084 376 $46,436 387Total Fixed Expenses $112,973 941 $114,265 952 $146,304 1,219 $144,260 1,202 $147,871 1,232
Contract ServicesLandscaping 11,730 14,427 14,430 14,430 14,863Pest Control 5,447 6,126 6,073 6,073 6,255Security Contract 7,029 4,736 3,934 3,934 4,052Fire and Safety Systems 3,166 6,028 5,496 5,496 5,661
Total Contract Services $27,372 228 $31,317 261 $29,934 249 $29,934 249 $30,832 257Repairs and Maintenance
General Repairs and Maintenance 17,540 10,515 14,966 15,000 15,450HVAC and Plumbing 30,800 44,395 50,807 35,000 36,050Maintenance Supplies 17,873 17,236 19,230 19,230 19,807Turnover 0 4,604 1,639 1,639 1,688
Total Repairs and Maintenance $66,213 552 $76,750 640 $86,642 722 $70,869 591 $72,995 608 (8)Marketing and Promotion
Advertising 199 0 1,009 1,009 1,039Promotions/Resident Func. 2,348 3,015 3,463 3,463 3,567
Total Marketing and Promotion $2,547 21 $3,015 25 $4,472 37 $4,472 37 $4,606 38Payroll
Manager and Leasing 78,343 88,598 82,987 82,500 84,975Leasing Comm./Bonus 3,150 2,750 2,750 0 0Maintenance Staff 68,955 73,236 72,073 70,000 72,100
Subtotal Payroll $150,448 1,254 $164,584 1,372 $157,810 1,315 $152,500 1,271 $157,075 1,309Payroll Taxes and Benefits 33.90% 51,007 30.04% 49,438 30.17% 47,604 20.00% 30,500 20.00% 31,415Staff Apartments 14,163 15,321 15,816 15,816 16,290 (9)
Total Payroll $215,618 1,797 $229,343 1,911 $221,230 1,844 $198,816 1,657 $204,780 1,707 (10)Management Fee 5.79% 92,113 768 3.94% 68,653 572 3.87% 69,718 581 3.50% 63,252 527 3.50% 66,227 552 (11)Administrative Expenses
Audit/Accounting Fees 0 0 13,150 0 0 (12)Legal and Professional Fees 8,684 16,402 12,074 12,074 12,436Supplies/Copier/Computer 10,317 10,291 10,866 10,866 11,192Phone/Internet/Answering Service 4,314 3,210 3,779 3,779 3,892Miscellaneous 2,799 2,586 1,673 1,673 1,723
Total Administrative $26,114 218 $32,489 271 $41,542 346 $28,392 237 $29,244 244Total Variable Expenses $429,977 3,583 $441,567 3,680 $453,537 3,779 $395,734 3,298 $408,683 3,406
LIHTC Monitoring Fee 3,432 2,373 2,118 2,118 2,118 (13)Nonprofit Fee 18,000 150 18,000 150 18,000 150 18,000 150 18,540 155 (14)Replacement Reserves 42,000 350 42,000 350 42,000 350 42,000 350 42,000 350
Total Expenses $606,382 5,053 $618,205 5,152 $661,959 5,516 $602,112 5,018 $619,212 5,160
Net Operating Income $984,603 8,205 $1,123,930 9,366 $1,140,921 9,508 $1,205,102 10,043 $1,272,979 10,608
Expenses as a % of EGI 38.11% 35.49% 36.72% 33.32% 32.72%4.28% 4.89% 4.96% 5.24% 5.53%
Capital ExpendituresAppliance Replacement 6,390 5,566 9,732Carpet/Flooring/Vinyl Rep. 30,123 22,787 14,205HVAC/Plumbing/Boiler 12,834 13,342 12,276Exterior/Landscaping 13,240 32,368 32,368Miscellaneous 28,905 51,184 34,412
Total Capital Expenditures $91,492 762 $125,247 1,044 $102,992 858Adjusted Net Operating Income $935,111 7,793 $1,040,683 8,672 $1,079,929 8,999
Cap Rate (Price $23,000,000)
2018 2019 May 2020 Trailing 12 Year 0 Year 1
Ir Is GardeNs | 18 CLICk HERE TO ACCESS DUE DILIGENCE
FINaNcIal aNalYsIs

INCOME AND EXPENSE NOTES
(1) Market Rent Growth: Immediate rent increase and unrestricted market rents based on a rent comparability study conducted internally. Rent growth stabilizes at 3% with a conversion to market rate in Year 10 as affordability restrictions terminate.
(2) Section 8 Voucher Overhang: Due to Section 8 vouchers in excess of the current asking rents there is voucher overhang. As of the June 26, 2020 rent roll, 56 units were using vouchers. Property has historically been adding an average of 6 voucher tenants each year. Analysis reflects 6 voucher tenants added each year until total voucher units equals 80 units in Year 4. Analysis assumes this voucher income will continue throughout the hold period.
(3) Loss-to-Lease: Underwriting assumes all new leases and renewals will be rented at the current asking rents over the first 12 months. Analysis assumes loss-to-lease stabilizes at 1% in Year 1 with a subsequent increase in Year 10 as the property converts to market rate.
(4) Gross Potential Rent: Year 0 reflects February 2020 annualized.
(5) Vacancy: As of the June 26, 2020 rent roll, the property was 97.5% occupied. Analysis assumes occupancy stabilzies at 96% in Year 0.
(6) Model/Office: Year 0 reflects the current office discount present on the most recent rent roll dated June 26, 2020 annualized.
(7) Real Estate Taxes: See Real Estate Tax Analysis on the following page.
(8) Total Repairs and Maintenance: Reduction reflects CBRE estimate of market underwriting which additionally contemplates initial capital improvements of $1,500 per unit.
(9) Staff Apartments: Year 0 reflects the current employee discount present on the most recent rent roll dated June 26, 2020 annualized.
(10) Total Payroll: Reduction based on CBRE estimate of immediate labor market.
(11) Management Fee: Reduction based on CBRE estimate of market underwriting.
(12) Audit/Accounting Fees: Excludes the audit expense which will not be required after a sale.
(13) LIHTC Monitoring Fee: Property has historically paid a LITHC monitoring fee in the amount of $2,118. Analysis assumes this fee continues throughout the hold period.
(14) Nonprofit Fee: Required in order to qualify for the real estate tax exemption. Analysis assumes this continues until the property converts to market rate in Year 10.
Ir Is GardeNs | 19 CLICk HERE TO ACCESS DUE DILIGENCE
FINaNcIal aNalYsIs

PROPERTY TAX ANALYSIS
Real Estate Tax Analysis 2019 2020 Year 0
Land Value 6,402,653 6,530,705 6,530,705Improvement Value 4,332,827 4,429,482 16,469,295Appraised Value 10,735,480 10,960,187 23,000,000
Less: Tax Exemptions 10,735,480 10,960,187 23,000,000Taxable Value 0 0 0
1.1659 1.1659 1.1659Real Estate Taxes 0 0 0
Plus: Other Assessments 24,273 24,273 24,273Total Real Estate Taxes $24,273 $24,273 $24,273
Notes
Tax Rate
AIN: 8612-020-027, 8612-020-019, & 8612-020-006Properties in CA are reassessed upon sale to 100% of purchase price. Year 0 reflects a reassessment with the 2019 tax rate carried forward.
2020 tax rate reflects 2019 tax rate carried forward.
Property is currently operating under the Welfare Tax Exemption, analysis assumes this continues until the property converts to market rate in Year 10.
Analysis assumes the property taxes will be reassessed in Year 10 upon conversion to market rate. Analysis further assumes the Year 10 assessed value will be equal to our Year 0 reassessment, if no exemption were present, grown at 2% annually.
Ir Is GardeNs | 20 CLICk HERE TO ACCESS DUE DILIGENCE
FINaNcIal aNalYsIs
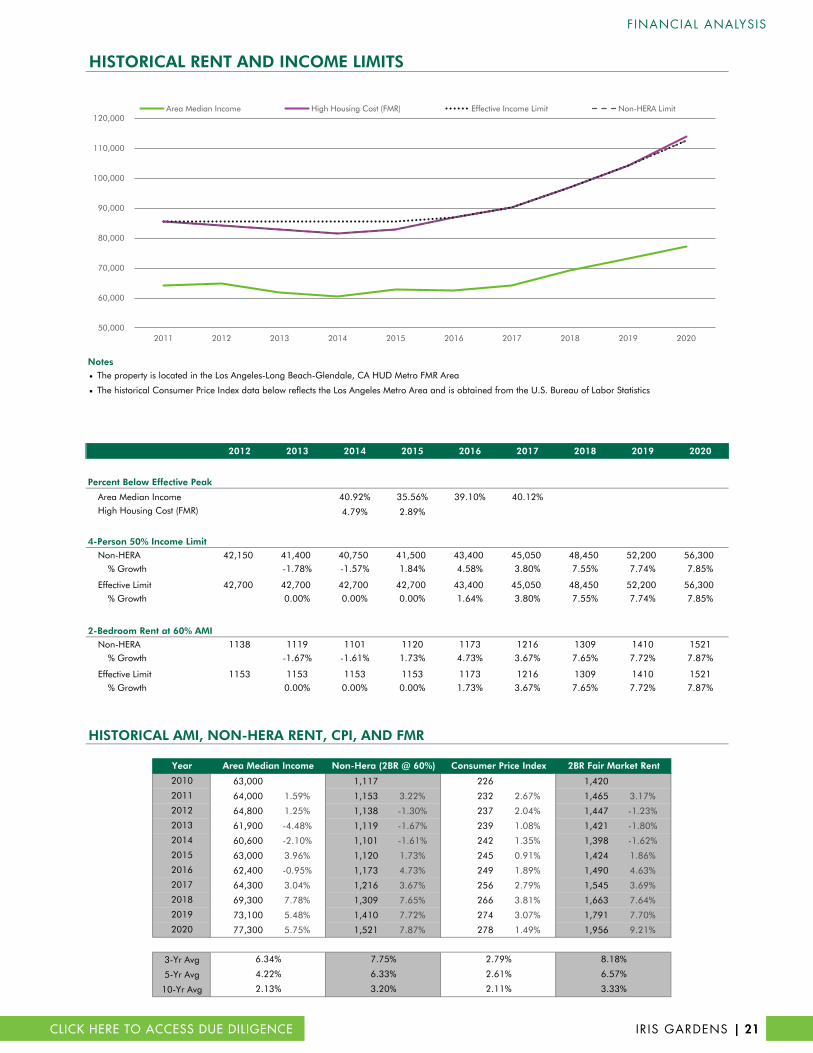
HISTORICAL RENT AND INCOME LIMITS
Notes
•
•
2012 2013 2014 2015 2016 2017 2018 2019 2020
Percent Below Effective Peak
Area Median Income 37.96% 40.92% 35.56% 39.10% 40.12% 39.8268% 42.8181% 45.6662%High Housing Cost (FMR) 1.30% 3.14% 4.79% 2.89% 0.00% 0.00% 0.00% 0.00% -1.23%
4-Person 50% Income LimitNon-HERA 42,150 41,400 40,750 41,500 43,400 45,050 48,450 52,200 56,300
% Growth -1.78% -1.57% 1.84% 4.58% 3.80% 7.55% 7.74% 7.85%
Effective Limit 42,700 42,700 42,700 42,700 43,400 45,050 48,450 52,200 56,300% Growth 0.00% 0.00% 0.00% 1.64% 3.80% 7.55% 7.74% 7.85%
2-Bedroom Rent at 60% AMINon-HERA 1138 1119 1101 1120 1173 1216 1309 1410 1521
% Growth -1.67% -1.61% 1.73% 4.73% 3.67% 7.65% 7.72% 7.87%
Effective Limit 1153 1153 1153 1153 1173 1216 1309 1410 1521% Growth 0.00% 0.00% 0.00% 1.73% 3.67% 7.65% 7.72% 7.87%
HISTORICAL AMI, NON-HERA RENT, CPI, AND FMR
63,000 1,117 226 1,420
64,000 1.59% 1,153 3.22% 232 2.67% 1,465 3.17%
64,800 1.25% 1,138 -1.30% 237 2.04% 1,447 -1.23%
61,900 -4.48% 1,119 -1.67% 239 1.08% 1,421 -1.80%
60,600 -2.10% 1,101 -1.61% 242 1.35% 1,398 -1.62%
63,000 3.96% 1,120 1.73% 245 0.91% 1,424 1.86%
62,400 -0.95% 1,173 4.73% 249 1.89% 1,490 4.63%
64,300 3.04% 1,216 3.67% 256 2.79% 1,545 3.69%
69,300 7.78% 1,309 7.65% 266 3.81% 1,663 7.64%
73,100 5.48% 1,410 7.72% 274 3.07% 1,791 7.70%
77,300 5.75% 1,521 7.87% 278 1.49% 1,956 9.21%
3-Yr Avg
5-Yr Avg
10-Yr Avg
The property is located in the Los Angeles-Long Beach-Glendale, CA HUD Metro FMR Area
The historical Consumer Price Index data below reflects the Los Angeles Metro Area and is obtained from the U.S. Bureau of Labor Statistics
Year Area Median Income Non-Hera (2BR @ 60%) Consumer Price Index 2BR Fair Market Rent
2010
2017
2018
2019
2020
6.34% 7.75%
2011
2012
2013
2014
2015
2016
2.13% 3.20% 2.11% 3.33%
2.79% 8.18%
4.22% 6.33% 2.61% 6.57%
50,000
60,000
70,000
80,000
90,000
100,000
110,000
120,000
2011 2012 2013 2014 2015 2016 2017 2018 2019 2020
Area Median Income High Housing Cost (FMR) Effective Income Limit Non-HERA Limit
Ir Is GardeNs | 21 CLICk HERE TO ACCESS DUE DILIGENCE
FINaNcIal aNalYsIs

GROWTH RATES AND OCCUPANCY ASSUMPTIONS
Year Year 1 Year 2 Year 3 Year 4 Year 5 Year 6 Year 7 Year 8 Year 9 Year 10 Year 11 Year 12
Year Ending Oct-2021 Oct-2022 Oct-2023 Oct-2024 Oct-2025 Oct-2026 Oct-2027 Oct-2028 Oct-2029 Oct-2030 Oct-2031 Oct-2032
Income Growth
Rental Income Growth 4.05% 3.00% 3.00% 3.00% 3.00% 3.00% 3.00% 3.00% 3.00% 34.34% 3.00% 3.00%
Other Income Growth 3.00% 3.00% 3.00% 3.00% 3.00% 3.00% 3.00% 3.00% 3.00% 3.00% 3.00% 3.00%
Economic Loss
Vacancy (-) * 4.00% 4.00% 4.00% 4.00% 4.00% 4.00% 4.00% 4.00% 4.00% 4.00% 4.00% 4.00%
Model / Office (-) * 0.83% 0.83% 0.83% 0.83% 0.83% 0.83% 0.83% 0.83% 0.83% 0.83% 0.83% 0.83%
Bad Debt (-) * 0.00% 0.00% 0.00% 0.00% 0.00% 0.00% 0.00% 0.00% 0.00% 0.00% 0.00% 0.00%
Concessions (-) * 0.00% 0.00% 0.00% 0.00% 0.00% 0.00% 0.00% 0.00% 0.00% 0.00% 0.00% 0.00%
Total Economic Loss 4.83% 4.83% 4.83% 4.83% 4.83% 4.83% 4.83% 4.83% 4.83% 4.83% 4.83% 4.83%
Expense Growth
Real Estate and Other Taxes 2.00% 2.00% 2.00% 2.00% 2.00% 2.00% 2.00% 2.00% 2.00% 308.31% 2.00% 2.00%
Insurance 3.00% 3.00% 3.00% 3.00% 3.00% 3.00% 3.00% 3.00% 3.00% 3.00% 3.00% 3.00%
Utilities 3.00% 3.00% 3.00% 3.00% 3.00% 3.00% 3.00% 3.00% 3.00% 3.00% 3.00% 3.00%
Contract Services 3.00% 3.00% 3.00% 3.00% 3.00% 3.00% 3.00% 3.00% 3.00% 3.00% 3.00% 3.00%
Repairs and Maintenance 3.00% 3.00% 3.00% 3.00% 3.00% 3.00% 3.00% 3.00% 3.00% 3.00% 3.00% 3.00%
Marketing and Promotion 3.00% 3.00% 3.00% 3.00% 3.00% 3.00% 3.00% 3.00% 3.00% 3.00% 3.00% 3.00%
Payroll 3.00% 3.00% 3.00% 3.00% 3.00% 3.00% 3.00% 3.00% 3.00% 3.00% 3.00% 3.00%
Management Fee ** 3.50% 3.50% 3.50% 3.50% 3.50% 3.50% 3.50% 3.50% 3.50% 3.50% 3.50% 3.50%
Administrative 3.00% 3.00% 3.00% 3.00% 3.00% 3.00% 3.00% 3.00% 3.00% 3.00% 3.00% 3.00%
LIHTC Monitoring Fee 0.00% 0.00% 0.00% 0.00% 0.00% 0.00% 0.00% 0.00% 0.00% 0.00% 0.00% 0.00%
Nonprofit Fee 3.00% 3.00% 3.00% 3.00% 3.00% 3.00% 3.00% 3.00% 3.00% 3.00% 3.00% 3.00%
Replacement Reserves 0.00% 0.00% 0.00% 0.00% 0.00% 0.00% 0.00% 0.00% 0.00% 0.00% 0.00% 0.00%
Notes: * Calculated as a percentage of Gross Potential Rent | ** Calculated as a percentage of Effective Gross Income
Ir Is GardeNs | 22 CLICk HERE TO ACCESS DUE DILIGENCE
FINaNcIal aNalYsIs

Year 0 Year 1 Year 2 Year 3 Year 4 Year 5 Year 6 Year 7 Year 8 Year 9 Year 10 Year 11 Year 12
Period Ending Oct-2021 Oct-2022 Oct-2023 Oct-2024 Oct-2025 Oct-2026 Oct-2027 Oct-2028 Oct-2029 Oct-2030 Oct-2031 Oct-2032
Unleveraged Acquisition Costs
Purchase Price 23,000,000
Due Diligence and Closing 35,000
Capital Improvements 180,000
Total Unlev. Acq. Costs $23,215,000 $0 $0 $0 $0 $0 $0 $0 $0 $0 $0 $0 $0
Income
Market Rents 1,799,400 1,853,382 1,908,983 1,966,253 2,025,241 2,085,998 2,148,578 2,213,035 2,279,426 2,347,809 3,153,957 3,248,575 3,346,033
(S. 8 Voucher Overhang) (%) -6.32% -6.99% -7.67% -8.35% -9.02% -9.02% -9.02% -9.02% -9.02% -9.02% 0.00% 0.00% 0.00%
(S. 8 Voucher Overhang) (113,640) (129,590) (146,395) (164,092) (182,718) (188,200) (193,846) (199,661) (205,651) (211,821) 0 0 0
Loss-to-Lease (%) 2.07% 1.00% 1.00% 1.00% 1.00% 1.00% 1.00% 1.00% 1.00% 1.00% 14.00% 7.00% 1.00%
Loss-to-Lease (Gain) 37,200 18,534 19,090 19,663 20,252 20,860 21,486 22,130 22,794 23,478 441,554 227,400 33,460
Gross Potential Rent $1,875,840 $1,964,438 $2,036,289 $2,110,682 $2,187,706 $2,253,338 $2,320,938 $2,390,566 $2,462,283 $2,536,151 $2,712,403 $3,021,175 $3,312,572
Vacancy (-) 75,034 78,578 81,452 84,427 87,508 90,134 92,838 95,623 98,491 101,446 108,496 120,847 132,503
Model / Office (-) 15,624 16,362 16,960 17,580 18,222 18,768 19,331 19,911 20,509 21,124 22,592 25,164 27,591
Total Economic Loss $90,658 $94,939 $98,412 $102,007 $105,730 $108,902 $112,169 $115,534 $119,000 $122,570 $131,088 $146,011 $160,094
% Economic Loss 4.83% 4.83% 4.83% 4.83% 4.83% 4.83% 4.83% 4.83% 4.83% 4.83% 4.83% 4.83% 4.83%
Total Other Income $22,031 $22,692 $23,373 $24,074 $24,796 $25,540 $26,306 $27,096 $27,908 $28,746 $29,608 $30,496 $31,411
Effective Gross Income $1,807,214 $1,892,191 $1,961,250 $2,032,749 $2,106,773 $2,169,976 $2,235,075 $2,302,128 $2,371,192 $2,442,327 $2,610,923 $2,905,661 $3,183,890
% Change 0.24% 4.70% 3.65% 3.65% 3.64% 3.00% 3.00% 3.00% 3.00% 3.00% 6.90% 11.29% 9.58%
Operating Expenses
Real Estate and Other Taxes 71,618 73,051 74,512 76,002 77,522 79,073 80,654 82,267 83,912 85,591 349,477 356,467 363,596
Insurance 27,558 28,384 29,236 30,113 31,016 31,947 32,905 33,893 34,909 35,957 37,035 38,146 39,291
Utilities 45,084 46,436 47,829 49,264 50,742 52,264 53,832 55,447 57,111 58,824 60,589 62,406 64,278
Contract Services 29,934 30,832 31,756 32,709 33,690 34,701 35,742 36,814 37,919 39,056 40,228 41,435 42,678
Repairs and Maintenance 70,869 72,995 75,185 77,440 79,763 82,156 84,621 87,160 89,774 92,468 95,242 98,099 101,042
Marketing and Promotion 4,472 4,606 4,744 4,886 5,033 5,184 5,339 5,500 5,665 5,834 6,009 6,190 6,375
Payroll 198,816 204,780 210,924 217,252 223,769 230,482 237,397 244,519 251,854 259,410 267,192 275,208 283,464
Management Fee 63,252 66,227 68,644 71,146 73,737 75,949 78,228 80,574 82,992 85,481 91,382 101,698 111,436
Administrative 28,392 29,244 30,121 31,025 31,955 32,914 33,901 34,918 35,966 37,045 38,156 39,301 40,480
LIHTC Monitoring Fee 2,118 2,118 2,118 2,118 2,118 2,118 2,118 2,118 2,118 2,118 0 0 0
Nonprofit Fee 18,000 18,540 19,096 19,669 20,259 20,867 21,493 22,138 22,802 23,486 0 0 0
Replacement Reserves 42,000 42,000 42,000 42,000 42,000 42,000 42,000 42,000 42,000 42,000 42,000 42,000 42,000
Total Expenses $602,112 $619,212 $636,165 $653,624 $671,606 $689,655 $708,231 $727,347 $747,022 $767,270 $1,027,311 $1,060,950 $1,094,641
Net Operating Income $1,205,102 $1,272,979 $1,325,085 $1,379,125 $1,435,167 $1,480,321 $1,526,845 $1,574,780 $1,624,170 $1,675,058 $1,583,612 $1,844,711 $2,089,249
% Change 5.63% 5.63% 4.09% 4.08% 4.06% 3.15% 3.14% 3.14% 3.14% 3.13% -5.46% 16.49% 13.26%
Gross Sale Proceeds 0 0 0 0 0 0 0 0 0 0 0 41,082,329
Less Existing Debt Balance 0 0 0 0 0 0 0 0 0 0 0 18,871,956
Less Cost of Sale 0 0 0 0 0 0 0 0 0 0 0 924,352
Net Sale Proceeds $0 $0 $0 $0 $0 $0 $0 $0 $0 $0 $0 $21,286,021
First Mortgage - Assumption
Principal Payments 0 0 0 0 0 0 0 0 0 0 0 0
Interest Payments 628,176 628,176 628,176 628,176 628,176 628,176 628,176 628,176 104,696 0 0 0
Mortgage Repaid 0 0 0 0 0 0 0 0 13,087,000 0 0 0
Mortgage Funding Proceeds (13,087,000) 0 0 0 0 0 0 0 0 0 0 0 0
Loan Fees 130,870 0 0 0 0 0 0 0 0 0 0 0 0
Total DS - First Mortgage ($12,956,130) $628,176 $628,176 $628,176 $628,176 $628,176 $628,176 $628,176 $628,176 $13,191,696 $0 $0 $0
Second Mortgage - Refinance
Principal Payments 0 0 0 0 0 0 0 0 284,885 325,233 341,023 357,579
Interest Payments 0 0 0 0 0 0 0 0 873,106 938,030 922,241 905,685
Mortgage Repaid 0 0 0 0 0 0 0 0 0 0 0 0
Mortgage Funding Proceeds 0 0 0 0 0 0 0 0 0 (20,180,676) 0 0 0
Loan Fees 0 0 0 0 0 0 0 0 0 201,807 0 0 0
Capital Improvements from Net Proceeds 0 0 0 0 0 0 0 0 1,800,000 0 0 0
Total DS - Second Mortgage $0 $0 $0 $0 $0 $0 $0 $0 $0 ($17,020,877) $1,263,263 $1,263,263 $1,263,263
Consolidated Debt Service ($12,956,130) $628,176 $628,176 $628,176 $628,176 $628,176 $628,176 $628,176 $628,176 ($3,829,181) $1,263,263 $1,263,263 $1,263,263
Net Cash Flow $644,803 $696,909 $750,949 $806,991 $852,145 $898,669 $946,604 $995,994 $5,504,239 $320,348 $581,447 $825,985
Total Lev. Cash Flow ($10,258,870) $644,803 $696,909 $750,949 $806,991 $852,145 $898,669 $946,604 $995,994 $5,504,239 $320,348 $581,447 $22,112,006
Debt Service Coverage Ratio 2.03 2.11 2.20 2.28 2.36 2.43 2.51 2.59 1.14 1.25 1.46 1.65
12-YEAR CASH FLOW
Ir Is GardeNs | 23 CLICk HERE TO ACCESS DUE DILIGENCE
FINaNcIal aNalYsIs
reNt coMParaBles

IRIS GARDENS SUMMARY OF RENT COMPARABLESAzusa, CAYear Built: 1961 & 1962 / Renovated: 2000Units: 120
Studio Units
PropertyAMI
RestrictionsYear Built
Average SFLow Market
RentHigh Market
RentAverage
Market RentAverage Rent PSF
Net Rent AfterConcessions
VacancyDistance to
Subject (Miles)
Bradbury Park 1979 / 2012 540 $1,499 $1,499 $1,499 $2.78 $1,499 5% 3.9Casa Madrid 1979 500 $1,450 $1,470 $1,460 $2.92 $1,460 8% 2.5Villa Monterey 1971 500 $1,400 $1,400 $1,400 $2.80 $1,400 0% 1.8Canyon Gardens 1963 430 $1,115 $1,115 $1,115 $2.59 $1,115 6% 1.2IIrriiss GGaarrddeennss 6600%% 11996611 && 11996622 // 22000000 334433 $$885599 $$885599 $$885599 $$22..5500 $$885599 33%%Promenade 60% 1974 / 1999 313 $731 $731 $731 $2.34 $731 0% 6.1Promenade 50% 1974 / 1999 313 $603 $603 $603 $1.93 $603 0% 6.1Promenade 40% 1974 / 1999 313 $475 $475 $475 $1.52 $475 0% 6.1
Averages 407 $1,017 $1,019 $1,018 $2.42 $1,018 3%
One-Bedroom Units
PropertyAMI
RestrictionsYear Built
Average SFLow Market
RentHigh Market
RentAverage
Market RentAverage Rent PSF
Net Rent AfterConcessions
VacancyDistance to
Subject (Miles)
Bradbury Park 1x1 1979 / 2012 765 $1,739 $1,739 $1,739 $2.27 $1,739 5% 3.9Sycamore Park 1x1 1987 750 $1,695 $1,695 $1,695 $2.26 $1,695 2% 3.0Tribeca 1x1 1960 / 2012 700 $1,590 $1,590 $1,590 $2.27 $1,590 2% 1.2Casa Madrid 1x1 1979 600 $1,550 $1,580 $1,565 $2.61 $1,565 8% 2.5Villa Monterey 1x1 1971 600 $1,468 $1,468 $1,468 $2.45 $1,468 0% 1.8Canyon Gardens 1x1 1963 750 $1,315 $1,441 $1,378 $1.84 $1,378 6% 1.2Azusa Gardens 1x1 1987 550 $1,350 $1,350 $1,350 $2.45 $1,350 0% 0.8Vintage Gardens 1x1 60% 2000 575 $1,225 $1,225 $1,225 $2.13 $1,225 0% 5.3IIrriiss GGaarrddeennss 11xx11 6600%% 11996611 && 11996622 // 22000000 665522 $$11,,111111 $$11,,111111 $$11,,111111 $$11..7700 $$11,,111111 33%%Cameron Park 1x1 60% 1970 697 $955 $955 $955 $1.37 $955 0% 6.7Promenade 1x1 60% 1974 / 1999 625 $828 $828 $828 $1.32 $828 0% 6.1Promenade 1x1 50% 1974 / 1999 625 $682 $682 $682 $1.09 $682 0% 6.1Promenade 1x1 40% 1974 / 1999 625 $536 $536 $536 $0.86 $536 0% 6.1
Averages 655 $1,234 $1,246 $1,240 $1.89 $1,240 2%
Two-Bedroom Units
PropertyAMI
RestrictionsYear Built
Average SFLow Market
RentHigh Market
RentAverage
Market RentAverage Rent PSF
Net Rent AfterConcessions
VacancyDistance to
Subject (Miles)
Bradbury Park 2x2 1979 / 2012 967 $1,999 $1,999 $1,999 $2.07 $1,999 5% 3.9Sycamore Park 2x2 1987 998 $1,975 $1,995 $1,985 $1.99 $1,985 2% 3.0Villa Monterey 2x2 1971 1,000 $1,900 $1,900 $1,900 $1.90 $1,900 0% 1.8Casa Madrid 2x2 1979 900 $1,870 $1,920 $1,895 $2.11 $1,895 8% 2.5Villa Monterey 2x1 1971 800 $1,890 $1,890 $1,890 $2.36 $1,890 0% 1.8Canyon Gardens 2x1.5 TH 1963 1,080 $1,875 $1,875 $1,875 $1.74 $1,875 6% 1.2Tribeca 2x1 1960 / 2012 850 $1,790 $1,790 $1,790 $2.11 $1,790 2% 1.2Casa Madrid 2x1.5 1979 810 $1,750 $1,750 $1,750 $2.16 $1,750 8% 2.5Casa Madrid 2x1 1979 800 $1,627 $1,627 $1,627 $2.03 $1,627 8% 2.5Canyon Gardens 2x1 1963 815 $1,604 $1,629 $1,617 $1.98 $1,617 6% 1.2Azusa Gardens 2x1 1987 700 $1,550 $1,550 $1,550 $2.21 $1,550 0% 0.8Vintage Gardens 2x1 60% 2000 733 $1,469 $1,469 $1,469 $2.00 $1,469 0% 5.3IIrriiss GGaarrddeennss 22xx11 6600%% 11996611 && 11996622 // 22000000 888855 $$11,,334400 $$11,,334400 $$11,,334400 $$11..5511 $$11,,334400 33%%IIrriiss GGaarrddeennss 22xx22 6600%% 11996611 && 11996622 // 22000000 886688 $$11,,334400 $$11,,334400 $$11,,334400 $$11..5544 $$11,,334400 33%%Cameron Park 2x1 60% 1970 861 $1,320 $1,320 $1,320 $1.53 $1,320 0% 6.7
Averages 871 $1,687 $1,693 $1,690 $1.95 $1,690 3%
Three-Bedroom Units
PropertyAMI
RestrictionsYear Built
Average SFLow Market
RentHigh Market
RentAverage
Market RentAverage Rent PSF
Net Rent AfterConcessions
VacancyDistance to
Subject (Miles)
Bradbury Park 3x2 1979 / 2012 1,027 $2,210 $2,210 $2,210 $2.15 $2,210 5% 3.9Azusa Gardens 3x2 1987 1,000 $1,850 $1,850 $1,850 $1.85 $1,850 0% 0.8IIrriiss GGaarrddeennss 33xx22 6600%% 11996611 && 11996622 // 22000000 11,,220000 $$11,,554422 $$11,,554422 $$11,,554422 $$11..2299 $$11,,554422 33%%Cameron Park 3x1.5 60% 1970 1,074 $1,405 $1,405 $1,405 $1.31 $1,405 0% 6.7
Averages 1,075 $1,752 $1,752 $1,752 $1.65 $1,752 2%
Ir Is GardeNs | 25 CLICk HERE TO ACCESS DUE DILIGENCE
reNt coMParaBles

PROPERTY DETAILSProperty Type LIHTC - FamilyUnits 120Occupancy 97.5%Year Built/Year Renovated 1961 & 1962/2000Management FPI Management
TENANT CHARGESWater/Sewer Included/Landlord PaysGarbage Included/Landlord PaysElectricity Tenant PaysGas Heat Tenant Pays
UNIT TYPE SQUARE FEET ASKING RENTRENT PER
SQUARE FOOT
Studio (60% AMI) 343 $859 $2.501x1 (60% AMI) 652 $1111 $1.702x1 (60% AMI) 885 $1340 $1.512x2 (60% AMI) 868 $1340 $1.543x2 (60% AMI) 1200 $1542 $1.29 UNIT AMENITIES
CONCESSIONS
COMMENTS
PROPERTY DETAILSProperty Type Market RateUnits 112Occupancy 100.0%Year Built 1987Distance From Subject 0.8 MilesManagement A-Ju ManagementOwnership Kae Choe
TENANT CHARGESWater/Sewer Tenants Pays (RUBS)Garbage Tenant PaysElectricity Tenant PaysGas Heat Tenant Pays
UNIT TYPE SQUARE FEET ASKING RENTRENT PER
SQUARE FOOT
1x1 550 $1350 $2.452x1 700 $1550 $2.213x2 1000 $1850 $1.854x2 1100 $2300 $2.09
UNIT AMENITIES
CONCESSIONS
IRIS GARDENS
Other Charges: N/A
COMMUNITY AMENITIES
None
AZUSA GARDENS
601 EAST 8TH STREET | AZUSA, CA 91702
None
Other Charges: N/A
RENT COMPARABLE
Self-cleaning oven | Dishwasher | Garbage disposal | Air conditioning
Gated access | On-site laundry facility | Courtyard | Leasing office
Garbage disposal | Air conditioning
COMMUNITY AMENITIESSwimming pool | Gated access | On-site laundry facility | Courtyard | Leasing office
None
SUBJECT PROPERTY
341 NORTH ROCKVALE AVENUE | AZUSA, CA 91702Align PictureHeight 4.24"Width 6.5"
Left: Left of Column A
Align PictureHeight 4.24"Width 6.5"
Left: Left of Column A
Ir Is GardeNs | 26 CLICk HERE TO ACCESS DUE DILIGENCE
reNt coMParaBles

PROPERTY DETAILSProperty Type Market RateUnits 127Occupancy 94.5%Year Built 1963Distance From Subject 1.2 MilesManagement Growth InvestmentsOwnership Philip Minard
TENANT CHARGESWater/Sewer Tenants Pays (RUBS)Garbage Tenant PaysElectricity Tenant PaysGas Heat Tenant Pays
UNIT TYPE SQUARE FEET ASKING RENTRENT PER
SQUARE FOOT
Studio 430 $1115 $2.591x1 600-900 $1315, 1427, 1441 $1.60-2.192x1 730-900 $1604-1629 $1.81-2.202x1.5 TH 1080 $1875 $1.74
CONCESSIONS
COMMENTS
PROPERTY DETAILSProperty Type Market RateUnits 96Occupancy 98.0%Year Built/Year Renovated 1960/2012Distance From Subject 1.2 MilesManagement Sunridge Management GroupOwnership Hung Enterprises
Tenant Charges TENANT CHARGESWater/Sewer Tenants Pays (RUBS)Garbage Tenant PaysElectricity Tenant PaysGas Heat Tenant Pays
UNIT TYPE SQUARE FEET ASKING RENTRENT PER
SQUARE FOOT
1x1 700 $1590 $2.272x1 850 $1790 $2.11
CONCESSIONSNone
COMMENTS
CANYON GARDENS
Balcony or patio | Hardwood floors | Walk-in closets | Additional storage space | Self-cleaning oven | Dishwasher | Garbage disposal | Air conditioning
TRIBECA
None
RENT COMPARABLE
1181 EAST HOLLYVALE STREET | AZUSA, CA 91702
COMMUNITY AMENITIES
Other Charges: Garage $150
On-site laundry facility | Courtyard | Barbecue and picnic area | Leasing office
UNIT AMENITIESBalcony or patio | Additional storage space | Self-cleaning oven | Dishwasher | Garbage disposal | Air conditioning
COMMUNITY AMENITIES
None
None
RENT COMPARABLE
200 SOUTH AZUSA AVENUE | AZUSA, CA 91702
Other Charges: N/A
Clubhouse | Swimming pool | Gated access | On-site laundry facility | Courtyard | Barbecue and picnic area | Playground | Leasing office | Pets allowed
UNIT AMENITIES
Align PictureHeight 4.24"Width 6.5"
Left: Left of Column A
Align PictureHeight 4.24"Width 6.5"
Left: Left of Column A
Ir Is GardeNs | 27 CLICk HERE TO ACCESS DUE DILIGENCE
reNt coMParaBles
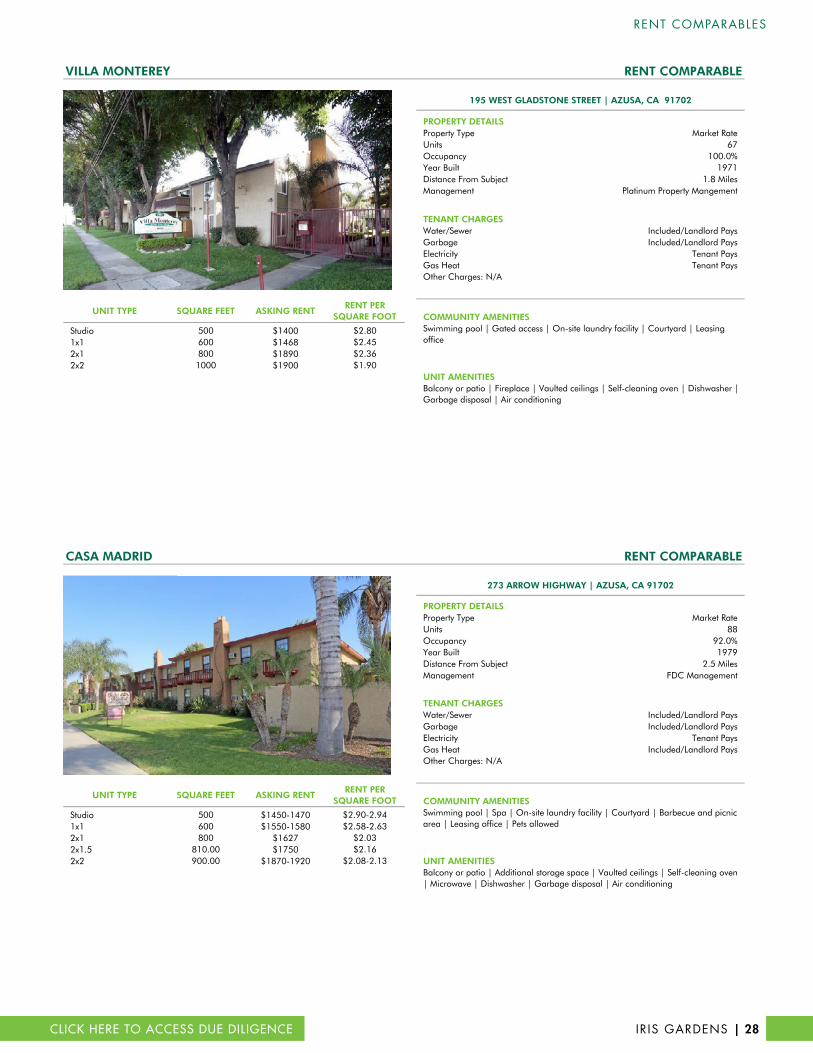
Property DetailsPROPERTY DETAILSProperty Type Market RateUnits 67Occupancy 100.0%Year Built 1971Distance From Subject 1.8 MilesManagement Platinum Property MangementOwnership Bruce Rajaee
Tenant ChargesTENANT CHARGESWater/Sewer Included/Landlord PaysGarbage Included/Landlord PaysElectricity Tenant PaysGas Heat Tenant Pays
UNIT TYPE SQUARE FEET ASKING RENTRENT PER
SQUARE FOOT
Studio 500 $1400 $2.801x1 600 $1468 $2.452x1 800 $1890 $2.362x2 1000 $1900 $1.90
ConcessionsComments
Property DetailsPROPERTY DETAILSProperty Type Market RateUnits 88Occupancy 92.0%Year Built 1979Distance From Subject 2.5 MilesManagement FDC ManagementOwnership FDC Management
TENANT CHARGESWater/Sewer Included/Landlord PaysGarbage Included/Landlord PaysElectricity Tenant PaysGas Heat Included/Landlord Pays
UNIT TYPE SQUARE FEET ASKING RENTRENT PER
SQUARE FOOT
Studio 500 $1450-1470 $2.90-2.941x1 600 $1550-1580 $2.58-2.632x1 800 $1627 $2.032x1.5 810.00 $1750 $2.162x2 900.00 $1870-1920 $2.08-2.13
None
None
RENT COMPARABLEVILLA MONTEREY
195 WEST GLADSTONE STREET | AZUSA, CA 91702
COMMUNITY AMENITIES
Other Charges: N/A
Swimming pool | Gated access | On-site laundry facility | Courtyard | Leasing office
UNIT AMENITIESBalcony or patio | Fireplace | Vaulted ceilings | Self-cleaning oven | Dishwasher | Garbage disposal | Air conditioning
CONCESSIONSNone
COMMENTS
CASA MADRID RENT COMPARABLE
273 ARROW HIGHWAY | AZUSA, CA 91702
Other Charges: N/A
COMMUNITY AMENITIES
None
Swimming pool | Spa | On-site laundry facility | Courtyard | Barbecue and picnic area | Leasing office | Pets allowed
UNIT AMENITIESBalcony or patio | Additional storage space | Vaulted ceilings | Self-cleaning oven | Microwave | Dishwasher | Garbage disposal | Air conditioning
CONCESSIONS
COMMENTS
Align PictureHeight 4.24"Width 6.5"
Left: Left of Column A
Align PictureHeight 4.24"Width 6.5"
Left: Left of Column A
Ir Is GardeNs | 28 CLICk HERE TO ACCESS DUE DILIGENCE
reNt coMParaBles
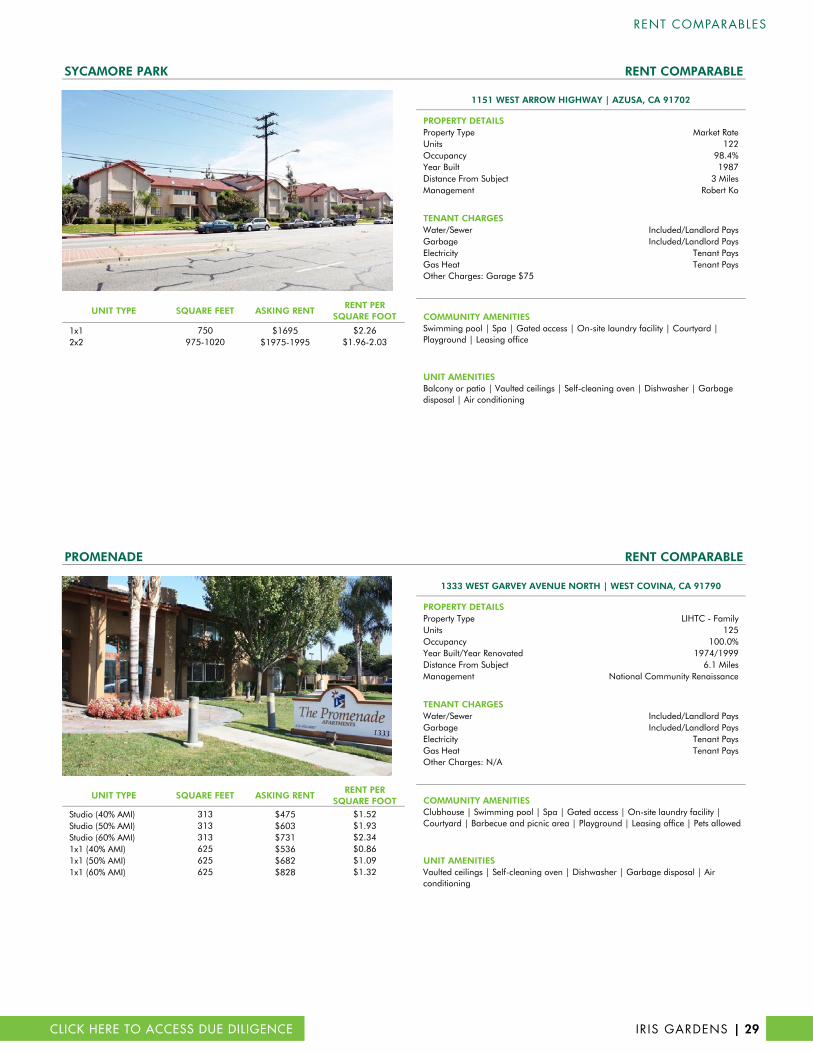
PROPERTY DETAILSProperty Type Market RateUnits 122Occupancy 98.4%Year Built 1987Distance From Subject 3 MilesManagement Robert KoOwnership Robert Ko
TENANT CHARGESWater/Sewer Included/Landlord PaysGarbage Included/Landlord PaysElectricity Tenant PaysGas Heat Tenant Pays
UNIT TYPE SQUARE FEET ASKING RENTRENT PER
SQUARE FOOT
1x1 750 $1695 $2.262x2 975-1020 $1975-1995 $1.96-2.03
UNIT AMENITIES
CONCESSIONSNone
COMMENTS
PROPERTY DETAILSProperty Type LIHTC - FamilyUnits 125Occupancy 100.0%Year Built/Year Renovated 1974/1999Distance From Subject 6.1 MilesManagement National Community RenaissanceOwnership National Community Renaissance
TENANT CHARGESWater/Sewer Included/Landlord PaysGarbage Included/Landlord PaysElectricity Tenant PaysGas Heat Tenant Pays
UNIT TYPE SQUARE FEET ASKING RENTRENT PER
SQUARE FOOT
Studio (40% AMI) 313 $475 $1.52Studio (50% AMI) 313 $603 $1.93Studio (60% AMI) 313 $731 $2.341x1 (40% AMI) 625 $536 $0.861x1 (50% AMI) 625 $682 $1.091x1 (60% AMI) 625 $828 $1.32
None
COMMUNITY AMENITIES
CONCESSIONS
COMMENTSNone
1333 WEST GARVEY AVENUE NORTH | WEST COVINA, CA 91790
Other Charges: N/A
Clubhouse | Swimming pool | Spa | Gated access | On-site laundry facility | Courtyard | Barbecue and picnic area | Playground | Leasing office | Pets allowed
UNIT AMENITIESVaulted ceilings | Self-cleaning oven | Dishwasher | Garbage disposal | Air conditioning
SYCAMORE PARK RENT COMPARABLE
1151 WEST ARROW HIGHWAY | AZUSA, CA 91702
RENT COMPARABLEPROMENADE
Balcony or patio | Vaulted ceilings | Self-cleaning oven | Dishwasher | Garbage disposal | Air conditioning
None
COMMUNITY AMENITIES
Other Charges: Garage $75
Swimming pool | Spa | Gated access | On-site laundry facility | Courtyard | Playground | Leasing office
Align PictureHeight 4.24"Width 6.5"
Left: Left of Column A
Align PictureHeight 4.24"Width 6.5"
Left: Left of Column A
Ir Is GardeNs | 29 CLICk HERE TO ACCESS DUE DILIGENCE
reNt coMParaBles

PROPERTY DETAILSProperty Type LIHTC - FamilyUnits 158Occupancy 100.0%Year Built 1970Distance From Subject 6.7 MilesManagement Steadfast CompaniesOwnership WNC & Associates
TENANT CHARGESWater/Sewer Included/Landlord PaysGarbage Included/Landlord PaysElectricity Tenant PaysGas Heat Tenant Pays
UNIT TYPE SQUARE FEET ASKING RENTRENT PER
SQUARE FOOT
1x1 (60% AMI) 697 $955 $1.372x1 (60% AMI) 861 $1320 $1.533x1.5 (60% AMI) 1074 $1405 $1.314x2 (60% AMI) 1255 $1669 $1.33
None
PROPERTY DETAILSProperty Type LIHTC - SeniorUnits 188Occupancy 100.0%Year Built 2000Distance From Subject 5.3 MilesManagement USA PropertiesOwnership USA Properties
TENANT CHARGESWater/Sewer Included/Landlord PaysGarbage Included/Landlord PaysElectricity Tenant PaysGas Heat Included/Landlord Pays
UNIT TYPE SQUARE FEET ASKING RENTRENT PER
SQUARE FOOT1x1 (60% AMI) 575 $1225 $2.132x1 (60% AMI) 733 $1469 $2.00
None
Balcony or patio | Hardwood floors | Walk-in closets | Additional storage space | Vaulted ceilings | Self-cleaning oven | Microwave | Dishwasher | Garbage disposal | Air conditioning
CONCESSIONS
COMMENTSNone
RENT COMPARABLE
UNIT AMENITIESWalk-in closets | Self-cleaning oven | Garbage disposal | Air conditioning
COMMUNITY AMENITIES
CONCESSIONS
None
RENT COMPARABLE
CAMERON PARK
929 WEST CAMERON AVENUE | WEST COVINA, CA 91790
COMMUNITY AMENITIES
Other Charges: N/A
Business center | Gated access | On-site laundry facility | Courtyard | Barbecue and picnic area | Playground
VINTAGE GARDENS
1950 BADILLO STREET | WEST COVINA, CA 91791
Other Charges: N/A
Business center | Clubhouse | Fitness center | Swimming pool | Spa | Elevator Service | Gated access | On-site laundry facility | Courtyard | Barbecue and picnic area | Leasing office
UNIT AMENITIES
Align PictureHeight 4.24"Width 6.5"
Left: Left of Column A
Align PictureHeight 4.24"Width 6.5"
Left: Left of Column A
Ir Is GardeNs | 30 CLICk HERE TO ACCESS DUE DILIGENCE
reNt coMParaBles

PROPERTY DETAILSProperty Type Market RateUnits 112Occupancy 95.5%Year Built 1979/2012Distance From Subject 3.9 MilesManagement Hanes Investment RealtyOwnership Hanes Investment Realty
TENANT CHARGESWater/Sewer Included/Landlord PaysGarbage Included/Landlord PaysElectricity Tenant PaysGas Heat Tenant Pays
UNIT TYPE SQUARE FEET ASKING RENTRENT PER
SQUARE FOOT
Studio 540 $1499 $2.781x1 765 $1739 $2.272x2 967 $1999 $2.073x2 1027 $2210 $2.15
None
BRADBURY PARK RENT COMPARABLE
2222 EAST HUNTINGTON DRIVE | DUARTE, CA 91010
COMMUNITY AMENITIES
Other Charges: N/A
Clubhouse | Swimming pool | Spa | Gated access | On-site laundry facility | Barbecue and picnic area | Playground | Tennis court | Basketball court
UNIT AMENITIESBalcony or patio | Vaulted ceilings | Self-cleaning oven | Dishwasher | Garbage disposal | Air conditioning
CONCESSIONS
COMMENTSNone
Align PictureHeight 4.24"Width 6.5"
Left: Left of Column A
Ir Is GardeNs | 31 CLICk HERE TO ACCESS DUE DILIGENCE
reNt coMParaBles

1. Iris Gardens
2. azusa Gardens
3. canyon Gardens
4. tribeca
5. villa Monterey
6. casa Madrid
7. sycamore Park
8. Promenade
9. cameron Park
10. vintage Gardens
11. Bradbury Park
renTCOMPARABLES
Ir Is GardeNs | 32 CLICk HERE TO ACCESS DUE DILIGENCE
reNt coMParaBles

sale coMParaBles

IRIS GARDENS SUMMARY OF SALE COMPARABLESAzusa, CAYear Built: 1961 & 1962 / Renovated: 2000Units: 120
Sorted by Sale Price Per Unit
Property Property Type Close Date Year Built Sale Price UnitsSale PricePer Unit
Cap Rate Average RentDistance to
Subject (Miles)
South Hills Market Rate Mar-20 1966 / 2018 $31,950,000 85 $375,882 4.50% $2,420 4.9Hills at Diamond Bar Market Rate Oct-19 1979 / 2016 $72,250,000 204 $354,167 4.25% $2,073 11.7Cameron Park LIHTC - Family Aug-19 1970 $52,858,000 158 $334,544 N/A $1,254 6.7The Atrium Market Rate Oct-19 1963 $9,700,000 39 $248,718 5.51% $1,473 11.5Atrium at West Covina Market Rate Oct-18 1962 / 2011 $33,900,000 138 $245,652 4.90% $1,868 4.2Riverstone Market Rate Nov-19 1972 / 2006 $10,825,000 45 $240,556 4.35% $1,461 9.6Carolton Market Rate Mar-19 1964 $11,295,000 47 $240,319 5.40% $1,286 10.1Pacific Trails Market Rate Sep-18 1977 / 2017 $19,600,000 84 $233,333 4.77% $1,971 2.0The Parker Market Rate Jan-19 1963 / 2018 $40,500,000 177 $228,814 4.94% $1,682 11.1Rockvale Market Rate Dec-19 1960 $7,500,000 34 $220,588 4.25% $1,464 0.1IIrriiss GGaarrddeennss LLIIHHTTCC -- FFaammiillyy 11996611 && 11996622 // 22000000 $$2233,,000000,,000000 112200 $$119911,,666677 55..2244%% $$11,,223377Olive Ridge Resort Market Rate Dec-18 1971 $37,000,000 220 $168,182 5.00% $1,480 9.8
Averages $29,198,167 113 $256,868 4.83% $1,639
Sorted by Cap Rates
Property Property Type Close Date Year Built Sale Price UnitsSale PricePer Unit
Cap Rate Average RentDistance to
Subject (Miles)
Rockvale Market Rate Dec-19 1960 $7,500,000 34 $220,588 4.25% $1,464 0.1Hills at Diamond Bar Market Rate Oct-19 1979 / 2016 $72,250,000 204 $354,167 4.25% $2,073 11.7Riverstone Market Rate Nov-19 1972 / 2006 $10,825,000 45 $240,556 4.35% $1,461 9.6South Hills Market Rate Mar-20 1966 / 2018 $31,950,000 85 $375,882 4.50% $2,420 4.9Pacific Trails Market Rate Sep-18 1977 / 2017 $19,600,000 84 $233,333 4.77% $1,971 2.0Atrium at West Covina Market Rate Oct-18 1962 / 2011 $33,900,000 138 $245,652 4.90% $1,868 4.2The Parker Market Rate Jan-19 1963 / 2018 $40,500,000 177 $228,814 4.94% $1,682 11.1Olive Ridge Resort Market Rate Dec-18 1971 $37,000,000 220 $168,182 5.00% $1,480 9.8IIrriiss GGaarrddeennss LLIIHHTTCC -- FFaammiillyy 11996611 && 11996622 // 22000000 $$2233,,000000,,000000 112200 $$119911,,666677 55..2244%% $$11,,223377Carolton Market Rate Mar-19 1964 $11,295,000 47 $240,319 5.40% $1,286 10.1The Atrium Market Rate Oct-19 1963 $9,700,000 39 $248,718 5.51% $1,473 11.5Cameron Park LIHTC - Family Aug-19 1970 $52,858,000 158 $334,544 N/A $1,254 6.7
Averages $29,198,167 113 $256,868 4.83% $1,639
Sorted by Average Rents
Property Property Type Close Date Year Built Sale Price UnitsSale PricePer Unit
Cap Rate Average RentDistance to
Subject (Miles)
South Hills Market Rate Mar-20 1966 / 2018 $31,950,000 85 $375,882 4.50% $2,420 4.9Hills at Diamond Bar Market Rate Oct-19 1979 / 2016 $72,250,000 204 $354,167 4.25% $2,073 11.7Pacific Trails Market Rate Sep-18 1977 / 2017 $19,600,000 84 $233,333 4.77% $1,971 2.0Atrium at West Covina Market Rate Oct-18 1962 / 2011 $33,900,000 138 $245,652 4.90% $1,868 4.2The Parker Market Rate Jan-19 1963 / 2018 $40,500,000 177 $228,814 4.94% $1,682 11.1Olive Ridge Resort Market Rate Dec-18 1971 $37,000,000 220 $168,182 5.00% $1,480 9.8The Atrium Market Rate Oct-19 1963 $9,700,000 39 $248,718 5.51% $1,473 11.5Rockvale Market Rate Dec-19 1960 $7,500,000 34 $220,588 4.25% $1,464 0.1Riverstone Market Rate Nov-19 1972 / 2006 $10,825,000 45 $240,556 4.35% $1,461 9.6Carolton Market Rate Mar-19 1964 $11,295,000 47 $240,319 5.40% $1,286 10.1Cameron Park LIHTC - Family Aug-19 1970 $52,858,000 158 $334,544 N/A $1,254 6.7IIrriiss GGaarrddeennss LLIIHHTTCC -- FFaammiillyy 11996611 && 11996622 // 22000000 $$2233,,000000,,000000 112200 $$119911,,666677 55..2244%% $$11,,223377
Averages $29,198,167 113 $256,868 4.83% $1,639
Ir Is GardeNs | 34 CLICk HERE TO ACCESS DUE DILIGENCE
sale coMParaBles

UNIT TYPE NUMBER OF UNITSProperty Type Market Rate Studio 28Units 220 1x1 152Occupancy 98.0% 2x1 40Year Built 1971Close Date December 18, 2018
SALE SPECIFICSSale Price $37,000,000 Price Per SF $231Price Per Unit $168,182 Average SF 729Average Rent $1,480 Buyer Positive InvestmentsCap Rate 5.00%
COMMENTS
UNIT TYPE NUMBER OF UNITSProperty Type Market Rate 1x1 17Units 34 2x1 17Occupancy 100.0% 3x1 1Year Built 1960Close Date December 31, 2019
SALE SPECIFICSSale Price $7,500,000 Price Per SF $297Price Per Unit $220,588 Average SF 742Average Rent $1,464 Buyer Positive InvestmentsCap Rate 4.25%
COMMENTS
UNIT TYPE NUMBER OF UNITSProperty Type Market Rate Studio 22Units 177 1x1 116Occupancy 97.8% 2x1 23Year Built/Year Renovated 1963/2018 2x2 16Close Date January 10, 2019
SALE SPECIFICSSale Price $40,500,000 Price Per SF $346Price Per Unit $228,814 Average SF 660Average Rent $1,682 Buyer Uhon Inc.Cap Rate 4.94%
COMMENTS
1031 Exchange
1031 Exchange
SALE COMPARABLEROCKVALE
333 N. ROCKVALE AVENUE | AZUSA, CA 91702
4640 ARDEN WAY | EL MONTE, CA 91731
SALE COMPARABLETHE PARKER
PROPERTY DETAILS
PROPERTY DETAILS
PROPERTY DETAILS
OLIVE RIDGE RESORT SALE COMPARABLE
2261 VALLEY BOULEVARD | POMONA, CA 91768
Ir Is GardeNs | 35 CLICk HERE TO ACCESS DUE DILIGENCE
sale coMParaBles

UNIT TYPE NUMBER OF UNITSProperty Type Market Rate Studio 2Units 84 1x1 42Occupancy 95.5% 2x2 40Year Built/Year Renovated 1977/2017Close Date September 20, 2018
SALE SPECIFICSSale Price $19,600,000 Price Per SF $332Price Per Unit $233,333 Average SF 703Average Rent $1,971 Buyer Korda GroupCap Rate 4.77%
COMMENTS
UNIT TYPE NUMBER OF UNITSProperty Type Market Rate 1x1 20Units 39 2x1 19Occupancy 97.5%Year Built 1963Close Date October 19, 2019
SALE SPECIFICSSale Price $9,700,000 Price Per SF $303Price Per Unit $248,718 Average SF 822Average Rent $1,473 Buyer The Bascom GroupCap Rate 5.51%
UNIT TYPE NUMBER OF UNITSProperty Type Market Rate 1x1 17Units 47 2x1 30Occupancy 100.0%Year Built 1964Close Date March 29, 2019
SALE SPECIFICSSale Price $11,295,000 Price/SF $218Price Per Unit $240,319 Average SF 1,103Average Rent $1,286 Buyer YNL PropertiesCap Rate 5.40%
COMMENTS
PROPERTY DETAILS
SALE COMPARABLEPACIFIC TRAILS
18615 EAST ARROW HIGHWAY | COVINA, CA 91722
THE ATRIUM SALE COMPARABLE
3733 GIBSON ROAD | EL MONTE, CA 91731
CAROLTON SALE COMPARABLE
11690 RAMONA BOULEVARD | EL MONTE, CA 91732
PROPERTY DETAILS
COMMENTS
PROPERTY DETAILS
Ir Is GardeNs | 36 CLICk HERE TO ACCESS DUE DILIGENCE
sale coMParaBles
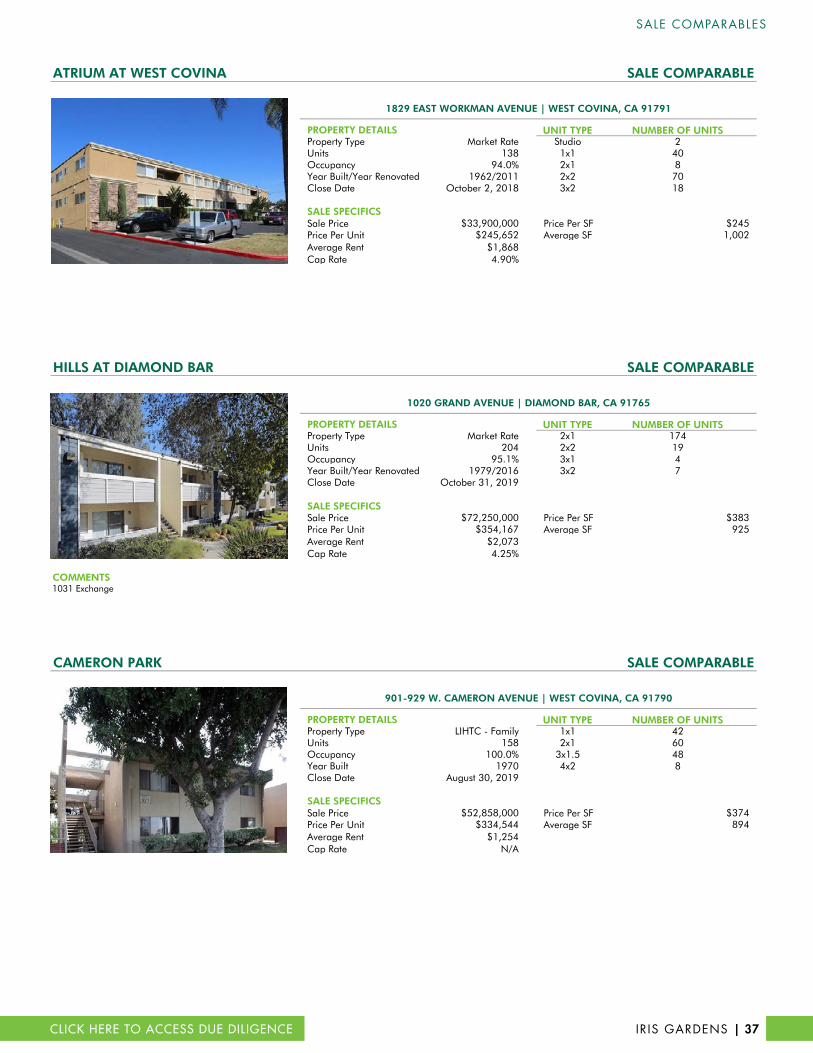
UNIT TYPE NUMBER OF UNITSProperty Type Market Rate Studio 2Units 138 1x1 40Occupancy 94.0% 2x1 8Year Built/Year Renovated 1962/2011 2x2 70Close Date October 2, 2018 3x2 18
Sale Price $33,900,000 Price Per SF $245Price Per Unit $245,652 Average SF 1,002Average Rent $1,868 Buyer Abacus Capital GroupCap Rate 4.90%
UNIT TYPE NUMBER OF UNITSProperty Type Market Rate 2x1 174Units 204 2x2 19Occupancy 95.1% 3x1 4Year Built/Year Renovated 1979/2016 3x2 7Close Date October 31, 2019
SALE SPECIFICSSale Price $72,250,000 Price Per SF $383Price Per Unit $354,167 Average SF 925Average Rent $2,073 Buyer Malik ZamanCap Rate 4.25%
UNIT TYPE NUMBER OF UNITSProperty Type LIHTC - Family 1x1 42Units 158 2x1 60Occupancy 100.0% 3x1.5 48Year Built 1970 4x2 8Close Date August 30, 2019
Sale Price $52,858,000 Price Per SF $374Price Per Unit $334,544 Average SF 894Average Rent $1,254 Buyer Foundation For Affordable HousingCap Rate N/A
1020 GRAND AVENUE | DIAMOND BAR, CA 91765
COMMENTS
PROPERTY DETAILS
PROPERTY DETAILS
COMMENTS
COMMENTS1031 Exchange
CAMERON PARK SALE COMPARABLE
901-929 W. CAMERON AVENUE | WEST COVINA, CA 91790
SALE SPECIFICS
PROPERTY DETAILS
ATRIUM AT WEST COVINA SALE COMPARABLE
1829 EAST WORKMAN AVENUE | WEST COVINA, CA 91791
SALE SPECIFICS
SALE COMPARABLEHILLS AT DIAMOND BAR
Ir Is GardeNs | 37 CLICk HERE TO ACCESS DUE DILIGENCE
sale coMParaBles

UNIT TYPE NUMBER OF UNITSProperty Type Market Rate 1x1 20Units 85 2x1.5 36Occupancy 100.0% 2x2 8Year Built/Year Renovated 1966/2018 3x2 21Close Date March 23, 2020
SALE SPECIFICSSale Price $31,950,000 Price Per SF $302Price Per Unit $375,882 Average SF 1,246Average Rent $2,420 Buyer Martha Koll KerstnerCap Rate 4.50%
UNIT TYPE NUMBER OF UNITSProperty Type Market Rate 1x1 8Units 45 2x1 22Occupancy 95.6% 3x2 15Year Built 1972/2006Close Date November 6, 2019
SALE SPECIFICSSale Price $10,825,000 Price Per SF $269Price Per Unit $240,556 Average SF 893Average Rent $1,461 Buyer BAG InvestmentsCap Rate 4.35%
PROPERTY DETAILS
COMMENTS
COMMENTS1031 Exchange
PROPERTY DETAILS
3939 MAXSON ROAD | EL MONTE, CA 91732
SALE COMPARABLESOUTH HILLS
2900 E. VIRGINIA AVENUE | WEST COVINA, CA 91791
RIVERSTONE SALE COMPARABLE
Ir Is GardeNs | 38 CLICk HERE TO ACCESS DUE DILIGENCE
sale coMParaBles

1. Iris Gardens
2. olive ridge resort
3. the Parker
4. Pacific trails
5. the atrium
6. carolton
7. atrium at West covina
8. hills at diamond Bar
9. cameron Park
10. south hills
11. rockvale
12. riverstone
saLeCOMPARABLES
Ir Is GardeNs | 39 CLICk HERE TO ACCESS DUE DILIGENCE
sale coMParaBles

AFFILIATED BUSINESS DISCLOSURE
CBRE, Inc. operates within a global family of companies with many subsidiaries and related entities (each an “Affiliate”) engaging in a broad range of commercial real estate businesses including, but not limited to, brokerage services, property and facilities management, valuation, investment fund management and development. At times different Affiliates, including CBRE Global Investors, Inc. or Trammell Crow Company, may have or represent clients who have competing interests in the same transaction. For example, Affiliates or their clients may have or express an interest in the property described in this Memorandum (the “Property”), and may be the successful bidder for the Property. Your receipt of this Memorandum constitutes your acknowledgement of that possibility and your agreement that neither CBRE, Inc. nor any Affiliate has an obligation to disclose to you such Affiliates’ interest or involvement in the sale or purchase of the Property. In all instances, however, CBRE, Inc. and its Affiliates will act in the best interest of their respective client(s), at arms’ length, not in concert, or in a manner detrimental to any third party. CBRE, Inc. and its Affiliates will conduct their respective businesses in a manner consistent with the law and all fiduciary duties owed to their respective client(s).
CONFIDENTIALITY AGREEMENT
Your receipt of this Memorandum constitutes your acknowledgement that (i) it is a confidential Memorandum solely for your limited use and benefit in determining whether you desire to express further interest in the acquisition of the Property, (ii) you will hold it in the strictest confidence, (iii) you will not disclose it or its contents to any third party without the prior written authorization of the owner of the Property (“Owner”) or CBRE, Inc., and (iv) you will not use any part of this Memorandum in any manner detrimental to the Owner or CBRE, Inc. If after reviewing this Memorandum, you have no further interest in purchasing the Property, kindly return it to CBRE, Inc.
DISCLAIMER
This Memorandum contains select information pertaining to the Property and the Owner, and does not purport to be all-inclusive or contain all or part of the information which prospective investors may require to evaluate a purchase of the Property. The information contained in this Memorandum has been obtained from sources believed to be reliable, but has not been verified for accuracy, completeness, or fitness for any particular purpose. All information is presented “as is” without representation or warranty of any kind. Such information includes estimates based on forward-looking assumptions relating to the general economy, market conditions, competition and other factors which are subject to uncertainty and may not represent the current or future performance of the Property. All references to acreages, square footages, and other measurements are approximations. This Memorandum describes certain documents, including leases and other materials, in summary form. These summaries may not be complete nor accurate descriptions of the full agreements referenced. Additional information and an opportunity to inspect the Property may be made available to qualified prospective purchasers. You are advised to independently verify the accuracy and completeness of all summaries and information contained herein, to consult with independent legal and financial advisors, and carefully investigate the economics of this transaction and Property’s suitability for your needs. ANY RELIANCE ON THE CONTENT OF THIS MEMORANDUM IS SOLELY AT YOUR OWN RISK.
The Owner expressly reserves the right, at its sole discretion, to reject any or all expressions of interest or offers to purchase the Property, and/or to terminate discussions at any time with or without notice to you. All offers, counteroffers, and negotiations shall be non-binding and neither CBRE, Inc. nor the Owner shall have any legal commitment or obligation except as set forth in a fully executed, definitive purchase and sale agreement delivered by the Owner.
PHOTOGRAPHY
Photos herein are the property of their respective owners. Use of these images without the express written consent of the owner is prohibited.

FOR MORE INFORMATION, PLEASE CONTACT THE LISTING BROkERS BELOW:
CBRE AFFORDABLE HOUSING
1420 FIFTH AVENUE, SUITE 1700
SEATTLE, WA 98101
TIMOTHY FLINT
+ 1 206 826 5725lIc. [email protected]
TAYLOR FROLAND
+ 1 206 826 5764lIc. [email protected]
MATTHEW kOT
+ 1 206 664 9322lIc. [email protected]
CBRE NEWPORT BEACH
3501 JAMBOREE ROAD, SUITE 100
NEWPORT BEACH, CA 92660
DEAN zANDER
+ 1 310 550 2599lIc. [email protected]
STEW WESTON
+ 1 949 725 8416lIc. [email protected]
JOHN MONTAkAB
+ 1 909 418 2248lIc. 1837657JohN.MoNta [email protected]
FOR UNDERWRITING QUESTIONS, PLEASE CONTACT:
CHRIS LEIN
+ 1 206 664 [email protected]
TO SCHEDULE YOUR TOUR OF THE PROPERTY, PLEASE CONTACT:
HANNAH SOMMERS
+ 1 206 664 [email protected]
| INV
ESTMEN
T PROPERTIES
CA
PITAL M
ARk
ETS