Iris Erlund - ethesis.helsinki.fiethesis.helsinki.fi/julkaisut/maa/skemi/vk/erlund/chemical.pdf ·...
92
Iris Erlund CHEMICAL ANALYSIS AND PHARMACOKINETICS OF THE FLAVONOIDS QUERCETIN, HESPERETIN AND NARINGENIN IN HUMANS ACADEMIC DISSERTATION To be presented, with the permission of the Faculty of Agriculture and Forestry of the University of Helsinki, for Public criticism in Auditorium XII, University Main Building, on November 8, 2002, at 12 o’clock. Department of Health and Functional Capacity, National Public Health Institute Department of Applied Chemistry and Microbiology, University of Helsinki Helsinki 2002
Transcript of Iris Erlund - ethesis.helsinki.fiethesis.helsinki.fi/julkaisut/maa/skemi/vk/erlund/chemical.pdf ·...

Iris Erlund
CHEMICAL ANALYSIS AND PHARMACOKINETICS OF THE
FLAVONOIDS QUERCETIN, HESPERETIN AND NARINGENIN
IN HUMANS
ACADEMIC DISSERTATION
To be presented, with the permission of the Faculty of Agriculture and Forestry of theUniversity of Helsinki, for Public criticism in Auditorium XII, University Main Building, on
November 8, 2002, at 12 o’clock.
Department of Health and Functional Capacity, National Public Health Institute
Department of Applied Chemistry and Microbiology, University of Helsinki
Helsinki 2002
Publications of the National Public Health Institute (KTL) A27/2002
Copyright © National Public Health Institute
Julkaisija-Utgivare-Publisher
Kansanterveyslaitos (KTL)Mannerheimintie 16600300 HelsinkiPuhelin vaihde (09) 474 41, telefax (09) 4744 8408
FolkhälsoinstitutetMannerheimvägen 16600300 HelsingforsTelefon växel (09) 474 41, telefax (09) 4744 8408
National Public Health InstituteMannerheimintie 16600300 Helsinki, FINLANDTelephone +358 9 474 41, telefax +358 9 4744 8408
ISBN 951-740-319-4 (printed version)
ISSN 0359-3584
ISBN 951-740-320-8 (pdf-version; http://ethesis.helsinki.fi)
ISSN 1458-6290
Yliopistopaino, Helsinki 2002

Supervisors
Docent Georg Alfthan
Biomarker Laboratory
Department of Health and Functional Capacity
National Public Health Institute
Professor Antti Aro
Department of Health and Functional Capacity
National Public Health Institute
Reviewers
Professor Heikki Vapaatalo
Institute of Biomedicine, Pharmacology
University of Helsinki
Dr. Sari Mäkelä
Functional Foods Forum
University of Turku
and
Department of Medical Nutrition
Karolinska Institutet
Huddinge, Sweden
Opponent
Professor Hannu Mykkänen
Department of Clinical Nutrition
University of Kuopio

CONTENTS
ABSTRACT
LIST OF ORIGINAL PUBLICATIONS
ABBREVIATIONS
1. INTRODUCTION……………………………………………………….10
2. REVIEW OF THE LITERATURE……………………………………... 12
2.1. Definitions…………………………………………………………...12
2.1.1. Bioavailability………………………………………………...12
2.1.2. Pharmacokinetics…………………………………………….. 13
2.1.3. Biomarkers……………………………………………………18
2.2. Flavonoids………………………………………………………….. 19
2.2.1. Chemistry and classification…………………………………. 19
2.2.2. Occurrence in foods………………………………………….. 21
2.3. Quercetin, hesperetin and naringenin………………………………. 25
2.3.1. Biological activities…………………………………………...25
2.3.2. Analysis from human plasma and urine………………………28
2.3.3. Bioavailability and pharmacokinetics………………………...30
2.3.4. Metabolism……………………………………………………35
2.3.5. Quercetin as a biomarker of intake……………………….….. 37
2.3.6. Association between quercetin intake and risk of
chronic diseases……………………………………………….39
3. AIMS OF THE STUDY…………………………………………………41
4. SUBJECTS AND STUDY DESIGNS………………………………….. 42
5. METHODS………………………………………………………………46
5.1. Analytical methods………………………………………………….46
5.2. Pharmacokinetic methods………………………………………….. 48
5.3. Assessment of flavonoid intake……………………………………..49
5.4. Statistical methods…………………………………………………..49

6. RESULTS……………………………………………………………….. 51
6.1. Analysis of quercetin, hesperetin and naringenin (I, IV)………..…. 51
6.2. Pharmacokinetics and bioavailability of quercetin from
quercetin aglycone and rutin (II) …………………………….…….. 54
6.3. Pharmacokinetics and bioavailability of hesperetin and
naringenin from citrus juices (IV) …………………………….……59
6.4. Bioavailability of quercetin from berries and the diet (III)………… 62
7. DISCUSSION……………………………………………………………63
7.1. Analytical methods…………………………………………….. ….. 63
7.2. Pharmacokinetics of quercetin, hesperetin and naringenin………… 65
7.3. Bioavailability of quercetin from berries and the diet………………71
7.4. Plasma and urine quercetin, hesperetin and naringenin as
biomarkers of intake…………………………………………….… 73
7.5. Future directions……………………………………………….. ….. 75
8. SUMMARY AND CONCLUSIONS……………………………………76
9. ACKNOWLEDGEMENTS……………………………………………...78
10. REFERENCES………………………………………………………….80

ABSTRACT
Flavonoids are phenolic compounds widely present in plants and foods of plant origin.
Experimental and epidemiological studies have suggested a protective role for the
compounds on human health, but until recently, because methods for their analysis in
tissues were lacking, knowledge about their bioavailability, pharmacokinetics and
metabolic fate in humans was limited.
The primary aims of the studies presented in this thesis were to develop methods
suited for the analysis of the flavonoids quercetin, hesperetin and naringenin in human
plasma and urine. Other aims were to investigate their bioavailability,
pharmacokinetics and use as biomarkers of intake. The compounds were chosen on the
basis of experimental and epidemiological evidence, and dietary intake.
The analytical methods developed allowed the analysis of low concentrations of
quercetin in plasma, and hesperetin and naringenin in plasma and urine, with good
reproducibility. The methods were based on solid-phase and liquid-liquid extraction
and high-performance liquid chromatography with electrochemical detection.
The pharmacokinetics and bioavailability of quercetin were studied in subjects
ingesting single doses of quercetin aglycone and rutin, and in subjects consuming
berries or their habitual diets for several weeks. In the first human study, healthy
volunteers received three different doses of quercetin aglycone or rutin orally in a
double-blind, diet-controlled, cross-over setting. The overall kinetic behaviour of
quercetin differed after the two treatments, although the mean Cmax and AUC(0-32)
values were similar. Quercetin from quercetin aglycone was absorbed rapidly from the
upper parts of the gastrointestinal tract, while quercetin from rutin appeared to be
absorbed from the distal parts of the small intestine or the colon. Especially after
ingestion of rutin, marked variation in plasma levels occurred. Furthermore, quercetin
from rutin was more bioavailable in women than in men. T1/2 of quercetin ranged

between 15 and 18 h. In the second human study, middle-aged men consumed 100
g/day in total of lingonberries, black currants and bilberries for two months, or their
habitual diets. Plasma quercetin concentrations were 30-50% higher in the berry group
than in the control. When the men were still on their habitual diets, the mean plasma
concentration was 16 ± 13 µg/l.
The pharmacokinetics and bioavailability of the flavanones hesperetin and naringenin
were investigated in a study where healthy volunteers ingested 400-760 ml of orange
juice or grapefruit juice once. Relatively high concentrations of flavanones were
reached in plasma, but interindividual variation in plasma levels was marked. Both
flavanones appeared to be absorbed from the distal parts of the small intestine or the
colon, and their plasma half-lifes were similar (1-2 h). The mean urinary recovery of
naringenin was 1% from orange juice and 30% from grapefruit juice. The
corresponding value for hesperetin from orange juice was 5%. These values are
minimum estimates for bioavailability.
The results of the studies indicate that plasma quercetin is a fairly good biomarker of
intake. Its plasma concentrations increase with increasing dose, and it has a
comparatively long half-life. It is also bioavailable from a typical Finnish diet. Fasting
plasma and especially urine flavanone levels, by contrast, appear to be less useful as
biomarkers of intake.
In conclusion, methods for the analysis of quercetin, hesperetin and naringenin in
human plasma and urine were developed. Quercetin was shown to be bioavailable
from capsules, berries and the diet, and hesperetin and naringenin from citrus juices.

LIST OF ORIGINAL PUBLICATIONS
This thesis is based on the following original publications, referred to in the text by
their Roman numerals.
I. Erlund I1, Alfthan G, Siren H, Ariniemi K, Aro A. Validated method for the
quantitation of quercetin from human plasma using high-performance liquid
chromatography with electrochemical detection. J Chromatogr B
1999;727:179-189.
II. Erlund I1, Kosonen T, Alfthan G, Mäenpää J, Perttunen K, Kenraali J,
Parantainen J, Aro A. Pharmacokinetics of quercetin from quercetin aglycone
and rutin in healthy volunteers. Eur J Clin Pharmacol 2000;56:545-553.
III. Erlund I1, Marniemi J, Hakala P, Alfthan G, Meririnne E, Aro A. Consumption
of black currants, lingonberries and bilberries increases serum quercetin
concentrations. Eur J Clin Nutr 2002 (in press).
IV. Erlund I1, Meririnne E, Alfthan G, Aro A. Plasma kinetics and urinary excretion
of the flavanones naringenin and hesperetin in humans after ingestion of orange
juice and grapefruit juice. J Nutr 2001;131:235-241.
These papers are reproduced with the permission of their respective publishers:
Elsevier Science, Springer-Verlag, Nature Publishing Group and the American Society
for Nutritional Sciences.
1Author contributed to the design of the study, data collection, chemical and statistical analyses,
interpretation of results and writing of manuscript.
ABBREVIATIONS
ATBC Alpha-Tocopherol, Beta-Carotene Cancer Prevention Study
AUC area under plasma concentration-time curve
BMI body mass index
Clren renal clearance
Cmax maximum plasma concentration
CYP cytochrome P450
HDL high-density lipoprotein
HPLC high-performance liquid chromatography
LDL low-density lipoprotein
MPR multi drug resistance-associated protein
SGLT sodium-dependent D-glucose cotransporter
SULT cytosolic sulfotransferase
T1/2 elimination half-life
Tmax time to reach Cmax
UGT uridine diphosphate glucuronosyltransferase
10
1. INTRODUCTION
A diet rich in vegetables and fruit has long been recognized to protect against chronic
diseases such as cardiovascular disease and cancer. Lifestyle factors, such as sufficient
physical activity, abstinence from smoking, and a low-energy diet, probably explain a
large part of this protection. Individual constituents of the diet or plants may also play
a role. Until recently, nutritional research mainly focused on fats, carbohydrates,
proteins, vitamins and minerals. The existence of secondary plant metabolites, often
present in high quantities in the fibre fraction of plants, was largely ignored. Today,
however, many of these compounds, although they are not essential for maintaining
life, are recognized as being potentially beneficial to human health.
Flavonoids comprise one of the largest and most widely distributed groups of
secondary plant metabolites (Kühnau 1976, Robards and Antolovich 1997). That they
possess promising biological activities has been known for some time, but little
information has been available about their bioavailability, metabolic fate and health
effects in humans. Flavonoids are found in practically all photosynthesizing plants and
therefore all humans consuming foods of plant origin are exposed to them. Flavonoids
are divided into several subgroups and the different compounds possess different
chemical and biological properties. They also have different dietary sources,
bioavailabilities and, most likely, abilities to exert biological actions in vivo.
In this work, the flavonoids quercetin, hesperetin and naringenin were examined. They
were selected because of their promising biological activities, significant dietary intake
and epidemiological evidence. Quercetin is the most studied flavonoid, and in vitro
and animal studies indicate antioxidative, anticarcinogenic and anti-inflammatory
activities. Dietary intake of the compound is significant and several epidemiological
studies suggest an inverse association between intake of quercetin and risk of
cardiovascular disease. The flavanones hesperetin and naringenin are present in high

11
concentrations in citrus fruits, and thus, their intake can be rather high in individuals
consuming citrus products regularly. Biological activities ascribed to flavanones
include anticarcinogenic, antioxidant, phytoestrogenic and blood lipid-altering
activities.
In this thesis, methods for the analysis of quercetin, hesperetin and naringenin in
human plasma and urine were developed. In addition, their bioavailability and
pharmacokinetics from pure compounds, fruit juices, berries and the diet were studied.
Information was also obtained about whether their plasma or urine concentrations are
reliable as biomarkers of dietary intake. The work was part of a project studying the
bioavailability of the most important dietary flavonoids, phenolic acids and lignans in
humans, and investigating the associations between their plasma concentrations and
the risk of chronic diseases.
12
2. REVIEW OF THE LITERATURE
2.1. Definitions
2.1.1. Bioavailability
No single definition accurately describing the multiplexity of the term bioavailability
is available. The definition offered by the Food and Drugs Administration (FDA) is
”the rate and extent to which the therapeutic moiety is absorbed and becomes available
to the site of drug action”. Unfortunately, this definition can be misinterpreted in many
ways. In this work, the more commonly used definition ”the fraction of an ingested
dose of a compound which is taken into the systemic circulation”, is used.
Attempts to use the term bioavailability with quantitative precision or to give exact
values for it are likely to fail. In clinical pharmacology, the term absolute
bioavailability is sometimes used to describe the exact amount of compound that
reaches the systemic circulation. It is the fraction of the area under the curve (AUC)
after oral ingestion of the AUC after intravenous administration. In nutrition, however,
relative bioavailability, describing the bioavailability of a compound from one source
compared with another, is a more useful term.
A multitude of factors affect the bioavailability of a compound. Such factors include
the food matrix, the type of pharmaceutical preparation, the chemical form of the
compound, co-ingested compounds and eating itself. However, bioavailability is not
only a property of the compound or the food itself, but of the individual as well.
Factors varying between individuals, also called subject factors, include mucosal mass,
intestinal transit time, rate of gastric emptying and up/down regulation of absorption.
Furthermore, biotransformation of a compound, occurring in the intestinal wall during
absorption or in the liver, can alter the amount of compound reaching the systemic
circulation (= first-pass effect).

13
Several different methods, none of them lacking shortcomings, are used for the
measurement of bioavailability (Heaney 2001). The balance method - measuring the
difference between what is ingested and what is found in the faeces – does not take
into consideration bacterial transformation or degradation of compounds. The tracer
method (using stable or radioactive isotopes) is sensitive and reproducible, but also
fails to take into account biotransformation and degradation. Using the biochemical or
physiological effect of a compound as a measure of bioavailability is promising in
theory, but many problems are associated with this approach. For instance, the effect
of a nutrient can depend on the nutritional status of the individual. The amount of
compound excreted into the urine is sometimes used as a measure of absolute
bioavailability; however, this only describes the minimum amount of compound
absorbed since other routes of excretion, such as biliary excretion, are overlooked.
Plasma or serum concentrations are often used in bioavailability studies, but it should
be kept in mind that a single measurement with no information on time of ingestion
and pharmacokinetics is a poor measure of bioavailability, especially at an individual
level. Repeated measurements or calculations of AUC values give a much more
reliable estimate on bioavailability, although homeostatic factors sometimes limit the
use of this approach.
2.1.2. Pharmacokinetics
In the field of pharmacology, pharmacokinetic parameters are calculated to describe
the kinetics of drug absorption, distribution and elimination. Information about these
processes is important when assessing the time-course of effects of a drug. No
universally accepted term describing the corresponding events for nutrients or
xenobiotics is available. Terms such as ”biokinetics” or ”kinetics” have been used, but
their meanings are broader and they are rather non-descriptive. Therefore, in this
thesis, the term pharmacokinetics is used. However, the viewpoint of the thesis is
nutritional. Also, although quercetin, hesperetin and naringenin are components of

14
over a hundred pharmaceutical preparations sold worldwide, it should be emphasized
that their pharmacological effects have not been demonstrated in clinical studies, and
therefore they cannot be considered to be effective medications.
In the following section, some basic concepts in pharmacokinetics are covered. This
section is mainly based on textbooks edited by Rang and Dale (1991) and Rowland
and Tozer (1995).
Pharmacokinetic models
Following oral administration, the plasma concentration of a compound rises, but
when the rate of elimination exceeds the rate of absorption, its concentration starts to
decline. For many compounds, the disappearance from plasma follows an exponential,
rather than linear, time-course. Different pharmacokinetic models are used to calculate
pharmacokinetic parameters. Important parameters include elimination half-life (T1/2),
AUC, maximum plasma concentration (Cmax), time to reach Cmax (Tmax)
and renal clearance (Clren).
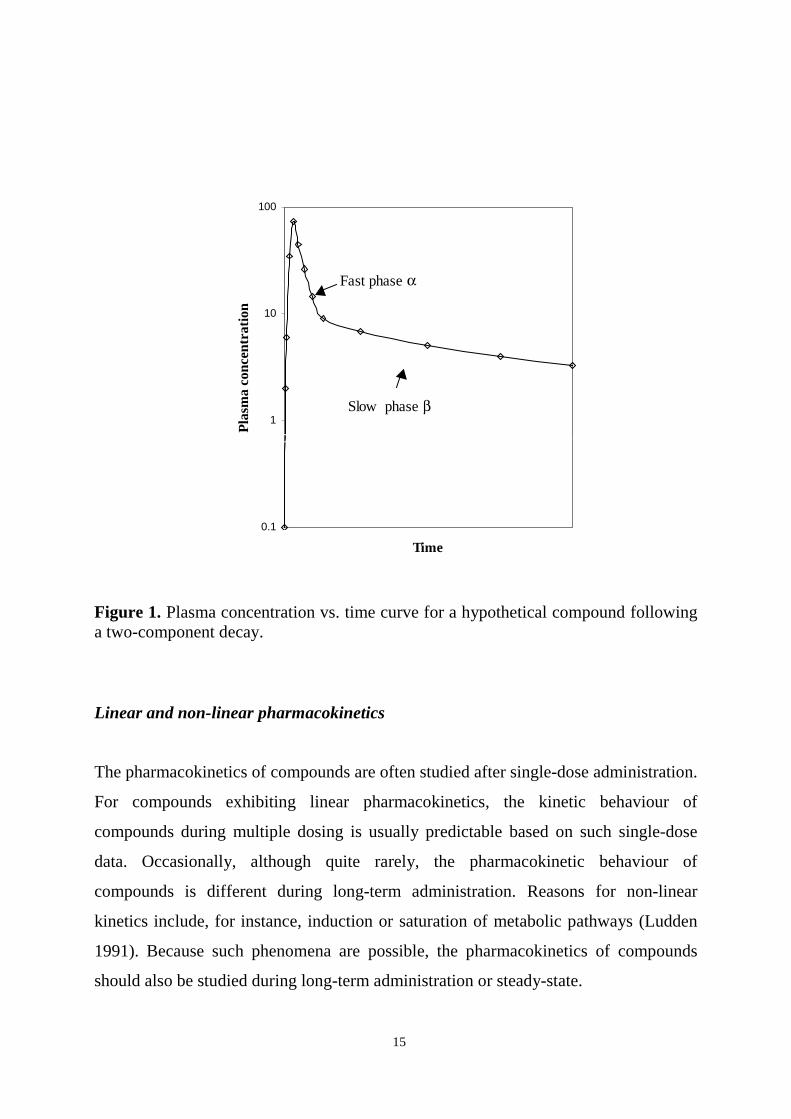
The most commonly used pharmacokinetic model is the two-compartment model. It is
an approximation of a situation where the kinetics becomes bi-exponential. The two
compartments are the central compartment (plasma) from which the compound can
move into (and back from) the peripheral compartment (other tissues). The transfer of
a compound to tissues occurs quickly (the fast phase, α, in Figure 1), and the
elimination of the compound through excretion or metabolism occurs more slowly (the
slow phase, β, can also be distinguished in the graph). The half-lives of the phases are
calculated from the equation T1/2=ln 2/k, where k is the slope of each phase.
15
Figure 1. Plasma concentration vs. time curve for a hypothetical compound followinga two-component decay.
Linear and non-linear pharmacokinetics
The pharmacokinetics of compounds are often studied after single-dose administration.
For compounds exhibiting linear pharmacokinetics, the kinetic behaviour of
compounds during multiple dosing is usually predictable based on such single-dose
data. Occasionally, although quite rarely, the pharmacokinetic behaviour of
compounds is different during long-term administration. Reasons for non-linear
kinetics include, for instance, induction or saturation of metabolic pathways (Ludden
1991). Because such phenomena are possible, the pharmacokinetics of compounds
should also be studied during long-term administration or steady-state.
Fast phase α
0.1
1
10
100
0 60
Time
Pla
sma
conc
entr
atio
n
Slow phase β

16
Absorption
Absorption means the passage of a compound from its site of administration, usually
the gastrointestinal tract, into the bloodstream. Sometimes the term is erroneously used
as a synonym for bioavailability, but in that case the first-pass effect is overlooked.
Factors affecting gastrointestinal absorption include gastrointestinal motility, chemical
factors (ionization, lipid solubility, interaction with gut contents), splanchnic blood
flow, particle size and formulation, and competition for carrier-mediated transport.
Activity and amount of transport proteins and of secretory proteins, such as P-
glycoprotein and multidrug resistance associated protein 2 (MRP2), also affect the net
absorption of compounds (Wagner et al. 2001).
Distribution
A number of factors affect the time-course of distribution and the extent of uptake of
compounds into tissues or cells. Whether a compound can cross membranes depends
on lipid solubility, ionization, molecular weight and the presence of transport systems.
Furthermore, binding to blood components, such as plasma proteins and blood cells,
and to tissue components, affects distribution.
Elimination
Elimination of a compound occurs through excretion by the kidneys, skin or lung, or in
the bile, or by metabolism or degradation. Renal excretion occurs via glomerular
filtration, active tubular secretion or passive diffusion across the tubular epithelium.
Nearly all molecules with a molecular weight < 20 000 kD can cross the glomerular
capillaries. Macromolecules such as albumin, with a molecular weight of 69 000 kD,
do not, and therefore glomerular filtration is not the main excretion mechanism of
compounds bound to this protein. Tubular secretion is a more effective route of
17
elimination. The carrier-mediated transport systems eliminate both acids and bases,
and compounds bound to plasma proteins.
Biotransformation
Biotransformation is an important step in the elimination of many compounds. Phase I
reactions include oxidation, reduction and hydrolysis reactions, which often result in
more reactive compounds than the parent compound. Different conjugation reactions,
i.e. phase II reactions, usually yield less toxic or less active and more readily excreted
metabolites.
The liver has traditionally been considered to be the major site for biotransformation
reactions. However, during the past few years it has become increasingly evident that
extrahepatic tissues, especially the gastrointestinal tract, possess considerable
metabolic potential as well. From the standpoint of first-pass extraction, the most
important biotransformation reaction is oxidation by enzymes belonging to the
cytochrome P450 superfamily. Conjugation with glucuronic acid or sulfate groups also
occur for many xenobiotics. Glucuronidation is mediated by the UGT (UDP-
glucuronosyltransferase) multigene family and sulfation by cytosolic sulfotransferases
(SULT). To date, at least 17 UGT (Meech and McKenzie 1997) and 11 SULT (Glatt
2000) forms have been identified in humans. Interestingly, the isoenzymes differ in
both their substrate specificities and tissue distribution (Her et al. 1996, Thummel et al.
1997, Cheng et al. 1999, Fisher et al. 2000, Glatt 2000). Furthermore, marked
interindividual variation in the synthesis or activity of these enzymes has been
reported.

18
2.1.3. Biomarkers
Biomarkers can reflect exposure, status, disease susceptibility, metabolic effects,
disease occurrence and compliance (Kohlmeier 1991). Nutritional epidemiologists are
mainly interested in biomarkers as measures of dietary intake, which can serve as
quantifiable determinants of disease risk. For more comprehensive reading on
biomarkers in nutritional epidemiology, refer to Bates et al. (1997) and Hunter (1998).
The following section is mainly based on these textbooks.
Assessment of dietary intake by dietary survey methods is associated with many
problems such as under-reporting, inaccurate or lacking food composition data and
variation in nutrient composition of individual foods. Furthermore, in epidemiological
studies, relevant questions sometimes go unanswered because at the time of data
collection, the question had not yet been formulated. These problems can in some
cases be avoided by using the concentrations of specific compounds in human tissues,
mainly plasma, as biomarkers of intake. Plasma concentrations of nutrients do not,
however, always reflect dietary intake because metabolism and pharmacokinetic
properties also have an impact. Therefore, such biomarkers should be carefully
validated before they are used. Important requirements of a tissue biomarker are that it
be sensitive to intake and measureable in tissues. Optimal biomarkers are also readily
available and reflect long-term intake. In reality, few good tissue biomarkers of intake
are available. Exceptions include certain adipose tissue fatty acids and toenail
selenium. Examples of compounds, the plasma concentrations of which reflect intake
poorly, are retinol and calcium.
Several types of studies are informative when evaluating whether a biomarker is
sensitive to changes in intake. Small-scale feeding studies yield information on
pharmacokinetics (including half-life, dose-response, and steady-state concentrations)
and bioavailability. In cross-sectional studies, different intake levels between countries

19
can be compared. Another approach is to compare the biomarker with intake directly
(e.g. when intake is measured from duplicate portions).
2.2. Flavonoids
2.2.1. Chemistry and classification
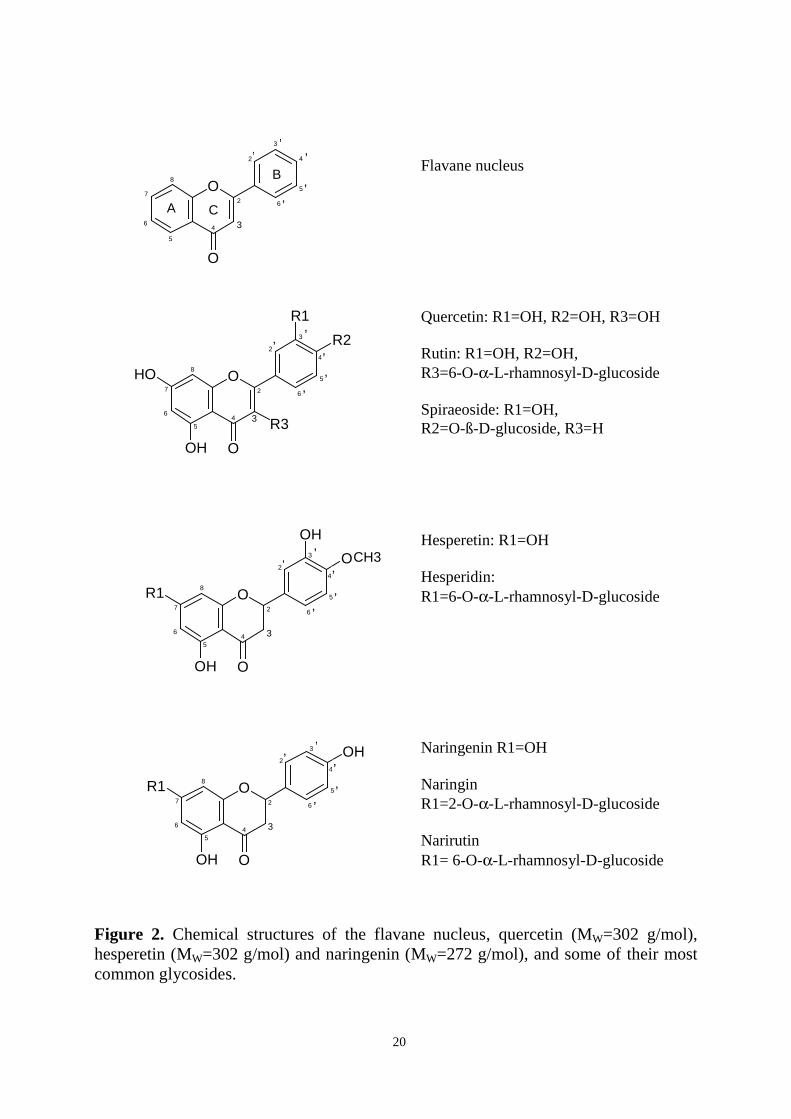
Flavonoids consist of two benzene rings (A and B), which are connected by an
oxygen-containing pyrane ring (C) (Figure 2). Flavonoids containing a hydroxyl group
in position C-3 of the C ring are classified as 3-hydroxyflavonoids (flavonols,
anthocyanidins, leucoanthocyanidins and catechins), and those lacking it as 3-
desoxyflavonoids (flavanones, flavones). Classification within the two families is
based on whether and how additional hydroxyl or methyl groups have been introduced
to the different positions of the molecule. Isoflavonoids differ from the other groups;
the B ring is bound to C-3 of ring C instead of C-2. Anthocyanidins and catechins, on
the other hand, lack the carbonyl group on C-4 (Kühnau 1976).
Flavonoids are mainly present in plants as glycosides. Aglycones (the forms lacking
sugar moieties) occur less frequently. At least 8 different monosaccharides or
combinations of these (di- or trisaccharides) can bind to the different hydroxyl groups
of the flavonoid aglycone (Williams and Harborne 1994). The most common sugar
moieties include D-glucose and L-rhamnose. The glycosides are usually O-glycosides,
with the sugar moiety bound to the hydroxyl group at the C-3 or C-7 position.
To date, over 6000 flavonoids have been identified in plants (Harborne and Williams
2000). The large number is a result of the many possible combinations of flavonoid
aglycones and different sugars. The number of aglycones and flavonoid glycosides
commonly found in edible plants or foods, is much smaller.
20
Figure 2. Chemical structures of the flavane nucleus, quercetin (MW=302 g/mol),hesperetin (MW=302 g/mol) and naringenin (MW=272 g/mol), and some of their mostcommon glycosides.
2
6
5
4
3
27
4
O
3
O8
6
5
R1
OH
OH
O
2
6
5
4
3
27
4
O
3
O8
6
5
2
6
5
4
3
27
4
O
3
O8
6
5
OH
R1
R2
R3
OH
2
6
5
4
3
27
4
O
3
O8
6
5
R1
OH
OH
’’
’
’
’
CA
’’
’
’
’
B
’’
’
’
’
’’
’
’
’
CH3
Naringenin R1=OH
NaringinR1=2-O-α-L-rhamnosyl-D-glucoside
NarirutinR1= 6-O-α-L-rhamnosyl-D-glucoside
Hesperetin: R1=OH
Hesperidin:R1=6-O-α-L-rhamnosyl-D-glucoside
Flavane nucleus
Quercetin: R1=OH, R2=OH, R3=OH
Rutin: R1=OH, R2=OH,R3=6-O-α-L-rhamnosyl-D-glucoside
Spiraeoside: R1=OH,R2=O-ß-D-glucoside, R3=H

21
2.2.2. Occurrence in foods
Flavonoids are present in most edible fruits and vegetables, but the type of flavonoids
obtained from different dietary sources varies. The main dietary flavonoids and their
sources are shown in Table 1. Intake estimates for flavonoids are only available for a
few flavonoid subclasses such as flavonols, flavanones and isoflavones.
Flavonols
The most common flavonol in the diet is quercetin. It is present in various fruits and
vegetables, but the highest concentrations are found in onion (Table 1) (Hertog et al.
1992a). The importance of different foods as quercetin sources varies between
countries. Hertog et al. (1995) calculated flavonol intakes from the Seven Countries
Study, which was started in the late 1950s, and reported that tea was the predominant
source of quercetin in the Netherlands and Japan. Wine was the major source of
quercetin in Italy, while onion and apples contributed most in the US, Finland, Greece
and former Yugoslavia. More recently, Häkkinen et al. (1999) estimated that onions,
followed by tea, apples and berries are the major sources of quercetin in Finland. It
should be noted that onion is usually not consumed in high quantities, but it is an
important source because of its high quercetin content. Tea and especially wine, on the
other hand, contain relatively low amounts of quercetin but are consumed, at least in
some countries, in rather high quantities. The daily intake of quercetin was estimated
to range between 3 and 38 mg in the Seven Countries Study (Hertog et al. 1995), and
in Finnish male smokers, the intake estimate (from the 1980s) was 7.4 mg (Hirvonen
et al. 2001a).
Quercetin is present in plants in many different glycosidic forms (Kühnau 1976) with
quercetin-3-rutinoside, also called quercetin-3-rhamnoglucoside or rutin, being one of
the most widespread forms. In onions, the compound is bound to one or two glucose
molecules (quercetin-4’-glucoside, quercetin-3,4’-glucoside). Other quercetin
glycosides present in the diet are, for instance, quercetin galactosides (apples) and

22
quercetin arabinosides (berries). Other flavonols in the diet include kaempferol
(broccoli), myricetin (berries) and isorhamnetin (onion). The chemical structures of
quercetin and some quercetin glycosides are shown in Figure 2.
Flavanones
Flavanones occur almost exclusively in citrus fruits. The highest concentrations are
found in the solid tissues, but concentrations of several hundred mg per litre are
present in the juice as well (Tomás-Barberán and Clifford 2000). Hesperidin
(hesperetin-7-rutinoside) and narirutin (naringenin-7-rutinoside) are the major
flavonoids of oranges and mandarines. The main flavonoids of grapefruit are naringin
(naringenin-7-neohesperoside) (70%) and narirutin (20%) (Kawaii et al. 1999). Low
concentrations of naringenin are also found in tomatoes and tomato-based products.
Fresh tomatoes, especially tomato skin, also contain naringenin chalcone, which is
converted to naringenin during processing to tomato ketchup (Krause and Galensa
1992). In Finland, the average intake of naringenin has been estimated to be 8.3
mg/day, and for hesperetin 28.3 mg/day (Kumpulainen et al. 1999). The structures of
hesperetin, naringenin and their most important glycosides are shown in Figure 2.
Catechins
Catechins usually occur as aglycones or are esterified with gallic acid. (+)-Catechin
and (-)-epicatechin are found in various fruits and vegetables such as apples, pears,
grapes and peaches (Arts et al. 2000a). The highest concentrations of catechins are
found in tea and red wine (Arts et al. 2000b).

23
Flavones
The main flavones in the diet are apigenin and luteolin. Their dietary intake is rather
low because they occur in significant concentrations in only a few plants, such as red
pepper (Hertog et al. 1992a) and celery (Hertog et al. 1992b) .
Anthocyanidins
Anthocyanins (=anthocyanidin glycosides) are responsible for the red, blue or violet
colour of such edible fruits as plums, apples, aubergine and many berries. The most
common anthocyanidins include pelargonidin, cyanidin, delphinidin and malvidin
(Kühnau 1976).
Isoflavonoids
The predominant isoflavonoids are the isoflavones genistein and daidzein, which occur
mainly in legumes. The highest concentrations are found in soy bean and soy products,
and much lower concentrations are present in other legumes (Mazur 1998, Liggins et
al. 2000), not to mention other vegetables and fruit.

24
Table 1. Main dietary flavonoids and their sources in the diet.
Flavonoid1 Source Content of aglycone(mg/kg)
FlavonolQuercetin-3,4’-glucoside onion 284-4862
Quercetin-3-glucoside
Quercetin-3-rhamnoglucoside (rutin) black tea 10-253
Quercetin-3-galactoside apple 21-722
Quercetin-3-rhamnosideQuercetin-3-arabinosideQuercetin-3-glucoside
Quercetin-3-rhamnoglucoside black currant 444
Quercetin-3-rhamnosideQuercetin-3-galactosideMyrisetin-3-glucoside 714
FlavoneLuteolin-7-apiosylglucoside red pepper 7-142
FlavanoneHesperetin-7-rhamnoglucoside (hesperidin) orange juice 116-2015
Naringenin-7-rhamnoglucoside (narirutin) 15-425
Naringenin-7-rhamnoglucoside (naringin) grapefruit juice 68-3025
Naringenin-7-rhamnoglucoside (narirutin)
Flavanols(+)-Catechin apple 4-166
(-)-Epicatechin 67-1036
(+)-Catechin red wine 16-537
(-)-Epicatechin 9-427
(Epi)catechin and their gallates black tea 102-4187,8
AnthocyaninsCyanidin-3-glucoside black currant 7609
Cyanidin-3-rutinosideDelphinidin-3-glucoside 5909
Delphinidin-3-rutinoside
IsoflavonesGenistein-7-glycoside soy beans 48010
Daidzein-7-glycoside 33010
1Kühnau 1976, 2Hertog et al. 1992a, 3Hertog et al. 1993a, 4Häkkinen et al. 1999, 5Mouly et al.1994, 6Arts et al. 2000a, 7Arts et al. 2000b, 8sum of aglycones and gallates, 9Nyman andKumpulainen 2001,10Mazur et al. 1998

25
2.3. Quercetin, hesperetin and naringenin
2.3.1. Biological activities
A wide range of biological activities have been reported for different flavonoids (for
reviews, see Formica and Regelson 1995, Cook and Samman 1996, Di Carlo et al.
1999, Nijveldt et al. 2001). The most studied flavonoid is quercetin, for which over
2700 citations are listed in PubMed.
Quercetin has been reported to exhibit biological effects such as antioxidant (Hayek et
al. 1997, Chopra et al. 2000), anticarcinogenic (Verma et al. 1988, Deschner 1991,
Pereira 1996), anti-inflammatory (Ferry et al. 1996) and antiaggregatory (Pignatelli et
al. 2000) effects. The mechanisms behind the effects are largely unknown, but it is
possible that several different types of biochemical events precede a biological effect.
The antioxidant effect, for instance, could be a result of metal chelation (Ferrali et al.
1997, Sestili et al. 1998), scavenging of radicals (Huk et al. 1998, Aherne et al. 2000)
and/or enzyme inhibition (Da Silva et al. 1998, Nagao et al. 1999). Anticarcinogenesis,
on the other hand, could result from enzyme inhibition (Agullo et al. 1997, Huang et
al. 1997), antioxidation or effects on gene expression (Hansen et al. 1997, Piantelli et
al. 2000, Xing et al. 2001). Altered gene expression could lie behind the anti-
inflammatory effect (Kobuchi et al. 1999). Regarding anticarcinogenesis, it should be
noted that in the 1970s, quercetin was actually considered to be a carcinogen because
the compound showed mutagenicity in the Ames test (Bjeldanes and Chang 1977).
However, a number of long-term animal studies subsequently performed with different
species have indicated that this is not the case. On the contrary, quercetin has been
shown to inhibit carcinogenesis in laboratory animals (Stavric 1994).
Hesperetin has also attracted the attention of cancer researchers. This compound (and
orange juice) has been shown to inhibit chemically induced mammary (So et al. 1996),
urinary bladder (Yang et al. 1997) and colon (Tanaka et al. 1997, Miyagi et al. 2000)

26
carcinogenesis in laboratory animals, and to have antioxidative effects (Miyake et al.
1998). Other possible effects of hesperetin, as well as the other major citrus flavanone,
naringenin, are on lipid metabolism. They have been reported to regulate
apolipoprotein B secretion by HepG2 cells, possibly through inhibition of cholesterol
ester synthesis (Borradaile et al. 1999), and to inhibit 3-hydroxy-3-methylglutaryl-
coenzyme A (HMG-CoA) reductase and acyl coenzyme A:cholesterol O-
acyltransferase (ACAT) in rats (Lee et al. 1999a, 1999b). Furthermore, a decrease in
plasma low-density lipoprotein (LDL) levels and hepatic cholesterol levels in rabbits
fed a high-cholesterol diet has been observed (Kurowska et al. 2000a). An increase of
high-density lipoprotein (HDL) levels in hypercholesterolemic human subjects after
consumption of orange juice was also reported (Kurowska et al. 2000b).
Naringenin has mainly been studied for its possible role in grapefruit juice – drug
interactions (Fuhr 1998, Bailey et al. 2000). The considerable increase in plasma
concentrations of many drugs metabolised by intestinal cytochrome P450IIIA (CYP
3A4) when administered concominantly with grapefruit juice is well documented and
is of clinical relevance (Dresser et al. 2000, Lilja et al. 2000). Naringenin is an
inhibitor of the enzyme (Ghosal 1996) and could be one of the compounds causing the
interaction. Other biological activities attributed to naringenin include antioxidative
(van Acker et al. 2000, Jeon et al. 2002) and anti-inflammatory (Manthey et al. 2001)
actions. Different types of effects for naringenin on sex-hormone metabolism have
also been suggested (Ruh et al. 1995, Rosenberg et al. 1998, Déchaud et al. 1999,
Yoon et al. 2001). The compound has, for instance, been shown to bind to estrogen
receptors (Kuiper et al. 1998).
In vitro studies have usually been performed with flavonoid aglycones or glycosides.
Flavonoid metabolites have rarely been used, mainly because data about their identity
is very scarce and chemical standards for only a few potential metabolites are
commercially available. Recently, a few reports on the biological activities of possible
quercetin metabolites have been published. Manach et al. (1998) tested the effect of

27
quercetin and isorhamnetin conjugates, obtained by enzymatic synthesis in vitro, on
copper-induced LDL oxidation. A mixture of four quercetin glucuronides (0.5 M
concentration) and quercetin-3-sulfate (0.5 M concentration) resulted in a similar
inhibition of conjugated diene appearance as quercetin aglycone. The inhibitory effect
was weaker for the individual metabolites than for the aglycone. Moon et al. (2001)
also studied the antioxidant effect of quercetin glucuronides; metabolites were
identified from rat plasma obtained 30 min after administering quercetin aglycone
(250 mg/kg) intragastrically. The metabolites in question, i.e. quercetin-3-glucuronide
and quercetin-4’-glucuronide, were then synthesized enzymatically for in vitro testing.
Quercetin-3-glucuronide was found to inhibit LDL oxidation and to possess substantial
1,1-diphenyl-2-picrylhydrazyl radical-scavenging activity, but the effect was less
pronounced than for the aglycone. Quercetin-4’-glucuronide was ineffective. Day et al.
(2000a) produced quercetin glucuronides by incubating quercetin with human liver
cell-free extracts. The compounds were identified by studying their absorbance spectra
and their response to the addition of shift reagents. After this, their ability to inhibit
xanthine-oxidase and lipoxygenase was assessed. Quercetin glucuronized at the 4’ or
3’ positions was able to inhibit xanthine oxidase at low micromolar concentrations, but
80- to 500-fold higher concentrations were required by quercetin-3-sulfate and 3- or 7-
glucuronide. Quercetin-4’-glucuronide was as effective as quercetin aglycone.
Quercetin aglycone, quercetin-7-glucuronide, quercetin-4’-glucuronide and quercetin-
3’-glucuronide all inhibited soy bean lipoxygenase, but quercetin-3-glucuronide was
ineffective.
On the whole, with the available scientific evidence, it is difficult to form an opinion
on the significance of flavonoids on human health. Most studies have been performed
in vitro, and flavonoid aglycones or flavonoid glycosides have been investigated.
Many animal studies have also been performed, but results from human studies are
very limited. Knowledge about flavonoid metabolism is scarce and until more
information on the identity of flavonoid metabolites is gained, evaluating whether
results from in vitro studies can be extrapolated to humans, is difficult. This is also the
28
case for animal studies because metabolism may be species-dependent. Furthermore,
the concentrations or amounts used in experimental studies have been high compared
with the amounts possibly present in human tissues or the diet. Therefore, in the
future, it is important that human studies using intakes within the range of typical
dietary intakes be performed. However, because the sensitivity of methods capable of
detecting changes in physiological or biochemical responses is limited, human studies
performed with high/pharmacological doses are also warranted. Nevertheless, the
possibility that the compounds may also have adverse effects, although it may seem
remote, should not be forgotten.
2.3.2. Analysis from human plasma and urine
The advent of chromatography revolutionized the analysis of natural compounds. In
the 1950s and 1960s, many paper chromatographic methods were developed for the
analysis of flavonoids from plants (Robards and Antolovich 1997). Today, the
extraction of flavonoids from plant material typically involves acid hydrolysis,
followed by high-performance liquid chromatography (HPLC) (Häkkinen et al. 1998,
Mattila et al. 2000). Analysis of flavonoids from human plasma or tissues is much
more difficult because the compounds are usually bound to proteins and are present in
much lower concentrations. When concentrations are very low, extraction methods
causing degradation of the flavonoid molecule and yielding low recoveries are
unacceptable. Moreover, binding to metals and silica poses a problem when analysing
low levels of the compounds with chromatographic methods.
Several methods for the analysis of quercetin from human plasma and urine have been
developed. Many of them utilize UV detection, which is not sufficiently sensitive to
allow analysis of the compound in plasma when intakes lie within the normal dietary
range. The method of Liu et al. (1995), for instance, has a detection limit of 100 µg/l, a
concentration found in a minority of plasma samples of subjects consuming their
habitual diets. Moreover, several groups have used liquid-liquid extraction methods,

29
which do not release the compound from protein very effectively. The method of
Hollman et al. (1996) is based on acid hydrolysis and HPLC with post-column
derivatization. Quercetin is released from protein and conjugates by heating plasma
with a mixture of hydrochloric acid and methanol. Quercetin aglycone is then
separated by HPLC and detected by fluorescence after complexing the compound with
aluminum ions. The limit of detection is 2 µg/l.
No methods suitable for the analysis of hesperetin and naringenin in human plasma
after consumption of citrus have been published previously. A method for the analysis
of naringenin from plasma after addition of the compound to plasma was developed by
Ishii et al. (1996), but endogenous naringenin was not measured. For the analysis of
hesperetin or naringenin in urine, methods based on solid-phase or acetonitrile
extraction and ultraviolet or mass-spectrometric detection are available (Weintraub et
al. 1995, Ishii et al. 1997, Lee and Reidenberg 1998). Partly because of the high
detection limits, attempts to analyse flavanones in plasma with methods utilizing UV
detection have failed.

30
2.3.3. Bioavailability and pharmacokinetics
Data on the bioavailability and pharmacokinetics of flavonoids mainly concerns
quercetin, catechins and isoflavones. Both seem to vary greatly between different
flavonoid classes and different compounds. This is hardly surprising, considering the
differences in chemical properties such as polarity. In this section, studies on the
bioavailability and pharmacokinetics of quercetin (Table 2), hesperetin and naringenin
are reviewed.
Quercetin
Data regarding the bioavailablity and pharmacokinetics of quercetin mostly originate
from studies conducted by P. Hollman and co-workers. Previously, in part because
Gugler et al. (1975) failed to detect quercetin in plasma and urine of subjects receiving
4 g of quercetin orally, quercetin was thought not to be absorbed. Hollman et al. (1995,
1996, 1997, 1999, 2001), however, showed that the compound is bioavailable from
various quercetin-containing foods, and supplements containing quercetin glycosides.
In their studies, bioavailability was examined after either single ingestion of relatively
high amounts of the foods or compounds, or ingestion over a few days. The
pharmacokinetics of quercetin after consumption of onions, quercetin-3-rutinoside,
quercetin-4’-glucoside and quercetin-3-glucoside were also studied. The
pharmacokinetic parameters calculated are shown in Table 2. The pharmacokinetics of
quercetin after intravenous dosage have been investigated in two studies (Gugler et al.
1975, Ferry et al. 1996). In both of these studies, the analytical methods used had
rather high detection limits (100 µg/l) and only unconjugated quercetin was measured.
Therefore, the results will not be discussed here.
The urinary excretion of quercetin has been investigated in several studies (Table 2).
In these studies, the urinary recovery, as a percentage of the ingested dose, ranged
between 0.07% and 1.4%. Furthermore, it was lower after ingestion of quercetin-
rutinoside than after ingestion of onion, although some variation is present in results of

31
different studies. From the urinary excretion data, it cannot be concluded that
approximately 1% of quercetin is bioavailable. Biliary excretion cannot be ruled out
and has been shown to be a major route of quercetin elimination in rats (Ueno et al.
1983, Manach 1996). In rats fed a diet containing 0.25% quercetin, the concentrations
of quercetin and methylated metabolites were approximately threefold in bile
compared with urine. The high molecular weight of quercetin glucuronides and
sulfates and their extensive binding to protein (Spencer et al. 1988, Manach et al.
1995, Boulton et al. 1998) could favour their biliary excretion (Fleck and Bräunlich
1990).
Little is known about the bioavailability of quercetin from diets resembling those of
the general population. In one study performed in Glasgow, Scotland, plasma
quercetin values of 23 ± 4 µg/l were reported in 10 diabetic subjects following their
habitual diets (Noroozi et al. 2000).

32
Tab
le 2
. Bio
avai
labi
lity
and
phar
mac
okin
etic
s st
udie
s on
que
rcet
in (
Q).
STU
DY
DE
SIG
NSO
UR
CE
DO
SEa
FA
STIN
GU
RIN
AR
YP
LA
SMA
BIO
AV
AIL
A-
(mg/
d)P
LA
SMA
(µ
g/l)
RE
CO
VE
RY
(%
)P
HA
RM
AC
OK
INE
TIC
SB
ILIT
Y b
(%)
Ileo
stom
y su
bjec
ts (
n=9)
1,c
onio
n (1
50 g
)89
0.
31 ±
0.1
452
± 1
5R
ando
m c
ross
-ove
rQ
-3-r
utin
osid
e10
00.
07 ±
0.1
9 17
± 1
5Si
ngle
inge
stio
nQ
agl
ycon
e10
00.
12 ±
0.0
824
± 9
Hea
lthy
sub
ject
s (n
=9)
2,c
onio
n68
1.4
± 0.
5C
max
= 2
24 ±
44
µg/
lR
ando
m c
ross
-ove
r T
1/2
= 2
8 ±
92 h
Sing
le in
gest
ion
Tm
ax =
0.7
± 1
.1 h
AU
C(0
-36h
) = 2
330
± 84
9 µ
gh/l
appl
e sa
uce
980.
4 ±
0.2
Cm
ax =
92
± 19
µg/
lT
1/2
= 2
3 ±
32T
max
= 2
.5 ±
0.7
AU
C(0
-36h
) = 1
061
± 37
5 µ
gh/l
Q-3
-rut
inos
ide
100
0.3
± 0.
4C
max
= 9
0 ±
93 µ
g/l
T1/
2 =
not
cal
cula
ted
Tm
ax =
9.3
± 1
.8A
UC
(0-3
6h) =
983
± 9
78 µ
gh/l
Hea
lthy
sub
ject
s (n
=15
)3,c
1600
ml b
lack
tea
4922
± 5
1.1
± 0.
5R
ando
m c
ross
-ove
r12
9 g
frie
d on
ions
1322
± 7
1.0
± 0.
6(3
*3 d
ays)
129
g fr
ied
onio
ns13
22 ±
51.
1 ±
0.5
3 se
rvin
gs/d
Hea
lthy
sub
ject
s (n
=27
)4,d
Q-a
glyc
one
+10
0042
7 ±
89R
ando
miz
ed p
aral
lel
Q-3
-rut
inos
ide
100
28 d
ays
4 in
gest
ions
/d

33
Hea
lthy
sub
ject
s (n
=5)
575
0 m
l fru
it ju
icee
4.8
150.
3 –
0.5
Ran
dom
cro
ss-o
ver
1000
ml f
ruit
juic
e6.
432
0.3
– 0.
5(3
*1 w
eek)
1500
ml f
ruit
juic
e9.
69
0.3
– 0.
5Se
vera
l ing
estio
ns/d
Hea
lthy
sub
ject
s (n
=9)
6,d
Q-3
-rut
inos
ide
94
Cm
ax =
54
± 12
µg/
lR
ando
m c
ross
-ove
rT
1/2
= 2
8.1
± 6.
4 h
Sing
le in
gest
ion
Tm
ax =
6.0
h ±
1.2
hA
UC
(0-�� =
111
7 ±
211
µgh
/l
Q-4
’-gl
ucos
ide
94
C
max
= 1
057
± 18
1 µ
g/l
T1/
2 =
21.
6 ±
1.9
hT
max
= <
0.5
hA
UC
(0-�� =
567
8 ±
725
µgh
/l
Dia
beti
c su
bjec
ts (
n=10
)7,d
tea
(150
0 m
l) +
11
+87
± 2
70.
26R
ando
m c
ross
-ove
r on
ion
(400
g)
90(2
*2 w
eeks
)3
serv
ings
/dte
a (1
500
ml)
+
11+
48 ±
12
0.27
onio
n (4
00 g
)57
Hea
lthy
sub
ject
s (n
=9)
8,d
Q-3
-glu
cosi
de98
3.
0 ±
0.3
Cm
ax =
152
6 ±
315
µg/
lR
ando
m c
ross
-ove
rT
1/2
= 1
8.5
± 0.
8 h
Sing
le in
gest
ion
Tm
ax =
0.6
h ±
0.2
hA
UC
(0-3
6h) =
577
5 ±
876
µgh
/l
Q-4
’-gl
ucos
ide
100
2.6
± 0.
4C
max
= 1
345
± 21
2 µ
g/l
T1/
2 =
17.
7 ±
0.9
hT
max
= 0
.45
± 0.
08 h
AU
C(0
-36h
) = 5
276
± 73
0 µ
gh/l
a Dos
e gi
ven
as q
uerc
etin
equ
ival
ents
inge
sted
dur
ing
one
day
b Bio
avai
labi
lity
def
ined
as
inge
sted
am
ount
min
us a
mou
nt r
ecov
ered
in il
eost
omy
effl
uent
c Res
ults
giv
en a
s m
ean
± S
D, d R
esul
ts g
iven
as
mea
n ±
SE
M, e A
pple
juic
e an
d bl
ack
curr
ant j
uice
(1:
1)
1 Hol
lman
et a
l. 19
95, 2 H
ollm
an e
t al.
1997
, 3 DeV
ries
et a
l. 19
98, 4 C
onqu
er e
t al.
1998
, 5 You
ng e
t al.
1999
, 6 Hol
lman
et a
l. 19
99, 7 N
oroo
zi e
t al.
2000
,8 Olth
of e
t al.
2000

34
Hesperetin and naringenin
Previously, data on flavanone bioavailability and pharmacokinetics relied on animal
studies and a few human studies where their urinary excretion was investigated. No
information on plasma pharmacokinetics of flavanones was available because methods
allowing their analysis in plasma had not yet been developed.
In one interesting animal study (Honohan et al. 1976), low amounts (150-290 µg) of14C-labelled hesperetin were administered orally to rats. The results indicated that
biliary excretion is the main route of elimination (57% was recovered in bile).
Furthermore, a substantial portion was expired as carbon dioxide, enterohepatic
circulation seemed to occur and total absorption was over 90%. It should be noted,
however, that the amount of radioactivity measured was probably a sum of intact
hesperetin and degradation products formed in the gastrointestinal tract prior to
absorption. Therefore, the bioavailability of intact hesperetin was most likely less than
90 %.
In a human study, the urinary recovery of hesperetin was 3% in a subject ingesting 500
mg of naringin and 500 mg of hesperidin once, and 24% in four subjects ingesting
1250 ml of grapefruit juice and 1250 ml of orange juice daily for four weeks. For
naringenin, individual urinary recoveries of 5-59% (six subjects; Fuhr and Kummert
1995), 5% (one subject; Ameer et al. 1996), 14-15% (two subjects; Lee and
Reidenberg 1998) and 1-6% (six subjects; Ishii et al. 2000) have been reported after
single ingestion of between 214-700 mg of naringin as a supplement or in juice. The
half-life for naringenin conjugates in urine has been estimated as 2.6 h (Fuhr and
Kummert 1995).

35
2.3.4. Metabolism
Important sites of flavonoid metabolism are the gastrointestinal lumen, cells of the
intestinal wall, and the liver. The metabolism of flavonoids is a matter of interest
because metabolism often affects the biological activity of a compound and its ability
to enter cells. Data regarding flavonoid metabolism mainly concerns quercetin and the
catechins. The metabolism of flavanones is poorly known. One common characteristic
of the flavonoids is that they occur as glucuronide or sulfate conjugates in the
bloodstream.
Metabolism prior to absorption
The mechanisms of and the events preceding flavonoid absorption have been a matter
of much debate. Enzymes capable of cleaving flavonoid glycosides were previously
assumed not to be present in the small intestine, and uptake was thought to occur only
in the large intestine, where cleavage of flavonoid glycosides by enterobacterial
enzymes would precede absorption. In the 1990s, however, quercetin or quercetin
conjugates were shown to rapidly appear in plasma after consumption of foods
containing quercetin glycosides, indicating absorption from the small intestine. The
sodium-glucose cotransporter (SGLT1) was hypothesized to transport quercetin
glucosides across the enterocytes (Hollman et al. 1999). Later, transport of quercetin-
4’-glucoside was actually demonstrated in a cell model of human intestinal absorption
(Caco-2 cell line), but the compound was effluxed from the cells by the secretory
protein MRP2, and transcellular absorption did not occur (Walgren et al. 2000). In
fact, despite numerous attempts, quercetin glycosides have not yet been found in the
circulation. Exceptions are two studies using HPLC retention times and/or UV spectra
for identification (Paganga and Rice-Evans 1997, Aziz 1998). These methods of
identification are, however, rather unreliable because the retention times of flavonoid
glucuronides and glycosides are very similar and their UV spectra not very specific
(Manach et al. 1998). Since the presence of enzymes capable of cleaving flavonoid
glycosides in the small intestine has now been demonstrated, it appears likely that the

36
flavonoid glycosides are cleaved, either in the lumen or in the cells of the gut, prior to
absorption.
Enzymes present in the small intestine capable of cleaving flavonoid glycosides are
lactase-phloridzin hydrolase (Day et al. 2000b) and another, less well-characterized β-
glycosidase with a broad substrate specificity (Day et al. 1998). In vitro, the former
enzyme has been shown to cleave quercetin-4’-glucoside, quercetin-3-glucoside,
quercetin-3,4’-glucoside, 3’-methylquercetin-3-glucoside, genistein-7-glucoside and
daidzein-7-glucoside. Quercetin-3-rhamnoglucoside (rutin) and naringenin-7-
rhamnoglucoside (naringin) were not substrates for the enzyme. Cell-free extracts of
human small intestine and liver, containing the latter enzyme, hydrolysed several
flavonoid glucosides with the sugar moiety attached to the 4’-OH or 7-OH moieties.
Compounds such as quercetin-3,4’-glucoside, quercetin-3-glucoside, quercetin-3-
rhamnoglucoside (rutin) and naringenin-7-rhamnoglucoside (naringin) were not
hydrolysed by the enzyme.
Which enzymes in the large intestine are responsible for the hydrolysis of flavonoid
glycosides remains to be elucidated. Enzymes (β-glucosidase, α-rhamnosidase)
produced by gastrointestinal bacteria, such as Bacteroides JY-6 (Jang and Kim 1996),
Streptococcus faecium VGH-1 and Streptococcus sp. strain FRP-17 (MacDonald et al.
1984), have been shown to hydrolyse some flavonoid glycosides, but other unknown
enzymes/bacteria could also be important. Cleavage of the flavonoid ring also occurs
in the large intestine, yielding ring fission products such as phenylacetic acids and
phenylpropionic acids (Nakagawa 1965, Baba 1981).
37
Conjugation and methylation in the intestinal wall and the liver?
Incubation of human plasma with a mixture of β-glucuronidase/sulfatase releases
quercetin aglycone, which shows indirectly that quercetin is present in plasma as
glucuronides, sulfates, or both (Manach 1998). Perfusion studies performed with rat
intestines indicate that at least a part of the formation of quercetin glucuronides and
sulfates occurs in the intestinal wall (Crespy et al. 1999, Spencer et al. 1999).
High concentrations of methylated quercetin, such as 3’-methylquercetin
(isorhamnetin) and 4’-methylquercetin (tamarixetin), have been measured in plasma,
urine and bile of rats kept on a high-quercetin diet (Manach et al. 1996), and in a
human hepatoma cell line (HepG2) (Boulton et al. 1999). In humans, they occur in
plasma at very low concentrations, if any (Manach et al. 1998, Erlund et al.,
unpublished). In rats, they appear to be formed mainly in the liver, not the intestinal
wall (Crespy et al. 1999). Whether the formation of methylated quercetin metabolites
is species-dependent or whether a concentration threshold exists, is not known. In the
studies where they have been found, rather high amounts of quercetin, typically 0.25%
of the diet, have been given to laboratory animals.
2.3.5. Quercetin as a biomarker of intake
Few studies have attempted to assess the use of plasma or urine quercetin levels as
biomarkers of intake. Noroozi et al. (2000) studied the effect of two high-flavonol
diets on plasma quercetin concentrations in 10 diabetic subjects receiving daily either a
fried onion dish containing 90 mg of quercetin (prepared from 400 g of white onions)
or plain fried onions containing 57 mg of quercetin (also prepared from 400 g of white
onions). After the two-week study period, the mean (±SD) fasting plasma
concentration in subjects receiving 90 mg of quercetin was 87 ± 27 µg/l (n=5), and in
those receiving 57 mg of quercetin 48 ± 12 µg/l (n=5). The mean baseline value was
23 ± 4 µg/L whereas during a two-week low-flavonoid diet, when no foods known or

38
suspected to contain flavonoids were consumed, the concentration was 6 ± 3 µg/l.
These findings indicate that plasma quercetin concentrations increase with increasing
intake.
de Vries et al. (1998) studied the use of quercetin as a biomarker of intake in a setting
where 15 subjects consumed 1.6 l of concentrated tea or 129 g of fried onions per day
for three days. The onion treatment was given twice. Quercetin was bioavailable from
both sources. Furthermore, the results indicated that the reproducibility of plasma
quercetin concentrations are such that they are suitable for biomarker use in
epidemiological studies.
Young et al. (1999) studied the use of urine quercetin as a biomarker of intake in five
subjects consuming 1:1 black currant/apple juice for one week. There were three one-
week intervention periods (separated by two weeks) and three doses of fruit juice (750,
1000 and 1500 ml), corresponding to daily intakes of 4.8, 6.4 and 9.6 mg of quercetin.
Between 0.3% and 0.5% of the ingested amount of quercetin was recovered in the
urine. A significant increase in urinary quercetin was found with dose and time, but the
fraction of quercetin excreted, of the ingested dose, appeared to be constant.
In light of the results on quercetin bioavailability, pharmacokinetics and excretion, it
would seem reasonable to recommend that plasma quercetin be used as a biomarker of
intake rather than urine concentrations. Sometimes, the errors caused by fluctuating
plasma levels can be overcome by using 24-h urinary recovery results instead of
plasma concentrations as biomarkers of intake. However, because the urinary recovery
of quercetin is very low, and data from animal studies indicate substantial biliary
excretion, more data on other routes of quercetin excretion and the factors regulating
them are needed before urinary recovery is used as a biomarker of quercetin intake.
Moreover, 24-h urine has seldom been, for practical reasons, collected in population
studies, making it a less attractive tissue for development of intake measures.

39
2.3.6. Association between flavonoid intake and risk of chronic diseases
The association between flavonoid intake and the risk of cardiovascular disease and
cancer has been investigated in several epidemiological studies. In most studies, the
term flavonoid refers to flavonoles and flavones, with quercetin being quantitatively
the most important flavonoid.
Most, but not all, prospective cohort studies have indicated some degree of inverse
association (from borderline to modest) between flavonoid intake and coronary heart
disease. An inverse association was found in the Zutphen Elderly Study (Hertog et al.
1993b), the Finnish Mobile Clinic Study (Knekt et al. 1996, 2002), the Iowa Women’s
Health Study (Yochum et al. 1999) and the Alpha-Tocopherol, Beta-Carotene Cancer
Prevention (ATBC) Study (Hirvonen et al. 2001b). No association was found between
flavonoid intake and risk of coronary heart disease in subjects free of disease at
baseline in the Health Professionals Follow-up Study (Rimm et al. 1996).
Interestingly, in the Caerphilly Study (Hertog et al. 1997), flavonol intake in 1900 men
was directly associated with the risk of ischaemic heart disease and all-cause mortality.
The result may be explained by tea being a very important source of flavonoids in
Scotland; its consumption was associated with lower social class, smoking and higher
fat intake (Hertog et al. 1997). In the above-mentioned ATBC Study, no association
was found between flavonoid intake and risk of stroke (Hirvonen et al. 2000)
The epidemiological evidence regarding the cancer protecting effects of flavonoids is
conflicting. Some case-control studies have indicated an inverse association between
intake of flavonoids and risk of lung cancer (de Stefani et al. 1999a, Le Marchand et
al. 2000), upper aerodigestive tract cancer (de Stefani et al. 1999b) and gastric cancer
(Garcia-Closas et al. 1999), while no association was found in other studies for lung
cancer (Garcia-Closas et al. 1998) or bladder cancer (Garcia et al. 1999). In two cohort
studies, no association between intake of flavonoids and cancer risk was present

40
(Hertog et al. 1994, Hertog et al. 1995), and in two other cohort studies, an inverse
association was shown for lung cancer (Knekt et al. 1997, Hirvonen et al. 2001c).
On the whole, the epidemiological evidence concerning flavonoids and chronic
diseases is very difficult to interpret. One reason is that confounding factors (a
common problem of epidemiological studies), probably affect the outcome of the
studies. In many countries, drinking tea and consuming high quantities of vegetables
and fruit are merely indicators of a generally healthy lifestyle or a high level of
education. This may not be the case for onion, but this source of flavonoids is perhaps
the most problematic in epidemiological studies. Onion is qualitatively, and in many
countries, quantitatively, the most important source of quercetin (Hertog and Hollman
1996, Rimm 1996, Häkkinen et al. 1999, Arai et al. 2000). The accurate assessment of
an individual’s onion consumption is difficult with dietary survey methods. Onion is a
commonly used “hidden” ingredient of many home-made and processed foods; it is
added to meatballs, hamburger meet, tv-dinners, soups, salads, sausages, etc. Thus, it
is likely that intake estimates of onion contain a large margin of error. Assessment of
tea intake, by contrast, an important source of quercetin in some countries, is probably
fairly accurate. However, the bioavailability of quercetin from tea is poorer than from
onion. Considering the possible impact on the results of epidemiological studies, it is
rather surprising that these problems have not been discussed in the reports. With the
exception of Hirvonen et al. (2001c), little or no information about how onion intake
was estimated has usually been given.
In summary, the epidemiological evidence concerning the association between
flavonoid intake and the risk of chronic diseases is conflicting. Whether or not
flavonoids protect against chronic diseases may be difficult to show using traditional
epidemiological methods. An alternative, which may help to overcome some of the
problems associated with intake assessment, is to use tissue concentrations as
biomarkers of intake.

41
3. AIMS OF THE STUDY
The work presented in this thesis is part of a project with the following goals: to
develop analytical methods for the analysis of the most important dietary flavonoids
and other phenolic compounds, to study their bioavailability, pharmacokinetics and
metabolism, to evaluate their use as biomarkers of intake, and finally, to study whether
their serum concentrations are associated with the risk of chronic diseases, such as
cardiovascular disease, in population studies.
The specific aims of the thesis were:
1. To develop methods for the analysis of quercetin, hesperetin and naringenin from
plasma and/or urine (I, IV).
2. To investigate the pharmacokinetics and bioavailability of quercetin from quercetin
aglycone and rutin after single ingestion of the compounds as pure substances (II).
3. To determine plasma quercetin concentrations after long-term consumption of
berries and a habitual Finnish diet (III).
4. To investigate the pharmacokinetics and bioavailability of hesperetin and
naringenin after single ingestion of citrus juices (IV).
5. To evaluate plasma quercetin, hesperetin and naringenin as biomarkers of intake
(II, III, IV).

42
4. SUBJECTS AND STUDY DESIGNS
Study II
Sixteen apparently healthy young men and women with no diseases of the
gastrointestinal tract were recruited. Their baseline characteristics are shown in Table
3. The study was performed in a double-blind, diet-controlled, cross-over design. It
consisted of two 14-day study periods, two treatments (quercetin and rutin) and three
doses (8, 20 and 50 mg as quercetin equivalents) within both treatments. Each subject
received each treatment and dose once (6 combinations altogether). The subjects were
randomized into two groups with 4 females and 4 males in one group and 3 females
and 5 males in the other group. One group received the quercetin treatment first
(Period 1), followed by the rutin treatment (Period 2). The other group had the order of
the treatments reversed. The compounds were given in ascending dosages. The dosing
schedule is presented in Figure 3. The subjects consumed the capsule with 200 ml of
water. Two hours after ingesting the capsule, the subjects drank 200 ml of water, and 4
hours from ingestion they ate lunch. Blood samples were collected 15-20 min before,
and 15 and 30 min, and 1, 2, 4, 6, 8, 12, 24 and 32 h after each dose/treatment.
Table 3. Baseline characteristics of subjects (mean ± SD).
Study N (women/men) Age (years) Height (cm) Weight (kg) BMI (kg/m2)
II 16 (8/8) 22 ± 4 173 ± 7 65 ± 9 22 ± 2III 60 (0/60) 60 ± 0 176 ± 6 78 ± 7 25 ± 2IV 13 (7/6) 28 ± 5 175 ± 7 71 ± 15 23 ± 3
43
Altogether 12 subjects completed all doses of both treatments. Two subjects (one
female and one male) in both groups discontinued the study. Two of them
discontinued without finishing any treatment or dose, and two after receiving all doses
of one treatment and one dose of the other treatment. The reasons for discontinuing
were personal, and no side-effects attributed to the flavonoids were encountered.
During both study periods the subjects followed a low-quercetin diet. Because the
doses of quercetin used in the study were similar to those attainable from the diet, it
was crucial that the dietary intake of quercetin be kept as low as possible. Lunch and
dinner were provided at the study site, and additional meals were eaten elsewhere,
except on days of sample collection, when all foods were obtained at the study site.
The subjects were given a list of allowed and forbidden foods, and they kept a record
of all foods eaten outside the study site. The diet consisted mainly of unprocessed meat
and poultry, milk products, white wheat bread and a few vegetables. All vegetables,
fruit, beverages or other foods known or suspected to contain quercetin or quercetin
����������� ����������������������������������������
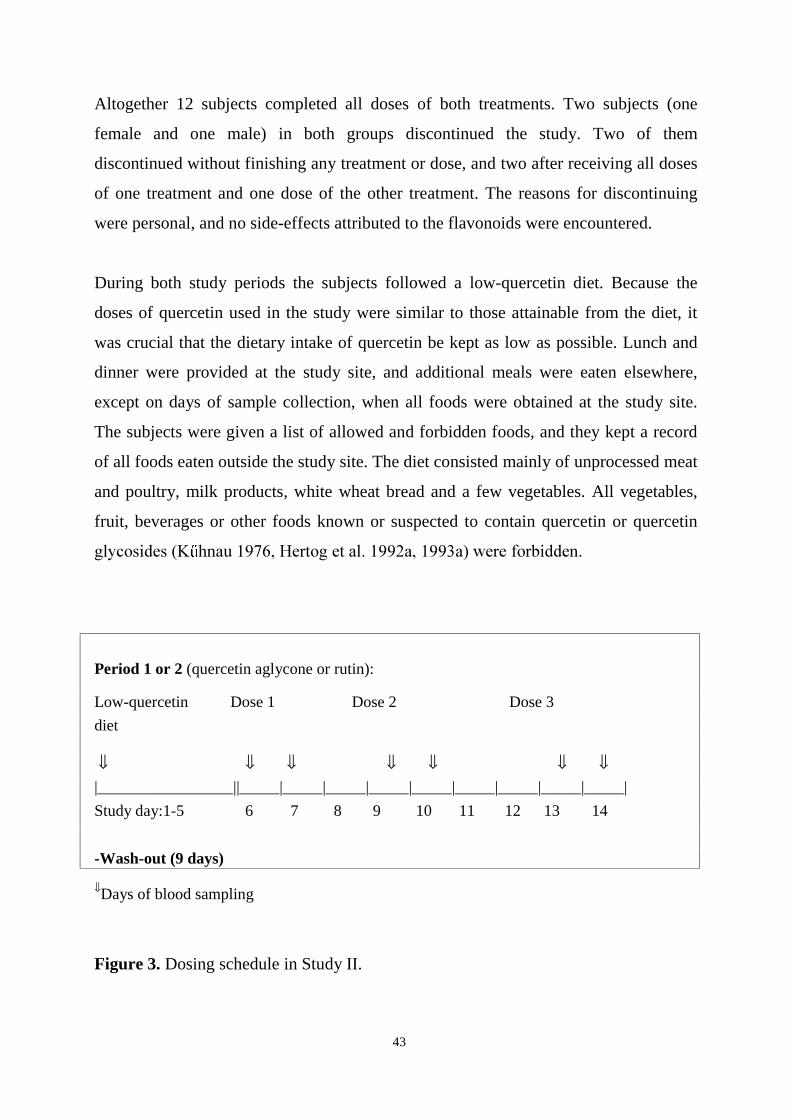
Period 1 or 2 (quercetin aglycone or rutin):
Low-quercetin Dose 1 Dose 2 Dose 3
diet
⇓ ⇓ ⇓ ⇓ ⇓ ⇓ ⇓|_________________||_____|_____|_____|_____|_____|_____|_____|_____|_____|
Study day:1-5 6 7 8 9 10 11 12 13 14
-Wash-out (9 days)
⇓Days of blood sampling
Figure 3. Dosing schedule in Study II.

44
Study III
The participants comprised 60 apparently healthy middle-aged men. They were
recruited among 523 men, who in 1994 participated in a health survey for men born in
1935 and living in the city of Turku, conducted by the Research and Development
Centre of the Social Insurance Institution in Turku. Exclusion criteria were use of
regular medication, use of dietary supplements during the past month, and overweight
(BMI>30 kg/m2).
The subjects were randomized into three groups (n=20 in each group) (Marniemi
2001). One group received berries, one group vitamin supplements (containing no
quercetin), and one group served as a placebo group. Serum samples from the berry
and the control group, but not from the supplement group, were analysed for quercetin.
The samples were also analysed for indices of antioxidant capacity, but those results
have been published elsewhere (Marniemi et al. 2000) and will not be discussed in this
thesis. The baseline characteristics of the subjects are shown in Table 3.
The subjects in the berry group were given 2 kg each of deep-frozen black currants,
lingonberries and bilberries. The berries were packed in 100-g portions in plastic bags.
The subjects were instructed to take one bag out of the freezer each day and eat one
portion of berries per day. They were also instructed to eat the different berries in turns
to ensure an even distribution over the 8-week intervention period. The berries were
eaten fresh and heating of the berries was not allowed. The control group received 500
mg daily of calcium gluconate as placebo. All subjects were instructed not to change
their usual dietary habits during the study. Dietary records (3-day) were kept at the
beginning of the study and at 8 weeks. Compliance was asked about and was
emphasized at each blood sampling. Blood samples were taken after an overnight fast
two weeks prior to the study, at baseline, and at weeks 2, 4 and 8.

45
Study IV
The study population consisted of young healthy volunteers, mainly summer
students/trainees at the National Public Health Institute. The baseline characteristics of
the subjects are presented in Table 3. Eight subjects (5 women and 3 men) were
allocated into the orange juice group and 5 subjects (2 women and 3 men) into the
grapefruit juice group. Exclusion criteria were use of medication, or a history of
diseases or symptoms of the gastrointestinal tract (e.g. lactose intolerance or coeliac
disease).
The subjects ingested 8 ml/kg of body weight of either orange juice or grapefruit juice
in the morning after an overnight fast. The ingested amounts ranged between 400 ml
and 760 ml. The subjects were allowed to eat for the first time 4 h after ingestion of
the test juice. Blood samples were collected at 1, 2, 3, 4, 6, 8, 10, 12, 14 and 24 h after
drinking the juice. Urine was collected in 4 fractions (0-4 h, 4-8 h, 8-14 h and 14-24 h)
over 24 h. Baseline urine and blood samples were obtained 10-20 min before juice
administration.
The subjects followed a citrus-free diet for one week prior to the study and on the
study day. They were given oral instructions on the diet and a list of prohibited foods,
which included all foods and beverages known or suspected to contain citrus
ingredients. The subjects were also asked to restrain from using dietary supplements
during this period. Compliance with the one-week citrus-free diet was confirmed by a
questionnaire, which the participants filled out during the study day. According to the
questionnaires, only a few minor deviations occurred during the first days of the citrus-
free diet.
46
5. METHODS
5.1. Analytical methods
Standards
Rutin, hesperetin and naringenin were obtained from Sigma Chemical Co. (St. Louis,
MA, USA). All other flavonoid standards were purchased from Extrasynthese (Genay,
France).
Equipment
Chromatographic analysis was performed with a system consisting of an HP 1090
liquid chromatograph, an HP 3396 II integrator with a 9122 C/D disc drive (Hewlett-
Packard, Palo Alto, CA, USA) and a Coulochem 5100A electrochemical detector with
a model 5011 analytical cell (ESA Inc., Chelmsford, MA, USA). The following HPLC
columns were tested: Inertsil pH (250*4 mm, 5 µm, Gl Sciences Inc.), Supelco LC-CN
(250*2.6 mm, 5 µm, Supelco Inc.), YMC carotenoid (150*4.6 mm, 3 µm, YMC),
Phenomenex LUNA-CN (250*4.6 mm, 5 µm, Phenomenex), POLY RPCO (150*4.6
mm, 4 µm, Interaction Chromatography Inc.), Hypersil-ODS (125*4 mm, 5 µm,
Hewlett Packard Inc.), Symmetry C18 (250*4.6 mm, 4 µm, Waters Assoc.),
LiChrosorb Hypersil ODS (250*4 mm, 5 µm, Merck) and Inertsil ODS-3 (250*4 mm,
5 µm, Gl Sciences Inc.). In the final method, the last-mentioned column was used.
Extraction
For extraction of quercetin from plasma, various extraction techniques were tested
including solid-phase extraction, liquid-liquid extraction and complexation with metals
or other derivatization agents. The following Bond Elut solid-phase extraction (SPE)
columns were tested: C18, CN, NH4, silica, diol, PBA (Varian, Harbour City, CA,
USA). The following SPE columns from International Solvent Technology were
47
tested: C18, CN, C8 and ENV (polystyrene divinyl benzene) (International Solvent
Technology, Hengoed, UK).
Mobile phases and detector potentials
For the separation of quercetin by HPLC, different combinations of the following
solvents and buffers were tested: methanol, acetonitrile, tetrahydrofurane, acetic acid,
orthophosphoric acid and monochloroacetic acid. Detector potentials between 50 and
500 mV were tested for quercetin, and between 200 and 700 mV for naringenin and
hesperetin.
Validation of methods
The analytical methods were validated for the following parameters: intra-assay
precision, inter-assay precision, recovery, linearity and stability. The quercetin peak
was identified by hydrodynamic voltammetry. The plasma samples used in validation
were obtained from persons who had either been instructed to consume quercetin-
containing foods (=high-quercetin plasma, 80 µg/l), or to exclude the compound from
their diets as far as possible (=low-quercetin plasma, 3.5 µg/l).
Intra-assay precision of the quercetin method was assessed by analysing high-
quercetin plasma (n=6) and spiked and non-spiked low-quercetin plasma (n=6 per
group). Inter-assay precision was determined by analysing high-quercetin plasma
(n=6) on 7 separate days. Recovery was determined by comparing the peak height of
hydrolysed (n=6) spiked low-quercetin plasma (n=6) to the peak height of standards
(n=6). The height of the quercetin peak in non-spiked low-quercetin plasma was
subtracted. Spiked samples were prepared by addition of 60 or 200 ng of quercetin to
1-ml aliquots of low-quercetin plasma. Linearity of the assay was evaluated by
plotting the peak height of standards in the range of 3.5-320 µg/l against the

48
corresponding concentration. The standards were made by spiking low-quercetin
plasma and they were treated like the other samples.
The intra-assay precisions of the flavanone methods were assessed by analysing low-
quercetin plasma spiked with 200 or 50 µg/l of naringenin or hesperetin (n=4 each).
Inter-assay precision was determined by analysing the same spiked samples on 4 days.
Linearity was checked in the range of 10-1000 µg/l for hesperetin and 20-1000 µg/l for
naringenin. Recovery was determined by the addition of 125 µg/l of flavanones to
low-quercetin plasma.
5.2. Pharmacokinetic methods
In Study II, the pharmacokinetic parameters were determined from total plasma
quercetin concentrations using a two-compartment model. Pharmacokinetic variables
were area under the concentration versus time curve (AUC0-24), calculated using the
trapezoidal rule, and maximum plasma quercetin concentration (Cmax). Other variables
were time to maximum plasma concentration (Tmax) and elimination half-life (T½). The
pharmacokinetic parameters were calculated using a validated commercial software
package SIPHAR/PC version 4.0 obtained from SIMED, Créteil, France.
In Study IV, the pharmacokinetic parameters were calculated by model-independent
methods. The peak concentration (Cmax) and the time to reach it (Tmax ) were taken
directly from the data. The elimination half-life T½ was calculated from the equation
T½ = ln 2 / k, using the terminal monoexponential log-linear slope of the time vs.
concentration curve of each subject for the estimation of k by the least-squares
method. AUC0-24 was calculated using the trapezoidal method. Renal clearance CLren
was obtained by dividing the total amount of flavanone excreted in the urine in 24 h
with AUC0-24. All data are expressed as mean ± SD.

49
5.3. Assessment of flavonoid intake
In Study III, the average daily intakes of quercetin, energy and nutrients were
calculated from 3-day dietary records with the Nutrica computer program. The
database of this program has been validated by Hakala et al. (1996). Quercetin data
from the Fineli database (kindly provided by M-L Ovaskainen from the National
Public Health Institute) were added to the Nutrica database before calculations were
made.
In Study IV, the intake of hesperetin and naringenin was assessed by multiplying the
amount of juice ingested with their concentrations in the citrus juices. The naringenin
and hesperetin concentrations of the juices were analysed by HPLC with
electrochemical detection (IV) .
5.4. Statistical methods
Study II
The main approach was the intention-to-treat analysis in which all randomized
subjects were included in the analyses. Baseline comparisons between sequences were
made using a t-test for two independent samples. Pharmacokinetic parameters (except
tmax) were examined using variance analysis for cross-over design when there were
repetitions within the period. Tmax was analysed using the Wilcoxon rank sum test.
Single-dose comparisons between treatments were carried out with linear contrasts or
pair-wise comparisons. For calculations of AUC(0-24), AUC(0-32) and Cmax, the data was
ln-transformed. Comparisons between gender of body weight-adjusted AUC(0-32)
values were performed by analysis of variance (ANOVA) for repeated measures; post-
hoc comparisons were performed using contrast analysis. Statistical analyses were
performed by using SAS System 6.12.

50
Study III
Statistical significance of the difference between serum quercetin concentrations of the
two dietary groups was assessed by analysis of covariance (ANCOVA) for repeated
measures; post-hoc comparisons were performed using contrast analysis. Whether the
intake of quercetin differed between the groups at 8 weeks was tested by ANCOVA;
post-hoc comparisons were performed by Tukey’s test. Differences in baseline values
of serum quercetin or quercetin intake between the two groups were assessed by the
Student’s t-test. The paired t-test was used to test the difference in quercetin intake
between baseline and 8 weeks within the two groups. Statistical analyses were
performed by using SPSS 10.0 for Windows.
Study IV
Differences between the means of selected pharmacokinetic indices (Tmax, T1/2, renal
clearance, relative urinary excretion and Cmax to ingested dose ratio) for naringenin
from grapefruit and naringenin from orange juice were tested by the Mann-Whitney U-
test. Spearman’s correlation was used to study the association between plasma
flavanone AUC(0-24) and relative urinary excretion values. Statistical analyses were
performed by using SYSTAT 10.0 for Windows.
A p-value of less than 0.05 was considered statistically significant in all studies.

51
6. RESULTS
6.1. Analysis of quercetin, hesperetin and naringenin (I, IV)
The methods developed for the analysis of quercetin, hesperetin and naringenin are
shown in Figure 4. The same method of hydrolysis was used for all three compounds.
The most efficient hydrolysis was obtained by using a crude extract of Helix pomatia.
Quercetin, in particular, is easily degraded and much work was done to stabilize it
during the different steps of analysis. Flavonoid degradation was minimized by using
ascorbic acid during hydrolysis and oxalic acid after extraction. For extraction of
quercetin, solid-phase extraction followed by additional purification by liquid-liquid
extraction was used. For extraction of flavanones, the liquid-liquid step was omitted
because part of the compounds were extracted into the wrong phase.
For separation of analytes, an Inertsil ODS-3 analytical HPLC column (GL Sciences,
Tokyo, Japan) was used. This column yielded the best separation of the flavonoids
from interfering compounds in the extracts. Also, with this column, the narrowest and
most symmetrical peaks were obtained. The superiority of this column compared with
the others is probably the result of efficient endcapping of residual silanol groups and
the use of inert low-metal silica.
Electrochemical detection was used for the analysis of flavonoids. Its sensitivity for
quercetin, in particular, is superior compared to that of ultraviolet detection. A detector
potential as low as 100 mV could be used for quercetin. Since few compounds in
plasma are oxidized at such a low potential, the problem with interfering compounds
disappeared, and very low levels of quercetin could be detected. Higher potentials are
required for the analysis of hesperetin and naringenin. Therefore, it is not surprising
that the problem with coeluting compounds could not be entirely overcome, and the
detection limits were higher for flavanones than for quercetin.

52
Figure 4. Flow-chart of the analytical methods used (I, IV).
1 ml of plasma or urine+ sodium acetate (pH 4.8)
+ ascorbic acid !������������"��������
37oC, 17 h
Bond-Elut C18
Dry in N2
+ dihloromethane+ acetic acid-oxalic acid
Shake wellCentrifuge
-----> Lower phase to HPLC
Dissolve inMeOH-acetic acid-oxalic acid
----> HPLC
HPLC conditions:Mobile phase: 59% MeOHin KH2PO4 buffer, pH 2.4
Oxidizing potentials:U1=0 mV, U2=100 mV
Quercetin
HPLC conditions:Mobile phase: 40% ACNin KH2PO4 buffer, pH 2.4
Oxidizing potentials:U1=500 mV, U2=700 mV
HesperetinNaringenin
Hesperetin Naringenin
Dry in N2
Condition: MeOH + KH2PO4
buffer pH 2.4Wash: KH2PO4 + H2O
Dry: N2
Elute: MeOH
HPLC conditions:Mobile phase: 59% MeOHin KH2PO4 buffer, pH 2.4
Oxidizing potentials:U1=350 mV, U2=550 mV
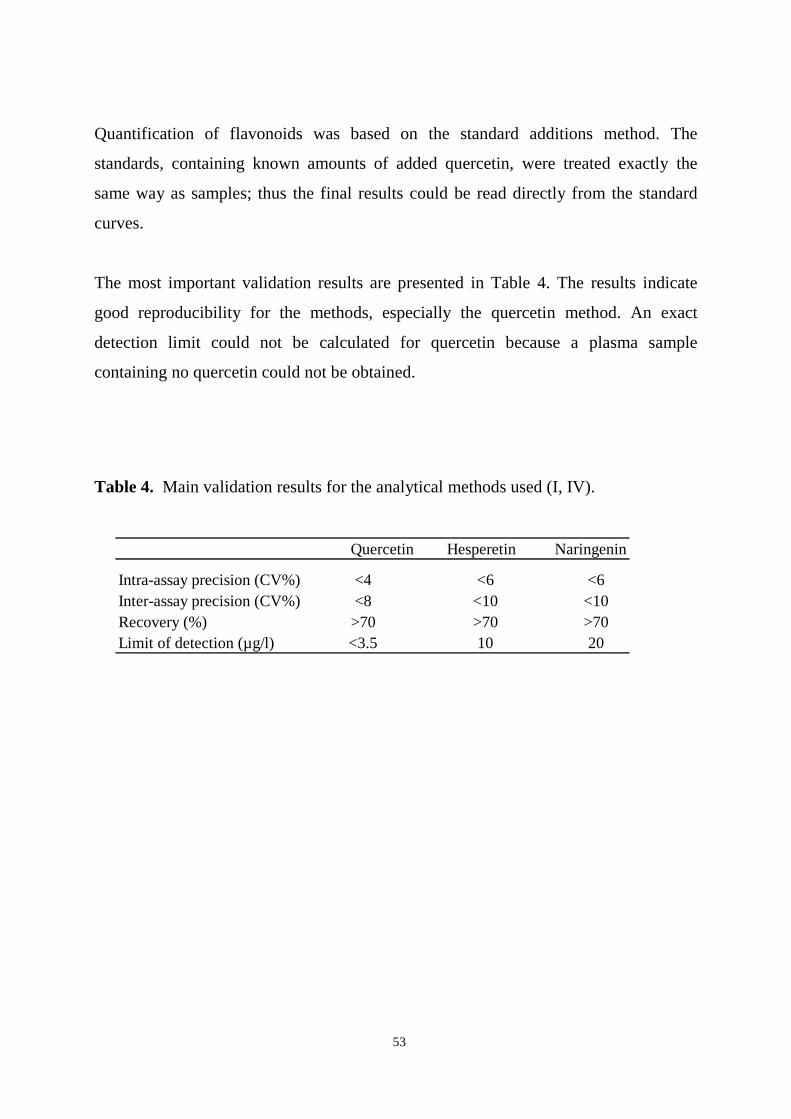
53
Quantification of flavonoids was based on the standard additions method. The
standards, containing known amounts of added quercetin, were treated exactly the
same way as samples; thus the final results could be read directly from the standard
curves.
The most important validation results are presented in Table 4. The results indicate
good reproducibility for the methods, especially the quercetin method. An exact
detection limit could not be calculated for quercetin because a plasma sample
containing no quercetin could not be obtained.
Table 4. Main validation results for the analytical methods used (I, IV).
Quercetin Hesperetin Naringenin
Intra-assay precision (CV%) <4 <6 <6Inter-assay precision (CV%) <8 <10 <10Recovery (%) >70 >70 >70Limit of detection (µg/l) <3.5 10 20
54
6.2. Pharmacokinetics and bioavailability of quercetin from quercetin aglycone
and rutin (II)
Quercetin was bioavailable from both quercetin aglycone and rutin, but the time taken
for plasma quercetin concentrations to increase differed for the two forms of quercetin.
After ingestion of quercetin in the aglycone form, the compound was absorbed rapidly;
quercetin could be measured in plasma 15 min after ingestion, and the Tmax values
ranged between 1.9 and 4.9 h. The concentration vs. time curves were, however,
biphasic and the second concentration peak increased (relative to the first one) with
increasing dose of quercetin aglycone. After ingestion of rutin, on the other hand,
quercetin concentrations did not increase in plasma until after 3 to 6 h, and the mean
Tmax values ranged between 6.5 and 7.5 h. The individual plasma concentration vs.
time curves for quercetin after ingestion of dose 3 of quercetin aglycone or rutin are
shown in Figures 5A and 5B.
The mean Cmax and AUC(0-32) values increased linearly for both quercetin and rutin
(Figures 6A-6D), and the values did not differ significantly for the corresponding
doses. The Cmax and AUC(0-32) values increased with increasing dose for practically all
individuals between doses 1 and 2 of both quercetin aglycone and rutin. Between
doses 2 and 3, the increase was less pronounced for all individuals after ingestion of
quercetin aglycone and for some individuals after ingestion of rutin.
Marked interindividual variation occurred in Cmax and AUC(0-32) values after ingestion
of rutin, especially at higher doses. Furthermore, quercetin from rutin was more
bioavailable in women than in men (Figure 7). The highest concentrations of quercetin
were found in women using oral contraceptives (4 women receiving dose 1, and 3
women receiving doses 2 and 3). Gender or use of oral contraceptives did not affect
Tmax and T1/2 after either treatment.
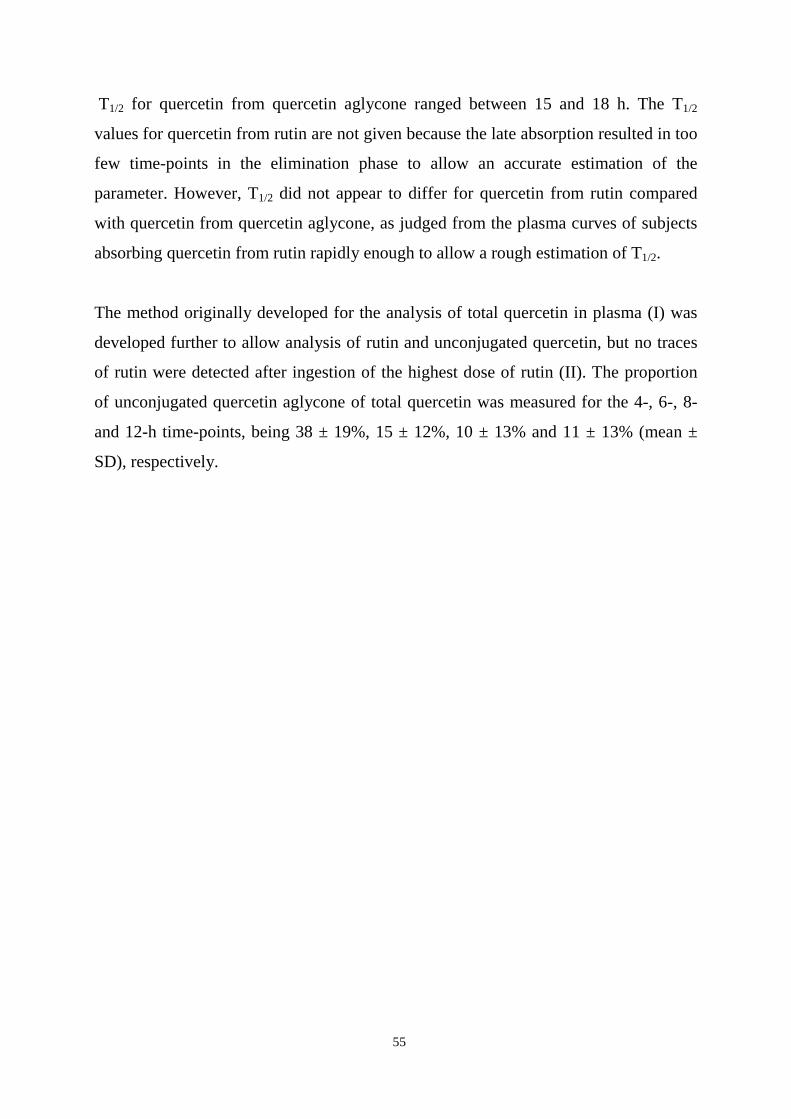
55
T1/2 for quercetin from quercetin aglycone ranged between 15 and 18 h. The T1/2
values for quercetin from rutin are not given because the late absorption resulted in too
few time-points in the elimination phase to allow an accurate estimation of the
parameter. However, T1/2 did not appear to differ for quercetin from rutin compared
with quercetin from quercetin aglycone, as judged from the plasma curves of subjects
absorbing quercetin from rutin rapidly enough to allow a rough estimation of T1/2.
The method originally developed for the analysis of total quercetin in plasma (I) was
developed further to allow analysis of rutin and unconjugated quercetin, but no traces
of rutin were detected after ingestion of the highest dose of rutin (II). The proportion
of unconjugated quercetin aglycone of total quercetin was measured for the 4-, 6-, 8-
and 12-h time-points, being 38 ± 19%, 15 ± 12%, 10 ± 13% and 11 ± 13% (mean ±
SD), respectively.

56
Figure 5. Individual plasma quercetin concentration vs. time curves after ingestion ofdose 3 of quercetin aglycone (A) or rutin (B). Straight lines represent men and brokenlines women.
1 32 4
24 532 6
B
0
50
100
150
200
250
0 2 4 6 8 10 12 14 16 18 20 22 24 26 28 30 32
Time ( h)
Pla
sma
quer
ceti
n (µ
g/l)
A
0
50
100
150
200
250
0 2 4 6 8 10 12 14 16 18 20 22 24 26 28 30 32
Time ( h )
Pla
sma
quer
ceti
n (µ
g/l)
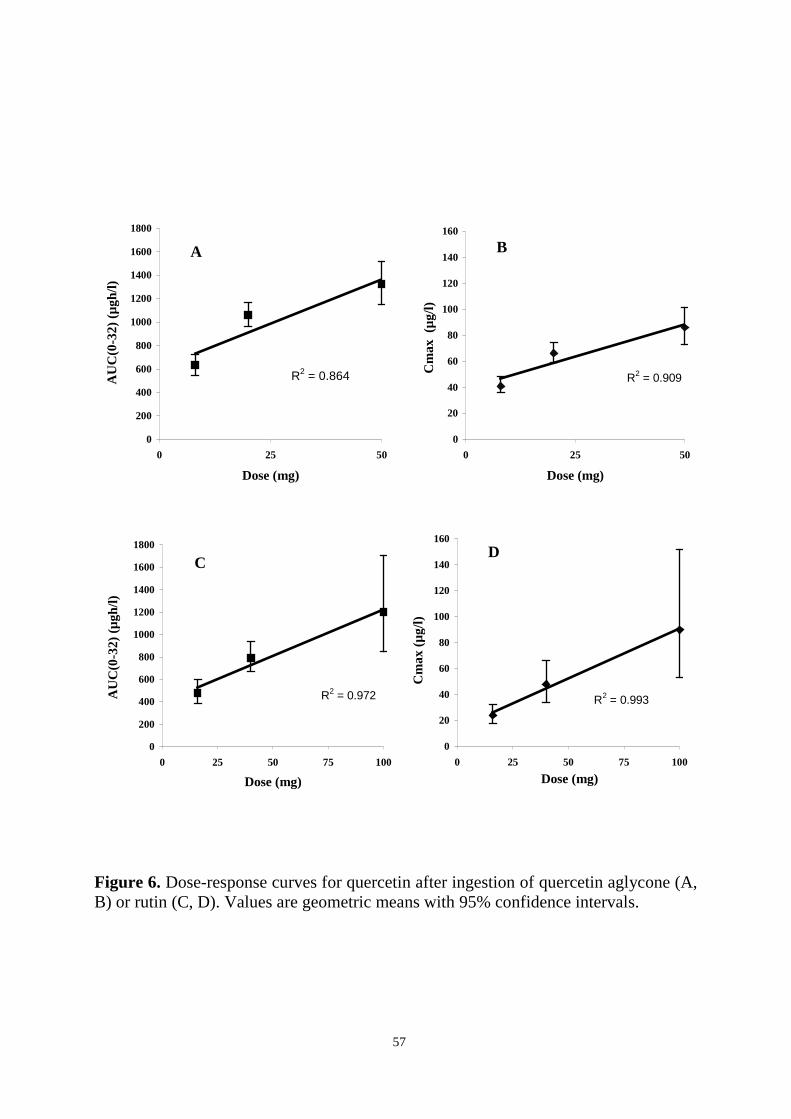
57
Figure 6. Dose-response curves for quercetin after ingestion of quercetin aglycone (A,B) or rutin (C, D). Values are geometric means with 95% confidence intervals.
C
R2 = 0.972
0
200
400
600
800
1000
1200
1400
1600
1800
0 25 50 75 100
Dose (mg)
AU
C(0
-32)
(µg
h/l)
B
R2 = 0.909
0
20
40
60
80
100
120
140
160
0 25 50
Dose (mg)
Cm
ax (
µg/l)
A
R2 = 0.864
0
200
400
600
800
1000
1200
1400
1600
1800
0 25 50
Dose (mg)
AU
C(0
-32)
(µg
h/l)
D
R2 = 0.993
0
20
40
60
80
100
120
140
160
0 25 50 75 100
Dose (mg)
Cm
ax (
µg/l)
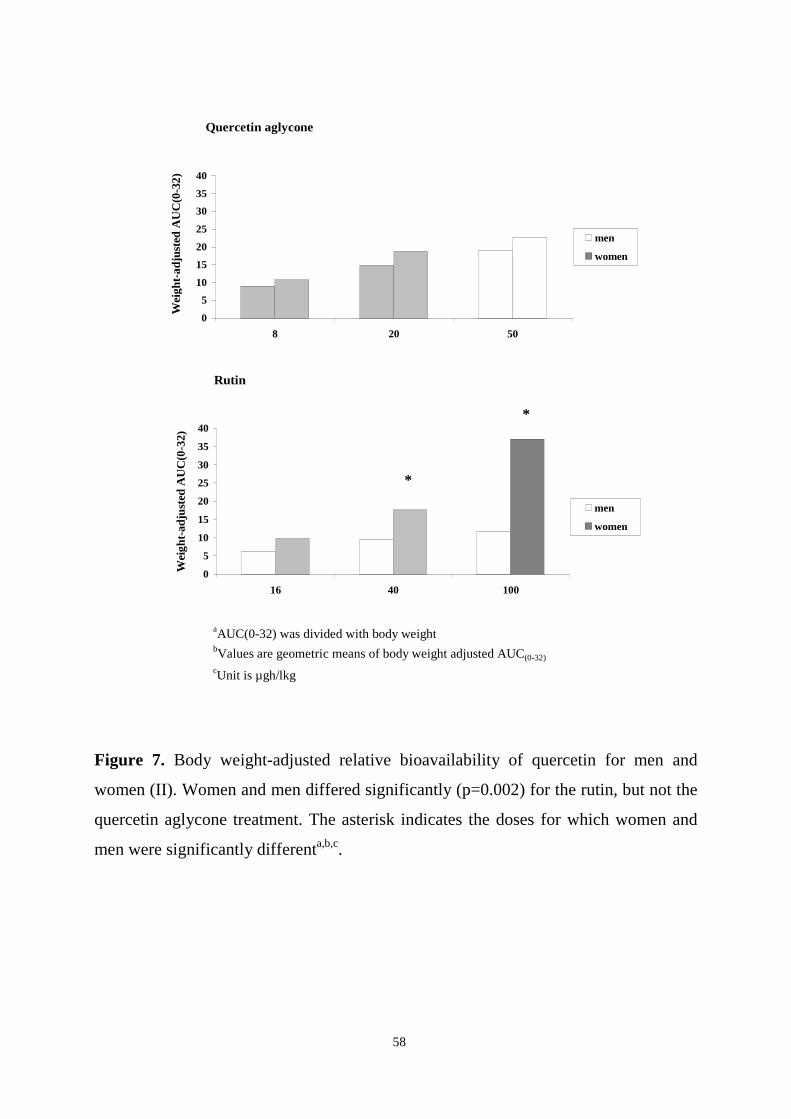
58
Figure 7. Body weight-adjusted relative bioavailability of quercetin for men and
women (II). Women and men differed significantly (p=0.002) for the rutin, but not the
quercetin aglycone treatment. The asterisk indicates the doses for which women and
men were significantly differenta,b,c.
aAUC(0-32) was divided with body weightbValues are geometric means of body weight adjusted AUC(0-32)
cUnit is µgh/lkg
Rutin
0
5
10
15
20
25
30
35
40
16 40 100
Wei
ght-
adju
sted
AU
C(0
-32)
men
women
*
*
Quercetin aglycone
0
5
10
15
20
25
30
35
40
8 20 50
Wei
ght-
adju
sted
AU
C(0
-32)
men
women

59
6.3. Pharmacokinetics and bioavailabilty of hesperetin and naringenin from
citrus juices (IV)
The plasma pharmacokinetics of hesperetin and naringenin from orange juice and
grapefruit juice appeared to be similar (Table 5). For both compounds, relatively high
concentrations (up to 4 mg/l) were measured in plasma after ingestion of 400-760 ml
of the juices (Figures 8A-8C). There was, however, marked interindividual variation in
the pharmacokinetic parameters describing bioavailability. Maximum plasma
concentrations were obtained in about 5 h after ingestion of the juices. The half-lives
of the compounds were rather short and they were rapidly cleared from plasma. No
signs of separate distribution and elimination phases could be seen in the plasma
concentration vs. time curves.
The time-course of urinary excretion was similar for naringenin and hesperetin from
orange juice and grapefruit juice. Most (73-87%) of the total amount excreted into the
urine was recovered within 8 h. However, the renal clearance of flavanones, at least
naringenin, appeared to be dose-dependent. For naringenin from orange juice, the renal
clearance was 0.4 l/h (ingested amount 23 mg), and when the compound was obtained
from grapefruit juice (ingested amount 199 mg), the value was 8.4 l/h. Furthermore,
correlations between AUC(0-24) and urinary recovery values were found for hesperetin
from orange juice and naringenin from grapefruit juice, but not for naringenin from
orange juice.
The individual urinary recovery values for hesperetin from orange juice ranged
between 1% and 11%. The corresponding values for naringenin from orange juice
ranged between 0.2% and 3 %, and for naringenin from grapefruit juice between 4%
and 69%. These values are minimum estimates for bioavailability.

60
Table 5. Pharmacokinetics of naringenin and hesperetin after single ingestion of
orange juice or grapefruit juice (IV)1,2.
NARINGENIN HESPERETIN
Grapefruit juice Orange juice Orange juice
Ingested dose of flavanone (mg) 199 ± 42 23 ± 2 126 ± 26
AUC0-24 (µg h/l) 7534 ± 7151 719 ± 437 3099 ± 2464
Cmax (µg/l) 1628 ± 1459 175 ± 110 655 ± 479
Tmax (h) 4.8 ± 1.12 5.5 ± 2.92 5.4 ± 1.6
T1/2 (h) 2.2 ± 0.12 1.3 ± 0.62 2.2 ± 0.8
Renal clearance (l/h) 8.4 ± 1.5 2 0.4 ± 0.22 2.4 ± 0.5
Urinary recovery (%) 30.2 ± 25.52 1.1 ± 0.82 5.3 ± 3.1
1Values are means ± SD.2Values are significantly different for grapefruit juice and orange juice. Only selected variables werecompared statistically.
61
Figure 8. Individual plasma-concentration vs. time curves for hesperetin (A) and
naringenin (B) after ingestion of orange juice and for naringenin (C) after ingestion of
grapefruit juice.
B
0
50
100
150
200
250
300
350
Pla
sma
nari
ngen
inn
(µg/
l)P
lasm
a he
sper
etin
(µg/
l)A
0
200
400
600
800
1000
1200
1400
1600
1800
C
0
500
1000
1500
2000
2500
3000
3500
4000
4500
0 2 4 6 8 10 12 14 24
Time ( h )
Pla
sma
nari
ngen
in (µ
g/l)

62
6.4. Bioavailability of quercetin from berries and the diet (III)
Serum quercetin concentrations were significantly higher during the berry
consumption period in the subjects consuming 100 g/day of berries compared with the
subjects consuming their habitual diets (p=0.039). In the berry group, the mean serum
quercetin concentrations ranged from 21 to 25 µg/l between weeks 2 and 8. The values
were 32-51% higher than in the control group at corresponding time-points. Two
weeks prior to the study and at baseline, the mean concentrations of the two groups
were similar. At these two time-points, when the men still followed their habitual
diets, the mean quercetin concentration for all subjects was 16 ± 13 µg/l (mean ± SD).
The mean calculated intake of quercetin was significantly higher in the berry group at
the end of the 8-week intervention (12 ± 6 mg) compared with baseline (8 ± 5 mg)
(p=0.001). In the control group, the daily intake did not change (6 mg at baseline and
at 8 weeks). The intake of quercetin from the background diet (when intake from
berries was disregarded) did not change within groups during the study. In the berry
group, the mean estimated intake of quercetin from the berries was 6 mg/day.
The mean calculated intake of energy and nutrients for all subjects at baseline were as
follows: energy 2125 kcal, fat 37 E%, protein 15.5 E%, carbohydrate 40 E%, saturated
fat 15.5 E%, fibre 21 g, cholesterol 329 mg, -carotene 1.6 mg, vitamin C 52 mg and
vitamin E 10.6 mg. Intakes of energy and nutrients from the background diet did not
change significantly during the intervention.

63
7. DISCUSSION
7.1. Analytical methods
The main goals of the flavonoid project at the Biomarker Laboratory were to analyse
the most important flavonoids, phenolic acids and lignans in plasma samples from
population studies, and to examine the association between plasma concentrations of
the compounds and risk of chronic diseases. Because the amount of sample available
from such studies is usually limited and analysis of large amounts of samples can be
expensive, it was of interest to measure as many compounds as possible from the same
sample. The main requirements of an analytical method used for the above-mentioned
purpose are good reproducibility over a long period of time and low detection limits.
However, the analysis of many of these compounds is difficult even individually and
at much higher concentrations. The approach used in this work was to first develop a
method for the analysis of an analytically demanding compound of interest, and then
test whether less demanding compounds could be analysed with the same method.
Quercetin was considered to be one of the most promising compounds with regard to
biological activity, dietary intake and epidemiological evidence. This compound is,
however, very difficult to analyse from human plasma because it forms strong bonds
with plasma albumin and is chemically unstable under various conditions. Therefore, a
method was first developed to allow analysis of quercetin from plasma and was later
applied to the analysis of other phenolic compounds such as flavanones, isoflavones,
lignans and phenolic acids. In this thesis, methods for the analysis of quercetin,
hesperetin and naringenin are presented.
The method presented in Study I was suitable for the analysis of physiological levels
of quercetin in plasma, i.e. the levels found in subjects consuming typical Finnish diets
or diets low in quercetin. Most importantly, the method had a good long-term
reproducibility even at low concentrations, as shown by the low coefficient of
variation of quality control samples in Study II. No information about the long-term

64
reproducibility of previously published quercetin methods is available. In addition to
good reproducibility, the method was linear in the examined concentration range and
had an acceptable recovery. The degradation of quercetin was minimized by the use of
ascorbic acid during hydrolysis and oxalic acid after extraction. Quercetin aglycone is
a compound which can be stable for a long time under the right conditions, but in the
conditions typically used during the extraction of many nutrients or drugs, the
compound is degraded rapidly (Nordström and Majani 1965). The advantage of the
solid-phase extraction method used in this work is that it is less harsh than extraction
with hydrochloric acid/methanol, which was used by Hollman et al. (1996). Another
advantage is that the risk of cleaving quercetin conjugates is smaller than when using
hydrochloric acid/methanol extraction. Therefore, this extraction method can be used
in the search for quercetin or flavonoid conjugates. The quercetin method was also
applicable for analysing the compound in urine; the method was, however, not
validated for that purpose.
The analytical method presented in Study IV was the first published method suitable
for the analysis of hesperetin and naringenin in human plasma. It was also suited for
the analysis of the flavanones in urine. The solid-phase extraction method was the
same as that originally developed for the extraction of quercetin from plasma. The
second extraction step used in the quercetin method had to be omitted because some
hesperetin and naringenin was extracted into the wrong phase. Further clean-up
attempts of the solid-phase extract were unsuccessful, and therefore, the extract was,
after concentration, injected directly into the HPLC system. Because hesperetin and
naringenin are oxidized at higher potentials than quercetin, interfering compounds
present a bigger problem in their HPLC analysis. The sample could not be purified of
all interfering compounds, and thus, the detection limits for the flavanones were higher
than for quercetin. The recovery, precision and reproducibility of the flavanone
methods were good. Hesperetin and naringenin are not as prone to degradation as
quercetin, and the compounds were stable under the same conditions as quercetin.

65
7.2. Pharmacokinetics of quercetin, hesperetin and naringenin
Absorption and elimination
Whether the flavonoids were obtained as aglycone or as glycosides affected the time it
took for them to appear in plasma but did not appear to affect the rate of elimination.
In the absorption phase, the shape of the plasma concentration vs. time curves for
quercetin from rutin, and hesperetin and naringenin from citrus juices, were rather
similar, whereas in the elimination phase, the curves for quercetin and the flavanones
were clearly different. The late time-point of absorption, with mean Tmax values
ranging between 4.8 and 7.5 h, indicates that from the above-mentioned sources the
compounds are absorbed from the distal parts of the small intestine or from the colon.
Orocecal transit times of 50 min (Lorena et al. 2000), 1.8 h (van Nieuwenhoven et al.
1999), 2.3 h (Boekema et al. 2000), 3.2 h (Kagaya et al. 1997) and 5 h (Bennik et al.
1999) have been reported, supporting this assumption. Quercetin from quercetin
aglycone, by contrast, was absorbed rapidly, probably from the duodenum. Absorption
of quercetin from the stomach may also be possible, as indicated by a recent rat study
(Crespy et al. 2002). The plasma quercetin curve after ingestion of quercetin aglycone
was biphasic and the second absorption peak increased with increasing dose. This
indicates that the compound was absorbed farther down the gastrointestinal tract as
well. Whether eating lunch after the 4-hour blood sampling increased absorption is
impossible to say. Eating is known to increase splanchnic blood flow. Furthermore,
eating stimulates emptying of the gall bladder and the bile could have enhanced
absorption of the fraction of quercetin which remained unabsorbed in the upper small
intestine. Alternatively, the second concentration peak, usually occurring at 6 h, could
be a result of enterohepatic circulation.
The results indicate that rutin and flavanones are cleaved in the distal parts of the
gastrointestinal tract prior to absorption. This is in line with the findings of Day et al.,
who reported that rutin and naringin are not hydrolysed by cell-free extracts of the
human small intestine (Day et al. 1998) or lactase from lamb small intestine (Day et al.

66
2000b). Quercetin-3-glucoside and naringenin-7-glucoside, on the other hand, were
cleaved by enzymes from the small intestine, and therefore, it appears likely that the
limiting step of hydrolysis in the small intestine is the α bond between the glucose and
the rhamnose molecules. Rutin (quercetin-3-rutinoside), narirutin (naringenin-7-
rutinoside) and naringin (naringenin-7-neohesperoside) all contain a glucose molecule,
which is bound to the flavonoid aglycone with a β-linkage, and a rhamnose molecule,
which is bound to the glucose moiety with an α bond. Bacterial enzymes capable of
hydrolysing both types of bonds are present in the colon, but enzymes cleaving the
bond have not been identified in the small intestine.
The urinary excretion of quercetin was not investigated in this work. According to
many studies, the urinary recovery of quercetin from quercetin glycosides is rather low
(0.07-1.4% of ingested dose) (Table 2). Animal studies indicate that a substantial
portion of ingested quercetin is excreted in bile (Ueno et al. 1983, Manach et al. 1996).
The urinary excretion of flavanones was studied in the citrus juice study (IV), and it
seemed to depend on the source and/or the obtained dose. Only 1% of naringenin from
orange juice (where present as narirutin) was recovered in urine, but when the
compound was obtained from grapefruit juice (where present as naringin) the urinary
recovery was 30%. The ingested doses were 23 mg from orange juice and 199 mg
from grapefruit juice. The values for hesperetin from orange juice were between the
values for naringenin from the two sources. The results were most likely caused by
dose-dependent renal clearance rather than differences in bioavailability. This
interpretation is supported by the fact that the Cmax-to-ingested dose ratios did not
differ for naringenin depending on the dose and source, and the fact that the half-life of
naringenin was shorter when its intake was high (as from grapefruit juice).
The pharmacokinetics of quercetin, hesperetin and naringenin were in Studies II and
IV investigated after single-dose administration. The kinetic behaviour of compounds
during long-term administration is usually predictable based on single-dose data.
67
Steady-state concentrations of a compound are generally reached after administration
of a compound daily for 4-5 times its half-life. The results of Study II indicate that
steady-state concentrations of quercetin should be reached within 3-4 days. The half-
life of flavanones, on the other hand, was only 1-2 hours, suggesting that no
substantial accumulation occurs during once daily consumption of citrus fruit or juices.
These assumptions should, however, be confirmed during long-term administration.
For some compounds following non-linear kinetics, the kinetic behaviour changes
during long-term administration or is disproportional to what is expected based on
single-dose studies (Ludden 1991). Furthermore, sometimes the development of more
sensitive analytical techniques has revealed new, longer elimination phases for
compounds, thus explaining the effect of a compound after its apparent disappearance
from plasma.
Few studies on the pharmacokinetics of flavonoids have been performed. The results
obtained in this study regarding the Tmax values of quercetin from rutin are similar to
those reported previously by Hollman et al. (1997, 1999). The plasma concentrations
in this study were somewhat lower, which is not surprising considering the fact that
the ingested doses were lower. The Cmax and AUC values after ingestion of 100 mg of
rutin (containing 50 mg of quercetin) were, however, almost equal to the values
reported by Hollman et al., although, in our study, the dose ingested was only half of
that used by Hollman et al. Recently, pharmacokinetic results similar to those
presented in Study II were reported by Graefe et al. (2001), who studied the
pharmacokinetics of a 100- to 200-mg dose of quercetin from onion, buckwheat tea,
quercetin-3-rutinoside and quercetin-4’glucoside.
Study II was the first report on plasma pharmacokinetics of quercetin after ingestion of
quercetin aglycone. Several authors have previously suggested that the aglycone form
is not absorbed. Study II and another recent report (Walle et al. 2001) show that this is
not the case. Walle et al. (2001) indicated absolute bioavailability of 36-53% for
quercetin aglycone. They also demonstrated that a substantial portion of quercetin is

68
excreted by the lungs as CO2. Until more information is published on this very
interesting study, conclusions should be made with caution, since radioactive quercetin
was used and the results have been based on recovery of radioactivity. Therefore, the
findings may reflect bioavailability and pharmacokinetics of degradation products,
which could have been formed, at least partly, prior to absorption.
Plasma hesperetin and naringenin concentrations in humans have not been reported
previously. Attempts to analyse them have been made, but the detection limits of the
analytical methods have been too high. Regarding urinary excretion, the results of
Study IV were similar to a previous report (Fuhr and Kummert 1995). The individual
relative urinary recovery values for the two flavanones from the two different juices
ranged between 0.2% and 69%. This suggests that bioavailability ranged between
these values. However, it is also possible that it was much higher. In rats, biliary
excretion of hesperetin appears to be a more important route of elimination than
urinary excretion (Honohan et al. 1976).
Interindividual variation in bioavailability
The most interesting findings of the pharmacokinetic studies were the marked
interindividual variations in plasma concentrations of flavonoids after ingestion of
rutin and citrus juices, and the bioavailability of quercetin from rutin being affected by
gender.
In general, variation in pharmacokinetics can be caused by physiological factors, such
as differences in body weight, body composition and gastric motility, or molecular
factors, including differences in activity or synthesis of different transporters, or
enzymes involved in biotransformation (Meibohm 2002). Variation has been reported
to occur for secretory transporter, such as P-glycoprotein (Lown et al. 1995, Kerb et al.
2001) and MRPs (van der Kolk et al. 2000), and biotransformation enzymes, such as
CYP3A4 (Hall et al. 1999, Dai et al. 2001), UDP-glucuronosyltransferases (Fisher et

69
al. 2000) and sulfotransferases (Her et al. 1996). All of these proteins have been
associated with flavonoids; quercetin interacts in vitro with P-glycoprotein (Shapiro
and Ling 1997), MRP1 (Leslie et al. 2001), MRP2 (Walgren et al. 2000), and is a
substrate for UGTs and sulfotransferases. Little is known about the factors that lie
behind the variation in activity or amount of these proteins (Thummel et al. 1997).
Genetic and environmental factors are probably differentially important for different
systems. Gender differences, due to hormonal influence, have been implied in some
cases (Back and Orme 1990, Harris et al. 1995, Kashuba and Nafziger 1998, Meibohm
et al. 2002). However, gender disparities in pharmacokinetics are usually small and are
rarely of clinical relevance. Still, gender differences have been reported for several
transporters and enzymes involved in biotransformation. For instance, men seem to
have higher P-glycoprotein and CYP1A2 activities. Furthermore, glucuronization and
sulfation by certain UGT and SULT isoforms have been reported to be higher in men.
In Study IV, but not Study II, the doses were corrected for weight. Differences in body
weight and possibly body composition may therefore explain some of the variation
seen for rutin. However, since the variation was so marked, it was more pronounced at
higher doses of rutin, and, in addition, less variation was seen for quercetin aglycone,
it is concluded that the variation was likely caused by molecular factors, which
depended on the site of absorption, rather than physiological factors. Furthermore,
variation in rutin data was affected by gender and the highest concentrations were
found for subjects using oral contraceptives. Due to the small number of subjects using
oral contraceptives, the latter finding may, however, be coincidental. Since the site of
absorption seems to have determined whether variation in plasma levels occurred,
gender-specific variation in microflora is hypothesised to be one factor causing
variation in bioavailability. Cleavage of flavonoids by bacterial enzymes is, as
mentioned earlier, a prerequisite of absorption.

70
Circulating forms of flavonoids – does it matter what they are and where absorption
occurs ?
In this work, mainly total plasma and urine flavonoids (=unconjugated flavonoid +
glucuronized/sulfated flavonoid) were analysed after enzymatic hydrolysis of
conjugates. Flavonoid conjugates could not be analysed separately because they are
unknown and standards are not commercially available. The number of possible
glucuronosyl and/or sulfate conjugates is high due to the large number of hydroxyl
groups on the aglycones. In Study II, unconjugated quercetin and rutin were analysed
in addition to total quercetin in samples taken 4-12 h after ingestion of the highest dose
of rutin. Contrary to previous reports, we could detect unconjugated quercetin in
plasma. The reasons for this discrepancy could be use of different analytical methods,
or that in the other studies, the aglycone was measured after the ingestion of quercetin
glycosides that are absorbed in different parts of the intestines than rutin. Another
noteworthy finding in Study II was that rutin was not detected in plasma in its original
glycosidic form after ingestion of rutin, which further confirms the view that the
compound is hydrolysed prior to absorption of the aglycone. This result contradicts a
previous report indicating that high amounts of rutin circulate in plasma (Paganga and
Rice-Evans 1997). In that study, retention time in HPLC and UV spectra were used for
identification. These are similar for quercetin glucuronides and glycosides, and they
could have been confused with each other (Manach et al. 1998).
The question about which form of quercetin circulates in plasma is not only of
academic interest. Which hydroxyl groups on the flavonoid molecules are conjugated
is of relevance because this probably affects the biological activities of the
compounds. Often metabolism reduces activity, but in some cases, metabolites are
even more potent than the parent compound (Glatt 2000, Osborne et al. 2000). The site
of absorption of flavonoids could be important because the degree or type of
biotransformation might vary in different parts of the gut. Therefore, in theory, it is
possible that different metabolites or different amounts of metabolites are formed
when a compound is absorbed from different parts of the gastrointestinal tract. One
71
phenomenon resulting in this situation is saturable first-pass metabolism, although, at
first thought, it would appear unlikely at the concentrations at which nutrients occur in
the diet. However, at least the sulfotransferase pathway appears to be readily saturated
(Rogers et al. 1987). Another interesting factor is that the activity and amount of many
biotransformation enzymes decrease from the duodenum to the colon (Peters et al.
1991). Furthermore, some enzymes are only expressed in certain tissues or parts of the
intestines. For instance, UGT 1A8, which has been shown to glucuronidate both
quercetin and naringenin (Cheng et al. 1999), is predominantly expressed in the colon
(Mojarrabi and MacKenzie 1998). Transcripts of the enzyme have also been detected
in the jejunum and the ileum, but not in the duodenum, stomach or liver (Cheng et al.
1998). On the other hand, UGT 1A9, which also glucuronidates flavonoids (Oliveira
and Watson 2000), is expressed in the liver, but not in the small intestine or colon.
How likely it is that different metabolites are formed depending on the flavonoid
glycoside ingested, or that individuals ingesting the same flavonoid glycoside have
different metabolite profiles, is difficult to speculate upon. However, the possibility
that health effects occur after ingestion of one type of bioavailable flavonoid glycoside
or the aglycone, but not after ingestion of another, should be kept in mind when
evaluating the results of studies on the health effects of flavonoids or when planning
clinical trials.
7.3. Bioavailability of quercetin from berries and the diet
Serum quercetin concentrations were significantly higher in subjects consuming
berries (III) than in those consuming their habitual diets (III) or a low-quercetin diet
(II). Therefore it is concluded that quercetin is bioavailable from berries. Compared
with the control group, the concentrations were 30-50% higher in the berry group
during the berry consumption period. The corresponding increase in intake was 62%.
The increase in serum quercetin was similar to or higher than what was previously
found in 12 men consuming 375 ml of black tea or 750 ml of red wine for four days,
but less than half of what was found when the subjects consumed 50 g of fried onions

72
(de Vries et al. 2001). However, the serum samples were taken after an overnight fast,
while de Vries et al. (2001) collected samples twice on the last day that quercetin-
containing foods were consumed. The results are therefore not directly comparable,
but they do suggest that more quercetin reaches the circulation after consuming of 100
g of these berries than does after consuming 750 ml of red wine or 375 ml of black tea.
Which berries contributed most to the increase in plasma quercetin levels in Study III
is not known, but according to pilot studies from our laboratory (unpublished),
quercetin is bioavailable from all of the berries consumed in this study (lingonberries,
bilberries and black currants). The absolute bioavailability of quercetin from different
berries probably varies. Lingonberries, black currants and bilberries contain partly
different quercetin glycosides, and no information is available on the bioavailability
of, for instance, quercetin arabinosides. Moreover, differences in the distribution of
quercetin in the different compartments of berries and the thickness of the skin of the
berries could affect the availability of quercetin.
Limited data are available on plasma quercetin concentrations in subjects consuming
their habitual diets. In most studies, the baseline plasma samples have been collected
from subjects following a flavonoid-restricted diet. The mean baseline plasma
quercetin concentrations were 16 ± 13 µg/l in Study III. Quercetin was detected in
plasma of all subjects. The results indicate that the compound is bioavailable from a
rather typical Finnish diet. Similar findings have recently been made in other studies
performed at the Biomarker Laboratory (not included in this thesis). For instance, in
37 female health professionals following their habitual diets, the mean plasma
quercetin concentration was 16 ± 24 µg/l (Erlund et al. 2002). In another study, in 77
female and male subjects following either high- or low-vegetable diets, quercetin
concentrations were 24 ± 17 µg/l during habitual diets, 15 ± 7 µg/ after a low-
vegetable diet and 42 ± 24 µg/l after a high-vegetable diet (Freese et al. 2002). Similar
results were obtained by Noorozi et al. (2000), who reported baseline plasma quercetin
values of 23 µg/l in 10 diabetic subjects.

73
7.4. Plasma and urine quercetin, hesperetin and naringenin as biomarkers of
intake
Few excellent biomarkers of nutrient intake on an individual level are available.
Factors such as under-reporting, poor memory, inaccurate intake assessment, and
lacking or inaccurate food composition data make the accurate assessment of an
individual’s nutrient intake by dietary survey methods difficult. Plasma or urine (the
tissues most often available in population studies) nutrient concentrations, on the other
hand, can vary considerably during the day, week or season. Fortunately, there is
seldom a need to assess intake accurately on an individual level, but rather on a group
basis.
The work included in this thesis indicates that plasma quercetin is a fairly good
biomarker of intake. Study II showed that plasma quercetin concentrations increase
with increasing dose and that the half-life of quercetin is relatively long. The
compound is also bioavailable from the diet (Study III). However, the fluctuation in
plasma levels weakens the value of plasma quercetin, as well as most other dietary
compounds, as a biomarker of intake. Yet, several factors advocate its use. Firstly, the
extent of exposure, the strength of the experimental evidence regarding effects, and the
prevalence and severity of the medical conditions in question are such that the subject
is considered to be important. Secondly, the only other biomarker of quercetin intake
available, i.e. intake assessment from food records or questionnaires, has many
disadvantages. An accurate assessment of the intake of onion, in particular,
qualitatively and quantitatively the most important source of quercetin, is problematic
because onion is a commonly used ”hidden ingredient” of many home-made and
processed foods. Thirdly, the use of plasma concentrations instead of calculated intake
as a measure of ”bioavailable intake” may correct some of the errors caused by
between-individual and between-source differences in bioavailability.

74
Study IV indicated that the pharmacokinetics of the flavanones hesperetin and
naringenin are such that their concentrations in single plasma and urine samples are
not well suited for biomarker use. Because their half-lives are short (1-2 h) variations
in plasma concentrations are expected to be great. This assumption is supported by
results from a more recent study, in which a citrus-containing diet was consumed by
healthy women for five weeks (Erlund et al. 2002). In that study, using the method
developed in Study IV, ingestion of one glass of orange juice, half an orange and half a
mandarin daily resulted in measurable levels of hesperetin and naringenin in fasting
plasma of 54% and 21% of all subjects, respectively (Erlund et al. 2002). Study IV
also indicated that the urinary clearance of naringenin is dose-dependent, although
more studies regarding this issue are needed because there could be a threshold
concentration for the phenomenon. Because of the marked interindividual variation in
bioavailability, it is important to monitor bioavailability in clinical studies
investigating the effects of flavanones. This can be done by taking multiple plasma
samples after a suitable timeperiod following flavanone intake. However, in
epidemiological studies, a more sensible approach would be to assess intake from food
records or questionnaires (if citrus consumption was asked). After all, flavanones are
mainly obtained from citrus fruits and juices, and the errors in estimating their intake
are probably relatively small.
75
7.5. Future directions
Most humans are exposed to flavonoids daily and therefore their impact on human
health is of relevance. The health effects of flavonoids are, however, largely unknown,
and interpretation of the results of the studies performed so far problematic. Several
types of studies could yield more information on the issue. For instance, studies are
needed on the metabolism of flavonoids to enable in vitro studies to be performed with
metabolites actually present in human tissues. In epidemiology, the use of plasma
flavonoid concentrations as biomarkers of intake may help to overcome some of the
problems associated with intake assessment by dietary survey methods. This approach
would probably be useful for compounds such as quercetin, but less so for hesperetin
and naringenin. More clinical studies on the health effects of both high and low doses
of flavonoids are also needed. The lack of methods detecting small changes in
biological or physiological responses is, however, a problem. Long-term and large-
scale supplementation studies with humans are not warranted at this time because they
are too costly and require a more solid evidence of benefit before they can be ethically
justified. This applies not only to flavonoids, but to most ”potentially beneficial”
dietary components.
Cell studies aimed at identifying quercetin metabolites in humans are currently
underway at the Biomarker Laboratory. The analytical methods presented in this thesis
have been further developed to cover other phenolic compounds in plasma, such as
lignans, isoflavones and phenolic acids, as well as their metabolites. Their plasma
concentrations are being measured in subjects selected from Finnish population
cohorts. Hopefully, these studies will shed some new light on the associations between
flavonoids and other plant phenolics, and chronic diseases such as cardiovascular
disease and cancer.

76
8. SUMMARY AND CONCLUSIONS
Results of the studies can be summarized as follows:
1. Methods were developed for the analysis of quercetin, hesperetin and naringenin in
plasma and urine. The quercetin method had a low detection limit and it is suitable
for the analysis of quercetin in plasma of individuals with low quercetin intakes.
The method had excellent reproducibility over a long period, indicating that it can
be used to reliably measure quercetin levels in large sets of samples with low
quercetin concentrations. The hesperetin and naringenin method was suitable for
the analysis of flavanones in human plasma and urine. The method had good
reproducibility and is well suited for analysing hesperetin and naringenin in plasma
and urine of human subjects after consumption of citrus fruits or juices.
2. All of the studied flavonoids were bioavailable. The bioavailability and
pharmacokinetic properties differed for the compounds depending on the subgroup
and the glycosidic form. Especially after ingestion of quercetin and the flavanones
as rutinosides or neohesperosides, marked between-subject variation occurred in
plasma levels. Furthermore, the bioavailability of quercetin from rutin was better in
women than in men. The elimination half-life (T1/2) of quercetin in plasma was 15-
18 h, which is rather long compared with the half-lives of naringenin and
hesperetin (1-2 h).
3. Berries appear to be a good source of bioavailable quercetin. The compound is also
bioavailable from a typical Finnish diet. The mean fasting plasma quercetin
concentration of middle-aged men consuming their habitual diets was 16 ± 13 µg/l
(mean ± SD).
4. Hesperetin was bioavailable from orange juice, and naringenin was bioavailable
from orange juice and grapefruit juice. After ingestion of citrus juices, plasma
77
flavanone concentrations were relatively high (up to 4 mg/l), corroborating the
need for more studies on their putative health effects.
5. Fasting plasma quercetin concentration appears to be a fairly good biomarker of
dietary quercetin intake. The compound has a comparatively long elimination half-
life and its plasma concentrations increase with increasing dose. Fasting plasma
and urine flavanone concentrations, on the other hand, are expected to be less
useful biomarkers of intake.

78
9. ACKNOWLEDGEMENTS
This work was carried out at the Biomarker Laboratory, at the National Public Health
Institute, Helsinki, Finland, during the period 1995-2002. I am indebted to Professor
Jussi Huttunen, Director General of the National Public Health Institute, for placing
the facilities of the institute at my disposal.
I express my sincere gratitute to my supervisors Professor Antti Aro, Head of the
former Department of Nutrition, and Docent Georg Alfthan, Head of the Biomarker
Laboratory, for introducing me to the world of flavonoids. You have both always been
there to answer questions and encouraged me to continue with the work. Your vast
knowledge in different areas of nutrition and nutritional biochemistry is admirable.
I gratefully acknowledge Professor Heikki Vapaatalo and Dr. Sari Mäkelä for critical
reading and valued comments on the manuscript.
Professor Antti Ahlström and Professor Ritva Prättälä at the Division of Nutrition at
Helsinki University are acknowledged for smooth handling of the practical matters
concerning the thesis.
I owe special thanks to Eva Kammiovirta B.Sc. whose excellent technical assistance
and dedication to the flavonoid project have been invaluable.
The volunteers that participated in the studies are warmly acknowledged – this work
would not have been possible without you.
Taru Kosonen, PhD, and the rest of the Leiras “flavonoid team” are thanked for
pleasant collaboration. My co-authors Jukka Marniemi PhD, Paula Hakala PhD and
Heli Siren PhD are also acknowledged. In addition, I would like to thank Marja-Leena
Ovaskainen D.Sc. for numerous discussions in the field of nutrition
79
Elina Suviolahti M.Sc. - metabolite hunting may have been tedious, but it was
certainly fun!
Mr Kari Ariniemi, chromatography specialist, is thanked for fruitful discussions about
chromatography. Dr Esa Meririnne is thanked for interesting discussions on statistics
and pharmacokinetics. You boys are true scientists !
My gratitude is due to past and present staff at the Biomarker Laboratory for the warm,
down-to-earth athmosphere in the laboratory. Irma Salminen M.Sc. (my room-mate for
many years), Kaija Lampi, Pirjo Laaksonen, Päivi Mustonen and Ira Greinert. Thank
you. In addition, the people working at the Drug Research Unit and the Laboratory of
Substance Abuse are thanked for sharing many good days with me.
The entire Valkama family, Ann-Louise and Gertrud Erlund, and most importantly,
my beloved husband Patrik and our children Hanna and Fanny deserve special mention
– you have helped me in keeping things in perspective. You are the ones who matter
the most.
Financial support from the Academy of Finland, the Juho Vainio Foundation, the Yrjö
Jahnsson Foundation and the Finnish Foundation for Cardiovascular Research is
gratefully acknowledged.
80
10. REFERENCES
van Acker FA, Tromp MN, Haenen GR, van der Vijgh WJ, Bast A. Flavonoids can replace -tocopherol as an antioxidant. FEBS Lett 2000;473:145-148.
Agullo G, Gamet-Payrastre L, Manenti S, Viala C, Remesy C, Chap H, et al. Relationshipbetween flavonoid structure and inhibition of phosphatidylinositol 3-kinase: a comparisonwith tyrosine kinase and protein kinase C inhibition. Biochem Pharmacol 1997;53:1649-1657.
Aherne SA, O’Brien NM. Mechanism of protection by the flavonoids, quercetin and rutin,against tert-butylhydroperoxide- and menadione-induced DNA single strand breaks in Caco-2cells. Free Radic Biol Med 2000;29:507-514.
Ameer B, Weintraub RA, Johnson JV, Yost RA, Rouseff RL. Flavanone absorption afternaringin, hesperidin, and citrus administration. Clin Pharmacol Ther 1996;60:34-40.
Arai Y, Watanabe S, Kimira M, Shimoi K, Mochizuki R, Kinae N. Dietary intakes offlavonols, flavones and isoflavones by Japanese women and the inverse correlation betweenquercetin intake and plasma LDL cholesterol concentration. J Nutr 2000;130:2243-2250.
Arts IC, van de Putte B, Hollman PC. Catechin contents of foods commonly consumed in TheNetherlands. 1. Fruits, vegetables, staple foods, and processed foods. J Agric Food Chem2000a;48:1746-1751.
Arts IC, van de Putte B, Hollman PC. Catechin contents of foods commonly consumed in TheNetherlands. 2. Tea, wine, fruit juices, and chocolate milk. J Agric Food Chem2000b;48:1752-1757.
Aziz AA, Edwards CA, Lean ME, Crozier A. Absorption and excretion of conjugatedflavonols, including quercetin-4’-O-beta-glucoside and isorhamnetin-4’-O-beta-glucoside byhuman volunteers after the consumption of onions. Free Radic Res 1998;29:257-269.
Baba S, Furuta T, Horie M, Nakagawa H. Studies of drug metabolism by use of isotopesXXVI: determination of urinary metabolites of rutin in humans. J Pharm Sci 1981;70:780-782.
Back DJ, Orme ML. Pharmacokinetic drug interactions with oral contraceptives. ClinPharmacokinet 1990;18:472-484.
Bailey DG, Dresser GK, Kreeft JH, Munoz C, Freeman DJ, Bend JR. Grapefruit-felodipineinteraction: effect of unprocessed fruit and probable active ingredients. Clin Pharmacol Ther2000;68:468-477.
Bates CJ, Thurnam DI, Bingham SA, Margetts BM, Nelson M. Biochemical markers ofnutrient intake. In: Margetts BM, Nelson M, editors. Design Concepts in nutritionalepidemiology. New York: Oxford University Press; 1997. p. 170-240.
81
Bennink R, Peeters M, Van den Maegdenbergh V, Geypens B, Rutgeerts P, De Roo M, et al.Evaluation of small-bowel transit for solid and liquid test meal in healthy men and women.Eur J Nucl Med 1999;26:1560-1566.
Bjeldanes LF, Chang GW. Mutagenic activity of quercetin and related compounds. Science1977;197:577-578.
Boekema PJ, Lo B, Samsom M, Akkermans LM, Smout AJ. The effect of coffee on gastricemptying and oro-caecal transit time. Eur J Clin Invest 2000;30:129-134.
Borradaile NM, Carroll KK, Kurowska EM. Regulation of HepG2 cell apolipoprotein Bmetabolism by the citrus flavanones hesperetin and naringenin. Lipids 1999;34:591-598.
Boulton DW, Walle UK, Walle T. Extensive binding of the bioflavonoid quercetin to humanplasma proteins. J Pharm Pharmacol 1998;50:243-249.
Boulton DW, Walle UK, Walle T. Fate of the flavonoid quercetin in human cell lines:chemical instability and metabolism. J Pharm Pharmacol 1999;51:353-359.
Cheng Z, Radominska-Pandya A, Tephly TR. Cloning and expression of human UDP-glucuronosyltransferase (UGT) 1A8. Arch Biochem Biophys 1998;356:301-305.
Cheng Z, Radominska-Pandya A, Tephly TR. Studies on the substrate specificity of humanintestinal UDP-glucuronosyltransferases 1A8 and 1A10. Drug Metab Dispos 1999;27:1165-1170.
Chopra M, Fitzsimons PE, Strain JJ, Thurnham DI, Howard AN. Nonalcoholic red wineextract and quercetin inhibit LDL oxidation without affecting plasma antioxidant vitamin andcarotenoid concentrations. Clin Chem 2000;46:1162-1170.
Conquer JA, Maiani G, Azzini E, Raguzzini A, Holub BJ. Supplementation with quercetinmarkedly increases plasma quercetin without effect on selected risk factors for heart diseasein healthy subjects. J Nutr 1998;128:593-597.
Cook NC and Samman S. Flavonoids - chemistry, metabolism, cardioprotective effects, anddietary sources. Nutr Biochem 1996;7:66-76.
Crespy V, Morand C, Besson C, Manach C, Demigne C, Remesy C. Quercetin, but not itsglycosides, is absorbed from the rat stomach. J Agric Food Chem 2002;50:618-621.
Crespy V, Morand C, Manach C, Besson C, Demigne C, Remesy C. Part of quercetinabsorbed in the small intestine is conjugated and further secreted in the intestinal lumen. Am JPhysiol 1999;277:G120-G126.
Dai D, Tang J, Rose S, Hodgson E, Bienstock RJ, Mohrenweiser HW, et al. Identification ofvariants of CYP3A4 and characterization of their abilities to metabolize testosterone andchlorpyrifos. J Pharmacol Exp Ther 2001:299:825-831.

82
Day AJ, Bao Y, Morgan MR, Williamson G. Conjugation position of quercetin glucuronidesand effect on biological activity. Free Radic Biol Med 2000a;29:1234-1243.
Day AJ, Canada FJ, Diaz JC, Kroon PA, Mclauchlan R, Faulds CB et al. Dietary flavonoidand isoflavone glycosides are hydrolysed by the lactase site of lactase phlorizin hydrolase.FEBS Lett 2000b;468:166-170.
Day AJ, DuPont MS, Ridley S, Rhodes M, Rhodes MJ, Morgan MR, et al. Deglycosylation offlavonoid and isoflavonoid glycosides by human small intestine and liver beta-glucosidaseactivity. FEBS Lett 1998;436:71-75.
De Stefani E, Boffetta P, Deneo-Pellegrini H, Mendilaharsu M, Carzoglio JC, Ronco A, et al.Dietary antioxidants and lung cancer risk: a case-control study in Uruguay. Nutr Cancer1999;34:100-110.
De Stefani E, Ronco A, Mendilaharsu M, Deneo-Pellegrini H. Diet and risk of cancer of theupper aerodigestive tract II. Nutrients. Oral Oncol 1999;35:22-26.
Déchaud H, Ravard C, Claustrat F, de la Perriere AB, Pugeat M. Xenoestrogen interactionwith human sex hormone-binding globulin (hSHBG). Steroids 1999;64:328-334.
Da Silva EL, Tsushida T, Terao J. Inhibition of mammalian 15-lipoxygenase-dependent lipidperoxidation in low-density lipoprotein by quercetin and quercetin monoglucosides. ArchBiochem Biophys 1998;349:313-20.
Deschner EE, Ruperto J, Wong G, Newmark HL. Quercetin and rutin as inhibitors ofazoxymethanol-induced colonic neoplasia. Carcinogenesis 1991;12:1193-1196.
Di Carlo G, Mascolo N, Izzo AA, Capasso F. Flavonoids: old and new aspects of a class ofnatural therapeutic drugs. Life Sci 1999;65:337-353.
Dresser GK, Spence JD, Bailey DG. Pharmacokinetic-pharmacodynamic consequences andclinical relevance of cytochrome P450 3A4 inhibition Clin Pharmacokinet 2000;38:41-57
Erlund I, Silaste ML, Alfthan G, Rantala M, Kesäniemi YA, Aro A. Plasma concentrations ofthe flavonoids naringenin, hesperetin and quercetin in human subjects following their habitualdiets, or diets high or low in fruits and vegetables. Eur J Clin Nutr In press 2002.
Ferrali M, Signorini C, Caciotti B, Sugherini L, Ciccoli L, Giachetti D, et al. Protectionagainst oxidative damage of erythrocyte membrane by the flavonoid quercetin and its relationto iron chelating activity. FEBS Lett 1997;416:123-129.
Ferry DR, Smith A, Malkhandi J, Fyfe DW, deTakats PG, Anderson D, et al. Phase I clinicaltrial of the flavonoid quercetin: pharmacokinetics and evidence for in vivo tyrosine kinaseinhibition. Clin Cancer Res 1996;2:659-668.
Fisher MB, VandenBraden M, Findlay K, Burchell B, Thummel K, Hall SD. Tissuedistribution and interindividual variation in human UDP-glucuronosyltransferase activity:

83
relationship between UGT1A1 promoter genotype and variability in a liver bank.Pharmacogenetics 2000;10:727-739.
Fleck C, Braunlich H. Factors determining the relationship between renal and hepaticexcretion of xenobiotics. Arzneimittelforschung 1990;40:942-946.
Formica JV, Regelson W. Review of the biology of quercetin and related bioflavonoids. FoodChem Toxicol 1995;33:1061-1080.
Freese R, Alfthan G, Jauhiainen M, Basu S, Erlund I, Salminen I, et al. High intake ofvegetables, berries and apple combined with high intake of linoleic or oleic acid only slightlyaffects markers of lipid peroxidation and lipoprotein metabolism in healthy subjects. Am JClin Nutr In Press 2002.
Fuhr U. Drug interactions with grapefruit juice. Extent, probable mechanism and clinicalrelevance. Drug Saf 1998;18:251-272.
Fuhr U, Kummert AL. The fate of naringin in humans: a key to grapefruit juice-druginteractions? Clin Pharmacol Ther 1995;58:365-373.
Garcia R, Gonzalez CA, Agudo A, Riboli E. High intake of specific carotenoids andflavonoids does not reduce the risk of bladder cancer. Nutr Cancer 1999;35:212-214.
Garcia-Closas R, Agudo A, Gonzalez CA, Riboli E. Intake of specific carotenoids andflavonoids and the risk of lung cancer in women in Barcelona, Spain. Nutr Cancer1998;32:154-158.
Garcia-Closas R, Gonzalez CA, Agudo A, Riboli E. Intake of specific carotenoids andflavonoids and the risk of gastric cancer in Spain. Cancer Causes Control 1999;10:71-75.
Ghosal A, Satoh H, Thomas PE, Bush E, Moore D. Inhibition and kinetics of cytochromeP4503A activity in microsomes from rat, human, and cdna expressed human cytochromeP450. Drug Metab Dispos 1996;24, 940-947.
Glatt H. Sulfotransferases in the bioactivation of xenobiotics. Chem Biol Interact2000;129:141-170.
Graefe EU, Wittig J, Mueller S, Riethling AK, Uehleke B, Drewelow B. Pharmacokineticsand bioavailability of quercetin glycosides in humans. J Clin Pharmacol 2001;41:492-499.
Gugler R, Leschik M, Dengler HJ. Disposition of quercetin in man after single oral andintravenous doses. Eur J Clin Pharmacol 1975;9:229-234.
Hakala P, Marniemi J, Knuts L-R, Kumpulainen J, Tahvonen R, Plaami S. Calculated vs.analysed nutrient composition of weight reduction diets. Food Chem 1996;57:71-75.
Häkkinen SH, Kärenlampi SO, Heinonen IM, Mykkänen HM, Törrönen AR. HPLC methodfor screening of flavonoids and phenolic acids in berries. J Sci Food Agric 1998;77:543-551.

84
Häkkinen SH, Kärenlampi SO, Heinonen IM, Mykkänen HM, Törrönen AR. Content of theflavonols quercetin, myricetin, and kaempferol in 25 edible berries. J Agric Food Chem1999;47:2274-2279.
Hall SD, Thummel K, Watkins PB, Lown KS, Benet LZ, Paine MF, et al. Molecular andphysical mechansims of first-pass extraction. Drug Metab Disp 1999;27:161-166.
Hansen RK, Oesterreich S, Lemieux P, Sarge KD, Fuqua SA. Quercetin inhibits heat shockprotein induction but not heat shock factor DNA-binding in human breast carcinoma cells.Biochem Biophys Res Commun 1997;239:851-6.
Harborne JB, Williams CA. Advances in flavonoid research since 1992. Phytochemistry2000;55:481-504.
Harris RZ, Benet LZ, Schwartz JB. Gender effects in pharmacokinetics andpharmacodynamics. Drugs 1995;50:222-239.
Hayek T, Fuhrman B, Vaya J, Rosenblat M, Belinky P, Coleman R, et al. Reducedprogression of atherosclerosis in apolipoprotein E-deficient mice following consumption ofred wine, or its polyphenols quercetin or catechin, is associated with reduced susceptibility ofLDL to oxidation and aggregation. Arterioscler Thromb Vasc Biol 1997;17:2744-2752.
Heaney RP. Factors influencing the measurement of bioavailability, taking calcium as amodel. J Nutr 2001;131:1344S-1348S.
Her C, Szumlanski C, Aksoy IA, Weinshilbaum RM. Human jejunal estrogen sulfotransferaseand dehydroepiandrosterone sulfotransferase. Immunochemical characterization ofinterindividual variation. Drug Metab Dispos 1996;24:1328-1335.
Hertog MGL, Feskens EJM, Hollman PCH, Katan MB and Kromhout D. Dietary antioxidantflavonoids and risk of coronary heart disease: the Zutphen Elderly Study. Lancet1993b;342:1007-1011.
Hertog MGL, Feskens EJM, Hollman PCH, Katan MB and Kromhout D. Dietary flavonoidsand cancer risk in the Zutphen Elderly Study 1994;22:175-184.
Hertog MGL, Hollman PCH. Potential health effects of the dietary flavonol quercetin. Eur JClin Nutr 1996;50:63-71.
Hertog MGL, Hollman PCH, Katan MB. Content of potentially anticarcinogenic flavonoidsof 28 vegetables and 9 fruits commonly used in the Netherlands. J Agric Food Chem1992a;40:2379-2383.
Hertog MGL, Hollman PCH, van de Putte B. Flavonol and flavone content of beverages. JAgric Food Chem 1993a;41:1242-1246.
Hertog MGL, Hollman PCH, Venema DP. Optimization of a quantitative HPLCdetermination of potentially anticarcinogenic flavonoids in vegetables and fruits. J Agric FoodChem 1992b;40:1591-1598.

85
Hertog MG, Kromhout D, Aravanis C, Blackburn H, Buzina R, Fidanza F, et al. Flavonoidintake and long-term risk of coronary heart disease and cancer in the seven countries study.Arch Intern Med 1995;155:381-386.
Hertog MG, Sweetnam PM, Fehily AM, Elwood PC, Kromhout D. Antioxidant flavonols andischemic heart disease in a Welsh population of men: the Caerphilly Study. Am J Clin Nutr1997;65:1489-1494.
Hirvonen T. Flavonol and flavone intake and risk of cardiovascular disease and cancer inmale smokers [dissertation]. Publications of the National Public Health Institute (KTL)A19/2001, Helsinki, 2001a.
Hirvonen T, Pietinen P, Virtanen M, Ovaskainen ML, Häkkinen S, Albanes D, Virtamo J.Intake of flavonols and flavones and risk of coronary heart disease in male smokers.Epidemiology 2001b;12:62-67.
Hirvonen T, Virtamo J, Korhonen P, Albanes D, Pietinen P. Flavonol and flavone intake andthe risk of cancer in male smokers (Finland). Cancer Causes Control 2001c;12:789-796.
Hollman PCH, Bijsman MNCP, van Gameren Y, Cnossen EP, de Vries JH, Katan MB. Thesugar moiety is a major determinant of the absorption of dietary flavonoid glycosides in man.Free Radic Res 1999;31;569-573.
Hollman PC, Gaag MV, Mengelers MJ, van Trijp JM, De Vries JM, Katan MB. Absorptionand disposition kinetics of the dietary antioxidant quercetin in man. Free Radic Biol Med1996;21:703-707.
Hollman PC, de Vries JH, van Leeuwen SD, Mengelers MJ, Katan MB. Absorption of dietaryquercetin glycosides and quercetin in healthy ileostomy volunteers. Am J Clin Nutr1995;62:1276-1282.
Hollman PC, van Het Hof KH, Tijburg LB, Katan MB. Addition of milk does not affect theabsorption of flavonols from tea in man. Free Radic Res 2001;34, 297-300.
Hollman PC, van Trijp JM, Buysman MN, van der Gaag MS, Mengelers MJ, de Vries J.Relative bioavailability of the antioxidant flavonoid quercetin from various foods in man.FEBS Lett 1997;418:152-156.
Honohan T, Hale RL, Brown JP, Wingard RE. Synthesis and metabolic fate of hesperetin-3-14C. J Agric Food Chem 1976;24:906-911.
Huang Z, Fasco MJ, Kaminsky LS. Inhibition of estrone sulfatase in human liver microsomesby quercetin and other flavonoids. J Steroid Biochem Molec Biol 1997;63:9-15.
Huk I, Brovkovych V, Nanobash Vili J, Weigel G, Neumayer C, Partyka L, et al.Bioflavonoid quercetin scavenges superoxide and increases nitric oxide concentration inischaemia-reperfusion injury: an experimental study. Br J Surg 1998;85:1080-1085.
86
Hunter D. Biochemical indicators of dietary intake. In: Willet W, editor. NutritionalEpidemiology. New York: Oxford University Press; 1998. p. 174-243.
Ishii K, Furuta T, Kasuya Y. Determination of naringin and naringenin in human plasma byhigh-performance liquid chromatography. J Chromatogr B Biomed Appl 1996;683:225-229
Ishii K, Furuta T, Kasuya Y. Determination of naringin and naringenin in human urine byhigh-performance liquid chromatography utilizing solid-phase extraction. J Chromatogr BBiomed Appl 1997;704:299-305.
Ishii K, Furuta T, Kasuya Y. Mass spectrometric identification and high-performance liquidchromatographic determination of a flavonoid glycoside naringin in human urine. J AgricFood Chem 2000;48:56-59.
Jang IS, Kim DH. Purification and characterization of alpha-L rhamnosidase fromBacteroides JY-6, a human intestinal bacterium. Biol Pharm Bull 1996;19:1546-1549.
Jeon SM, Bok SH, Jang MK, Kim YH, Nam KT, Jeong TS, et al. Comparison of antioxidanteffects of naringin and probucol in cholesterol-fed rabbits. Clin Chim Acta 2002;317:181-190.
Kagaya M, Iwata N, Toda Y, Nakae Y, Kondo T. Small bowel transit time and colonicfermentation in young and elderly women. J Gastroenterol 1997;32:453-456.
Kashuba AD, Nafziger AN. Physiological changes during the menstrual cycle and theireffects on the pharmacokinetics and pharmacodynamics of drugs. Clin Pharmacokinet1998;34:203-218.
Kawaii S, Tomono Y, Katase E, Ogawa K, Yano M. Quantitation of flavonoid constituents inCitrus fruits. J Agric Food Chem 1999;47:3565-3571.
Kerb R, Hoffmeyer S, Brinkmann U. ABC drug transporters: hereditary polymorphisms andpharmacological impact in MDR1, MRP1 and MRP2. Pharmacogenomics 2001;2:51-64.
Knekt P, Järvinen R, Reunanen A and Maatela J. Flavonoid intake and coronary mortality inFinland: a cohort study. BMJ 1996;312; 478-481.
Knekt P, Järvinen R, Seppänen R, Heliövaara M, Teppo L, Pukkala E, et al. Dietaryflavonoids and the risk of lung cancer and other malignant neoplasms. Am J Epidemiol1997;146: 223-230.
Knekt P, Kumpulainen J, Järvinen R, Rissanen H, Heliövaara M, Reunanen A, et al.Flavonoid intake and risk of chronic diseases. Am J Clin Nutr 2002;76:560-568.
Kobuchi H, Roy S, Sen CK, Nguyen HG, Packer L. Quercetin inhibits inducible ICAM-1expression in human endothelial cells through the JNK pathway. Am J Physiol1999;277:C403-C411.

87
Kohlmeier L. What you should know about your marker. In: Kok FJ, van´t Veer P, editors.Biomarkers of dietary exposure. Proceedings of the 3rd meeting on nutritional epidemiology.London: Smith-Gordon and Company Limited; 1991. p. 15-25.
van der Kolk DM, de Vries EG, van Putten WJ, Verdonck LF, Ossenkoppele GJ, VerhoefGE, et al. P-glycoprotein and multidrug resistance protein activities in relation to treatmentoutcome in acute myeloid leukemia. Clin Cancer Res 2000;6:3205-3214.
Krause M, Galensa R. Determination of naringenin and naringenin-chalcone in tomato skinsby reversed phase HPLC after solid phase extraction. Z Lebensm Unters Forsch 1992;194:29-32.
Kühnau J. The flavonoids. A class of semi-essential food components: their role in humannutrition. Wld Rev Nutr Diet 1976:24:117-191.
Kuiper GG, Lemmen JG, Carlsson B, Corton JC, Safe SH, van der Saag PT, et al. Interactionof estrogenic chemicals and phytoestrogens with estrogen receptor beta. Endocrinology1998;139:4252-4263.
Kumpulainen JT, Lehtonen M, Mattila P. Trolox equivalent antioxidant capacity of averageflavonoid intake in Finland. In: Kumpulainen JT, Salonen JT, editors. Natural Antioxidants inNutrition, Health and Disease. Cambridge: The Royal Society of Chemistry; 1999. p.141-150,
Kurowska EM, Borradaile NM, Spence JD, Carrol CC. Hypocholesterolemic effects ofdietary citrus juices in rabbits. Nutr Res 2000a;20:121-129.
Kurowska EM, Spence JD, Jordan J, Wetmore S, Freeman DJ, Piche LA, et al. HDL-cholesterol-raising effect of orange juice in subjects with hypercholesterolemia. Am J ClinNutr 2000b;72:1095-1100.
Lee SH, Jeong TS, Park YB, Kwon YK, Choi MS, Bok SH. Hypocholesterolemic effect ofhesperetin mediated by inhibition of 3-hydroxy-3-methylglutaryl coenzyme A reductase andacyl coenzyme A:cholesterol acyltransferase in rats fed high-cholesterol diet. Nutr Res1999a;19:1245-1258.
Lee SH, Park YB, Bae KH, Kwon YK, ES Lee, Choi MS. Cholesterol-lowering activity ofnaringenin via inhibition of 3-hydroxy-3-methylglutaryl coenzyme A reductase and acylcoenzyme A:cholesterol acyltransferase in rats. Ann Nutr Metab 1999b;43:173-180.
Lee YS, Reidenberg MM. A method for measuring naringenin in biological fluids and itsdisposition from grapefruit juice by man. Pharmacology 1998;56:314-317.
Le Marchand L, Murphy SP, Hankin JH, Wilkens LR, Kolonel LN. Intake of flavonoids andlung cancer. J Natl Cancer Inst 2000;92:154-160.
Leslie EM, Mao Q, Oleschuk CJ, Deeley RG, Cole SP. Modulation of multidrug resistanceprotein 1 (MRP1/ABCC1) transport and ATPase activities by interaction with dietaryflavonoids. Mol Pharmacol 2001;59:1171-80.

88
Liggins J, Bluck LJ, Runswick S, Atkinson C, Coward WA, Bingham SA. Daidzein andgenistein contents of vegetables. Br J Nutr 2000;84:717-25.
Lilja JJ, Kivistö KT, Neuvonen PJ. Duration of effect of grapefruit juice on thepharmacokinetics of the CYP3A4 substrate simvastatin. Clin Pharmacol Ther 2000;68:384-390.
Liu B, Anderson D, Ferry DR, Seymour LW, de Takats PG, Kerr DJ. Determination ofquercetin in human plasma using reversed-phase high-performance liquid chromatography. JChromatogr B Biomed Appl 1995;666:149-155.
Lorena SL, De Souza Almeida JR, Mesquita MA. Orocecal transit time in patients withfunctional dyspepsia. J Clin Gastroenterol 2002;35:21-24.
Lown KS, Fontana RJ, Schmiedlin-Ren P, Turgeon DK, Watkins PB. Interindividualvariation in intestinal mdr1: Lack of short term diet effects. Gastroenterology 1995:108:A737.
Ludden TM. Nonlinear pharmacokinetics. Clinical implications. Clin Pharmacokinet1991;20:429-446.
MacDonald IA, Bussard RG, Hutchison DM, Holdeman LV. Rutin-induced beta-glucosidaseactivity in Streptococcus faecium VGH-1 and Streptococcus sp. strain FRP-17 isolated fromhuman feces: formation of the mutagen, quercetin, from rutin. Appl Environ Microbiol1984;47:350-355.
Manach C, Morand C, Crespy V, Demigne C, Texier O, Régérat F, et al. Quercetin isrecovered in human plasma as conjugated derivatives which retain antioxidant properties.FEBS Lett 1998:426:331-336.
Manach C, Morand C, Texier O, Favier ML, Agullo G, Demigne C, et al. Quercetinmetabolites in plasma of rats fed diets containing rutin or quercetin. J Nutr 1995;125:1911-1922.
Manach C, Texier O, Régérat F, Agullo G, Demigne C, Rémésy C. Dietary quercetin isrecovered in rat plasma as conjugated derivatives of isorhamnetin and quercetin. NutrBiochem 1996:7:375-380.
Manthey JA, Grohmann K, Guthrie N. Biological properties of citrus flavonoids pertaining tocancer and inflammation. Curr Med Chem 2001;8:135-153.
Marniemi J, Hakala P, Mäki J, Ahotupa M. Partial resistance of low density lipoprotein tooxidation in vivo after increased intake of berries. Nutr Metab Cardiovasc Dis 2000;10:331-337.
Mattila P, Astola J, Kumpulainen J. Determination of flavonoids in plant material by HPLCwith diode-array and electro-array detections. J Agric Food Chem 2000;48:5834-5841.

89
Mazur WM, Duke JA, Wähälä K, Rasku S, Adlercreutz H. Isoflavonoids and lignans inlegumes: nutritional and health aspects in the human. J Nutr Biochem 1998;9:193-200.
Meech R, Mackenzie PI. Structure and function of uridine diphosphateglucuronosyltransferases. Clin Exp Pharmacol Physiol 1997;24:907-915.
Meibohm B, Beierle I, Derendorf H. How important are gender differences inpharmacokinetics? Clin Pharmacokinet 2002;41:329-342.
Miyagi Y, Om AS, Chee KM, Bennink MR. Inhibition of azoxymethane-induced coloncancer by orange juice. Nutr Cancer 2000;36:224-229.
Miyake Y, Yamamoto K, Tsujihara N, Osawa T. Protective effects of lemon flavonoids onoxidative stress in diabetic rats. Lipids 1998;33:689-695.
Mojarrabi B, MacKenzie PI. Characterization of two UDP glucuronosyltransferases that arepredominantly expressed in human colon. Biochem Biophys Res Commun 1998;247:704-709.
Moon JK, Tsushida T, Nahakara K, Terao J. Identification of quercetin 3-O- -D-glucuronideas an antioxidative metabolite in rat plasma after oral administration of quercetin. Free RadicBiol Med 2001;30:1274-1285.
Mouly PP, Arzouynan CR, Gaydou EM, Estienne JM. Differentiation of citrus juices byfactorial discriminant analysis using liquid chromatography of flananone glycosides. J AgricFood Chem 1994;42:70-79
Nagao A, Seki M, Kobayashi H. Inhibition of xanthine oxidase by flavonoids. BiosciBiotechnol Biochem 1999;63:1787-1790.
Nakagawa Y, Shetlar MR, Wender SH. Urinary products from quercetin in neomycin-treatedrats. Biochim Biophys Acta 1965;97:233-241.
van Nieuwenhoven MA, Brummer RM, Brouns F. Gastrointestinal function during exercise:comparison of water, sports drink, and sports drink with caffeine. J Appl Physiol2000;89:1079-1085.
Nijveldt RJ, van Nood E, van Hoorn DE, Boelens PG, van Norren K, van Leeuwen PA.Flavonoids: a review of probable mechanisms of action and potential applications. Am J ClinNutr 2001;74:418-425.
Nordström CG, Majani C. The autoxidation of flavonols in aqueous solutions. SuomenKemistilehti 1965;38:239-242.
Noroozi M, Burns J, Crozier A, Kelly IE, Lean ME. Prediction of dietary flavonolconsumption from fasting plasma concentration or urinary excretion. Eur J Clin Nutr2000;54:143-149.
90
Nyman NA, Kumpulainen JT. Determination of anthocyanidins in berries and red wine byhigh-performance liquid chromatography. J Agric Food Chem 2001;49:4183-4187.
Oliveira EJ, Watson DG. In vitro glucuronidation of kaempferol and quercetin by humanUGT-1A9 microsomes. FEBS Lett 2000;471:1-6.
Olthof MR, Hollman PCH, Vree TB, Katan MB. Bioavailabilities of quercetin-3-glucosideand quercetin-4’-glucoside do not differ in humans. J Nutr 2000;130:1200-1203.
Osborne PB, Chieng B, Christie MJ. Morphine-6 beta-glucuronide has a higher efficacy thanmorphine as a mu-opioid receptor agonist in the rat locus coeruleus. Br J Pharmacol2000;131:1422-8.
Paganga G, Rice-Evans CA. The identification of flavonoids as glycosides in human plasma.FEBS Lett 1997;401:78-82.
Pereira MA, Grubbs CJ, Barnes LH, Li H, Olson GR, Eto I. Effects of the phytochemicals,curcumin and quercetin, upon azoxymethane-induced colon cancer and 7,12-dimethylbenz[a]anthracene-induced mammary cancer in rats. Carcinogenesis 1996;17:1305-1311.
Peters WHM, Kock L, Nagengast FM, Kremers PG. Biotransformation enzymes in humanintestine: critical low levels in the colon ? Gut 1991;32:408-412.
Piantelli M, Ranelletti FO, Maggiano N, Serra FG, Ricci R, Larocca LM, et al. Quercetininhibits p21-RAS expression in human colon cancer cell lines and in primary colorectaltumors. Int J Cancer 2000;85:438-445.
Pignatelli P, Pulcinelli FM, Celestini A, Lenti L, Ghiselli A, Gazzaniga PP, et al. Theflavonoids quercetin and catechin synergistically inhibit platelet function by antagonizing theintracellular production of hydrogen peroxide. Am J Clin Nutr 2000;72:1150-1155.
Rang HP, Dale MM., editors. Pharmacology. C Edinburgh: Churchill Livingstone; 1991.
Rimm EB, Katan MB, Ascherio A, Stampfer MJ, Willett WC. Relation between intake offlavonoids and risk for coronary heart disease in male health professionals. Ann Intern Med1996;125:384-389.
Robards K, Antolovich M. Analytical chemistry of fruit bioflavonoids. A review. Analyst1997;122:11R-34R.
Rogers SM, Back DJ, Orme MLE. Intestinal metabolism of ethinyloestradiol and paracetamolin vitro: studies using Ussing chambers. Br J Clin Pharmacol 1987;23:727-734.
Rosenberg RS, Grass L, Jenkins DJ, Kendall CW, Diamandis EP. Modulation of androgenand progesterone receptors by phytochemicals in breast cancer cell lines. Biochem BiophysRes Commun 1998;248:935-939.
91
Rowland M, Tozer TN, editors. Clinical pharmacokinetics: concepts and applications. 3rd ed.Media (PA):Lippincott Williams & Wilkinson; 1995. p. 156-183.
Ruh MF, Zacharewski T, Connor K, Howell J, Chen I, Safe S. Naringenin: a weaklyestrogenic bioflavonoid that exhibits antiestrogenic activity. Biochem Pharmacol1995;50:1485-1493.
Sestili P, Guidarelli A, Dacha M, Cantoni O. Quercetin prevents DNA single strand breakageand cytotoxicity caused by tert-butylhydroperoxide: free radical scavenging versus ironchelating mechanism. Free Radic Biol Med 1998;25:196-200.
Shapiro AB, Ling V. Effect of quercetin on Hoechst 33342 transport by purified andreconstituted P-glycoprotein. Biochem Pharmacol 1997;53:587-596.
So FV, Guthrie N, Chambers AF, Moussa M, Carroll KK. Inhibition of human breast cancercell proliferation and delay of mammary tumorigenesis by flavonoids and citrus juices. NutrCancer 1996;262:167-181.
Spencer CM, Cai Y, Martin R, Gaffney SH, Goulding PN, Magnolato PN, et al. Polyphenolcomplexation – some thoughts and observations. Phytochemistry 1988;27:2397-2409.
Spencer JP, Chowrimootoo G, Choudhury R, Debnam ES, Srai SK, Rice-Evans C. The smallintestine can both absorb and glucuronidate luminal flavonoids. FEBS Lett 1999;458:224-230.
Stavric B. Quercetin in our diet: from potent mutagen to probable anticarcinogen. ClinBiochem 1994;27:245-248.
Tanaka T, Makita H, Kawabata K, Mori H, Kakumoto M, Satoh K, et al. Chemoprevention ofazoxymethane induced rat colon carcinogenesis by the naturally occurring flavonoids,diosmin and hesperidin. Carcinogenesis 1997;18:957-965.
Thummel KE, Kunze KL, Shen DD. Enzyme-catalyzed processes of first-pass hepatic andintestinal drug extraction. Adv Drug Deliv Rev 1997;27:99-127.
Tomás-Barberán FA, Clifford MN. Flavanones, chalcones and dihydrochalcones – nature,occurrence and dietary burden. J Sci Food Agric 2000;80:1073-1080.
Ueno I, Nakano N, Hirono I. Metabolic fate of [14C]Quercetin in the ACI rat. J Exp Med1983;53:41-50.
Verma AK, Johnson JA, Gould MN, Tanner MA. Inhibition of 7,12-dimethylbenz(a)anthracene and N-nitrosomethylurea induced mammary cancer by dietaryflavonol quercetin. Cancer Res 1988;48:5754-5788.
de Vries JH, Hollman PC, van Amersfoort I, Olthof MR and Katan MB. Red wine is a poorsource of bioavailable flavonols in men. J Nutr 2001;131:745-748.

92
de Vries JH, Hollman PC, Meyboom S, Buysman MNCP, Zock PL, van Staveren WA, et al.Plasma concentrations and urinary excretion of the antioxidant flavonols quercetin andkaempferol as biomarkers for dietary intake. Am J Clin Nutr 1998;68:60-65.
Wagner D, Spahn-Langguth H, Hanafy A, Koggel A, Langguth P. Intestinal drug efflux:formulation and food effects. Adv Drug Deliver Rev 2001;50:S13-S31.
#�����$%�&��'!(�����$�#���(�)�������*��+�����������,�����-������./! !glucoside by sodium-dependent glucose transporter SGLT1. J Pharmacol Exp Ther2000:294:837-843.
Walle T, Walle UK, Halushka PV. Carbon dioxide is the major metabolite of quercetin inhumans. J Nutr 2001;131:2648-2652.
Weintraub RA, Ameer B, Johnson JV, Yost RA. Trace determination of naringenin andhesperetin by tandem mass spectrometry. J Agric Food Chem 1995;43:1966-1968.
Williams CA, Harborne JB. In: Harborne JB, editors. The Flavonoids. Advances in researchsince 1986. London: Chapman & Hall; 1994. p. 337-385.
Xing N, Chen Y, Mitchell SH, Young CY. Quercetin inhibits the expression and function ofthe androgen receptor in LNCaP prostate cancer cells. Carcinogenesis 2001;22:409-414.
Yang M, Tanaka T, Hirose Y, Deguchi T, Mori H, Kawada Y. Chemopreventive effects ofdiosmin and hesperidin on N-butyl-N-(4 hydroxybutyl)nitrosamine-induced urinary-bladdercarcinogenesis in male ICR mice. Int J Cancer 1997:73:719-724.
Yochum L, Kushi LH, Meyer K, Folsom AR. Dietary flavonoid intake and risk ofcardiovascular disease in postmenopausal women. Am J Epidemiol 1999;149:943-949.
Yoon K, Pallaroni L, Stoner M, Gaido K, Safe S. Differential activation of wild-type andvariant forms of estrogen receptor alpha by synthetic and natural estrogenic compounds usinga promoter containing three estrogen-responsive elements. J Steroid Biochem Mol Biol2001;78:25-32.
Young JF, Nielsen SE, Haraldsdottir J, Daneshvar B, Lauridsen ST, Knuthsen P, et al. Effectof fruit juice intake on urinary quercetin excretion and biomarkers of antioxidative status. AmJ Clin Nutr 1999;69:87-94.