Iridium: Characterization & Countermeasures - Virginia … · Iridium: Characterization &...
18
Iridium: Characterization & Countermeasures S.W. Ellingson, P. McDougle Bradley Department of Electrical & Computer Engineering Virginia Polytechnic Institute & State University 340 Whittemore Hall, Blacksburg VA 24061 USA [email protected] RFI2004 – Penticton, BC July 2004
Transcript of Iridium: Characterization & Countermeasures - Virginia … · Iridium: Characterization &...

Iridium: Characterization & Countermeasures
S.W. Ellingson, P. McDougleBradley Department of Electrical & Computer EngineeringVirginia Polytechnic Institute & State University340 Whittemore Hall, Blacksburg VA 24061 [email protected]
RFI2004 – Penticton, BCJuly 2004
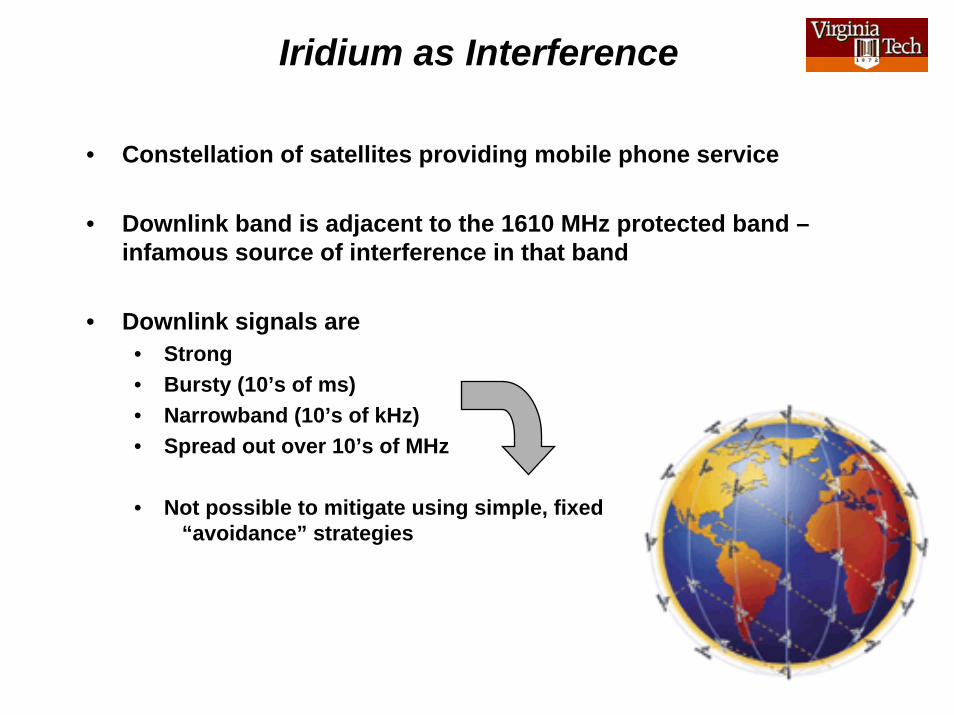
Iridium as Interference
• Constellation of satellites providing mobile phone service
• Downlink band is adjacent to the 1610 MHz protected band –infamous source of interference in that band
• Downlink signals are • Strong• Bursty (10’s of ms)• Narrowband (10’s of kHz) • Spread out over 10’s of MHz
• Not possible to mitigate using simple, fixed “avoidance” strategies

Argus • Transient tone/pulse search instrument
• N = 36 element array, 24 instrumented
• 1200-1700 MHz tuning
• Tsys ~ 215 °K per element
• Digitizes 20 MSPS complex (14 MHz BW); processed to 78.125 kSPS complex & aggregated into a single 80-Mb/s serial data stream
• Data stream broadcast using UDP/IP over Ethernet to PC cluster for all subsequent processing
• Pulse sensitivity ~ 24 kJy at zenith in 0.2 s
• No confirmed extrasolar detectons - yet. (All detections so far attributable to RFI)
• Iridium renders about 50 MHz of bandwidth around 1620 MHz unusable
http://www.ece.vt.edu/~swe/argus
Detection without Calibration
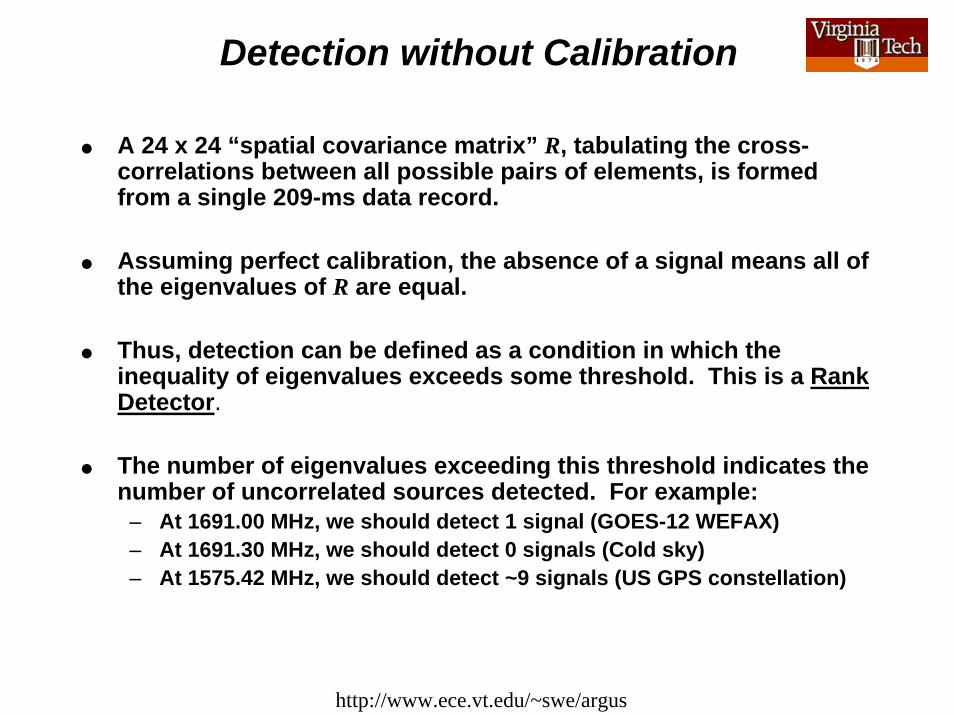
A 24 x 24 “spatial covariance matrix” R, tabulating the cross-correlations between all possible pairs of elements, is formed from a single 209-ms data record.
Assuming perfect calibration, the absence of a signal means all of the eigenvalues of R are equal.
Thus, detection can be defined as a condition in which the inequality of eigenvalues exceeds some threshold. This is a Rank Detector.
The number of eigenvalues exceeding this threshold indicates the number of uncorrelated sources detected. For example:
– At 1691.00 MHz, we should detect 1 signal (GOES-12 WEFAX)– At 1691.30 MHz, we should detect 0 signals (Cold sky)– At 1575.42 MHz, we should detect ~9 signals (US GPS constellation)
http://www.ece.vt.edu/~swe/argus
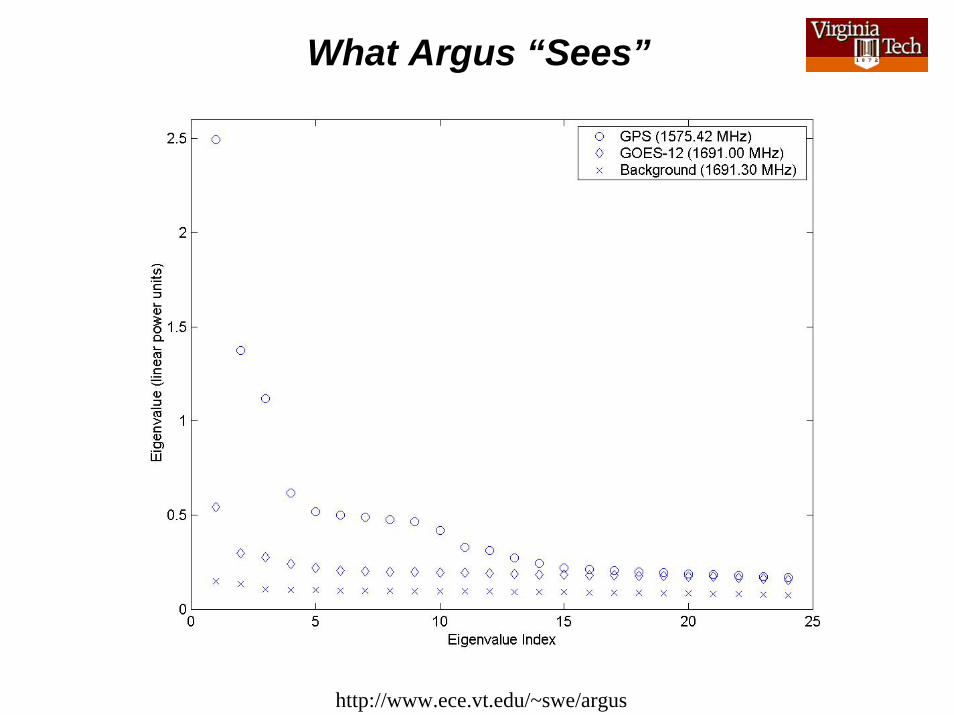
Observed eigenvalue spectra, 209 ms integrationObserved signal to noise ratios are consistent with anticipated 215 K / element system temp.
What Argus “Sees”
http://www.ece.vt.edu/~swe/argus

Following Up a Detection• Beam formed on detected source, using eigenvector for beamforming coefficients• Time series captured for storage for manual follow-up• Eventually, calibration performed to refine estimate of sky position
Signal from single element Signal after “blind” beamformingwith 24 elements
http://www.ece.vt.edu/~swe/argus

All-Sky Imaging1691 MHz (WEFAX signal from geostationary satelliteGOES-12)N=24 effectively isotropic elements“Almost pseudorandom” geometryApprox 215K per element30 kHz BW (~ matched to WEFAX BW)209 ms integration
GOES-12(Other bright spots are aliases arising from redundant subnyquist
spacings)Argus Array (N=24) Phase Center Geometry at 1691 MHz
Image before calibration After calibration using anear-field noise source
Same procedure applied toadjacent (signal free) channel
http://www.ece.vt.edu/~swe/argus

What Iridium Looks Like to Argus
Argus:Tuned to 1624.0 MHz
Spectrometer:∆ν = 100 Hz∆t = 10 msDuty Cycle ~ 0.1%
Iridium:~90 ms between burstsBursts 8-20 ms longINR variable, up to ~30 dB

Burst WaveformSample Rate: 78.125 kSPS
Magnitude
Phase
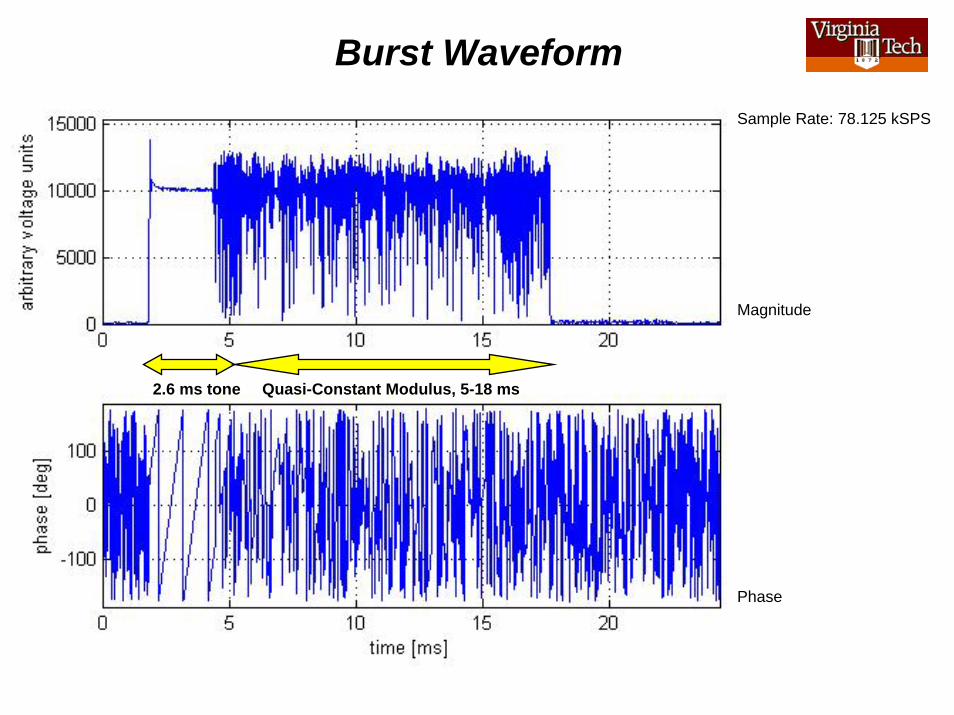
Burst WaveformSample Rate: 78.125 kSPS
Magnitude
Phase
2.6 ms tone Quasi-Constant Modulus, 5-18 ms

Burst I-Q Trajectory
“Payload” is revealed to beQuadrature Phase Shift
Keying (QPSK),Symbol Rate = 25 kHzRetuning pilot tone
to exactly zero Hz (Doppler Correction)
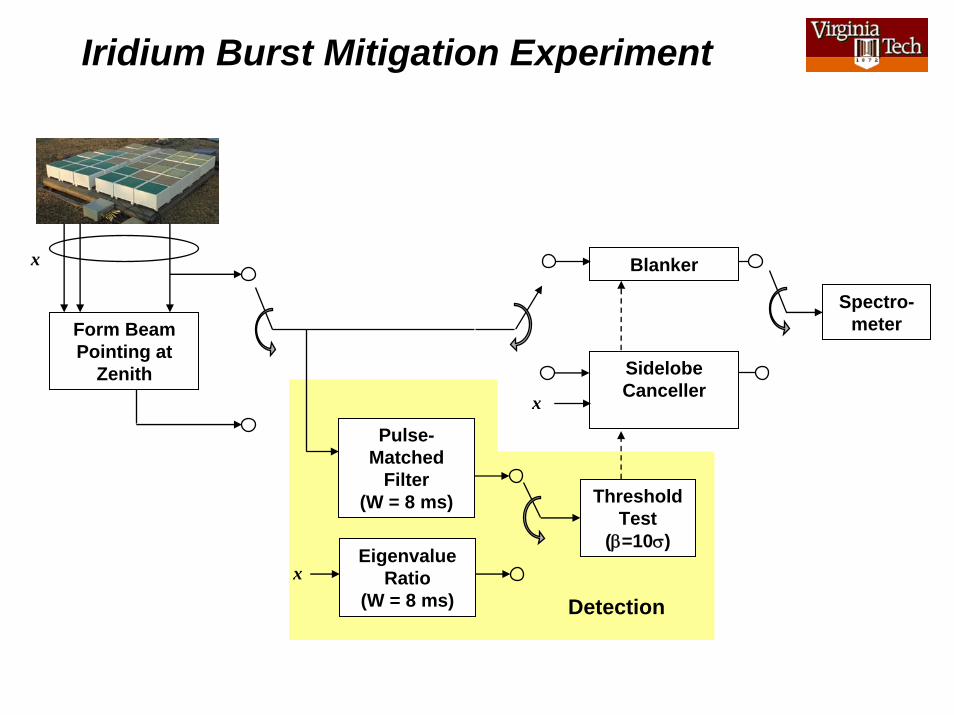
Iridium Burst Mitigation Experiment
SidelobeCanceller
Form BeamPointing at
Zenith
Pulse-Matched
Filter(W = 8 ms)
EigenvalueRatio
(W = 8 ms)
ThresholdTest
(β=10σ)
Blankerx
Spectro-meter
x
Detection
x
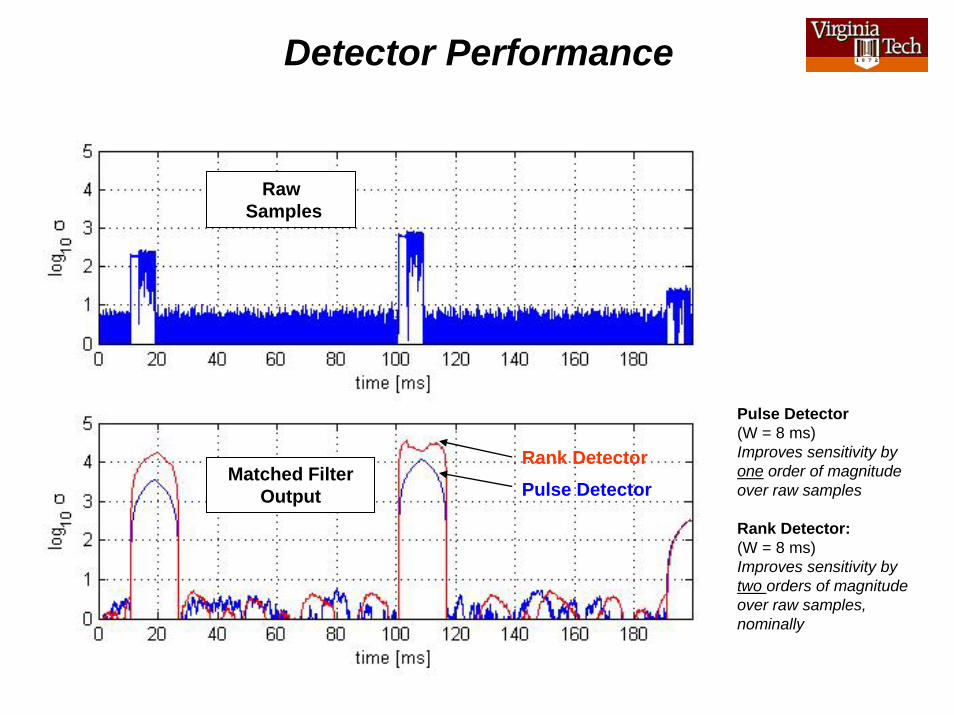
Detector Performance
Pulse Detector(W = 8 ms)Improves sensitivity by one order of magnitude over raw samples
Rank Detector:(W = 8 ms)Improves sensitivity by two orders of magnitudeover raw samples, nominally
RawSamples
Matched Filter Output
Rank DetectorPulse Detector

Pulse Detection + Blanking
Blue: N=24 Zenith beamRed: N= 1 (Spiral element)(Arbitrary offset for clarity)
Top: RFI mit offBottom: RFI mit on
Detector:Total power pulseW = 8 msβ = 10σ at PMF output
Blanker:Blank 56 ms windowStart 16 ms before trigger~ 20% of data is blanked
PSD calculation:∆ν = 100 Hz∆t = 10 msτ = 58.3 s
(compare2 m)
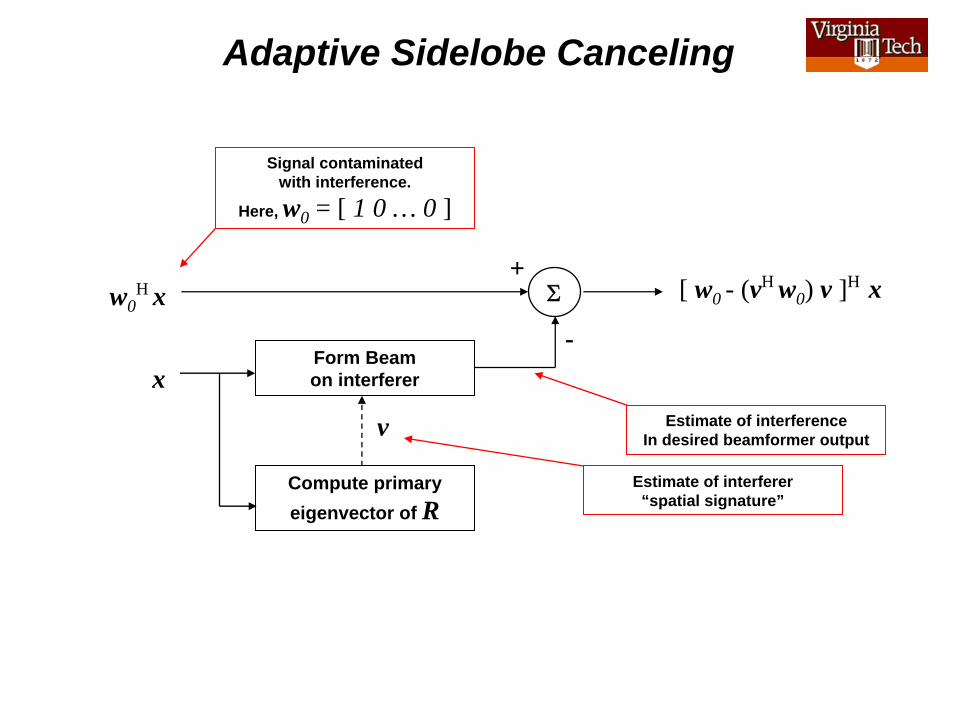
Adaptive Sidelobe Canceling
Signal contaminated with interference.
Here, w0 = [ 1 0 … 0 ]
Form Beam on interferer x
Compute primary eigenvector of R
v
Σ
-
+[ w0 - (vH w0) v ]H xw0
H x
Estimate of interferenceIn desired beamformer output
Estimate of interferer“spatial signature”
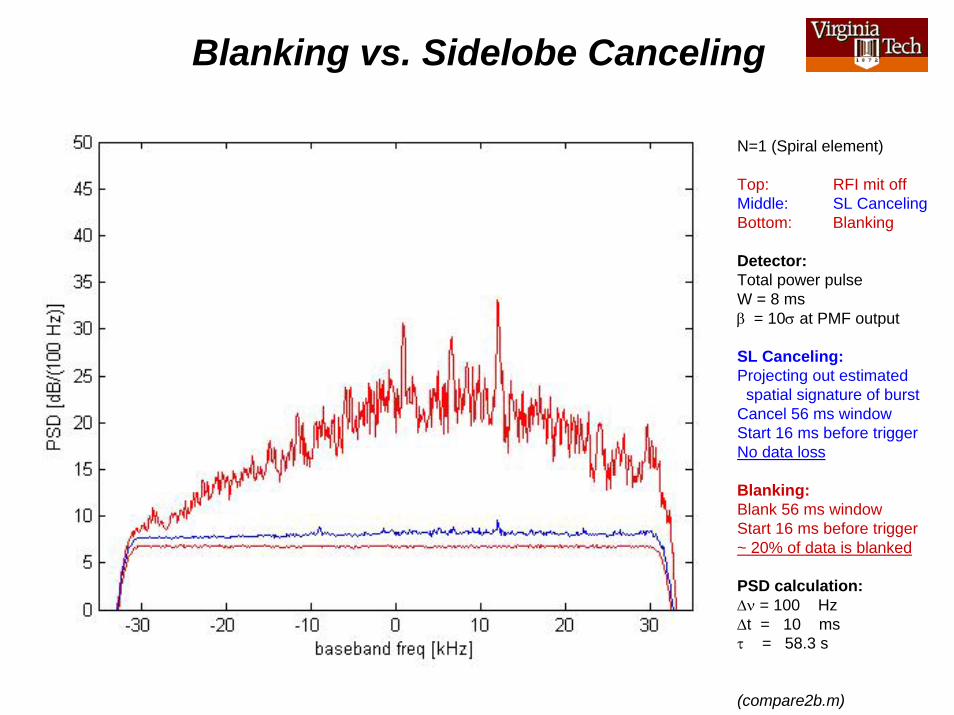
Blanking vs. Sidelobe Canceling
N=1 (Spiral element)
Top: RFI mit offMiddle: SL CancelingBottom: Blanking
Detector:Total power pulseW = 8 msβ = 10σ at PMF output
SL Canceling:Projecting out estimated
spatial signature of burstCancel 56 ms windowStart 16 ms before triggerNo data loss
Blanking:Blank 56 ms windowStart 16 ms before trigger~ 20% of data is blanked
PSD calculation:∆ν = 100 Hz∆t = 10 msτ = 58.3 s
(compare2b.m)

Blanking vs. Sidelobe Canceling
N=1 (Spiral element)
Top: RFI mit offMiddle: SL CancelingBottom: Blanking
Detector:Total power pulseW = 8 msβ = 10σ at PMF output
SL Canceling:Projecting out estimated
spatial signature of burstCancel 56 ms windowStart 16 ms before triggerNo data loss
Blanking:Blank 56 ms windowStart 16 ms before trigger~ 20% of data is blanked
PSD calculation:∆ν = 100 Hz∆t = 10 msτ= 58.3 s
(compare2b.m)
Error in estimation of interferer steering vector limits effectiveness of
sidelobe canceling to about 30 dB
Concluding Remarks
Details of Iridium downlink at 1624 MHz has been presented
Outlook for effective mitigation:– Transients: Pretty good.– Spectroscopy: Pretty good for integration times < 1 min; otherwise TBD.
Detection Techniques– Pulse detection: Simple– Rank detection: More complicated, but more sensitive– In practice (e.g., see [3]), this is usually the limiting factor
Removal Techniques– Blanking; simple & effective; however data loss and gaps– Sidelobe canceling: A little more complicated and less effective, but no data loss
or gaps– Best choice depends on application (e.g., spectroscopy vs. transients)
References / More Information[1] Argus web site: http://www.vt.edu/~swe/argus[2] Ellingson & Hampson 2002, IEEE Trans. Ant. & Prop., 50, 25[3] Ellingson & Hampson 2003, ApJS, 147, 167