IR566 - Kakadu National Park Landscape Symposia Series ... · S Atkins & Winderlich S (ed) 2010....
157
internal report 566 Kakadu National Park Landscape Symposia Series 2007–2009. Symposium 3: Fire management, 23–24 April 2008 Atkins S & Winderlich S (eds) February 2010 (Release status - unrestricted)
Transcript of IR566 - Kakadu National Park Landscape Symposia Series ... · S Atkins & Winderlich S (ed) 2010....
in t e rna l
r epor t 566Kakadu National Park
Landscape Symposia
Series 2007–2009.
Symposium 3: Fire
management,
23–24 April 2008
Atkins S & Winderlich S (eds)
February 2010
(Release status - unrestricted)


Kakadu National Park Landscape Symposia Series 2007–2009
Symposium 3: Fire management 23–24 April 2008, Aurora Kakadu (South
Alligator) (formerly South Alligator Motor Inn), Kakadu National Park
Edited by S Atkins1 & S Winderlich1
1 Kakadu National Park, Parks Operations and Tourism Branch
Published by
Supervising Scientist Division
GPO Box 461, Darwin NT 0801
February 2010
Registry File SG2009/0281
(Release status – unrestricted)
How to cite this report:
S Atkins & Winderlich S (ed) 2010. Kakadu National Park Landscape Symposia Series 2007–2009. Symposium 3: Fire management, 23–24 April 2008, Aurora Kakadu (South Alligator), Kakadu National Park. Internal Report 566, February, Supervising Scientist, Darwin.
How to cite papers in this report – example:
Sutton S 2010. Northern Territory perspective. In Kakadu National Park Landscape Symposia Series 2007–2009. Symposium 3: Fire management, 23–24 April 2008, Aurora Kakadu (South Alligator), Kakadu National Park. Internal Report 566, February, Supervising Scientist, Darwin. Unpublished paper, 14–18.
Location of final PDF file in SSD Explorer:
\Publications Work\Publications and other productions\Internal Reports (IRs)\Nos 500 to 599\
Editors of this report:
Sally-Anne Atkins – Kakadu National Park, Parks Operations and Tourism Branch, PO Box 71, Jabiru NT 0886, Australia
Steve Winderlich – Kakadu National Park, Parks Operations and Tourism Branch, PO Box 71, Jabiru NT 0886, Australia
The Supervising Scientist is part of the Australian Government Department of the Environment, Water, Heritage and the Arts.
© Commonwealth of Australia 2010
Supervising Scientist Department of the Environment, Water, Heritage and the Arts GPO Box 461, Darwin NT 0801 Australia
This work is copyright. Apart from any use as permitted under the Copyright Act 1968, no part may be reproduced by any process without prior written permission from the Supervising Scientist. Requests and inquiries concerning reproduction and rights should be addressed to Publications Inquiries, Supervising Scientist, GPO Box 461, Darwin NT 0801.
e-mail: [email protected]
Internet: www.environment.gov.au/ssd (www.environment.gov.au/ssd/publications)
The views and opinions expressed in this report do not necessarily reflect those of the Commonwealth of Australia. While reasonable efforts have been made to ensure that the contents of this report are factually correct, some essential data rely on the references cited and the Supervising Scientist and the Commonwealth of Australia do not accept responsibility for the accuracy, currency or completeness of the contents of this report, and shall not be liable for any loss or damage that may be occasioned directly or indirectly through the use of, or reliance on, the report. Readers should exercise their own skill and judgment with respect to their use of the material contained in this report.
Printed and bound in Darwin NT by Supervising Scientist Division

Contents
List of participants v
Acknowledgments vi
Introduction 1
Part 1 Overview of fire management 3
Introduction 3
1.1 Kakadu Traditional Owner and stakeholder views on fire management 4
S Winderlich 4
1.2 Northern Territory perspective 14
S Sutton 14
Part 2 Fire monitoring 19
Introduction 19
2.1 Fire and biodiversity monitoring for conservation managers: a 10 year assessment of the ‘Three Parks’ (Kakadu, Litchfield & Nitmiluk) program 20
J Russell-Smith, AC Edwards, JCZ Woinarski, J McCartney, S Kerin, S Winderlich, BP Murphy & F Watt 20
Part 3 Savanna woodland 48
Introduction 48
3.1 Savanna tree growth, recruitment and mortality in relation to fire frequency and severity 49
L Prior 49
3.2 Fire and vegetation dynamics of Kakadu savannas 54
CER Lehmann 54
3.3 Woodland burning – workshop outcomes 61
M Ibbett 61
Part 4 Floodplain fire management 63
Introduction 63
4.1 Representing Indigenous wetland ecological knowledge in a Bayesian Belief Network 64
AC Liedloff, P Christophersen , S McGregor & B McKaige 64 ,
4.2 Yellow Water and Red Lily wetland burning 73
iii

iv
V Lawson, M Jambrecina & S Atkins 73
4.3 Using fire to manage para grass in wetlands: a Queensland case study 80
T Grice, M Nicholas, P Williams & E Collins 80 ,
4.4 Floodplain burning workshop outcomes 91
S Atkins 91
Part 5 Stone country fire management 94
Introduction 94
5.1 An aerial assessment of the incidence of fire in rocky (and associated) environments in Kakadu National Park during the 2006 dry season 95
K Brennan 95
5.2 Development of stone country fire management plan 109
A Petty 109
5.3 Implementation of stone country fire management plan 110
A Pickworth 110
5.4 West Arnhem Land fire management 131
P Cooke & J Russell-Smith 131
5.5 Stone country fire management workshop outcomes 134
S Atkins 134
Part 6 Wet season burning 138
Introduction 138
6.1 Using wet season burning for fuel management 139
J Russell-Smith 139
Part 7 Impact of fire on native fauna 142
Introduction 142
7.1 Fire and fauna 143
J Woinarski 143
7.2 Impact of fire regimes on Leichhardt’s grasshoppers 147
P Barrow 147
List of participants
Name Group
Addison Jane EWLS
Alderson Jessie Kakadu Board of Management, Traditional Owner
Anderson Steve Ranger, Kakadu National Park
Anderson Mark Northern Territory Parks
Atkins Sally-Anne Project Officer, Kakadu National Park
Barrow Piers NRETAS – Weeds Branch
Billington Meredith Senior Project Officer, Kakadu National Park
Boyden James Environmental Research Institute of the Supervising Scientist
Brennan Kym NRETAS – Biodiversity
Cahill Paddy Ranger, Kakadu National Park
Cawood Paul NRETAS – Parks
Christophersen Carol NLC Parks Officer
Cochrane Peter Director, Kakadu National Park
Cooke Peter WALFA
Davis Andrew Ranger, Nitmiluk National Park
Dunn Matthew Ranger, Kakadu National Park
Firth Ron EWLS
Ford Lazarus Kakadu resident
Franklin Don Charles Darwin University
Gorman James NRETAS – Parks
Grice Tony CSIRO
Guynla James
Hartley Dal NRETAS – Parks
Hatt Michelle Ranger, Kakadu National Park
Hill Terry Ranger, Kakadu National Park
Hooke Amber EWLS
Jambrecina Mim Senior Project Officer, Kakadu National Park
Kenyon Graham Ranger, Djiukbinj National Park
Kepui James ERA, Ranger Mine
Kerin Sarah Park Manager, Kakadu National Park
Kyle Geoff Gundjeihmi Aboriginal Corporation
Lawson Violet Traditional Owner
Lehman Caroline Charles Darwin University
Leidloff Adam CSIRO
Lindner Dave Kakadu resident
Mabin Peter Ranger, Kakadu National Park
Mahney Terry Senior Project Officer, Kakadu National Park
McCartney John Ranger, Litchfield National Park
McConnell Ian
v

vi
Name Group
Muller Rob Ranger, Kakadu National Park
Nayinggul Jacob Kakadu Board of Management, Traditional Owner
Nou Tida Project Officer, Kakadu National Park
O’Dea Anne Ranger, Kakadu National Park
O’Loughlin Gabrielle Kakadu National Park
Petty Aaron Charles Darwin University
Pickworth Anna Ranger, Kakadu National Park
Prior Lynda Charles Darwin University
Russell-Smith Jeremy Bushfires Council NT, NRETAS, KRAC
Salau Buck Ranger, Kakadu National Park
Scheibe Ollie Ranger, Kakadu National Park
Scott Barry NRETAS – Parks
Shaughnessy Patrick Ranger, Kakadu National Park
Sutton Steve Bushfires Council NT, NRETAS
Trembath Julie NRETAS – Parks
Watt Felicity NRETAS -–Bushfires Council NT
Weigl Jacob NRETAS – Parks
Wellings Andrew Ranger, Kakadu National Park
West David NRETAS – Parks
Weir Ray Jawoyn Aboriginal Association
Wilson Kathy Ranger, Kakadu National Park
Wilson Lincoln NRETAS – Parks
Winderlich Steve Manager, Natural and Cultural Programs, Kakadu National Park
Woinarski John NRETAS – Biodiversity
Wood Andrew NRETAS – Parks
Worle Stewart NRETAS – Parks
Yirbarbuk Dean WALFA
Shirley
Acknowledgments
The success of the Fire Management Symposium was due in no small part to efforts of the symposium steering committee and staff from the Natural and Cultural Programs Section of Kakadu National Park, in particular Sally-Anne Atkins and Tida Nou. The symposium steering committee made up of Steve Winderlich (Kakadu National Park), Sally-Anne Atkins (Kakadu National Park), Caroline Lehman (Charles Darwin University), Aaron Petty (Charles Darwin University), Peter Cooke (West Arnhem Land Fire Abatement Project) and Steve Sutton (Bushfires Council NT) provided essential expertise and input. They are all very busy people who gave generously of their time which is greatly appreciated. Thanks also to Michelle Hatt and Michelle Ibbett (Kakadu National Park) for assisting with the compilation of proceedings and Ann Webb (Supervising Scientist Division) who prepared the proceedings for publication.

Introduction
The Kakadu National Park Fire Management Symposium and Workshop is the third in a series of symposia and workshops held by Kakadu to focus on the agents of landscape change.
The aim of the symposiums and workshops is; through the effective transfer of knowledge between stakeholders in the Kakadu region management issues, emerging threats, knowledge gaps and research priorities related to fire management on a local, regional and national scale can be identified and discussed.
The symposium was held at the Aurora Kakadu – South Alligator, Kakadu National Park, on 23–24 April 2008.
Over sixty participants from a wide range of stake holders including government agencies, traditional owners, indigenous associations, local private industry, academic and research institutions were represented at the symposium.
Kakadu National Park is moving towards developing fire plans based on a landscape or ecological unit basis rather than the current geographical (district) based model. The Park completed the first of these landscape based fire plans in 2007 focusing on the stone country – Arnhemland Plateau Fire Management Plan (2007). One of the objectives of this forum was to gather information for input into the development of other landscape based fire plans, including one for the floodplain, woodland and riparian areas within Kakadu National Park.
Based on this, presentations and workshops were focused on each of the landscape units. The topics presented provided an overview of the current fire management within Kakadu, current monitoring programs and presentations on fire related specifically to different landscapes types including floodplain, stone country and woodland ecosystems. Presenters aimed at reviewing the major treats of fire to the different landscape types, presented results from current research, discussed management implications and the incorporation of this information in to the parks plans and strategies.
Topics presented at the symposium included:
Local and regional perspectives on fire management
Savanna tree growth, recruitment and mortality in relation to fire
Fire and vegetation dynamics of Kakadu savannas
Flood plain burning projects from both an indigenous and scientific perspective
The development and implementation of the Kakadu Stone Country Burning Plan
Wet season burning
The impact of fire on fauna
Workshops were held on the following topics:
Woodland burning
Floodplain burning
Stone Country burning
Kakadu National Park is currently in the process of developing the floodplain fire management plan, incorporating knowledge and outcomes from this symposium and
1

2
workshops. It is anticipated that the knowledge and outcomes on savanna, riparian and woodland landscapes and the effect of fire on these areas will be included in the fire plans on there respective landscape units if the near future.
Sally-Anne Atkins
Project Officer – Planning and Knowledge Management Natural and Cultural Programs Kakadu National Park Parks Operations and Tourism Branch
Part 1 Overview of fire management
Introduction
Fire management plays an important role in northern Australia; it is a complicated and contested activity. Over the past two decades there has been extensive research on fire ecology, fire regimes and burning practices; much of this has been undertaken within Kakadu National Park.
Within Kakadu National Park there are a number of stakeholders actively involved with fire management activities including: traditional owners, bininj, managers, park staff, Bushfires NT and various research organisations. In this chapter the perspectives of the major ‘players in fire management within the park are presented.
3

1.1 Kakadu Traditional Owner and stakeholder views on fire management
S Winderlich1
1.1.1 Introduction
The purpose of the presentation at the Fire Management Workshop and this subsequent paper was to focus symposium participants on what a selection of Kakadu National Park’s (KNP) Traditional Owners thought and felt about the management of fire in the Park. In so doing it was hoped that through all the subsequent presentations and workshops participants would use this information to consider how best to respond to the issues raised by the stakeholders and best inform the management of KNP.
Any management action in KNP needs to be consistent with the relevant legislation and the Plan of Management(2007–2014). Hence this paper also summarises the sections of the Kakadu Plan of Management that relate to fire management. Extensive consultation with Traditional Owners was undertaken in the development of this plan so it reflects the views of a wide cross section of the Park’s Traditional Owners.
This paper commences with a historical perspective on fire management in KNP, and summarises the views of a broad range of stakeholders as expressed at the Landscape Change Symposium, which was the first in this series of symposia. Additional coverage of the views of local indigenous people can be found in the papers submitted by Violet Lawson and Adam Liedloff in these proceedings.
1.1.2 Historical perspective
This is not a detailed historical account, it is a broad summary of several distinct eras of fire management in Kakadu that show some of the major trends and changes in approach over time.
In a very simplistic way fire management in the park has the following epochs:
Pre balanda ( Pre European)
The pastoral influence
Declaration of the park
Early 1990s
The present
1.1.2.1 Pre balanda
Before the arrival of Europeans, Bininj/Mungguy managed their country and fire was a major tool. They lit small fires all year round, although mostly in the early dry season. Fires lit by Bininj/Mungguy as they travelled through different areas created a mosaic of burnt and unburnt land (Lawrence 2000, 122, 220). This created suitable habitats for a range of different
1 Natural and Cultural Programs Manager Kakadu National Park
4

plants and animals, and, in so doing, a certain type of biodiversity was sustained. It also protected the land from very hot, late dry season wildfires.
Fires were lit for many reasons (Press et al 1995, 220–221):
to make traveling easier
to flush out animals when hunting
to clear around campsites
to protect food sources from later fires
to signal to others
to meet spiritual and cultural obligations
This earth, I never damage.
I look after. Fire is nothing, just clean up.
When you burn, new grass coming up.
That means good animal soon,
Might be goanna, possum, wallaby.
Burn him off, new grass coming up, new life all over.
Bill Neidjie, Aboriginal Traditional Owner (Neidjie et al 1986)
With the arrival of Europeans into the Kakadu region, the Bininj/Mungguy population decreased due a combination of reasons including the impact of new diseases and as people moved off their land either by choice or forcibly to go to reserves, missions, towns, and settlements (Lawrence 2000, Press et al 1995).
With fewer people on the land, less mosaic burning took place. As a result hot, large, destructive dry season wildfires became more common.
1.1.2.2 The pastoral influence
With the introduction of pastoralism fires were lit more often on floodplains and adjacent lowlands which were areas preferred by water buffalo. Fires were also lit later in the season in conjunction with mustering operations. This resulted in an increases in larger and hotter dry season fires (Press et al 1995, 222).
1.1.2.3 Declaration of the park
Since Kakadu became a jointly managed national park, Bininj/Mungguy and Park Staff have worked together to incorporate traditional burning practices into standard park management practice. The intention was to introduce a mosaic burning regime similar to the traditional burning practices of Bininj/Mungguy people in the past which is generally agreed to be the best way to look after country in accordance with the aims set out in the Park’s Plan of Management, and reduces the risk of large late season fires.
During the period from the declaration of the park in its various stages through to the early 1990’s considerable progress was made in fire management. In particular the high incidence of late dry season fires through the 1980s was progressively decreased through the use of early dry season burning (Press et al 1995, 223).
5

1.1.2.4 The early 1990s
Despite some of the gains in fire management made up until the early 1990s, there were still areas where improvement was necessary. There were still too many large hot late dry season fires which were impacting on fire sensitive plant communities, particularly on the stone country. The burning program was focussed on a small window of time and the aerial burning program exclusively used fixed wing aircraft that did not allow much flexibility in targeting specific areas.
Typically the aerial burning period was restricted to a matter of weeks which made it difficult to choose an optimum time for the whole park and invariably burning occurred when some areas were still too wet and, therefore, burns were not effective. Conversely when some areas were too dry the fires were too hot.
In the early 1990s a meeting between key Traditional Owners, Park Staff and researchers was held to evaluate KNP’s approach to fire management and look for ways to improve it. An action plan was developed that set out the following:
Resources for fire management were increased.
The Park shifted from incendiary burning from fixed wing aircraft to the use of helicopters allowing more directional fire management.
The burning program moved from a small intense window of time, to a year round program with an emphasis on burning in the early dry season.
As a result of this new approach Kakadu more than anywhere in Northern Australia set out and was successful in changing a fire regime. The fire regime was shifted to one of more burning in the early dry with low intensity fire, and away from late hot or high intensity fires. There was an overall increase in patchiness or (heterogeneity) of burns over this period which is important for the health of the country (Price et al 2005).
More targeted Research and monitoring was planned and implemented over this period, in particular the very successful and long running fire plot monitoring program.
1.1.2.5 The present
While the park has made considerable progress in its broad scale fire management there is still plenty of room for improvement, particularly in the stone country with large hot late season fires occurring over most of this landscape in 2004 and 2006.
The fire frequency is still too high, particularly in sensitive areas such as the heaths.
There is increasing competition for park operational resources, particularly in the early dry season when fire management needs compete with visitor management such as the need to open important tourist destinations such as Jim Jim and Twin Falls.
In response to the 2004 and 2006 fires, the Park moved to a more strategic fire management system and started developing a Landscape Unit Based approach to fire management rather than simply geographic area per se. The Stone Country Fire Plan is the first of these plans to be developed and implemented.
The park is making better use also of GIS and mapping technology to monitor and plan its fire management, and has introduced new technology such as Arc Pads and Raindance incendiary devices.
6

There has also been an increased emphasis on working cooperatively with neighbours, particularly indigenous land management groups, to develop an approach to fire management that cuts across different land tenures.
Research and monitoring remain a high priority, particularly continuing with the Fire Plot Monitoring the methodology of which is now used in Nitmiluk and Litchfield Parks. A paper in these proceedings discusses the analysis of 10 years worth of fire plot data across the three parks that emphasises the value of this program.
One area that the park now needs to turn its attention to is looking the finer detail such as determining the most appropriate fire intervals for different vegetation types, and building in known nesting, fruiting and breeding times of a range of plant and animal species.
1.1.3 What do the Traditional Owners say?
1.1.3.1 Methods
Questionnaires were prepared that asked Traditional Owners to respond to several key questions relating to fire management. The questionnaires were used as the basis for ‘one-on-one’ interviews with Traditional owners. Fifteen interviews were carried out in Kakadu by park staff in April 2008. The responses were later summarised in a presentation and this paper. Traditional Owners’ views expressed at the Landscape Change Symposium (the first in this series of symposia) have also been incorporated.
This paper does not attempt to analyse survey responses or to cross reference it with other literature and surveys undertaken else where. There is also no attempt to present any of the results as being truly representative of the broader population of the Kakadu area because the sample size is too small. However, results do outline some key issues and concerns from Traditional Owners that are relevant to any discussion on the issue of fire management.
1.1.3.2 How would you like to be involved in managing fire in Kakadu?
Would like to be involved in all aspects of fire management from planning to doing the burning
Want to be involved in burning with rangers in joint management arrangement either as rangers, day labourers or on contract
1.1.3.3 What are the good things about fire management in Kakadu?
Early burning to keep fuel down and prevent late fires
Wet season burning
Protecting outstations
Clearing the country for hunting and protecting trees and animals
The way the park and TOs work together
1.1.3.4 How do you think we can look after fire in Kakadu better?
More Bininj involvement in all areas of burning particularly involving more young people
More funding for helicopters and involving young Bininj
7
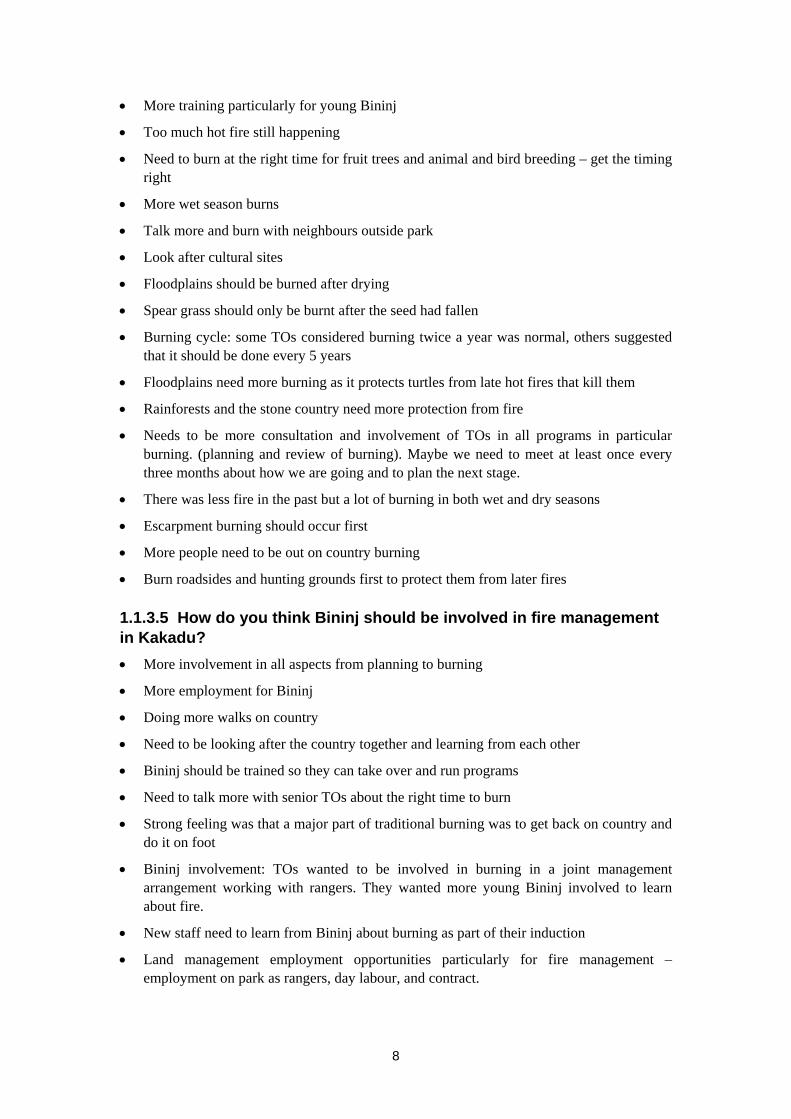
More training particularly for young Bininj
Too much hot fire still happening
Need to burn at the right time for fruit trees and animal and bird breeding – get the timing right
More wet season burns
Talk more and burn with neighbours outside park
Look after cultural sites
Floodplains should be burned after drying
Spear grass should only be burnt after the seed had fallen
Burning cycle: some TOs considered burning twice a year was normal, others suggested that it should be done every 5 years
Floodplains need more burning as it protects turtles from late hot fires that kill them
Rainforests and the stone country need more protection from fire
Needs to be more consultation and involvement of TOs in all programs in particular burning. (planning and review of burning). Maybe we need to meet at least once every three months about how we are going and to plan the next stage.
There was less fire in the past but a lot of burning in both wet and dry seasons
Escarpment burning should occur first
More people need to be out on country burning
Burn roadsides and hunting grounds first to protect them from later fires
1.1.3.5 How do you think Bininj should be involved in fire management in Kakadu?
More involvement in all aspects from planning to burning
More employment for Bininj
Doing more walks on country
Need to be looking after the country together and learning from each other
Bininj should be trained so they can take over and run programs
Need to talk more with senior TOs about the right time to burn
Strong feeling was that a major part of traditional burning was to get back on country and do it on foot
Bininj involvement: TOs wanted to be involved in burning in a joint management arrangement working with rangers. They wanted more young Bininj involved to learn about fire.
New staff need to learn from Bininj about burning as part of their induction
Land management employment opportunities particularly for fire management – employment on park as rangers, day labour, and contract.
8
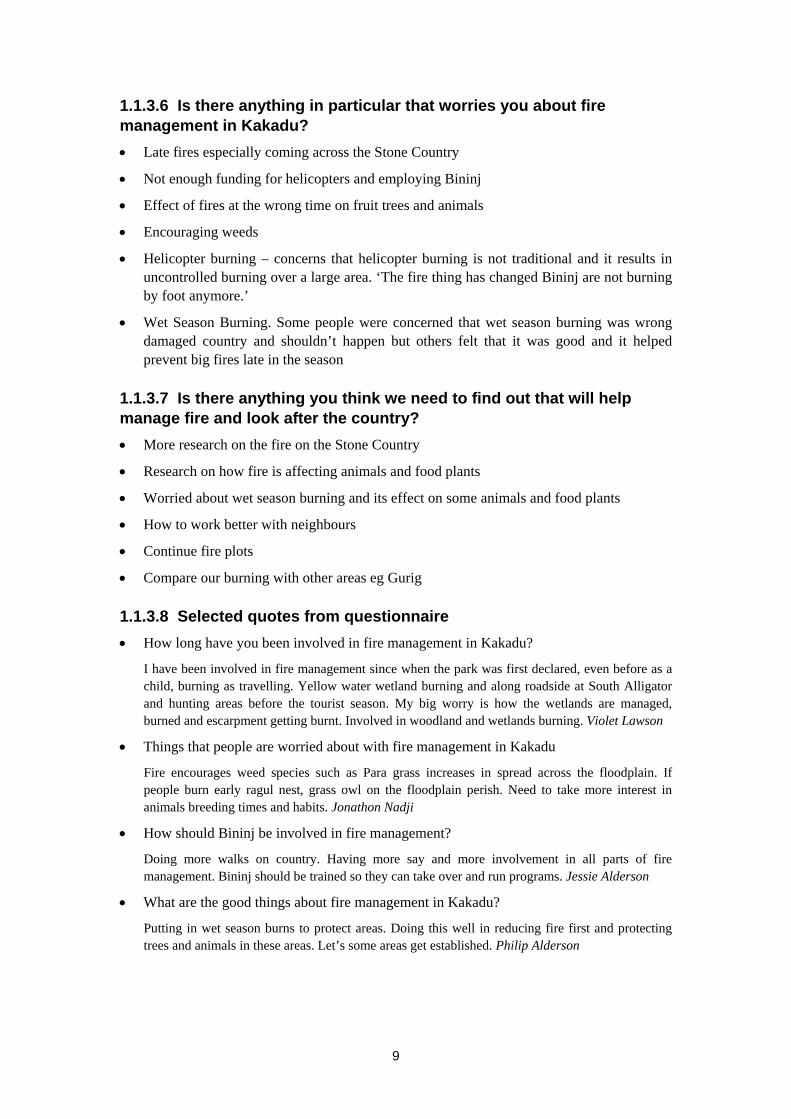
1.1.3.6 Is there anything in particular that worries you about fire management in Kakadu?
Late fires especially coming across the Stone Country
Not enough funding for helicopters and employing Bininj
Effect of fires at the wrong time on fruit trees and animals
Encouraging weeds
Helicopter burning – concerns that helicopter burning is not traditional and it results in uncontrolled burning over a large area. ‘The fire thing has changed Bininj are not burning by foot anymore.’
Wet Season Burning. Some people were concerned that wet season burning was wrong damaged country and shouldn’t happen but others felt that it was good and it helped prevent big fires late in the season
1.1.3.7 Is there anything you think we need to find out that will help manage fire and look after the country?
More research on the fire on the Stone Country
Research on how fire is affecting animals and food plants
Worried about wet season burning and its effect on some animals and food plants
How to work better with neighbours
Continue fire plots
Compare our burning with other areas eg Gurig
1.1.3.8 Selected quotes from questionnaire
How long have you been involved in fire management in Kakadu?
I have been involved in fire management since when the park was first declared, even before as a child, burning as travelling. Yellow water wetland burning and along roadside at South Alligator and hunting areas before the tourist season. My big worry is how the wetlands are managed, burned and escarpment getting burnt. Involved in woodland and wetlands burning. Violet Lawson
Things that people are worried about with fire management in Kakadu
Fire encourages weed species such as Para grass increases in spread across the floodplain. If people burn early ragul nest, grass owl on the floodplain perish. Need to take more interest in animals breeding times and habits. Jonathon Nadji
How should Bininj be involved in fire management?
Doing more walks on country. Having more say and more involvement in all parts of fire management. Bininj should be trained so they can take over and run programs. Jessie Alderson
What are the good things about fire management in Kakadu?
Putting in wet season burns to protect areas. Doing this well in reducing fire first and protecting trees and animals in these areas. Let’s some areas get established. Philip Alderson
9

1.1.4 What do our colleagues, neighbours, stakeholders say (taken from unpublished workshop outcomes of the Landscape Change Symposium held in April 2007)
1.1.4.1 Key management challenges and solutions
Sandstone area very important (endemic and threatened species, source of fire invasion) it should be managed in and out of park (goes from Arnhem Land to Nitmiluk)
Cooperation and sharing with neighbours and partners is critical (planning, working, research)
Need to reduce fire frequency
Fire management strategies need to consider requirements of threatened species with measurable targets
Pick manageable and representative areas of the park and manage more intensely as test cases
Monitoring programs in place to be able to demonstrate trends and react appropriately if problems are identified
Maximise efficiency of existing monitoring
Have a long-term commitment to monitoring.
Assess and trial different ways of doing fire management eg contract employment, more on ground burning (less helicopter and when and where to use choppers) focussing on rare and threatened species as a priority
Includes trialling and assessing different fire suppression techniques
Better interpretation and communication of the fire story
1.1.4.2 Key management challenges and solutions
Management of unauthorised burning particularly late in the year
People doing the burning need to be properly trained in all aspects (ground burning and aerial burning) before they start burning. (this includes proper induction from TOs, and safety aspects)
Working with neighbours across the region
How to deal with changing fire regimes due to weed species
1.1.4.3 Priority knowledge gaps
Historical status of the KNP landscape – have we shifted the system through management practices ( for example has the distribution of Sorghum changed)?
Wet season burning practices and implementation – advantages/disadvantages? (geophytes, fauna and erosion response)
Better define patchiness it can be at different spatial scales. There are lots of things such as timing and intensity which have different effects for different types of vegetation and fauna.
10

Strategic review of burning practices including chopper burning practices, use of contractors to do on ground burning (cost benefit analysis)
Knowledge capture, transfer and consolidation of available data (knowledge sharing)
Identifying continuous sources of problem fires and how to deal with them.
Asses the success of current burning practices in preventing external fires
Investigate burning thresholds (desirable frequency) for vegetation and species of conservation significance
Model fire regimes under a range of future scenarios and cost effectiveness
The use of SILO/WATL (BOM) to help predict windiness
Map based fire planning to identify hot spots and sensitive areas that need to be protected
1.1.5 What does the Kakadu National Park Management Plan (Director of Parks 2007) say about fire management?
1.1.5.1 Policies (Section 5.7)
We will recognise traditional burning practices & put them in fire management programs where possible (5.7.1)
Fire management needs to be carried out strategically on a long term basis. Strategies for districts or other areas will include decisions made by Traditional Owners for that area. Strategies need to:
– have specific cultural and biodiversity aims identified by Bininj and Parks staff
– set targets for the extent and timing of burning for each type of vegetation, specially fire – sensitive communities
– try to prevent unplanned fires, specially intense, late Dry Season fires in sensitive vegetation
– include traditional way for burning country
– include emergency response and protect all Parks assets
– consider biodiversity values around assets and see if burning them can be avoided
– line up with the Management Plan
– be revised regularly and include Bininj input (5.7.2)
Each district will have an annual burning programs based on the District Fire Plan. The plans must be regularly reviewed by Parks staff & Bininj (5.7.3).
Parks may help adjoining landowners with hazard reduction & other burns, & will participate in regional forums (5.7.4).
Nominated Traditional Owners will continue to be on the West Arnhem Bushfire Committee (5.7.5).
Fire management in Kakadu NP will be in line with the Bushfires Act (NT) as much as possible. This may include permits for fire management (5.7.6).
11

1.1.5.2 ACTIONS (Section 5.7)
Prepare park-wide strategies for fire management which are :
– based on landscape units
– prepared with cultural, scientific & operational input (5.7.7)
Prepare annual burning plans for each district (5.7.7)
Record fire data and use GIS analysis (5.7.8)
Work with Bushfires Council & adjoining landholders (5.7.9)
Monitor fire and its effects and use this information for managing fire (5.7.10)
Keep learning about how weeds and fire interact (5.7.11)
Train Park staff for proper fire management (5.7.12)
Provide information on fire management for tour operators & visitors (5.7.13)
Involve Bininj in all aspects of fire management (5.7.14)
1.1.6 Conclusion
This paper illustrates that Kakadu National Park is doing a good job in relation to fire management but that there is always room for fine tuning and improvement.
There is still universal concern regarding the level of hot late dry season fires, particularly in the stone country. The Parks response to this issue in developing and implementing landscape unit based fire plans is seen as a step in the right direction, although the effectiveness of this approach needs to be monitored and evaluated against agreed performance criteria or benchmarks.
Major questions remain in the areas of appropriate fire intervals and thresholds for different vegetation types, the use of helicopters, wet season burning, and the management of threatened species . Whether fire has a role in the current small mammal decline is also a key knowledge gap . The park needs to continue its emphasis with working with neighbours and conducting targeted research and monitoring, particularly continuing with the long standing fire plot monitoring . Responses from stakeholders show that there needs to be an increase in the level of public awareness in relation to fire. It is a challenge for us to provide clear information on fire management to the general public so appropriate educational and interpretive programs need to be implemented.
Responses from the Traditional Owners indicate that while they are generally happy with fire management in Kakadu, they also see areas for continual improvement. Traditional Owners have expressed the desire to be even more involved in all aspects of fire management and, in particular, would like their children to become more involved and to build their capacity in this area to enhance ownership of this valuable part of their culture.
There is a diverse range of views and expertise that exists in relation to fire management and it is clear that there is no one size fits all approach to this complex issue. The responses from Traditional Owners on issues such as the use of helicopters and wet season burning are a good example where quite divergent views are held.
12
13
We are dealing with changing landscape and that our approach needs to be dynamic and flexible to address new challenges such as weeds and climate change and the influence they will have on fire management in KNP.
The current management plan for Kakadu National Park (Director of National Parks 2007) recognises the importance of fire in the management of the Kakadu landscape. Fire can have a major impact on the environment and biodiversity of Kakadu, as well as on the lives and lifestyles of the Traditional Owners. It incorporates many of the concerns expressed by the Traditional Owners and sets out a framework to work closely with the Traditional Owners in planning and implementing fire management programs.
Acknowledgments
I thank Dr Peter Bayliss for reviewing this paper. Thanks also to the Traditional Owners of Kakadu for participating in the surveys.
References
Director of National Parks 2007. Kakadu National Park Plan of Management Plan 2007–2014. Australian Government.
Walden D & Nou S (eds) 2008. Kakadu National Park Landscape Symposia Series 2007–2009. Symposium 1: Landscape Change Overview, 17–18 April 2007, South Alligator Inn, Kakadu National Park. Internal Report 532, April, Supervising Scientist, Darwin.
Lawrence D 2000. Kakadu: The making of a National Park. Melbourne University Press, Melbourne.
Neidjie B, Davis D & Fox A 1986. Australia’s Kakadu Man, Bill Neidjie Resource Managers, Darwin.
Press T, Lea D, Webb A & Graham A (eds) 1995. Kakadu: natural and cultural heritage and management. Australian Nature Conservation Agency, North Australia Research Unit, The Australian National University, Darwin.
Price O, Edwards A, Connors G, Woinarski J, Ryan G, Turner A & Russell-Smith J 2005. Fire heterogeneity in Kakadu National Park, 1980–2000. Wildlife Research 2005, 32, 425–433.
1.2 Northern Territory perspective
S Sutton1
I bet the shelves of the Kakadu National Park library groan with reports of proceedings of workshops just like this. Workshops on everything from weed management to cultural heritage and most particularly and most importantly, fire. There was a fire ecology workshop in 1994; and also in 1994 the symposium on biodiversity and fire in north Australia, the north Australia fire management workshops in 1997 and 1998, the Kapalga workshop in 2000 and so on. It’s a safe bet, because our shelves do also.
So it might be worth asking why bother doing it again? Why have a workshop? Why not just read the reports and act upon them? The workshop participants are arguably among the most ‘sophisticated’ fire managers in Australia. People who have researched, observed and managed fire for decades. People who have applied fire to the landscape in a range of conditions; traditional Owners and non-Aboriginal land managers and researchers who have had the benefit of learning the wisdom and craft of Traditional Owners – many now deceased.
I said most importantly before; advisedly. The importance of fire management National Parks in northern Australia is paramount and should be restated here. There is now a considerable body of research to indicate that from virtually any perspective, north Australian park management regimes need to place a high priority on the management of the local fire regime. These perspectives include community safety, asset protection, biodiversity, water quality, erosion and sediment control, air quality, greenhouse emissions, visual amenity, and the socio-economic objectives of Traditional Owners – ‘healthy country – healthy people’ if you like. Participants in this workshop are well aware of the threads of evidence, aided by their own observations, that support this contention and I won’t tease out the skeins here. But I will encourage participants to spell out these facts to decision makers within their organisations when ever they have an opportunity. This workshop is one such opportunity.
Clearly the roll-up indicates that we share the view that the workshop is a good idea – I don’t think too many participants were compelled to come by their organisations. Perhaps the stepping off point for a consideration of the value of the workshop lies in thinking first about the organisation.
Any organisation I have ever worked for had a deep seated belief that we had the right ideas, were on the right track and were generally speaking ‘the best’. Our rivals, however, and even our colleagues in other similar organisations, were ‘not quite on the money’. As I move from one organisation to another and discuss their operations, attitudes and philosophies I find this fundamental assessment of the world to be almost universal. It appears to be something innate human nature, something that grows from within an organisation as a result of the successful interactions of its members. Strange to say it appears to be the case even where an organisation is struggling, with poor morale or failure to achieve. Members of an organisation that is subject to major financial problems or scandals still tend to feel that, if they could just fix that one problem (the lack of money in some areas or a major scandal) then they would be straight back at the top of the heap (of whatever it is they do). It’s a bit like supporting a football team. I have a friend that supports Collingwood. God knows why. But despite a clear
1 Director, Bushfires NT, Department of Natural Resources, Environment, the Arts and Sport
14

arbitrary mechanism for monitoring if they are any good (the league championship), he remains of the view that they are the finest team in the competition. Their shortcomings through the season are excused. The tears and verbal outpourings of their coach explained away. The dubious advocacy of high profile media personalities justified on some argument ad consequentiam. This unshakeable faith in the primacy of his group brooks no review of the ladder during the current season, observations of only one premiership in 50 years or a last title now 20 years in the past.
So it is with our organisations. We all have some innate tendency (not to support Collingwood – that would be too much) to accept our own ‘party’ as the good guys. There is of course much strength and effectiveness in this approach. Camaraderie and shared belief motivate and catalyse staff to achieve in all organisations from football teams to public servants and ultimately the military. But too much of this self belief becomes self-satisfaction and a failure (like the Magpie supporter) to face facts squarely and find ways to deal with them in a realistic fashion (get a new coach and some new players!).
This self-satisfaction gets in the way of adaptive management and continuous improvement. A core component of building on the past is a clear expression of the failures, great and small that followed our last efforts, last season, to achieve our fire management objectives. We need to tell it like it is. Unfortunately, the development of management by ‘key performance indicator’ within the Australian public sector, however well intentioned, has led to burgeoning annual reports that laud the efforts of hard working staff while never actually getting to the heart of what is really happening on the ground. The WALFA project success is in part due to a program of annual meetings where project participants ‘tell it like it is’ – ‘warts and all’ – allowing everyone to consider what went wrong and how they might do it better next time. In a way the annual fire regime of northern Australia is a bonus because we get to try something different next year – in practice less than six months after the end of the last fire season.
Perhaps an even more problematic result of ‘organisational righteousness’ and the lack of clear self-appraisal is that it tends to reinforce a corollary perception that the ‘others’ aren’t any good and there is little we can learn from them. Now every reader will be bound to agree that there is always something we can learn from others. It is cant. In practice, however, I have observed that there is a reluctance to indulge in learning the wisdom of others as a matter of general practice. This is usually and largely overcome in specific arenas: workshops, seminars, training courses and conferences.
And indeed most of the proceedings of the previous workshops make note of this. Jeremy Russell-Smith in the undated (but quite old given his youthful photograph) ‘Voices from the Landscape’ workshop proceedings states on page 11 that ‘People don’t talk to each other. They take lawsuits out against each other. In the future the legal aspects of controlling fire are just going to go through the roof.’ (emphasis in original). My predecessor Russell Anderson also alerted those attending the North Australia Fire Management Workshop in 1998 that ‘…all of us here at this workshop are emphasising the need to communicate with others to achieve outcomes.’ (p33).
And so, this workshop brings together a group of people, many of whom are known to each other, to communicate with each other. And it’s a timely thing to do. Since the last major workshop there have been many changes. These include changes of perceptions, changes of government, changes of organisational structure, new projects and ‘players’ in the game. There is also change in our research data. Bad change. The sort of change we all hoped we wouldn’t see and which we recognise needs to be addressed. The papers presented at this
15
workshop regarding research showing a crash in the small mammal fauna are very alarming. Despite a program of fire management to conserve faunal biodiversity in one of the nations flagship national parks, we seem to be losing the battle. We need to ensure that we don’t lose the communication battle as well because this is the most important step in motivating efforts to improve our practice and reverse the trend.
Changing perceptions are harder to document given that one’s own are inevitably contextual, but one perception has grown among those outside Kakadu. Like continental drift (not plate tectonics!), there has been a movement of Commonwealth estate away from the Territory. In the past it has often felt as if there was a sea barrier between our respective jurisdictions and that issues of border security come into play when we tried to seek information and coordination of programs on either side of the border. Workshops like these encourage improved relationships across the border and I thank the organisers of this workshop for my generous visa terms.
Of course, these relationships have not been helped by the higher level policy settings of the various governments that have been in power in the Territory and Commonwealth since the establishment of Kakadu. These included a government that seemed to support the notion that it was ‘clapped-out buffalo country’ to another that promised, upon election, to ‘take a sledgehammer to the gates of Kakadu’. It is probably the case that at its nadir governmental relationships regarding Kakadu could be described as unhelpful to good trans-jurisdiction fire management. But even at these times, workshops of fire managers went ahead and officer-level contact was maintained.
Changes in organisations and their structure have also been seen to affect the way management decisions occur on the ground. In Kakadu, a ‘centralised fire command’ has been adapted to a district system with separate sections of the Park managing fire within their bounds. On the one hand this seems to provide autonomy to districts which then consult with local TOs and work flexibly to achieve fire management appropriate to that section of the Park. One the other, it may be the case that coordination of resources around the Park through the fire season is constrained by the respective parochial priority setting of the districts.
True to its nature, fire will not respect the internal boundaries of Kakadu any more than it respects other cadastral boundaries and, ultimately, all fire management problems are a collective responsibility. Within Bushfires NT we recently had the phenomenon of Regional Fire Control Officers getting quite animated with their regional colleagues, accusing them of ‘sending the fire’ to their region. Amalgamation of some of those regions and a developing flexible approach to resource allocation for wildfire suppression has reduced these tensions and made fire management more effective.
One regional change within our organisation has been the establishment of the Arnhem Fire Control Region in 2004, the appointment of a Regional Committee under the Bushfires Act and a Regional Fire Control Officer for Arnhem Land, including Kakadu National Park. The Regional Committee comprises Traditional Owners from different districts within the region, including Kakadu, and has worked steadily to build fire management capacity within the communities of the region and to coordinate their efforts.
The establishment of the Arnhem Fire Control Region was connected to, and driven by, the most significant change to occur in fire management in northern Australia in recent times. The development of a project in western Arnhem Land that relies on fire management for its raison d’être. The West Arnhem Land Fire Abatement project (WALFA) began as an operational entity in 2005 and entered into a contractual arrangement with ConocoPhillips in
16
2006 to generate a greenhouse gas emission abatement by controlling the timing and proportion of fire over a 28 000 km2 area.
Whereas previously Kakadu’s eastern boundary had backed on to land that was largely unmanaged, there now exists a management regime that has a more-than-passing interest in fire management. Whereas once a primary interest in Kakadu might have been the transgression of fire into the Park from the east, there is now a palpable reason to ensure that fire does not enter into WALFA from the west. A trite observation perhaps, but symptomatic of a sea-change in the management of the region.
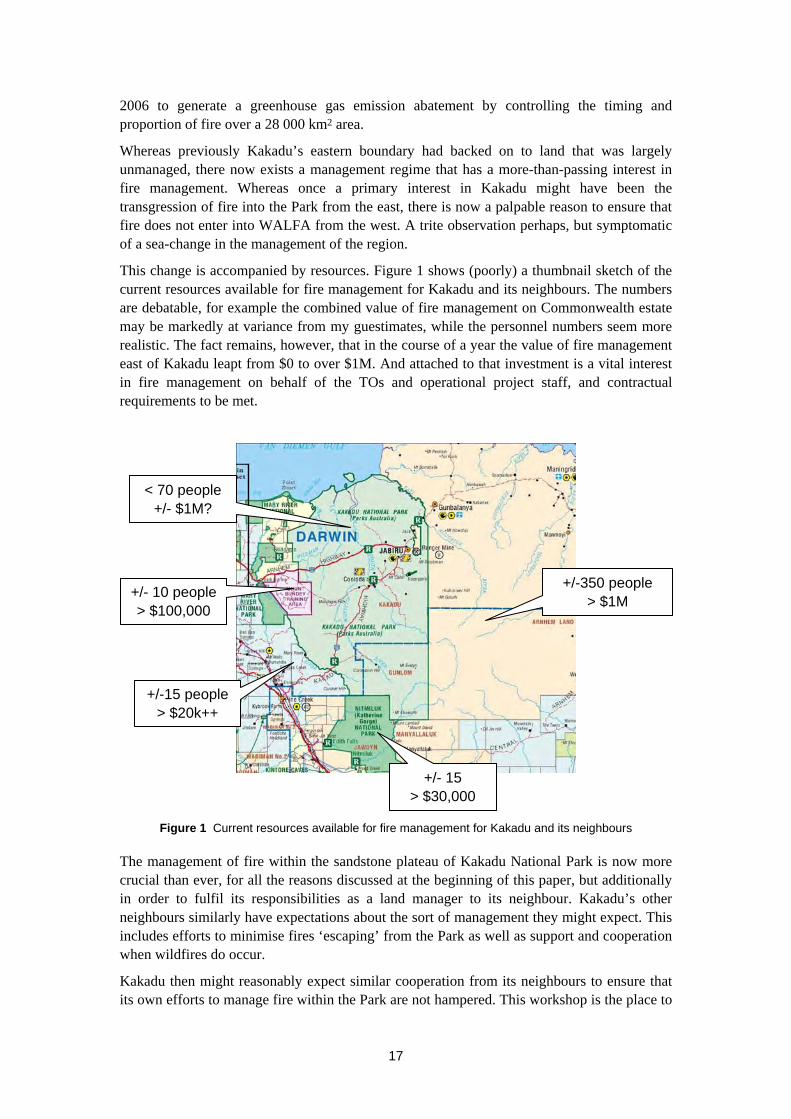
This change is accompanied by resources. Figure 1 shows (poorly) a thumbnail sketch of the current resources available for fire management for Kakadu and its neighbours. The numbers are debatable, for example the combined value of fire management on Commonwealth estate may be markedly at variance from my guestimates, while the personnel numbers seem more realistic. The fact remains, however, that in the course of a year the value of fire management east of Kakadu leapt from $0 to over $1M. And attached to that investment is a vital interest in fire management on behalf of the TOs and operational project staff, and contractual requirements to be met.
< 70 people +/- $1M?
+/-15 people > $20k++
+/- 10 people > $100,000
+/- 15 > $30,000
+/-350 people > $1M
Figure 1 Current resources available for fire management for Kakadu and its neighbours
The management of fire within the sandstone plateau of Kakadu National Park is now more crucial than ever, for all the reasons discussed at the beginning of this paper, but additionally in order to fulfil its responsibilities as a land manager to its neighbour. Kakadu’s other neighbours similarly have expectations about the sort of management they might expect. This includes efforts to minimise fires ‘escaping’ from the Park as well as support and cooperation when wildfires do occur.
Kakadu then might reasonably expect similar cooperation from its neighbours to ensure that its own efforts to manage fire within the Park are not hampered. This workshop is the place to
17

18
build that cooperation and is ultimately the reason we are here. The publication that is produced to summarise the proceedings will be useful, but the talk that takes place in formal sessions and over cups of tea will be essential. And we should do it all again soon – we can always build more shelves.
Part 2 Fire monitoring
Introduction
Fire monitoring programs are used to measure the outcomes of fire management practises and identify potential impacts of management activities on the ecosystem. Monitoring is the principal means for the park managers, staff and bininj to learn new knowledge. The Kakadu Fire Plot Monitoring Program is a major long-term program established in the park. The program aims to assess fire regimes, their impacts upon biodiversity, and the consequences and efficacy of fire management. The program comprises two complementary elements – mapping of fire histories based upon interpretation of satellite imagery, and assessment of vegetation at a large series of permanent monitoring plots. The program commenced formally in 1995, at which time establishment and baseline sampling of vegetation in 134 plots was conducted, with re-sampling proposed at 5-year intervals up to 2010. The following paper outlines the methods used in the monitoring program and then asses the results obtained from various datasets compiled as part of the program.
19

20
2.1 Fire and biodiversity monitoring for conservation managers: a 10 year assessment
of the ‘Three Parks’ (Kakadu, Litchfield & Nitmiluk) program1
J Russell-Smith2,3, AC Edwards2, JCZ Woinarski4, J McCartney4, S Kerin5, S Winderlich5, BP Murphy2,6 & F Watt2
2.1.1 Introduction
Fire is a recurring element of the mesic (>1000 mm rainfall pa) savannas of northern Australia where, on average, over one-third and, in some places, more than half the landscape is burnt annually. At the savanna-wide scale, such observations have been informed from the early 1990s through mapping of burnt (or, more properly, fire-affected) areas from relatively coarse resolution (~1.1 km2 pixels) Advanced Very High Resolution Radiometer (AVHRR) imagery on the United States’ National Oceanic and Atmospheric Administration (NOAA) series of satellites. At more local scales, fine resolution LANDSAT (~0.1–0.5 ha pixels) imagery has been used to map fires and characterise fire regimes in a large number of regional studies since the 1980s.
As described elsewhere in this volume, such satellite-based observations have complemented an extensive research effort (commencing from the 1960s) focusing on describing and understanding savanna fire behaviour, and the ecological responses of regional vegetation and faunal components to different fire regimes (for recent reviews see Williams et al 2002, 2003a, Woinarski et al 2005a). Fire ecology research has targeted savanna systems and component species especially, but substantial other work has examined the fire ecology of floodplains, and relatively fire-sensitive rainforest and sandstone heath habitats.
A parallel development since the mid-1990s has been joint establishment of a long-term fire monitoring program on three of the Top End’s major regional National Parks: the 19 092 km2 World Heritage Kakadu National Park, jointly managed by its Aboriginal traditional owners and Parks Australia – an agency of the Australian Government; the contiguous 2924 km2 Nitmiluk National Park, jointly managed by its Aboriginal traditional owners and the Northern Territory Government’s Parks and Wildlife Service; and the 1464 km2 Litchfield National Park, also managed by the Parks and Wildlife Service (Figure 1). Impetus for development of this joint program has had a number of drivers, including requirements for:
maintaining an up-to-date fire history coverage, based on interpretation of satellite imagery for each park, accompanied by systematic on-ground verification
1 This paper is chapter 10 in Culture, ecology and economy of fire management in North Australian savannas: rekindling
the Wurrk tradition, eds J Russell-Smith, PJ Whitehead & P Cooke, CSIRO Publishing, Collingwood, 2009 2 Bushfires NT, NT Department of Natural Resources, Environment, the Arts and Sport 3 Kakadu Research Advisory Committee 4 NT Department of Natural Resources, Environment, the Arts and Sport 5 Kakadu National Park, Parks Operations & Tourism Branch, Department of the Environment, Water, Heritage &
the Arts 6 University of Tasmania
recognition of the ecological significance of fire as agent of biotic change, particularly in relation to the effects of more-intense fires late in the dry season
providing a means by which changes in status and condition of habitats and species (including vulnerable flora and vertebrates) can be assessed with respect to different fire regime parameters (eg seasonality, frequency, interval and intensity)
requirements for quantifying management success with respect to stated objectives in management plans
providing a means by which park managers and traditional owners can themselves assess the long-term effects of their management actions, as part of an adaptive management process.
Importantly, the program was borne out of recognition that long-term experimental fire research plot studies established in lowland savanna at Munmarlary (1972–1996) and Kapalga (1990–1994) in present-day Kakadu, did not adequately meet the multi-factorial needs of regional managers given: (a) the highly restricted set of habitat and fire treatments involved in those experiments; as well as (b) disenchantment with a research process that did not fully engage regional managers in either its design or implementation (Andersen & McKaige 1997, Russell-Smith et al 2003). This negative experience with a research-imposed agenda led to a key philosophical standpoint being taken by park staff concerning the purpose of establishing this fire-monitoring program – the program must primarily serve the long-term information interests of park managers and traditional owners (Russell-Smith & Ryan 1996). Nevertheless, the program continues to provide fundamentally important fire history, vegetation and faunal ecological perspectives (Edwards et al 2001, 2003, Woinarski et al 2004, Price et al 2005) that are relevant to the three parks, as well as northern Australian savanna systems generally. Various assessments presented elsewhere in this volume, for example, have been informed by datasets assembled through the Three Parks program.
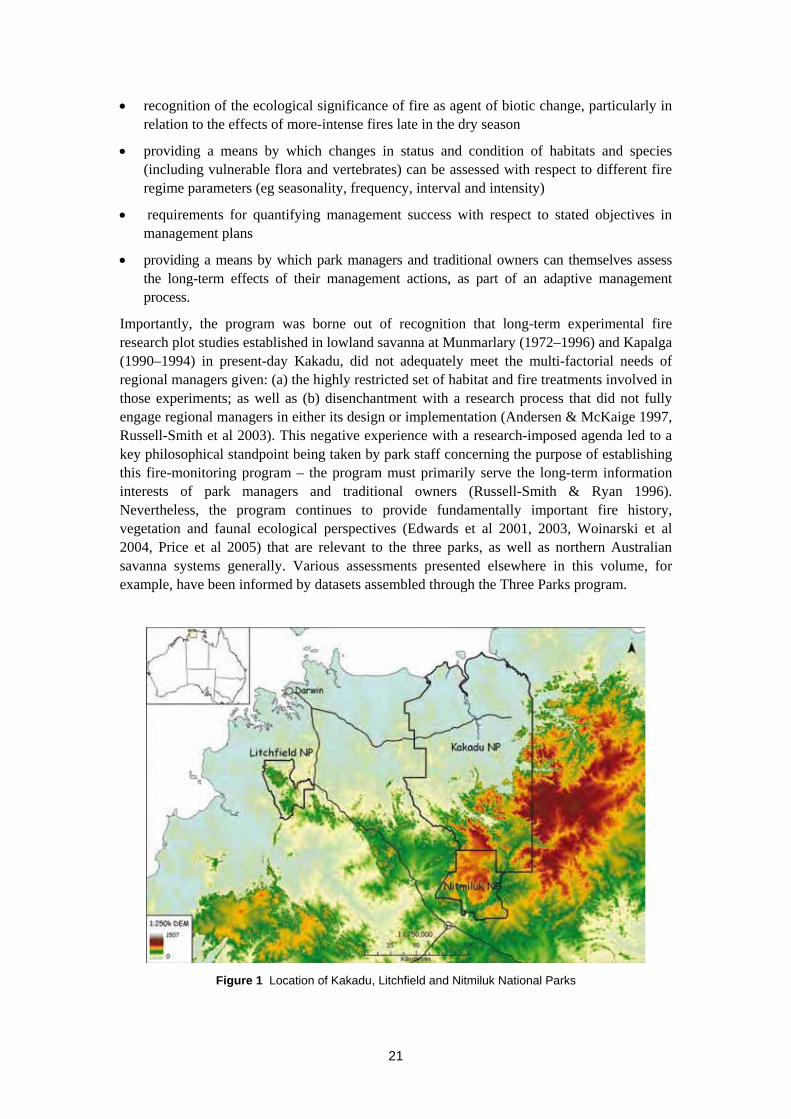
Figure 1 Location of Kakadu, Litchfield and Nitmiluk National Parks
21
This paper first outlines methodological aspects concerning monitoring program components, then considers representative results obtained from assessment of various datasets (satellite-derived fire histories, flora and fauna responses) assembled over the first 10 years (1995–2004) of the program, and key assessment of the value of the applied program to the land managers it was designed primarily to assist. Purposefully, our presentation of results entails use of simple descriptive statistics; more sophisticated modelling treatments (embedding various assumptions) are, at the time of writing, under review in various journals.
2.1.2 Regional context
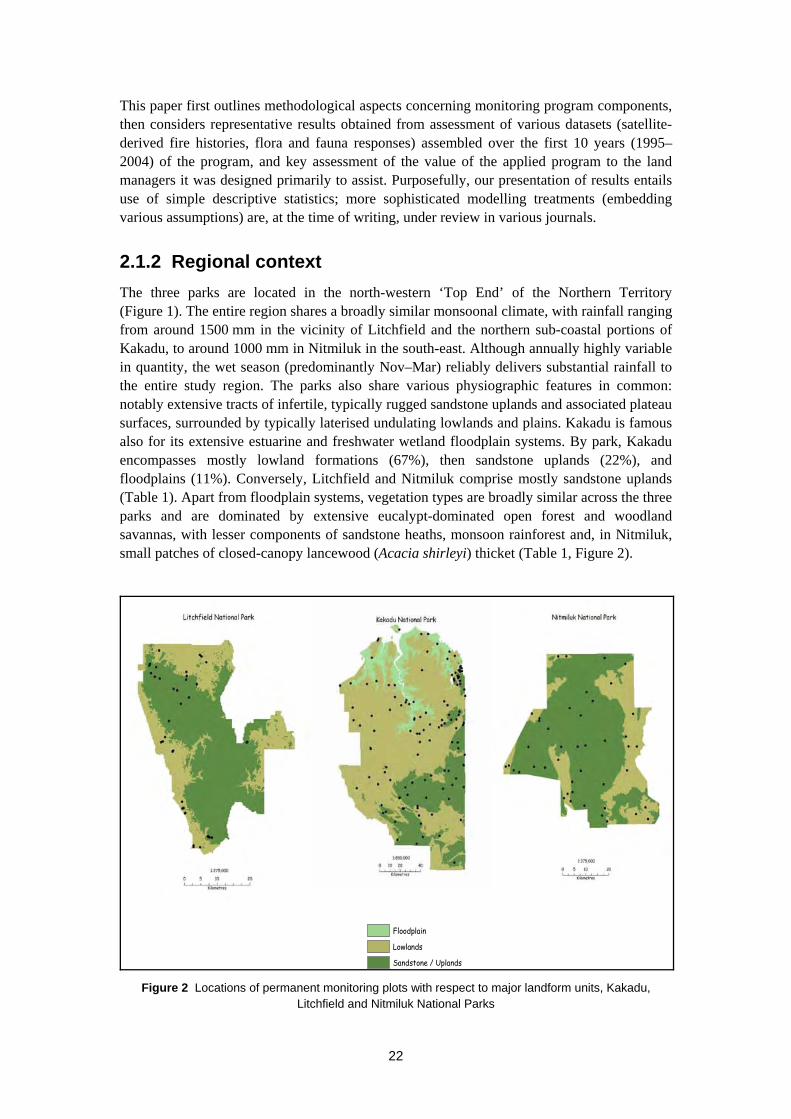
The three parks are located in the north-western ‘Top End’ of the Northern Territory (Figure 1). The entire region shares a broadly similar monsoonal climate, with rainfall ranging from around 1500 mm in the vicinity of Litchfield and the northern sub-coastal portions of Kakadu, to around 1000 mm in Nitmiluk in the south-east. Although annually highly variable in quantity, the wet season (predominantly Nov–Mar) reliably delivers substantial rainfall to the entire study region. The parks also share various physiographic features in common: notably extensive tracts of infertile, typically rugged sandstone uplands and associated plateau surfaces, surrounded by typically laterised undulating lowlands and plains. Kakadu is famous also for its extensive estuarine and freshwater wetland floodplain systems. By park, Kakadu encompasses mostly lowland formations (67%), then sandstone uplands (22%), and floodplains (11%). Conversely, Litchfield and Nitmiluk comprise mostly sandstone uplands (Table 1). Apart from floodplain systems, vegetation types are broadly similar across the three parks and are dominated by extensive eucalypt-dominated open forest and woodland savannas, with lesser components of sandstone heaths, monsoon rainforest and, in Nitmiluk, small patches of closed-canopy lancewood (Acacia shirleyi) thicket (Table 1, Figure 2).
Floodplain
Lowlands
Sandstone / Uplands Figure 2 Locations of permanent monitoring plots with respect to major landform units, Kakadu,
Litchfield and Nitmiluk National Parks
22
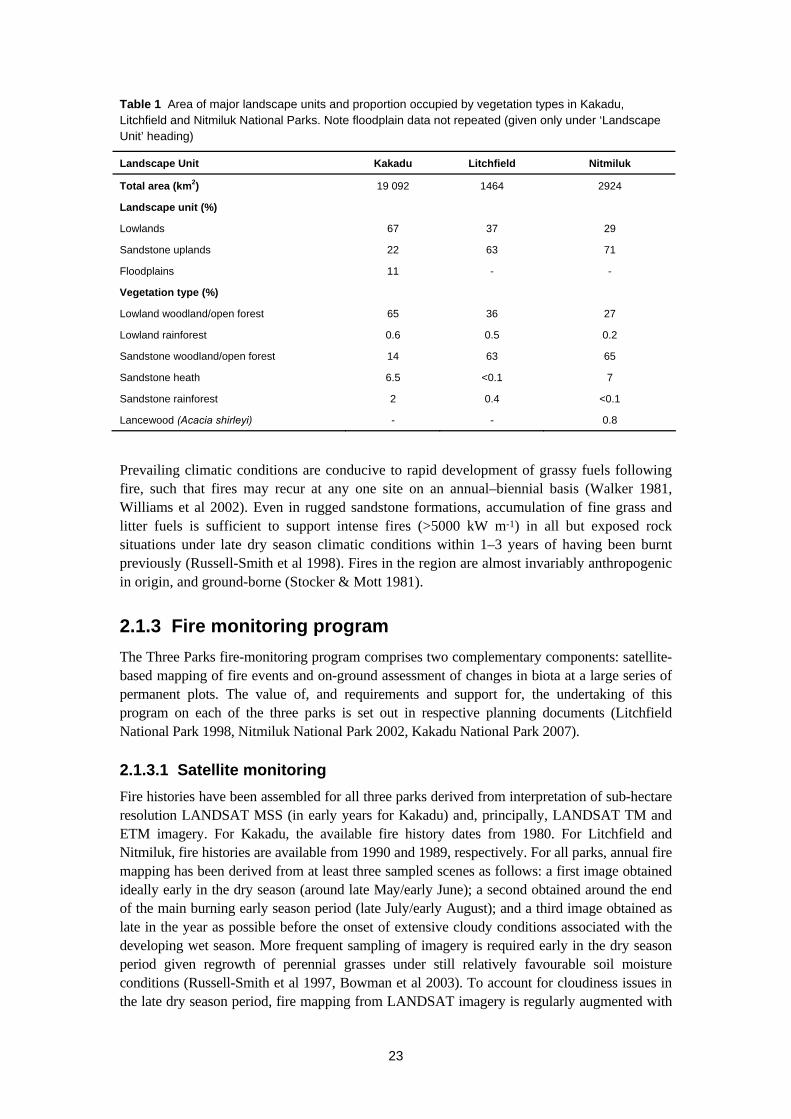
Table 1 Area of major landscape units and proportion occupied by vegetation types in Kakadu, Litchfield and Nitmiluk National Parks. Note floodplain data not repeated (given only under ‘Landscape Unit’ heading)
Landscape Unit Kakadu Litchfield Nitmiluk
Total area (km2) 19 092 1464 2924
Landscape unit (%)
Lowlands 67 37 29
Sandstone uplands 22 63 71
Floodplains 11 - -
Vegetation type (%)
Lowland woodland/open forest 65 36 27
Lowland rainforest 0.6 0.5 0.2
Sandstone woodland/open forest 14 63 65
Sandstone heath 6.5 <0.1 7
Sandstone rainforest 2 0.4 <0.1
Lancewood (Acacia shirleyi) - - 0.8
Prevailing climatic conditions are conducive to rapid development of grassy fuels following fire, such that fires may recur at any one site on an annual–biennial basis (Walker 1981, Williams et al 2002). Even in rugged sandstone formations, accumulation of fine grass and litter fuels is sufficient to support intense fires (>5000 kW m-1) in all but exposed rock situations under late dry season climatic conditions within 1–3 years of having been burnt previously (Russell-Smith et al 1998). Fires in the region are almost invariably anthropogenic in origin, and ground-borne (Stocker & Mott 1981).
2.1.3 Fire monitoring program
The Three Parks fire-monitoring program comprises two complementary components: satellite- based mapping of fire events and on-ground assessment of changes in biota at a large series of permanent plots. The value of, and requirements and support for, the undertaking of this program on each of the three parks is set out in respective planning documents (Litchfield National Park 1998, Nitmiluk National Park 2002, Kakadu National Park 2007).
2.1.3.1 Satellite monitoring
Fire histories have been assembled for all three parks derived from interpretation of sub-hectare resolution LANDSAT MSS (in early years for Kakadu) and, principally, LANDSAT TM and ETM imagery. For Kakadu, the available fire history dates from 1980. For Litchfield and Nitmiluk, fire histories are available from 1990 and 1989, respectively. For all parks, annual fire mapping has been derived from at least three sampled scenes as follows: a first image obtained ideally early in the dry season (around late May/early June); a second obtained around the end of the main burning early season period (late July/early August); and a third image obtained as late in the year as possible before the onset of extensive cloudy conditions associated with the developing wet season. More frequent sampling of imagery is required early in the dry season period given regrowth of perennial grasses under still relatively favourable soil moisture conditions (Russell-Smith et al 1997, Bowman et al 2003). To account for cloudiness issues in the late dry season period, fire mapping from LANDSAT imagery is regularly augmented with
23

coarser-resolution, daily imagery available from AVHRR and, in recent years, MODIS sensors. Fire-mapping data have been validated annually since the mid-1990s for all three parks, based on stratified aerial transect assessments. Methodological details concerning the satellite-based fire-mapping program, including validation assessments, are given in Russell-Smith et al (1997) and Edwards et al (2001, 2003). An allied component of the imagery-derived monitoring program has been development of the North Australia Fire Information (NAFI) website (http://www.firenorth.org.au). This site provides daily mapping of fire hotspots detected from AVHRR and MODIS sensors, as well as regular (eg weekly in the peak fire season) manual updating of fire extent mapping derived principally from MODIS. To date, NAFI has been developed under the umbrella of the Tropical Savannas Management Cooperative Research Centre based in Darwin, with fire information, weather and mapping inputs from a number of contributing organisations including Landgate (Western Australia Government), Geoscience Australia, Bureau of Meteorology, Cape York Peninsula Development Association, and Bushfires NT. No fee is currently charged for this service.
2.1.3.2 Permanent plots
A total 220 permanent monitoring plots (40 m × 20 m) were established on the three parks in 1994–1995 to monitor biotic change. Of these, 133 plots are located in Kakadu, with 41 and 46 in Litchfield and Nitmiluk, respectively (Table 2). These sample a variety of landform and vegetation type/habitat conditions (Table 2, Figure 3). A substantial proportion of plots was positioned deliberately at sites likely to most efficiently reveal environmental dynamics, especially at ecotones and in patches of fire-sensitive vegetation (eg stands of Callitris or sandstone heaths). As well, many plots are located at, or in the near vicinity of, intensively managed sites such as camp-grounds and other tourist destinations.
Table 2 Numbers of plots in Kakadu, Litchfield and Nitmiluk National Parks
No. plots Landscape Unit
Kakadu Litchfield Nitmiluk Total
Total area (km2) 133 41 46 220
Landscape unit
Lowlands 72 17 14 103
Sandstone uplands 49 20 30 99
Floodplains 12 4 2 18
Vegetation type
Lowland woodland/open forest 55 16 13 84
Lowland rainforest 17 1 1 19
Sandstone woodland/open forest 13 19 21 53
Sandstone heath 16 1 3 20
Sandstone rainforest 20 0 3 23
Lancewood (Acacia shirleyi) 0 0 3 3
Notes: (i) floodplain plots, typically focusing on Melaleuca spp, not repeated under Vegetation type heading, (ii) many plots are situated across ecotones, and in data below; (iii) numbers of rainforest and Lancewood plots include all plots ecotonal with other vegetation types; (iv) numbers of heath plots include all plots ecotonal with sandstone woodland but not rainforest.
24
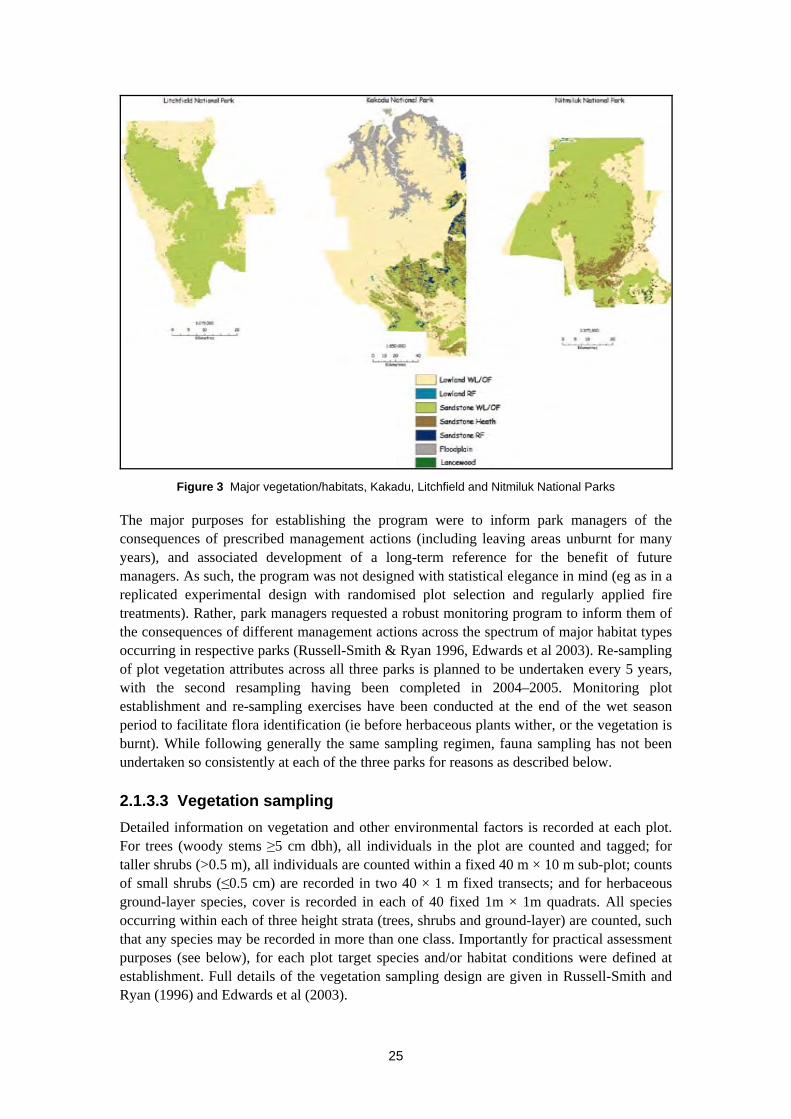
Figure 3 Major vegetation/habitats, Kakadu, Litchfield and Nitmiluk National Parks
The major purposes for establishing the program were to inform park managers of the consequences of prescribed management actions (including leaving areas unburnt for many years), and associated development of a long-term reference for the benefit of future managers. As such, the program was not designed with statistical elegance in mind (eg as in a replicated experimental design with randomised plot selection and regularly applied fire treatments). Rather, park managers requested a robust monitoring program to inform them of the consequences of different management actions across the spectrum of major habitat types occurring in respective parks (Russell-Smith & Ryan 1996, Edwards et al 2003). Re-sampling of plot vegetation attributes across all three parks is planned to be undertaken every 5 years, with the second resampling having been completed in 2004–2005. Monitoring plot establishment and re-sampling exercises have been conducted at the end of the wet season period to facilitate flora identification (ie before herbaceous plants wither, or the vegetation is burnt). While following generally the same sampling regimen, fauna sampling has not been undertaken so consistently at each of the three parks for reasons as described below.
2.1.3.3 Vegetation sampling
Detailed information on vegetation and other environmental factors is recorded at each plot. For trees (woody stems ≥5 cm dbh), all individuals in the plot are counted and tagged; for taller shrubs (>0.5 m), all individuals are counted within a fixed 40 m × 10 m sub-plot; counts of small shrubs (≤0.5 cm) are recorded in two 40 × 1 m fixed transects; and for herbaceous ground-layer species, cover is recorded in each of 40 fixed 1m × 1m quadrats. All species occurring within each of three height strata (trees, shrubs and ground-layer) are counted, such that any species may be recorded in more than one class. Importantly for practical assessment purposes (see below), for each plot target species and/or habitat conditions were defined at establishment. Full details of the vegetation sampling design are given in Russell-Smith and Ryan (1996) and Edwards et al (2003).
25
Vegetation sampling has been undertaken jointly by park ranger staff with expert technical assistance, especially from Northern Territory Government agencies: the Parks and Wildlife Service (formerly Parks and Wildlife Commission) and Bushfires NT (formerly Bushfires Council). For Litchfield and Nitmiluk, monitoring plot assessments have been undertaken as part of major ranger-training exercises, where rangers have been assembled from throughout the Northern Territory, including from Indigenous ranger groups. These exercises typically have been conducted over 2-week periods, and have involved:
1 plot sampling and associated data entry (in a Microsoft Access database), analysis (including assessment of the status of target species and/or habitat condition), interpretation
2 editing of remotely-sensed fire-mapping products and associated GIS analyses (primarily using Arcview)
3 report writing
4 presentation of findings to training camp participants and invited senior park management and scientific personnel.
Although a broadly similar process is undertaken in Kakadu, the larger number of plots involved means that sampling is undertaken over a larger number of weeks in 2 years. In addition, given staffing issues (see below), there is less formal involvement of Kakadu staff in the entry, assessment and presentation of assembled datasets. Detailed reports summarising establishment and re-sampling programs are available for each park; for example, for the 2000–2001 re-sampling period (see O’Leary et al 2000, PWCNT 2000, Turner et al 2002).
2.1.3.4 Fauna sampling
The monitoring program was designed originally to sample vegetation. Its applicability for the monitoring also of fauna was recognised subsequently. As a consequence, the monitoring of fauna has generally lagged behind the vegetation monitoring program. Whereas all 133 monitoring plots in Kakadu have been sampled for vegetation three times over the period 1995–2004, sampling for fauna has been far less substantial and regular: 15 of the Kakadu plots have been monitored for fauna three times, 45 plots twice, 68 plots only once, and 6 plots have not been sampled at all. Sampling intensity has been better for Litchfield, where 40 of the 41 plots have now been sampled three times, more or less at the same time as the vegetation sampling. The 46 plots in Nitmiluk have been sampled only once (in 2005). This more fragmentary monitoring performance means that it is not yet feasible to undertake detailed analyses of fauna trends and responses in a manner comparable to that summarised here for plants. Fauna sampling is restricted to terrestrial vertebrates. Invertebrates have not been included, partly because of the taxonomic impediment of a generally very poorly known invertebrate fauna. The sampling of terrestrial vertebrates follows a protocol now widely used for fauna survey in northern Australia (eg Woinarski et al 2004), allowing comparative linkage of trends and inventory to a far broader base than simply this set of monitoring plots. At (or immediately adjacent to) the fixed monitoring plots, this fauna sampling protocol comprises searches and trapping over a 72 hr period, including:
1 eight ‘instantaneous’ counts (predominantly in the early morning) of birds present in a 1 ha plot
2 two nocturnal spotlighting searches, each for 10 min, of a 50 m × 50 m plot within the 1 ha plot, for frogs, reptiles, birds and mammals
26
3 three 10-min day-time searches for reptiles, frogs and mammals in the 50 m×50 m plot
4 an array of 20 Elliott traps (metal box traps 30 cm × 7 cm × 7 cm) and cage traps (65 cm × 15 cm × 15 cm) evenly spaced along the perimeter of the 50 m × 50 m plot (mostly to sample small mammals), baited with a mixture of peanut butter, honey and oats, and checked early every morning
5 two pitfall traps (20 L plastic buckets dug into the ground), with 8 m of 30 cm high flywire drift-line netting.
For each species, an abundance value is calculated as the sum of all individuals captured or reported in searches.
This sampling protocol is notably more demanding than the vegetation sampling. Sampling requires the monitoring plot to be visited repeatedly over a 3-day period, and the requirement to spotlight search at night obviously requires nocturnal access (typically involving camping near the site). Further, the equipment required for sampling is far more substantial than that for vegetation monitoring. Hence, the fauna sampling tends to be more expensive (especially so for plots requiring helicopter access) and to take much more time. Partly because of this logistical constraint, fauna sampling, at least in Kakadu, has been spaced over more months of the year than vegetation sampling, albeit with the requirement that subsequent sampling of any plot should occur at approximately the same time of year as any previous sampling of the plot (+/– one month).
Fauna sampling has additional complications:
some fauna species (eg burrowing skinks) present in a plot may not be detected readily
some fauna species may disperse in and out of the plot during sampling (and happen to be over- or under-recorded by chance during the sampling events)
there may be some differences between observers in observation skills and identifications
there may be seasonal and year-to-year variation between years in regional occurrence and ‘trapability’ or detectability of some species, unrelated to fire or other threatening factors.
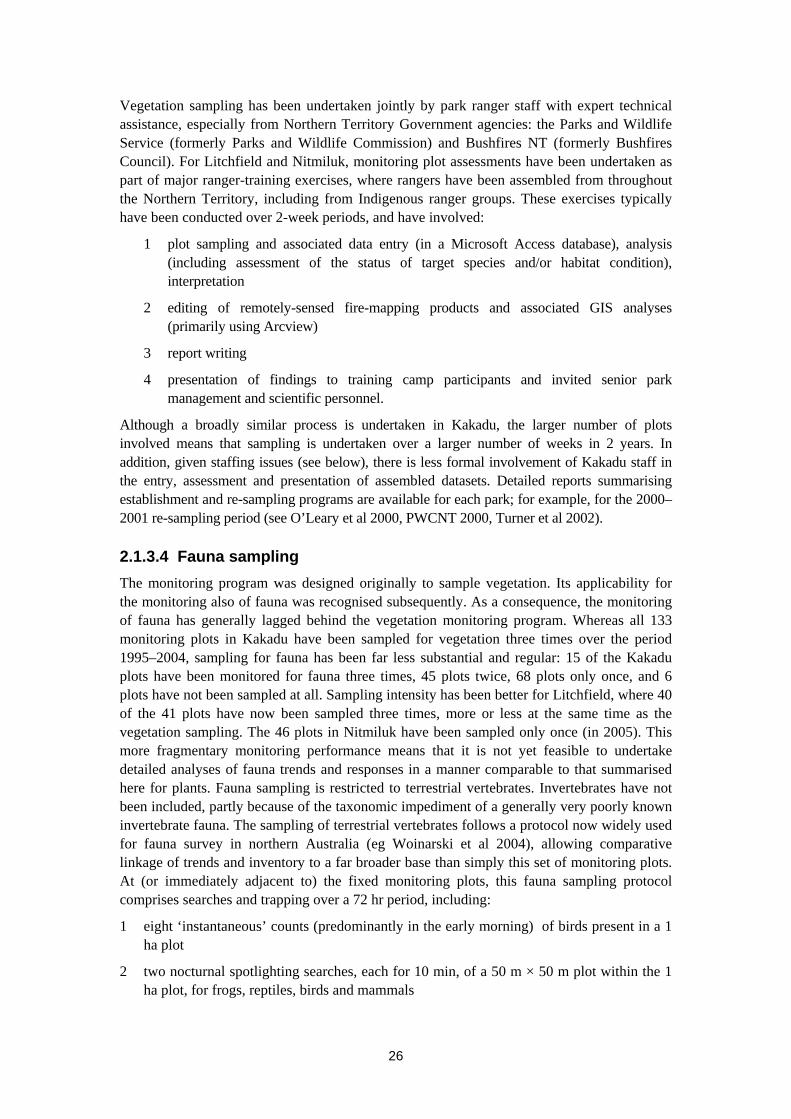
For this set of reasons, there may be substantially more unwanted ‘noise’ between monitoring episodes for fauna than for vegetation, and hence far less statistical power and interpretational acuity. As an illustration of this, we compared a simple measure of inter-sample similarity in species composition [(the number of species reported in a plot at both time 1 and time 2)/(the cumulative tally of different species recorded in that plot across times 1 and 2)], across monitoring plots for the set of tree species, understorey plant species and vertebrate species (Figure 4). Unsurprisingly, the occurrence of tree species was relatively invariant; there was substantially more variation in the inventory of understorey plant species at the same plot across samples 5 years apart; but there was remarkably little similarity in the species complement of
27
Figure 4 Similarity between sampling episodes of the same plot in tree species presence, understorey plant species presence and vertebrate fauna species presence, where ‘similarity = (the number of species reported in a plot at both time 1 and time 2)/ (the cumulative tally of different species recorded in that plot across times 1 and 2)’

vertebrates at the same plot in 5 year samples. Although part of this variability in fauna assemblages may be attributable to a meaningful trend, another, probably more substantial, part may be largely measurement error or other muddying chaos.
In assessing the impact of this variability on the ability to detect trend, Woinarski et al (2004) determined that for adequate power (in this case, the ability to be 90% certain of detecting a 20% change in our index of relative abundance, and with a 10% chance of accepting a Type I error), the Litchfield fauna monitoring program should be expanded from its current 47 plots to more than 1000. This is obviously an impractical ask. But the integration of monitoring across the three parks (here, to a tally of 220 plots) allows a substantial advance towards this ideal.
2.1.3.5 Fire occurrence and severity
The occurrence of fire at each plot is assessed at least bi-annually by on-ground visits by ranger staff, and this record is used – as well as the undertaking of aerial surveys – to assess the reliability of the fire history developed from the satellite imagery. For Kakadu and Nitmiluk, the photo record assembled for these visits for the period 1995–2004 has also been used to develop a practical field-based index of fire severity (low severity = leaf scorch height <2 m, and/or fires patchy with <20% of ground cover remaining unburnt; moderate severity = leaf scorch height >2 m, but upper canopy unscorched; high severity = upper canopy scorched), and as a basis for assessing seasonal fire severity characteristics in different vegetation types (Russell- Smith & Edwards 2006).
2.1.3.6 The first 10-year assessment, 1995–2004
After the first 10 years of the program, it is salutary to consider aspects of the data assembled to date and, perhaps even more importantly, to assess whether the program has been meeting its primary objectives, especially the information needs of management staff.
2.1.3.7 Fire history
Fire histories derived from LANDSAT imagery for each of the three parks are broken down by season in Table 3 and Figure 5, where the early dry season (EDS) period covers fires generally before August, and the late dry season (LDS) period describes fires after that date. Although these seasonal distinctions are somewhat arbitrary, various regional studies illustrate that fires in the EDS period tend to be of lower intensity (Williams et al 1998, 2003b, Russell-Smith et al 2003) and more patchy (Price et al 2003, Williams et al 2003b). Using data assembled for Kakadu and Nitmiluk National Parks as part of the monitoring plot program described in this paper, it was observed that for 719 fires recorded from 178 plots over the period 1995–2004, 80% of EDS fires were of very low severity (fire-line intensities << 1000 kW m-1, with leaf scorch heights typically <2 m), whereas fires later in the dry season were typically of substantially greater severity. Similar trends were evident for vegetation occupying all landform types (Russell-Smith & Edwards 2006). Also, as described by Garde et al (2009), the EDS period effectively covers the main landscape burning period of as undertaken traditionally in western Arnhem Land generally. By park, an annual average of 65.5% of Litchfield, 50.9% of Nitmiluk and 41.7% of Kakadu was burnt between 1995 and 2004 (Table 3). In all parks, fires burnt most frequently in the EDS period, by a factor of 3.1 in Litchfield, 2.2 in Kakadu and 1.4 in Nitmiluk. Approximately 50% of lowland landform units were burnt in all parks: particularly fire-prone open forest and woodland savannas. By contrast, the annual extent of burning of sandstone uplands varied markedly between parks: for example, on average, 70% of sandstone savanna was burnt in Litchfield, 51% in Nitmiluk and 29% in Kakadu (Table 3).
28
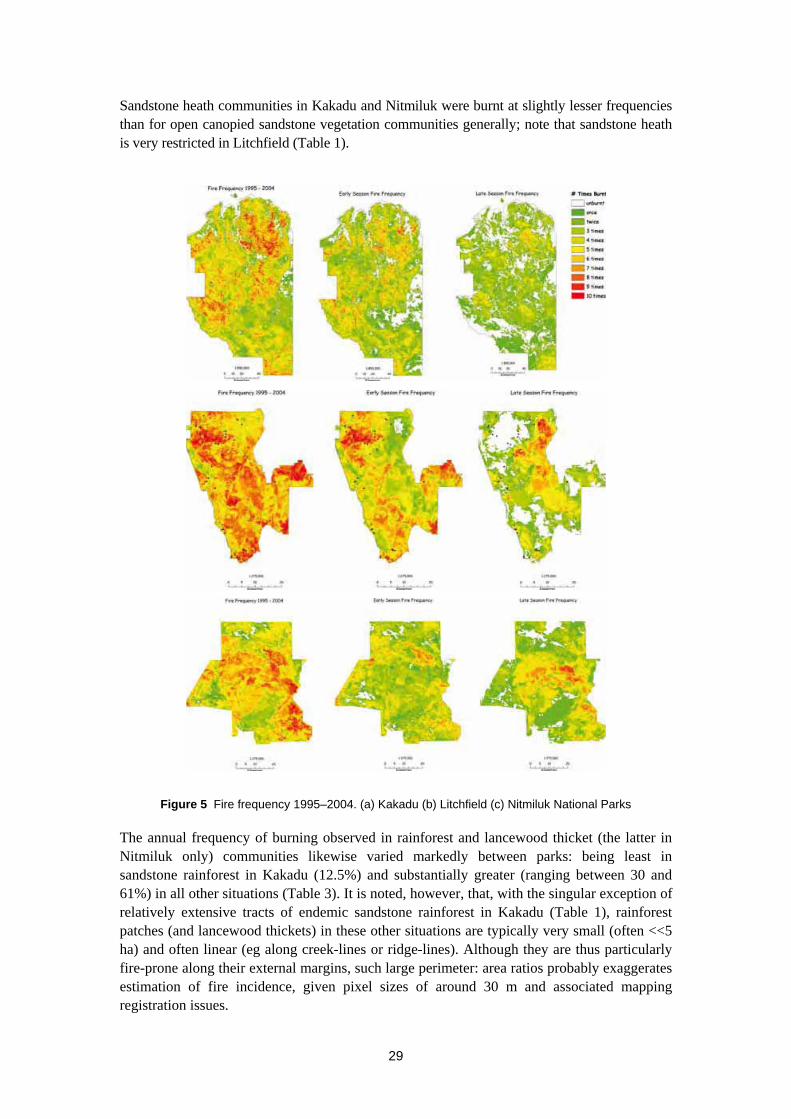
Sandstone heath communities in Kakadu and Nitmiluk were burnt at slightly lesser frequencies than for open canopied sandstone vegetation communities generally; note that sandstone heath is very restricted in Litchfield (Table 1).
Figure 5 Fire frequency 1995–2004. (a) Kakadu (b) Litchfield (c) Nitmiluk National Parks
The annual frequency of burning observed in rainforest and lancewood thicket (the latter in Nitmiluk only) communities likewise varied markedly between parks: being least in sandstone rainforest in Kakadu (12.5%) and substantially greater (ranging between 30 and 61%) in all other situations (Table 3). It is noted, however, that, with the singular exception of relatively extensive tracts of endemic sandstone rainforest in Kakadu (Table 1), rainforest patches (and lancewood thickets) in these other situations are typically very small (often <<5 ha) and often linear (eg along creek-lines or ridge-lines). Although they are thus particularly fire-prone along their external margins, such large perimeter: area ratios probably exaggerates estimation of fire incidence, given pixel sizes of around 30 m and associated mapping registration issues.
29

Table 3 Proportion (%) of Kakadu, Litchfield and Nitmiluk National Parks burnt by season 1995– 2004, derived from LANDSAT satellite imagery. EDS = early dry season (pre-August); LDS = late dry season (August onwards). Note floodplain vegetation type data given only under Landscape unit.
Landscape unit Proportion burnt (%)
Kakadu Litchfield Nitmiluk
EDS LDS Annual EDS LDS Annual EDS LDS Annual
Total area 28.6 13.1 41.7 49.4 16.1 65.5 29.3 21.6 50.9
Landscape unit
Lowlands 35.8 14.0 49.8 44 14.6 58.7 29.9 23.7 53.6
Sandstone uplands 12.9 13.2 26.1 54.2 15.9 70.2 29 20.8 49.8
Floodplains 16.6 7.4 24.1 - - - - -
Vegetation type
Lowland woodland/open forest 35.8 14.2 50.0 44.2 14.7 58.9 30 23.9 53.9
Lowland rainforest 21.6 8.2 29.8 33.6 11.6 45.2 16.1 13 29.1
Sandstone woodland/open forest 15.3 14 29.3 52.6 17.01 69.6 29.5 21.5 51
Sandstone heath 13.3 12.5 25.7 - - - 25 14.6 39.6
Sandstone rainforest 5.2 7.3 12.5 46.4 14.4 60.8 26.5 12 38.4
Lancewood (Acacia shirleyi) - - - - - - 32.3 24.8 57.1
As a means for assessing progress in the delivery of fire-management programs in these parks, we are able to compare the above fire history data for 1995–2004 with published fire history data available for earlier periods for all three parks. Data for Kakadu are available for the period 1980–1994 (Russell-Smith et al 1997). Overall, the mean annual extent of burning in Kakadu has declined 4.1%, particularly in the LDS period (20.8% previously to 13.1% here) and across all three major landform units, especially lowlands. There have been concomitant slight increases in the mean extent of EDS burning. Fire history data for Litchfield and Nitmiluk are available from 1990 to 1997, and 1989 to 1997, respectively (Edwards et al 2001). Mean fire extent in the 1995–2004 assessment period is 9.6% greater in Litchfield, and 10.2% greater in Nitmiluk. These increases have occurred particularly in the EDS in both parks, with a concomitant slight decline in mean LDS fire extent in Nitmiluk, and a slight increase in Litchfield. Other notable shifts in fire regime on these parks include a large increase in the extent of burning (both EDS and LDS) in lowland situations in Nitmiluk (31.6% previously to 53.9% now), and marked increase in (EDS) burning both in lowland and sandstone upland situations in Litchfield.
2.1.3.8 Vegetation responses
As described in Table 1, the 220 permanent monitoring plots sample a variety of key vegetation/ habitat types in each of the three parks. Given: (a) the detail with which vegetation attributes have been audited on each of three occasions over the 10-year history of the program; (b) the accompanying detailed recording of fire occurrence, seasonality and severity; and (c) the very considerable efforts that have been given to curating these data (eg maintaining taxonomic consistency); the assembled data provide a powerful means for assessing the responses of respective vegetation types and constituent species to different fire-regime parameters (eg fire frequency, severity, time-since-last-fire and fire interval). Although it is not our purpose here to present a comprehensive assessment of vegetation-fire responses in data assembled to date, we provide below assessments of broad-scale fire effects
30

on two vegetation types (woodland/open-forest and rainforest) and one iconic fire-sensitive species, Callitris intratropica, in two landscape settings (lowlands and sandstone uplands). These assessments combine data from all three parks, and illustrate the practical value of this program to inform park managers of the effects of their fire-management program(s).
2.1.3.9 Savanna woodland
A total of 137 monitoring plots are established in woodland/open forest vegetation, dominated principally by eucalypts, with 84 plots situated in lowland and 53 plots in sandstone upland situations. Although approximately half the plots occur in Kakadu, there are disproportionately more sandstone woodland plots both in Litchfield and Nitmiluk (Table 1). None of these plots samples an ecotonal situation. For the assessment presented here, data from 14 plots (mostly lowland woodland) have been excluded given incomplete fire severity data for 11 plots, apparent major vegetation changes not related to fire regime in two plots, and incomplete sampling for a further plot. A more detailed statistical assessment is being undertaken on this latter 123 plot dataset at the time of writing. Major vegetation trends for the three parks over the 10-year period are summarised in Table 4.
For lowland woodland plots, overall there has been mean net increase in ground cover and tree species richness, shrub and tree stem density, and stem basal area. Conversely, on sandstone woodland plots, there has mostly been decline in all these same parameters except for groundcover species richness. These trends are generally consistent across all three parks, although declines in stem basal area of lowland woodland plots were observed only for Kakadu. Overall, woodland plots have been burnt on average at an annual frequency of 0.55 (almost every second year), mostly (0.42) in the early dry season (pre-August). Burning of lowland woodland plots has occurred at a slightly higher frequency (0.56) than for sandstone woodland plots (0.52). However, sandstone woodland plots have burnt marginally more frequently at moderate and high fire severities (0.18), than lowland woodland plots (0.17). By park, sandstone plots have been burnt most frequently in Litchfield (0.67), then Nitmiluk (0.46) and Kakadu (0.39) (Figure 6). High-severity fires, however, occur most frequently in Nitmiluk, then Litchfield and Kakadu (Figure 6. The overriding importance of fire severity vis-à-vis other fire frequency parameters on woodland vegetation response is illustrated in Table 5, where:
1 fire frequency per se is not significantly (a = 0.05) correlated with any vegetation parameter
2 frequency of moderate and severe fires is significantly negatively correlated only with tall shrub density
3 frequency of severe fires is significantly negatively correlated with nine parameters, including tall shrub density, tree stem density and basal area.
The importance of fire severity on woody vegetation structural diversity suggested in these data supports observations made generally from north Australian regional savanna fire experiments conducted at Kapalga and Munmarlary (eg Williams et al 1999, 2003a; Russell- Smith et al 2003, Prior et al 2006). However, it is interesting to note that fire frequency per se is not implicated as being a significant driver of woody structural change in these data perhaps given that most of these fires happened to occur early in the dry season period and were typically of low intensity (Figure 6), and thereby more patchy (Price et al 2003, Williams et al 2003b).
31

Table 4 Change in lowland and sandstone woodland vegetation attributes over ten years at long-term monitoring plots in Kakadu, Litchfield, Nitmiluk NPs, 1995–2004
Woodland vegetation type
Lowland Sandstone Attribute
Kakadu (n=44)
Litchfield(n=16)
Nitmiluk(n=13)
Total (n=73)
Kakadu(n=11)
Litchfield (n=18)
Nitmiluk (n=21)
Total (n=50)
Change in ground cover species richness
Forbs 5.43 (16.02)
0.69 (17.50)
1.85 (13.85)
3.75 (15.96)
4.36 (15.27)
-1.12 (2017)
4.24 (10.05)
2.32 (14.84)
Graminoids 2.23 (5.30)
0.38 (12.13)
1.77 (8.54)
1.74 (7.37)
3.18 (6.00)
-1.18 (9.50)
3.43 (8.71)
1.76 (8.40
Change in shrub layer density (ha-1)
Shrubs overall 709 (9633)
8111 (14122)
654 (2738)
2321 (9389)
-832 (10180)
-8447 (16958)
-2783 (8058)
-4393 (11729)
Shrubs<50 cm 444 (6699)
8273 (10914)
673 (1327)
2201 (6666)
121 (7254)
-7861 (13792)
-1756 (5321)
-3541 (8796)
Shrubs 50–200 cm 98 (2765)
-114 (2725)
-50 (1275)
25 (2491)
-830 (2513)
-650 (2879)
-1071 (2646)
-867 (2701)
Shrubs > 200 cm – < 5 cm DBH
166 (170 )
-48 (483) 31 (137) 95 (233)
-123 (413) 64 (288) 44 (90) 14 (232)
Change in tree layer
Species richness overall
0.49 (6.82)
-1.31 (7.88)
0.15 (4.77)
0.25 (6.68)
-0.18 (7.45)
-0.83 (9.39)
-0.95 (5.33)
-0.74 (7.26)
Fruiting trees 0.26 (2.36)
0.13 (2.31)
0.31 (0.69)
0.24 (2.05)
-0.09 (3.00)
-0.17 (3.72)
-.38 (1.29)
-0.24 (2.54)
Deciduous trees 0.05 (2.75
0.13 (3.13)
0.15 (2.92)
0.08 (2.86)
0.18 (2.64) 0.17 (2.72)
-0.33 (1.48)
-0.04 (2.18))
Evergreen tree spp richness
0.44 (4.07)
-0.44 (4.75)
0.00 (1.85)
0.17 (3.82)
-0.36 (4.82)
-1.00 (6.67)
-0.62 (3.86)
-0.70 (5.08)
Stem density overall (ha-1)
42.1 (342.2)
-19.5 (461.7)
21.2 (248.1)
24.6 (248.1)
-27.7 (311.7)
-80.6 (438.9)
-55.4 (265.5)
-58.3 (338.1)
Stems 5–<10 cm DBH
48.5 (157.3)
0.0 (20.1.6)
21.2 (122.1)
32.8 (160.7)
-29.2 (111.7)
-48.6 (228.5)
-28.6 (113.1)
-35.9 (154.3)
Stems 10–30 cm DBH
-7.2 (156.7)
-21.1 (241.4)
-1.0 (116.3)
-9.1 (168.1)
1.5 (175.0) -37.5 (191.0)
-28.0 (129.8)
-24.9 (161.8)
Stems >30 cm DBH 0.7 928.2)
1.6 (18.8) 1.0 (9.6) 0.9 (22.8)
0.0 (25.0) 5.6 (19.4) 1.2 (22.6)
2.5 (22.0)
Basal area (m2 ha-1) -0.18 (8.27)
0.18 (8.79)
0.45 (3.95)
0.01 (7.61)
-0.99 (8.93)
-0.42 (8.24)
-0.73 (6.69)
-0.68 (7.74)
Note n = no. of monitoring plots. Numbers in parentheses are mean values of attributes at establishment (t1).
32

Figure 6 Mean fire frequency for lowland and sandstone woodland plots in Kakadu, Litchfield and
Nitmiluk National Parks for (a) seasonality of burning (E = Early dry season; L = Late dry season; T = total) and (b) fire severity (L = Low; M = Moderate; H = High), over the period 1995–2004.
In contrast, using various data from different fire treatments (of 4–7 years duration) at Kapalga, Prior et al (2006b) found that frequent fires early in the dry season resulted in reduced height growth of juvenile trees, whereas late-season fires resulted in increased juvenile height increment. Those authors suggested that differential fire seasonality effects probably occur because juveniles are physiologically active early in the dry season, but are effectively dormant in the late dry season. Such effects may have been exacerbated by the treatments themselves because elsewhere it has been noted that both early and late dry season fire intensities at Kapalga were significantly greater than those observed both at Munmarlary and in regional savannas more generally (Russell-Smith and Edwards 2006). At Munmarlary, little change was evident in population structures of dominant eucalypts after 22 years of imposed low–moderate severity annual early and late dry season treatments: a response interpreted to reflect that, as suggested in other studies, recruitment of eucalypts into the canopy appears to require significantly reduced root competition through death of dominant eucalypts (Russell-Smith et al 2003).
Furthermore, using other observations from the same woodland sites as described here, recent complementary statistical analyses of the effects of fire regime (eg fire frequency, seasonality and severity) parameters on various vegetation structure, growth increment, stem recruitment and mortality responses, illustrate a diversity of often subtle relationships. For example, although fire seasonality and severity are clearly strongly correlated, fire severity was shown to have stronger influences on herbaceous species richness (Russell-Smith et al unpublished data), stem growth increment (Murphy et al 2009) and mortality (Prior et al 2009), whereas tree-stem recruitment was shown to be affected particularly by frequency of early dry season fires (Prior et al 2009). Regardless, fire frequency per se has significant implications for maintenance of populations of fire-sensitive obligate seeder species, especially in regional heath communities (Russell-Smith et al 1998), and, as discussed also below, relatively fire sensitive components of savanna fauna (Woinarski et al 2001, 2005a, Andersen et al 2005.
33

Table 5 Spearman rank correlations between woodland vegetation response variables change with fire frequency variables, 1995–2004
Response Variable n Fire Frequency Frequency moderate and severe fires
Frequency severe fires
rs P rs P rs P
Forb species richness change (t3-t1) 123 0.02 NS -0.05 NS -0.12 NS
Annuals 123 0.07 NS -0.20 NS -0.28 0.002
Perennials 123 0.07 NS -0.07 NS -0.06 NS
Graminoid species richness (t3–t1): 123 -0.09 NS -0.19 NS -0.09 NS
Annuals 123 -0.04 NS -0.19 NS -0.20 0.03
Perennials 123 -0.07 NS -0.01 NS -0.09 NS
Tree species richness (t3-t1): 122 -0.14 NS -.10 NS -0.29 0.001
Fruiting tree species richness 122 -0.04 NS -0.05 NS -0.15 NS
Deciduous tree species richness 122 -0.08 NS <-0.01 NS -0.18 0.05
Evergreen species richness 122 -0.10 NS -0.01 NS -0.25 0.005
Shrub density change (t3/t1): 122 0.13 NS 0.03 NS 0.1 NS
Small shrubs (<50cm) 118 0.10 NS -0.01 NS 0.09 NS
Medium shrubs (50-200 cm) 122 0.12 NS -0.04 NS -0.03 NS
Tall shrubs (>200 cm - <5 cm DBH) 104 -0.13 NS -0.41 -<0.0001 -0.24 0.02
Tree stem density change (t3/t1): 122 <0.01 NS -0.09 NS -0.21 0.02
Small stems (5-10 cm DBH) 120 <-0.01 NS -0.08 NS -0.20 0.03
Medium stems (>10 - <30 cm DBH) 122 -0.04 NS -0.02 NS -0.05 NS
Large stems (> 30 cm DBH) 83 -0.03 NS 0.02 NS -0.19 NS
Basal Area (m2ha-2) change (t3/t1) 122 <0.01 NS -0.02 NS -0.19 0.03
Note: n = number of plot observations; 122NS = not significant (a = 0.05); P ≤0.01 given in bold. Differences in sample size (n) due to absence of reco83rds of some attributes in certain plots
2.1.3.10 Rainforest
A total of 42 rainforest plots was monitored across the three parks, with the great majority (37) occurring in Kakadu. With two exceptions, all plots sample boundary ecotones with other vegetation types. In this assessment, we present data only from the 40 ecotonal plots. Over the 10 years of records, based on assessment along fixed transects of changes in location of canopy cover conditions, rainforest boundaries in lowland situations were observed to expand slightly (mean 1.2 m), and those in sandstone uplands to contract very slightly (mean –0.2 m), as reflected by changes in measurements of dense canopy cover in quadrats along fixed transects. Similarly, stem basal area was observed to increase by 8% overall, and by 34% for rainforest species in lowland plots, whereas stem basal area declined slightly (–3.5%) for all species, including rainforest species, in sandstone plots (Table 6). Boundary expansion and marked increase of rainforest stem basal area at lowland plots occurred despite high frequencies of mostly low severity fires, whereas decline in basal area at sandstone plots was significantly associated with more severe fires (Table 7).
34

Table 6 Rainforest plot vegetation change and fire regime characteristics (± S.E.M), 1995–2004
Variable Lowland rainforest plts (n=18)
Sandstone rainforest plots (n=22)
Mean change in boundary , t3–t1 (m) 1.24 ± 0.56 (n = 15) –0.17 ± 0.44 (n = 18)
Mean change in Canopy Cover Index, t3/t1 138.4 ± 12.6 (n = 16) 235.1 ± 85.2 (n = 22)
Mean basal area, t1 (m2.ha–1)
– rainforest species 9.7 ± 4.0 (n = 17) 10.5 ± 1.5 (n = 21)
– non-rainforest species 7.4 ± 2.2 (n = 17) 3.0 ± 0.7 (n = 21)
– all species 17.1 ± 3.9 (n = 17) 13.5 ± 1.6 (n = 21)
Mean change in basal area, t3/t1 (%)
- rainforest species 134.4 ± 6.5 (n = 17) 97.2 ± 5.6 (n = 21)
– non-rainforest species 98.4 ± 5.6 (n = 17) 10.3.0 ± 7.8 (n = 21)
– all species 108.3 ± 5.2 (n = 17) 96.5 ± 5.7 (n = 22)
Mean fire frequency 0.58 ± 0.08 (n = 18) 0.2 ± 0.04 (n = 22)
Mean frequency moderate and severe fires 0.12 ± 0.03 (n = 17) 0.13 ± 0.02 (n = 19)
Table 7 Spearman rank correlations between vegetation change with fire regime variables, 1995–2004
Fire regime variables
Fire frequency Frequency moderate and severe fires
Response variable
Lowland Sandstone Lowland Sandstone
n rs P n rs P n rs P n rs P
Change in boundary (t3–t1) 15 0.39 NS 17 -0.29 NS 15 0.16 NS 14 -0.39 NS
Change in basal area (t3/t1) 17 0.16 NS 22 -0.23 NS 17 0.13 NS 19 -0.50 0.02
n = no. of plot observations; NS = not significant (a = 0.05).
The above observations follow generally the trends observed at woodland plots over the 10-year monitoring period. In common, (a) woody vegetation structural components on our monitoring plots have tended to increase in lowland situations and decline in sandstone uplands (Tables 4 & 6), and (b) the main apparent driver of these changes is the frequency of severe fires (Tables 5 & 7). In both datasets, fire frequency per se apparently has had relatively little affect on woody change. The importance of severe fires on regional rainforest vegetation, especially on patch margins, is widely reported (eg Russell-Smith & Bowman 1992, Bowman 1994, Prior et al 2007). Recent aerial photo assessments of multi-decadal-scale change in regional rainforest assemblages report net rainforest patch expansion in lowland and hillslope situations in Litchfield (Bowman et al 2001), and lowlands and sandstone uplands in Kakadu (Banfai & Bowman 2006, Bowman & Dingle 2006). However, it is also possible that results reported in the latter sandstone uplands study reflect substantial canopy infilling (associated with decadal trends in increasing rainfall) and issues of scale and sampling methodology, rather than expansion per se (J Freeman pers comm, April 2007). Regardless, Bowman and Dingle (2006) found that ‘forest expansion was negatively correlated with fire activity’, and that exposed forest margins were those most at risk.
35

2.1.3.11 Callitris intratropica
A total of 30 monitoring plots across the three parks sample Callitris populations, with 24 of these occurring in sandstone uplands, and 22 plots containing Callitris in Kakadu. Overall, while mean stem basal area across plots has increased both on lowland (0.84 m2 ha–1) and sandstone (0.21 m2 ha–1) plots over the 10-year period, both mean tree-stem density and density of juveniles has declined markedly – lowland plots: –13.3 tree stems ha-1, –320 juveniles ha–1; sandstone plots: –11 tree stems ha–1, –647 juveniles ha–1. Evidently, contemporary fire regimes are having differential impacts on smaller size classes. The population and fire frequency data for 17 woodland (ie non-ecotonal) plots presented in Figure 7 illustrate the above observations. Particularly concerning is the collapse and/or conspicuous absence of juveniles at many of these plots (Figure 7c). Such observations mirror those made in many other regional studies concerning the impact of contemporary fire regimes on stands and population structures of this previously widespread, fire-sensitive obligate seeder species (eg Bowman & Panton 1993, Bowman et al 2001, Prior et al 2007, Russell-Smith 2006, Edwards & Russell-Smith 2009).
Figure 7 Change in status of Callitris intratropica at respective lowland and sandstone upland woodland monitoring plots in Kakadu, Litchfield and Nitmiluk National Parks, 1995–2004 for (a) tree basal area (b)
density of adult stems (≥5 cm DBH) (c) juvenile <5 cm DBH) stem density and (d) frequency of moderate and high-severity fires.
36
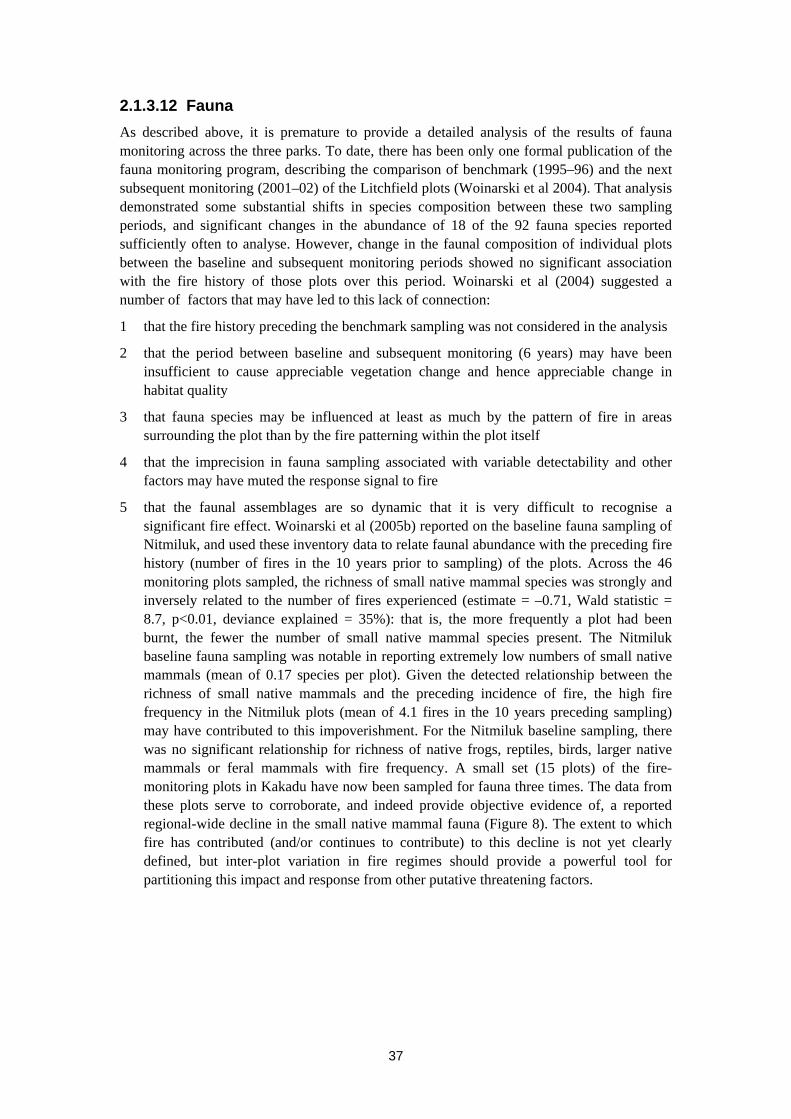
2.1.3.12 Fauna
As described above, it is premature to provide a detailed analysis of the results of fauna monitoring across the three parks. To date, there has been only one formal publication of the fauna monitoring program, describing the comparison of benchmark (1995–96) and the next subsequent monitoring (2001–02) of the Litchfield plots (Woinarski et al 2004). That analysis demonstrated some substantial shifts in species composition between these two sampling periods, and significant changes in the abundance of 18 of the 92 fauna species reported sufficiently often to analyse. However, change in the faunal composition of individual plots between the baseline and subsequent monitoring periods showed no significant association with the fire history of those plots over this period. Woinarski et al (2004) suggested a number of factors that may have led to this lack of connection:
1 that the fire history preceding the benchmark sampling was not considered in the analysis
2 that the period between baseline and subsequent monitoring (6 years) may have been insufficient to cause appreciable vegetation change and hence appreciable change in habitat quality
3 that fauna species may be influenced at least as much by the pattern of fire in areas surrounding the plot than by the fire patterning within the plot itself
4 that the imprecision in fauna sampling associated with variable detectability and other factors may have muted the response signal to fire
5 that the faunal assemblages are so dynamic that it is very difficult to recognise a significant fire effect. Woinarski et al (2005b) reported on the baseline fauna sampling of Nitmiluk, and used these inventory data to relate faunal abundance with the preceding fire history (number of fires in the 10 years prior to sampling) of the plots. Across the 46 monitoring plots sampled, the richness of small native mammal species was strongly and inversely related to the number of fires experienced (estimate = –0.71, Wald statistic = 8.7, p<0.01, deviance explained = 35%): that is, the more frequently a plot had been burnt, the fewer the number of small native mammal species present. The Nitmiluk baseline fauna sampling was notable in reporting extremely low numbers of small native mammals (mean of 0.17 species per plot). Given the detected relationship between the richness of small native mammals and the preceding incidence of fire, the high fire frequency in the Nitmiluk plots (mean of 4.1 fires in the 10 years preceding sampling) may have contributed to this impoverishment. For the Nitmiluk baseline sampling, there was no significant relationship for richness of native frogs, reptiles, birds, larger native mammals or feral mammals with fire frequency. A small set (15 plots) of the fire-monitoring plots in Kakadu have now been sampled for fauna three times. The data from these plots serve to corroborate, and indeed provide objective evidence of, a reported regional-wide decline in the small native mammal fauna (Figure 8). The extent to which fire has contributed (and/or continues to contribute) to this decline is not yet clearly defined, but inter-plot variation in fire regimes should provide a powerful tool for partitioning this impact and response from other putative threatening factors.
37
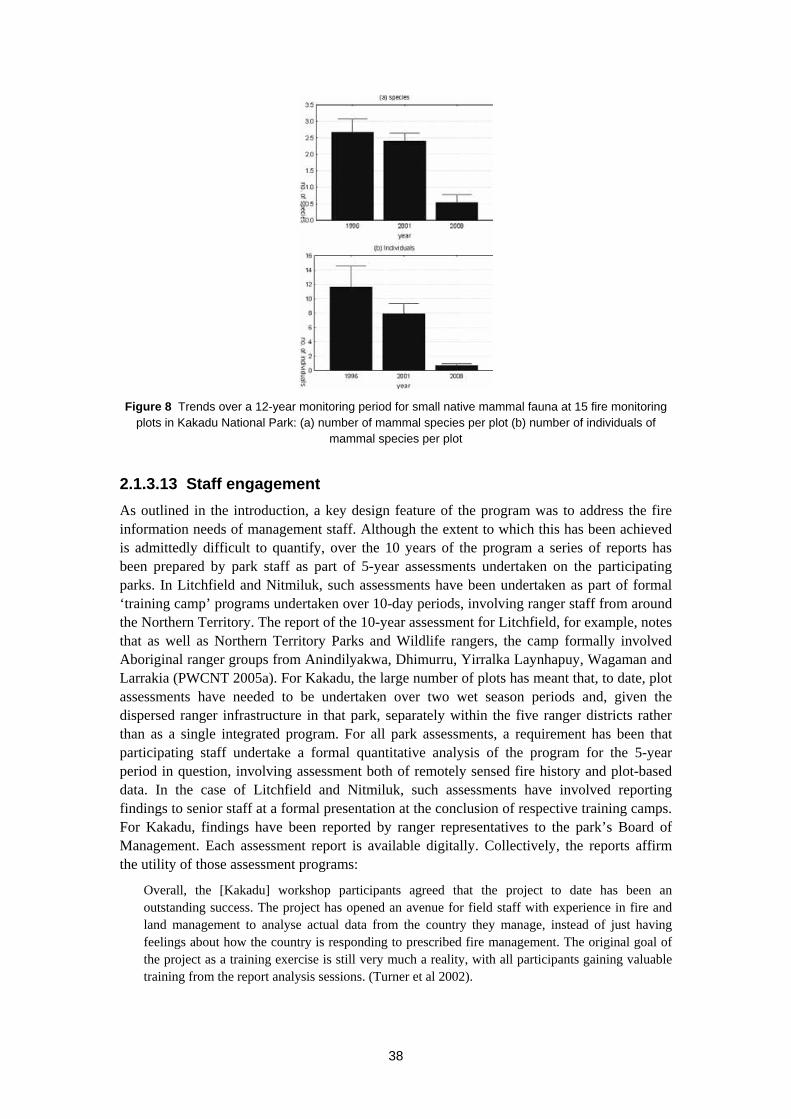
38
Figure 8 Trends over a 12-year monitoring period for small native mammal fauna at 15 fire monitoring
plots in Kakadu National Park: (a) number of mammal species per plot (b) number of individuals of mammal species per plot
2.1.3.13 Staff engagement
As outlined in the introduction, a key design feature of the program was to address the fire information needs of management staff. Although the extent to which this has been achieved is admittedly difficult to quantify, over the 10 years of the program a series of reports has been prepared by park staff as part of 5-year assessments undertaken on the participating parks. In Litchfield and Nitmiluk, such assessments have been undertaken as part of formal ‘training camp’ programs undertaken over 10-day periods, involving ranger staff from around the Northern Territory. The report of the 10-year assessment for Litchfield, for example, notes that as well as Northern Territory Parks and Wildlife rangers, the camp formally involved Aboriginal ranger groups from Anindilyakwa, Dhimurru, Yirralka Laynhapuy, Wagaman and Larrakia (PWCNT 2005a). For Kakadu, the large number of plots has meant that, to date, plot assessments have needed to be undertaken over two wet season periods and, given the dispersed ranger infrastructure in that park, separately within the five ranger districts rather than as a single integrated program. For all park assessments, a requirement has been that participating staff undertake a formal quantitative analysis of the program for the 5-year period in question, involving assessment both of remotely sensed fire history and plot-based data. In the case of Litchfield and Nitmiluk, such assessments have involved reporting findings to senior staff at a formal presentation at the conclusion of respective training camps. For Kakadu, findings have been reported by ranger representatives to the park’s Board of Management. Each assessment report is available digitally. Collectively, the reports affirm the utility of those assessment programs:
Overall, the [Kakadu] workshop participants agreed that the project to date has been an outstanding success. The project has opened an avenue for field staff with experience in fire and land management to analyse actual data from the country they manage, instead of just having feelings about how the country is responding to prescribed fire management. The original goal of the project as a training exercise is still very much a reality, with all participants gaining valuable training from the report analysis sessions. (Turner et al 2002).

We were exposed to a wide range of activities, such as collecting, entering and analysing floristic data – this was the first experience for many of us in this type of monitoring work. Learning how to use GIS to digitise fire scars on maps from satellite imagery was also of great benefit. Overall, rangers will be able to apply their newly acquired skills in their own parks and contribute to improved park management practices … Through meeting with other rangers, a greater appreciation of how other parks operate was achieved. The relationships developed between the participants during the entire camp will be lasting. (PWCNT 2005b).
Moreover, staff have taken the opportunity to comment on related training issues:
This type of data collection and analysis project is long overdue in Kakadu National Park, and, with recent impacts such as weeds like Gamba Grass and Mission Grass that are likely to impact on fire regimes, these baseline data will become more and more important. The use of Geographical Information Systems (GIS) and database programs are well utilised in other situations outside the Park, and the value of these management tools cannot be understated. A recommendation of this workshop is that specific training be given to staff in aspects of GIS and database use, design, and maintenance… (Turner et al 2002)
Although participant feedback from these assessment and training exercises reinforces the practical value of the monitoring program to respective park management authorities, it remains an issue of significant concern to the authors that – along with cultural and resource management monitoring programs in general and despite the significance of fire management in particular to regional ecological processes (see below) – fire-monitoring programs on these parks continue to require repeated justification in seemingly ever-constrained conservation management budgets. To date, the program has been driven largely by the ongoing commitment of concerned individuals as opposed to structured institutionalised support. Edwards et al (2003: Table 2) provide an estimate that fire monitoring in Kakadu constitutes about 1% of the annual park budget when annualised over 5-year periods. We argue that, in the absence of rigorous monitoring data and defined quantitative objectives, it is not possible to assess the effectiveness or otherwise of fire-management programs and to respond to management challenges in an adaptive process.
2.1.3.14 Value of the monitoring program – strengths and weaknesses
In the introduction, we indicated a number of requirements that the monitoring program was designed to address. In preceding sections we have established that the program effectively provides for ongoing development of:
(a) satellite imagery-derived fire history databases of the parks and
(b) photographic and numerical databases describing vegetation and vertebrate fauna responses to ambient fire regimes, as quantitative means for
(c) assessing changes in status and condition of habitats and at least common species, and
(d) potentially, assessing management success with respect to stated objectives. As well, we have seen that the program generally addresses the daily (eg NAFI website) and ecological (eg monitoring plot database) fire information needs of park management staff, as well as incorporating formal, albeit occasional, training associated with plot re-assessment exercises. Below we discuss a number of components and issues requiring further consideration.
39
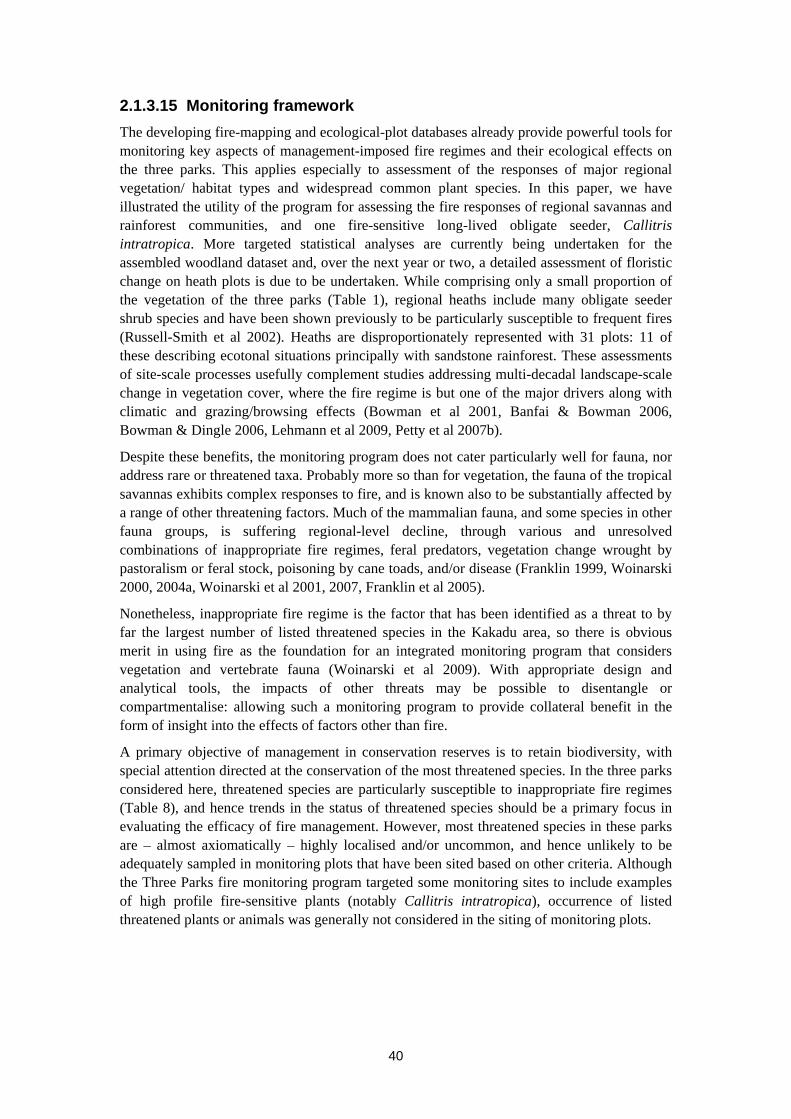
2.1.3.15 Monitoring framework
The developing fire-mapping and ecological-plot databases already provide powerful tools for monitoring key aspects of management-imposed fire regimes and their ecological effects on the three parks. This applies especially to assessment of the responses of major regional vegetation/ habitat types and widespread common plant species. In this paper, we have illustrated the utility of the program for assessing the fire responses of regional savannas and rainforest communities, and one fire-sensitive long-lived obligate seeder, Callitris intratropica. More targeted statistical analyses are currently being undertaken for the assembled woodland dataset and, over the next year or two, a detailed assessment of floristic change on heath plots is due to be undertaken. While comprising only a small proportion of the vegetation of the three parks (Table 1), regional heaths include many obligate seeder shrub species and have been shown previously to be particularly susceptible to frequent fires (Russell-Smith et al 2002). Heaths are disproportionately represented with 31 plots: 11 of these describing ecotonal situations principally with sandstone rainforest. These assessments of site-scale processes usefully complement studies addressing multi-decadal landscape-scale change in vegetation cover, where the fire regime is but one of the major drivers along with climatic and grazing/browsing effects (Bowman et al 2001, Banfai & Bowman 2006, Bowman & Dingle 2006, Lehmann et al 2009, Petty et al 2007b).
Despite these benefits, the monitoring program does not cater particularly well for fauna, nor address rare or threatened taxa. Probably more so than for vegetation, the fauna of the tropical savannas exhibits complex responses to fire, and is known also to be substantially affected by a range of other threatening factors. Much of the mammalian fauna, and some species in other fauna groups, is suffering regional-level decline, through various and unresolved combinations of inappropriate fire regimes, feral predators, vegetation change wrought by pastoralism or feral stock, poisoning by cane toads, and/or disease (Franklin 1999, Woinarski 2000, 2004a, Woinarski et al 2001, 2007, Franklin et al 2005).
Nonetheless, inappropriate fire regime is the factor that has been identified as a threat to by far the largest number of listed threatened species in the Kakadu area, so there is obvious merit in using fire as the foundation for an integrated monitoring program that considers vegetation and vertebrate fauna (Woinarski et al 2009). With appropriate design and analytical tools, the impacts of other threats may be possible to disentangle or compartmentalise: allowing such a monitoring program to provide collateral benefit in the form of insight into the effects of factors other than fire.
A primary objective of management in conservation reserves is to retain biodiversity, with special attention directed at the conservation of the most threatened species. In the three parks considered here, threatened species are particularly susceptible to inappropriate fire regimes (Table 8), and hence trends in the status of threatened species should be a primary focus in evaluating the efficacy of fire management. However, most threatened species in these parks are – almost axiomatically – highly localised and/or uncommon, and hence unlikely to be adequately sampled in monitoring plots that have been sited based on other criteria. Although the Three Parks fire monitoring program targeted some monitoring sites to include examples of high profile fire-sensitive plants (notably Callitris intratropica), occurrence of listed threatened plants or animals was generally not considered in the siting of monitoring plots.
40
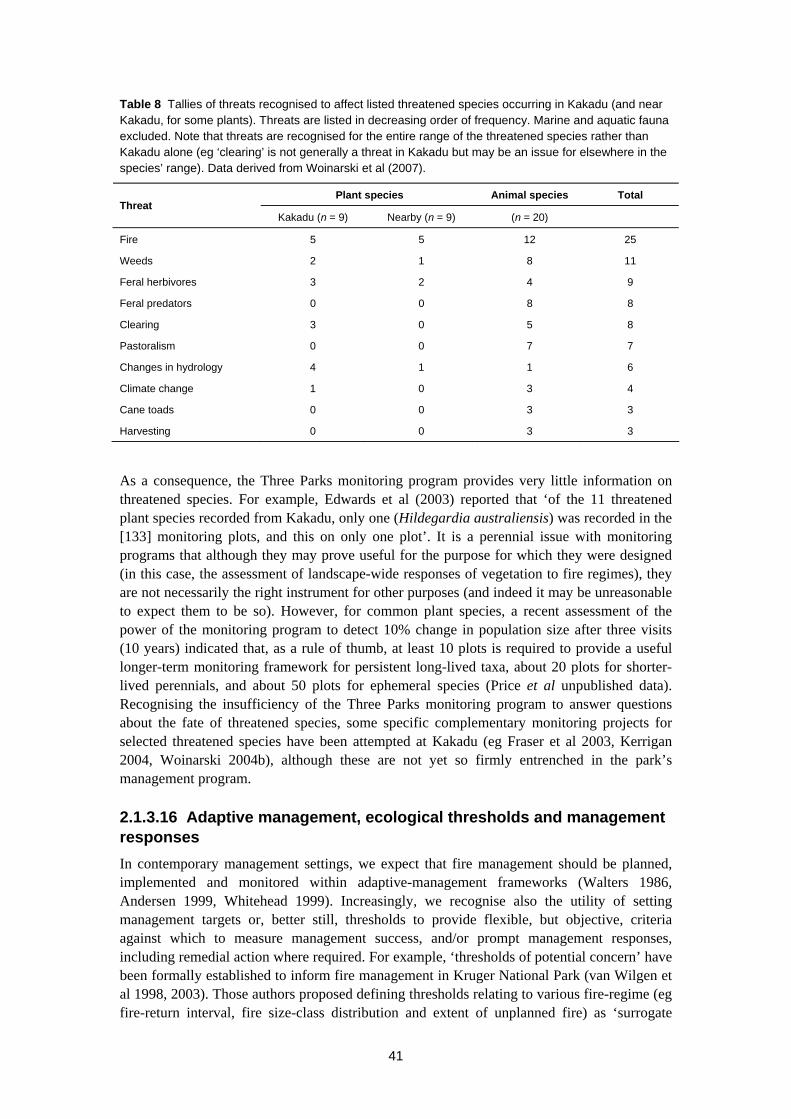
Table 8 Tallies of threats recognised to affect listed threatened species occurring in Kakadu (and near Kakadu, for some plants). Threats are listed in decreasing order of frequency. Marine and aquatic fauna excluded. Note that threats are recognised for the entire range of the threatened species rather than Kakadu alone (eg ‘clearing’ is not generally a threat in Kakadu but may be an issue for elsewhere in the species’ range). Data derived from Woinarski et al (2007).
Plant species Animal species Total Threat
Kakadu (n = 9) Nearby (n = 9) (n = 20)
Fire 5 5 12 25
Weeds 2 1 8 11
Feral herbivores 3 2 4 9
Feral predators 0 0 8 8
Clearing 3 0 5 8
Pastoralism 0 0 7 7
Changes in hydrology 4 1 1 6
Climate change 1 0 3 4
Cane toads 0 0 3 3
Harvesting 0 0 3 3
As a consequence, the Three Parks monitoring program provides very little information on threatened species. For example, Edwards et al (2003) reported that ‘of the 11 threatened plant species recorded from Kakadu, only one (Hildegardia australiensis) was recorded in the [133] monitoring plots, and this on only one plot’. It is a perennial issue with monitoring programs that although they may prove useful for the purpose for which they were designed (in this case, the assessment of landscape-wide responses of vegetation to fire regimes), they are not necessarily the right instrument for other purposes (and indeed it may be unreasonable to expect them to be so). However, for common plant species, a recent assessment of the power of the monitoring program to detect 10% change in population size after three visits (10 years) indicated that, as a rule of thumb, at least 10 plots is required to provide a useful longer-term monitoring framework for persistent long-lived taxa, about 20 plots for shorter-lived perennials, and about 50 plots for ephemeral species (Price et al unpublished data). Recognising the insufficiency of the Three Parks monitoring program to answer questions about the fate of threatened species, some specific complementary monitoring projects for selected threatened species have been attempted at Kakadu (eg Fraser et al 2003, Kerrigan 2004, Woinarski 2004b), although these are not yet so firmly entrenched in the park’s management program.
2.1.3.16 Adaptive management, ecological thresholds and management responses
In contemporary management settings, we expect that fire management should be planned, implemented and monitored within adaptive-management frameworks (Walters 1986, Andersen 1999, Whitehead 1999). Increasingly, we recognise also the utility of setting management targets or, better still, thresholds to provide flexible, but objective, criteria against which to measure management success, and/or prompt management responses, including remedial action where required. For example, ‘thresholds of potential concern’ have been formally established to inform fire management in Kruger National Park (van Wilgen et al 1998, 2003). Those authors proposed defining thresholds relating to various fire-regime (eg fire-return interval, fire size-class distribution and extent of unplanned fire) as ‘surrogate
41

measures’ for status of biodiversity generally. Consistent exceeding of the unplanned fire threshold resulted in a substantial change in fire-management policy and practice in 2002 (van Wilgen et al 2004).
Despite evident problems with contemporary fire regimes on each of the three parks, particularly as these affect fire-sensitive flora and fauna (eg results presented here for Callitris and small mammals), the management response has mostly been muted. Although to some genuine extent that lack of response has been dictated by limited available resourcing, it serves to underline the inherent mismatch between expectations that park staff emphasise management of infrastructure and tourists, while also protecting the very values that the reserves were established to maintain in perpetuity. Nonetheless, it is salutary to reflect on recent fire-management experience in Kakadu where – in 2001, 2004 and 2006 – very large fires burnt through biodiversity-rich areas of the sandstone uplands. In response, Kakadu has developed a fire management plan that incorporates thresholds criteria specifically for the Arnhem plateau (Petty et al 2007a). Assessments included within that planning document, and independently (Brennan 2008), establish that ‘ecological management thresholds’ relating to average fire frequency in fire-sensitive habitats have been very substantially exceeded both over the period 1990–2006, and especially so in the period 2001–2006. For example, 42% of fire-sensitive sandstone heath communities were burnt at least twice within 6 years (Brennan 2008) whereas the minimum fire-return period threshold is given as 5 years in the plan. Contemporary fire regime impacts on heaths of the Arnhem plateau, including those in Kakadu and Nitmiluk, are considered so dire as to warrant them being nominated as an ‘endangered community’ under Australian environmental legislation (WWF 2005).
Importantly, Kakadu has responded constructively by resourcing a potentially effective plateau fire-management program that complements the endeavours of Western Arnhem Land Fire Abatement (WALFA) partners over the remainder of the plateau. This example is perhaps the first instance since the establishment of the Three Parks fire monitoring program where the program itself has played a significant role in informing and eliciting an adaptive management response. John Woinarski and others (2009) have outlined the need for further changes in fire-management practice based on substantial, albeit incomplete, evidence from vertebrate monitoring data. Rather than see fire/biodiversity monitoring programs as an expensive hindrance, we set a challenge to those responsible for park management budgets – and the national ecological bureaucracy specifically – to better understand the essential value of long-term monitoring programs in assisting staff, traditional owners and respective park management programs to learn from, adapt and deliver the very outcomes espoused in worthy plans of management and lofty vision statements.
Acknowledgments
This paper is dedicated to our ranger colleagues, especially those not listed as authors who were instrumental in establishing the program – Phil Hauser (Nitmiluk) and Greg Spiers (Kakadu), and Paul Ryan who developed the original database and remote sensing capability. Assessments have been undertaken by large numbers of staff from all three parks, and more broadly from respective participating organisations (Parks Australia, Parks and Wildlife Service of the Northern Territory). Many thanks go to contributing botanists including Kym Brennan, Ian Cowie, Judy Egan, Bob Harwood, Raelee Kerrigan, Diane Lucas, Carrie Michell and Jenny Risler. Fauna sampling of fire plots has been a major logistical challenge, involving many people. Among many others, we’d like to thank particularly Alaric Fisher, Kym Brennan, Damian Milne, Martin Armstrong, Michelle Watson, Jenni Low Choy, Gay Crowley, Tony
42
Griffiths, Mani Berghout, Mark Ziembicki, Riikka Hokkanen, Lindley McKay, Tida Nou, Rod Kennett and Scott Morrison.
References
Andersen AN 1999 Fire management in northern Australia: beyond command-and-control. Australian Biologist 12, 63–70.
Andersen AN, Cook GD, Corbett LK, Douglas MM, Eager RW, Russell-Smith J, Setterfield SA, Williams RJ & Woinarski JCZ 2005. Fire frequency and biodiversity conservation in Australian tropical savannas: implications from the Kapalga fire experiment. Austral Ecology 30, 155–167.
Andersen AN & McKaige BJ 1997. Burning issues: communicating fire research in Australia. In Ecology for everyone: Communicating ecology to scientists, the public and the politicians. eds Wills & RJ Hobbs, Surrey Beatty and Sons, Sydney, 88–96.
Banfai DS & Bowman DMJS 2006. Forty years of lowland monsoon rainforest expansion in Kakadu National Park, northern Australia. Biological Conservation 131, 553–565.
Bowman DMJS & Dingle JK 2006. Late 20th century landscape-wide expansion of Allosyncarpia ternata (Myrtaceae) forest in Kakadu National Park, northern Australia. Australian Journal of Botany 54, 707–715.
Bowman DMJS & Panton WJ 1993. Decline of Callitris intratropica in the Northern Territory: implications for pre- and post-colonisation fire regimes. Journal of Biogeography 20, 373–381.
Bowman DMJS, Price O, Whitehead PJ & Walsh A 2001. The ‘wilderness effect’ and the decline of Callitris intratropica on the Arnhem Land Plateau, northern Australia. Australian Journal of Botany 49, 665–672.
Bowman DMJS, Walsh A & Milne DJ 2001. Forest expansion and grassland contraction within a Eucalyptus savanna matrix between 1941 and 1994 at Litchfield National Park in the Australian monsoon tropics. Global Ecology and Biogeography 10, 535–548.
Bowman DMJS, Zhang Y, Walsh A & Williams RJ 2003. Experimental comparison of four remote sensing techniques to map tropical savanna fire-scars using LANDSAT-TM imagery. International Journal of Wildland Fire 12, 341–348.
Brennan K 2008. An aerial assessment of the incidence of fire in rocky (and associated) environments in Kakadu National Park during the 2006 dry season. Unpublished report to Kakadu National Park. Northern Territory Parks and Wildlife Service, Berrimah.
Edwards A, Hauser P, Anderson M, McCartney J, Armstrong M, Thackway R, Allan GE & Russell-Smith J 2001. A tale of two parks: contemporary fire regimes of Litchfield and Nitmiluk National Parks, monsoonal northern Australia. International Journal of Wildland Fire 10, 79–89.
Edwards A, Kennett R, Price O, Russell-Smith J, Spiers G & Woinarski J 2003. Monitoring the impacts of fire regimes on vegetation in northern Australia an example from Kakadu National Park. International Journal of Wildland Fire 12, 427–440.
Edwards AC & Russell-Smith J 2009. Ecological thresholds and the status of fire-sensitive vegetation in western Arnhem Land, northern Australia: implications for management. In Culture, ecology and economy of fire management in North Australian savannas: rekindling
43
the Wurrk tradition, eds J Russell-Smith, PJ Whitehead & P Cooke, CSIRO Publishing, Collingwood, 229–256.
Franklin DC 1999. Evidence of disarray amongst granivorous bird assemblages in the savannas of northern Australia, a region of sparse human settlement. Biological Conservation 90, 53–68.
Franklin DC, Whitehead PJ, Pardon G, Matthews J, McMahon P & McIntyre D 2005. Geographic patterns and correlates of the decline of granivorous birds in northern Australia. Wildlife Research 32, 399–408.
Fraser F, Lawson V, Morrison S, Christopherson P, McGregor S & Rawlinson M 2003. Fire management experiment for the declining Partridge Pigeon, Kakadu National Park. Ecological Management & Restoration 4, 94–102.
Garde M 2009. The language of fire: seasonality, resources and landscape burning on the Arnhem Land Plateau. In Culture, ecology and economy of fire management in North Australian savannas: rekindling the Wurrk tradition, eds J Russell-Smith, PJ Whitehead & P Cooke, CSIRO Publishing, Collingwood, 85–164.
Kakadu National Park 2007. Kakadu National Park Plan of Management. Director of National Parks, Australian Government, Canberra.
Kerrigan R 2004. Kakadu threatened flora report. Volume 2: Results of a threatened flora survey 2004. Northern Territory Department of Infrastructure Planning and Environment, Darwin.
Lehmann C, Prior LD & Bowman DMJS 2009. Multi-decadal dynamics of tree cover in an Australian tropical savanna. Austral Ecology 34, 601–612.
Litchfield National Park 1998. Litchfield National Park Fire Management Plan. Parks and Wildlife Commission of the Northern Territory, Darwin.
Murphy BP, Russell-Smith J, Watt FA & Cook GD 2009. Fire management and woody biomass carbon stocks in mesic savannas. In Culture, ecology and economy of fire management in North Australian savannas: rekindling the Wurrk tradition, eds J Russell-Smith, PJ Whitehead & P Cooke, CSIRO Publishing, Collingwood, 361–378.
Nitmiluk National Park 2002. Nitmiluk (Katherine Gorge) plan of management. Parks and Wildlife Commission of the Northern Territory, Darwin.
O’Leary P, Sharpe C, McMahon K, Russell-Smith J & Edwards A 2001. Litchfield National Park fire monitoring plot survey and analysis. Technical Report no 67, Parks & Wildlife Commission of the Northern Territory, and Bushfires Council of the Northern Territory, Darwin.
Petty AM, Alderson J, Muller R, Scheibe O, Wilson K & Winderlich S 2007a. Kakadu National Park, Arnhem Land Plateau Fire Management Plan. Kakadu National Park, Jabiru, Northern Territory.
Petty AM, Werner PA, Lehmann CER, Riley JE, Banfai DS & Elliott LP 2007b. Savanna responses to feral buffalo in Kakadu National Park, Australia. Ecological Monographs 77, 441–463.
Price O, Russell-Smith J & Edwards A 2003. Fine-scale patchiness of different fire intensities in sandstone heath vegetation in northern Australia. International Journal of Wildland Fire 12, 227–236.
44
Price O, Edwards A, Connors G, Woinarski J, Ryan G, Turner A & Russell-Smith J 2005. Fire heterogeneity in Kakadu National Park: 1980–2000. Wildlife Research 32, 425–433.
Prior LD, Brook BW, Williams RJ, Werner PA, Bradshaw CJA and Bowman DMJS 2006. Environmental and allometric drivers of tree growth rates in a north Australian savanna. Forest Ecology and Management 234, 164–180.
Prior LD, Bowman DMJS & Brooke BW 2007. Growth and survival of two north Australian relictual tree species, Allosyncarpia ternata (Myrtaceae) and Callitris intratropica (Cupressaceae). Ecological Research 22, 228–236.
Prior LD, Murphy BP & Russell-Smith J 2009. Environmental and demographic correlates of tree recruitment and mortality in north Australian savannas. Forest Ecology and Management 257, 66–74
PWCNT (Parks & Wildlife Commission of the Northern Territory) 2000. Nitmiluk fire study ranger training camp, 20–31 March 2000. Parks and Wildlife Commission of the Northern Territory and Bushfires Council of the Northern Territory, Katherine.
PWCNT 2005a. Litchfield National Park fire monitoring plot survey and analysis. Parks & Wildlife Commission of the Northern Territory, and Bushfires Council of the Northern Territory, Darwin.
PWCNT 2005b. Nitmiluk National Park fire monitoring plot survey and analysis: Ranger training camp 4–15 April 2005. Parks and Wildlife Commission of the Northern Territory WCNT and Bushfires Council of the Northern Territory, Katherine.
Russell-Smith J 2006. Recruitment dynamics of the long-lived obligate seeders Callitris intratropica (Cupressaceae) and Petraeomyrtus punicea (Myrtaceae). Australian Journal of Botany 54, 479–485.
Russell-Smith J & Bowman DMJS 1992. Conservation of monsoon rainforest isolates in the Northern Territory, Australia. Biological Conservation 59, 51–63.
Russell-Smith J & Edwards A 2006. Seasonality and fire severity in savanna landscapes of monsoonal northern Australia. International Journal of Wildland Fire 15, 541–550.
Russell-Smith J & Ryan PG 1996. Establishing a photo-point monitoring system in Kakadu National Park: rationale and protocol. In Proceedings of the Fire Ecology Workshop, Darwin, August 1994. Parks and Wildlife Commission of the Northern Territory, Darwin, 80–91.
Russell-Smith J, Ryan PG & DuRieu R 1997. A LANDSAT MSS-derived fire history of Kakadu National Park, monsoonal northern Australia, 1980–1994: seasonal extent, frequency and patchiness. Journal of Applied Ecology 34, 748–766.
Russell-Smith J, Ryan PG, Klessa D, Waight G & Harwood R 1998. Fire regimes, fire-sensitive vegetation, and fire management of the sandstone Arnhem Plateau, monsoonal northern Australia. Journal of Applied Ecology 35, 829–846.
Russell-Smith J, Ryan PG & Cheal D 2002. Fire regimes and the conservation of sandstone heath in monsoonal northern Australia: frequency, interval, patchiness. Biological Conservation 104, 91–106.
Russell-Smith J, Whitehead PJ, Cook GD & Hoare JL 2003. Response of Eucalyptus-dominated savanna to frequent fires: lessons from Munmarlary, 1973–1996. Ecological Monographs 73, 349–375.
45

Stocker GC & Mott JJ 1981. Fire in the tropical forests and woodlands of northern Australia. In Fire and the Australian Biota. eds AM Gill, RM Groves & IR Noble, Australian Academy of Science, Canberra, 425–439.
Turner A, Fordham B, Hamann S, Morrison S, Muller R, Pickworth A, Edwards A & Russell- Smith J 2002. Kakadu National Park fire monitoring plot survey and analysis. Technical Report no 72. Kakadu National Park, and Bushfires Council of the Northern Territory, Darwin.
van Wilgen BW, Biggs HC & Potgieter ALF 1998. Fire management and research in the Kruger National Park, with suggestions on the detection of thresholds of potential concern. Koedoe 41, 69–87.
van Wilgen BW, Govender N, Biggs HC, Ntsala D & Funda XN 2004. Response of savanna fire regimes to changing fire-management policies in a large African National Park. Conservation Biology 18, 1533–1540.
van Wilgen BW, Trollope WSW, Biggs HC, Potgieter ALF & Brockett BH 2003. Fire as a driver of ecosystem variability. In The Kruger experience: Ecology and management of savanna heterogeneity. eds JT du Toit, KH Rogers & HC Biggs, Island Press, Washington DC, 149–170.
Walker J 1981. Fuel dynamics in Australian vegetation. In Fire and the Australian biota. eds AM Gill, RM Groves & IR Noble, Australian Academy of Science, Canberra, 101–127.
Walters C 1986. Adaptive management of renewable resources. Macmillan, New York.
Whitehead PJ 1999. Promoting conservation in landscapes subject to change: lessons from the Mary River. Australian Biologist 12, 50–62.
Williams RJ, Cook GD, Gill AM & Moore PHR 1999. Fire regime, fire intensity and tree survival in a tropical savanna in northern Australia. Australian Journal of Ecology 24, 50–59.
Williams RJ, Gill AM & Moore PHR 1998. Seasonal changes in fire behaviour in a tropical savanna in northern Australia. International Journal of Wildland Fire 8, 227–239.
Williams RJ, Griffiths AD & Allan GE 2002. Fire regimes and biodiversity in the wet-dry tropical landscapes of northern Australia. In Flammable Australia: The fire regimes and biodiversity of a continent. eds RA Bradstock, JE Williams & AM Gill, Cambridge University Press, Cambridge, UK, 281–304.
Williams RJ, Woinarski JCZ & Andersen AN 2003a. Fire experiments in northern Australia: contributions to ecological understanding and biodiversity conservation in tropical savannas. International Journal of Wildland Fire 12, 391–402.
Williams RJ, Gill AM & Moore PHR 2003b. Fire behaviour. In Fire in tropical savannas: The Kapalga experiment. eds AN Andersen, GD Cook & RJ Williams, Springer-Verlag, New York, 33–46.
Woinarski JCZ 2000. The conservation status of rodents in the monsoonal tropics of the Northern Territory. Wildlife Research 27, 421–435.
Woinarski JCZ 2004a. The forest fauna of the Northern Territory: knowledge, conservation and management. In Conservation of Australia’s forest fauna, 2nd edn, ed D Lunney, Royal Zoological Society of New South Wales, Sydney, 36–55.
46
47
Woinarski JCZ (2004b) ‘Threatened plants and animals in Kakadu National Park: a review and recommendations for management’. Unpublished report to Parks Australia North. Parks and Wildlife Commission of the Northern Territory, Darwin.
Woinarski JCZ, Milne D & Wanganeen G 2001. Changes in mammal populations in relatively intact landscapes of Kakadu National Park, Northern Territory, Australia. Austral Ecology 26, 360–370.
Woinarski JCZ, Armstrong M, Price O, McCartney J, Griffiths AD & Fisher A 2004. The terrestrial vertebrate fauna of Litchfield National Park, Northern Territory: monitoring over a 6-year period and response to fire history. Wildlife Research 31, 587–596.
Woinarski JCZ, Williams RJ, Price O & Rankmore B 2005a. Landscapes without boundaries: wildlife and their environments in northern Australia. Wildlife Research 32, 377–388.
Woinarski J, Milne D, Palmer C, Fisher A, Ward S, Risler J, Brennan K & Berghout M 2005b. Fauna monitoring at Nitmiluk fire plots: baseline sampling, 2005. Department of Natural Resources, Environment and the Arts, Darwin.
Woinarski J, Pavey C, Kerrigan R, Cowie I & Ward S 2007. Lost from our landscape: Threatened species of the Northern Territory. Northern Territory Government Printer, Darwin.
Woinarski J, Russell-Smith J, Andersen AN & Brennan K 2009. Fire management and biodiversity of the western Arnhem Land Plateau. In Culture, ecology and economy of fire management in North Australian savannas: rekindling the Wurrk tradition, eds J Russell-Smith, PJ Whitehead & P Cooke, CSIRO Publishing, Collingwood, 201–228.
WWF (World Wildlife Fund) 2005. Nomination for listing Arnhem Plateau sandstone heath as an Endangered Ecological Community under Australia’s Environment Protection and Biodiversity Conservation Act 1999. Unpublished document lodged with the Commonwealth of Australia Dept Environment and Heritage, Canberra. WWF Australia, Darwin.

Part 3 Savanna woodland
Introduction
Tropical savannas extend across nearly one third of the Earth’s and Australia’s surface. The savanna woodlands are one of the most extensive vegetation types in Kakadu National Park and burn frequently. They are predominately dominated by Eucalyptus miniata and Eucalyptus tetradonta complexes, with an open canopy with generally a grassy understorey often dominated by sorghum sp.
48
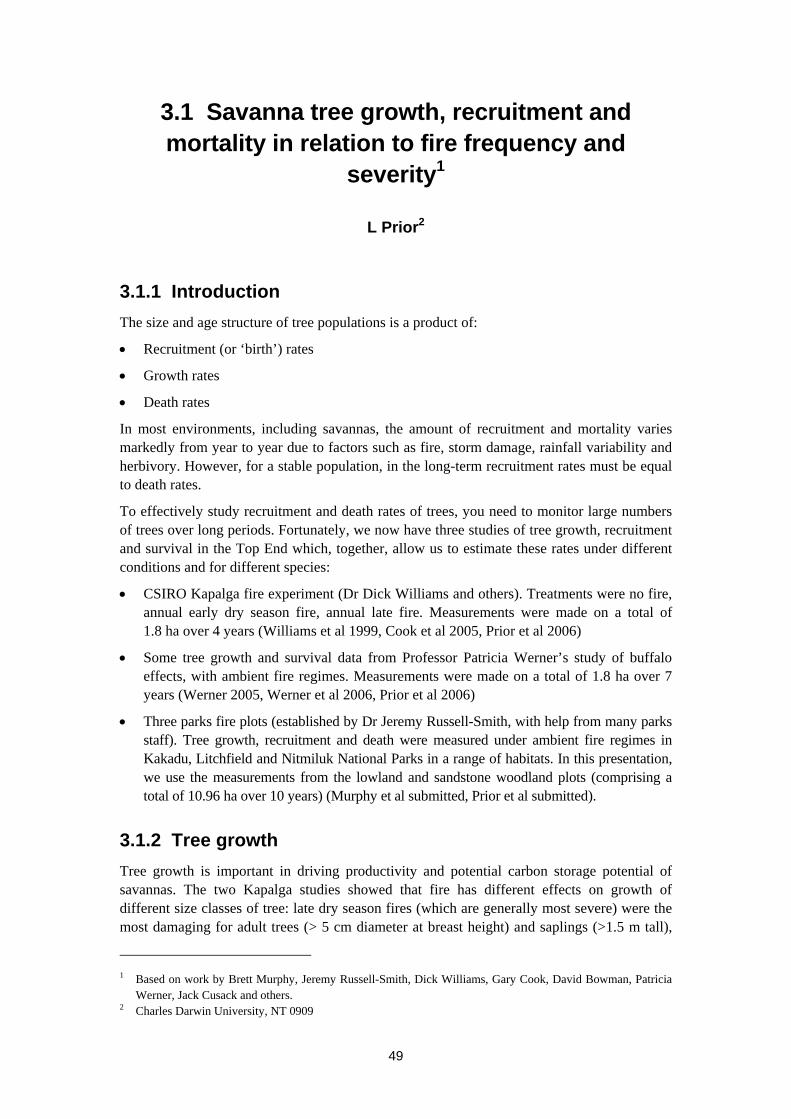
3.1 Savanna tree growth, recruitment and mortality in relation to fire frequency and
severity1
L Prior2
3.1.1 Introduction
The size and age structure of tree populations is a product of:
Recruitment (or ‘birth’) rates
Growth rates
Death rates
In most environments, including savannas, the amount of recruitment and mortality varies markedly from year to year due to factors such as fire, storm damage, rainfall variability and herbivory. However, for a stable population, in the long-term recruitment rates must be equal to death rates.
To effectively study recruitment and death rates of trees, you need to monitor large numbers of trees over long periods. Fortunately, we now have three studies of tree growth, recruitment and survival in the Top End which, together, allow us to estimate these rates under different conditions and for different species:
CSIRO Kapalga fire experiment (Dr Dick Williams and others). Treatments were no fire, annual early dry season fire, annual late fire. Measurements were made on a total of 1.8 ha over 4 years (Williams et al 1999, Cook et al 2005, Prior et al 2006)
Some tree growth and survival data from Professor Patricia Werner’s study of buffalo effects, with ambient fire regimes. Measurements were made on a total of 1.8 ha over 7 years (Werner 2005, Werner et al 2006, Prior et al 2006)
Three parks fire plots (established by Dr Jeremy Russell-Smith, with help from many parks staff). Tree growth, recruitment and death were measured under ambient fire regimes in Kakadu, Litchfield and Nitmiluk National Parks in a range of habitats. In this presentation, we use the measurements from the lowland and sandstone woodland plots (comprising a total of 10.96 ha over 10 years) (Murphy et al submitted, Prior et al submitted).
3.1.2 Tree growth
Tree growth is important in driving productivity and potential carbon storage potential of savannas. The two Kapalga studies showed that fire has different effects on growth of different size classes of tree: late dry season fires (which are generally most severe) were the most damaging for adult trees (> 5 cm diameter at breast height) and saplings (>1.5 m tall),
1 Based on work by Brett Murphy, Jeremy Russell-Smith, Dick Williams, Gary Cook, David Bowman, Patricia
Werner, Jack Cusack and others. 2 Charles Darwin University, NT 0909
49

but early dry season fires were the worst for juveniles (< 1.5 m tall) (Fig 1). Early dry season fires appeared to increase the growth of adult trees, probably through reducing competition from grasses, and perhaps also by releasing nutrients into the soil.
Results from the three parks fire plots were a little different – even the early dry season fires reduced tree growth. Tree growth decreased with increasing fire frequency and, not surprisingly, the effect was larger for late or severe fires than early, or mild to moderate fires (Fig 2). This study also showed that fire severity was more important than season of fire for tree growth.
Juveniles Saplings Adults
Hei
ght i
ncre
men
t (m
yea
r-1)
-0.2
-0.1
0.0
0.1
0.2
0.3
0.4
-0.2
-0.1
0.0
0.1
0.2
0.3
0.4
No fire early late
DBH
incr
emen
t (cm
yea
r-1)
Figure 1 Change in height (juveniles) or diameter at breast height (saplings and adults) in relation to fire season (from Prior et al 2006)
0.00
0.05
0.10
0.15
0.20
0.25
0.0 0.2 0.4 0.6 0.8 1.0
Fire frequency (fires yr-1)
DBH
incr
emen
t (cm
yr-1
)
Mild
ModerateSevere
0.00
0.05
0.10
0.15
0.20
0.25
0.0 0.2 0.4 0.6 0.8 1.0
Fire frequency (fires yr-1)
DBH
incr
emen
t (cm
yr-1
)
Early
Late
Fire frequency (fires year-1)
DBH
incr
emen
t (cm
yea
r-1)
a. Fire severity
b. Fire seasonality
0.00
0.05
0.10
0.15
0.20
0.25
0.0 0.2 0.4 0.6 0.8 1.0
Fire frequency (fires yr-1)
DBH
incr
emen
t (cm
yr-1
)
Mild
ModerateSevere
0.00
0.05
0.10
0.15
0.20
0.25
0.0 0.2 0.4 0.6 0.8 1.0
Fire frequency (fires yr-1)
DBH
incr
emen
t (cm
yr-1
)
Mild
ModerateSevere
0.00
0.05
0.10
0.15
0.20
0.25
0.0 0.2 0.4 0.6 0.8 1.0
Fire frequency (fires yr-1)
DBH
incr
emen
t (cm
yr-1
)
Early
Late
0.00
0.05
0.10
0.15
0.20
0.25
0.0 0.2 0.4 0.6 0.8 1.0
Fire frequency (fires yr-1)
DBH
incr
emen
t (cm
yr-1
)
Early
Late
Fire frequency (fires year-1)
DBH
incr
emen
t (cm
yea
r-1)
a. Fire severity
b. Fire seasonality
Figure 2 The more severe the fire and the more frequent, the worse its effect on growth. Similarly, early fires slightly reduced growth, while late fires had a much larger effect (from Murphy et al submitted).
50

Previous work in Top End savannas suggests that the carbon storage potential of unburnt savanna is about 1–2 tonnes per hectare per year (Williams et al 2004, Beringer et al 2007), and the three parks study found that frequent mild fires reduce this by 0.2 tonnes per hectare per year, moderate fires by 0.4 tonnes per hectare per year, and severe fires by 0.5 tonnes per hectare per year (Murphy et al submitted).
3.1.3 Tree recruitment
Scientists have suggested that in wetter savannas, such as in the Top End, there is a ‘recruitment bottleneck’ caused by frequent fire killing saplings before they can escape the flame zone (Higgins et al 2000). The studies referred to here allow us to test whether this is the case.
Tree recruitment depends on many processes such flowering, seed set, germination, seedling establishment, survival, and resprouting. It is very difficult to measure all these processes, so we simply measured the number of small trees joining the larger diameter size classes.
The Kapalga experiment clearly showed that both the early and late annual fire treatments severely reduced recruitment of trees, and none at all occurred after an unplanned severe fire (Fig 3). In the three parks study, recruitment decreased markedly with fire frequency in the lowland plots, but not in the sandstone ones (Fig 4). Overall recruitment was much lower in the sandstone plots, but we don’t really know the reason for this; it is not easily explained by fire. Interestingly, recruitment was more affected by the season of fire than its severity (Prior et al submitted).
Plot basal area (m2 ha-1)
4 6 8 10 12 14 16 18
Rec
ruits
(per
hec
tare
per
yea
r)
0
50
100
150
200
250
300
EarlyLateNo fireExtreme
No fire
Early
Late
Extreme
Figure 3 Actual (symbols) and modelled (lines) recruitment in the Kapalga fire experiment (calculated from unpublished data of Dick Williams)
3.1.4 Tree death
Tree death was strongly affected by tree size, as well as by fire. Death rates decreased with increasing tree size up to about 20 cm DBH, and remained low until tree size reached 40 to 50 cm DBH, when it increased sharply (Fig 5). Both the Kapalga experiment and the three parks study showed similar effects.
51
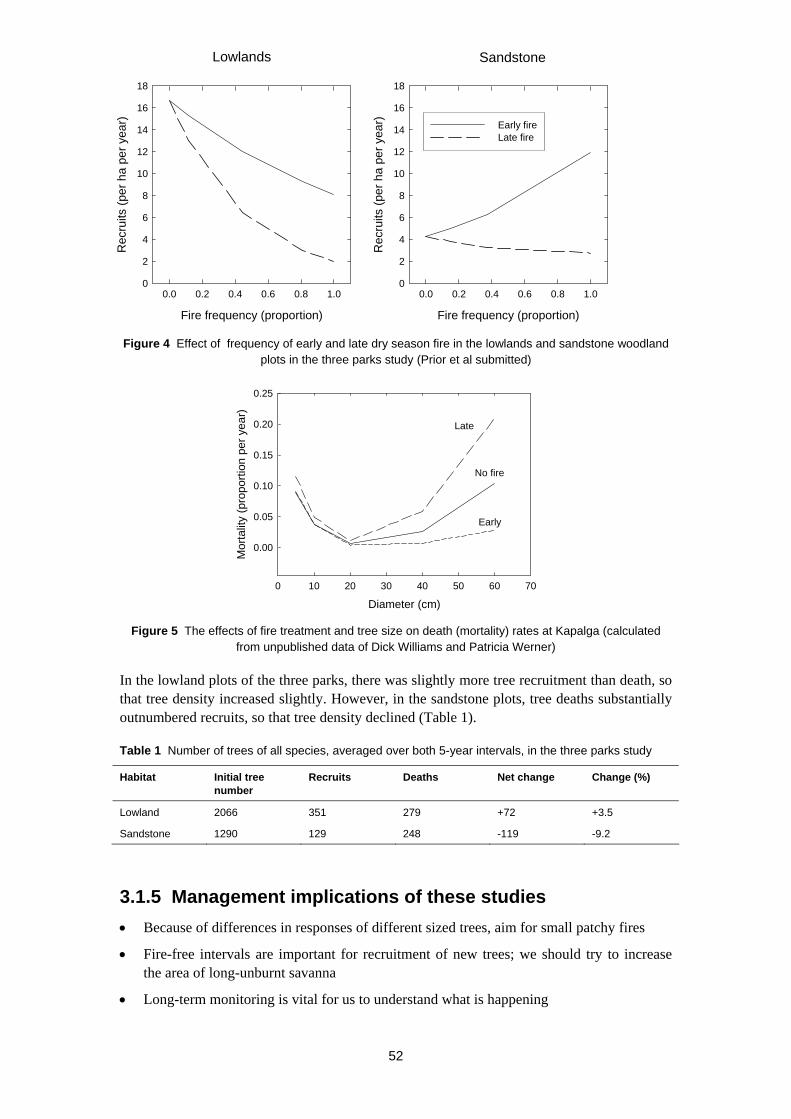
Lowlands Sandstone
0
2
4
6
8
10
12
14
16
18
Fire frequency (proportion)
0.0 0.2 0.4 0.6 0.8 1.0
Rec
ruits
(per
ha
per y
ear)
0
2
4
6
8
10
12
14
16
18
Fire frequency (proportion)
Rec
ruits
(per
ha
per y
ear) Early fire
Late fire
0.0 0.2 0.4 0.6 0.8 1.0
Figure 4 Effect of frequency of early and late dry season fire in the lowlands and sandstone woodland plots in the three parks study (Prior et al submitted)
Diameter (cm)
0 10 20 30 40 50 60 70
Mor
talit
y (p
ropo
rtion
per
yea
r)
0.00
0.05
0.10
0.15
0.20
0.25
Late
No fire
Early
Figure 5 The effects of fire treatment and tree size on death (mortality) rates at Kapalga (calculated from unpublished data of Dick Williams and Patricia Werner)
In the lowland plots of the three parks, there was slightly more tree recruitment than death, so that tree density increased slightly. However, in the sandstone plots, tree deaths substantially outnumbered recruits, so that tree density declined (Table 1).
Table 1 Number of trees of all species, averaged over both 5-year intervals, in the three parks study
Habitat Initial tree number
Recruits Deaths Net change Change (%)
Lowland 2066 351 279 +72 +3.5
Sandstone 1290 129 248 -119 -9.2
3.1.5 Management implications of these studies
Because of differences in responses of different sized trees, aim for small patchy fires
Fire-free intervals are important for recruitment of new trees; we should try to increase the area of long-unburnt savanna
Long-term monitoring is vital for us to understand what is happening
52
53
References
Beringer J, Hutley LB, Tapper NJ, Cernusak LA 2007. Savanna fires and their impact on net ecosystem productivity in North Australia. Global Change Biology 13, 990–1004.
Cook GD, Liedloff AC, Eager RW, Chen X, Williams RJ, O’Grady AP & Hutley LB 2005. The estimation of carbon budgets of frequently burnt tree stands in savannas of northern Australia, using allometric analysis and isotopic discrimination. Australian Journal of Botany 53, 621–630.
Murphy BP, Russell-Smith J & Prior LD (in press) Frequent fires reduce tree growth in northern Australian savannas: implications for tree demography and carbon sequestration. Global Change Biology, doi: 10.1111/j.1365-2486.2009.01933.x
Prior LD, Brook BW, Williams RJ, Werner PA, Bradshaw CJA & Bowman D 2006. Environmental and allometric drivers of tree growth rates in a north Australian savanna. Forest Ecology and Management 234, 164–180.
Prior LD, Murphy BP & Russell-Smith J 2009. Environmental and demographic correlates of tree recruitment and mortality in north Australian savannas. Forest Ecology and Management 257, 66–74.
Werner PA 2005. Impact of feral water buffalo and fire on growth and survival of mature savanna trees: An experimental field study in Kakadu National Park, northern Australia. Austral Ecology 30, 625–647.
Werner PA, Cowie ID & Cusack JS 2006. Impact of feral water buffalo on juvenile trees in savannas of northern Australia: An experimental field study in Kakadu National Park. Australian Journal of Botany 54, 283–296.
Williams RJ, Cook GD, Gill AM & Moore PHR 1999. Fire regime, fire intensity and tree survival in a tropical savanna in northern Australia. Australian Journal of Ecology 24, 50–59.
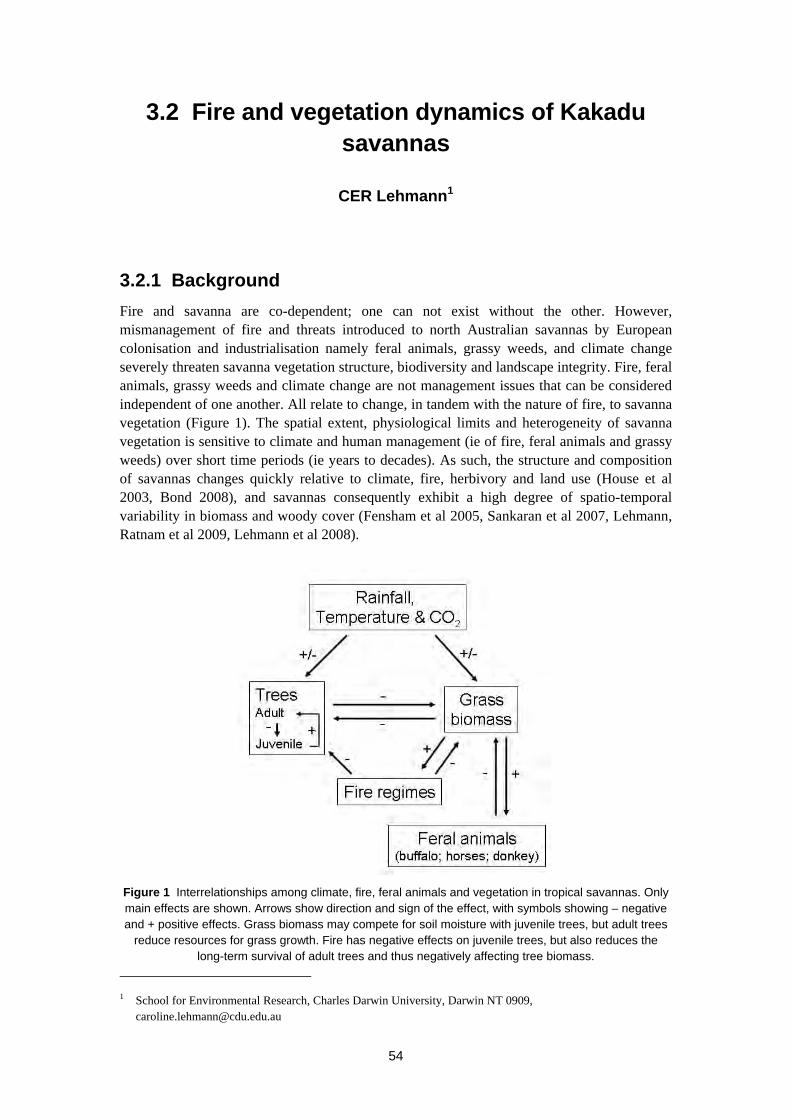
3.2 Fire and vegetation dynamics of Kakadu savannas
CER Lehmann1
3.2.1 Background
Fire and savanna are co-dependent; one can not exist without the other. However, mismanagement of fire and threats introduced to north Australian savannas by European colonisation and industrialisation namely feral animals, grassy weeds, and climate change severely threaten savanna vegetation structure, biodiversity and landscape integrity. Fire, feral animals, grassy weeds and climate change are not management issues that can be considered independent of one another. All relate to change, in tandem with the nature of fire, to savanna vegetation (Figure 1). The spatial extent, physiological limits and heterogeneity of savanna vegetation is sensitive to climate and human management (ie of fire, feral animals and grassy weeds) over short time periods (ie years to decades). As such, the structure and composition of savannas changes quickly relative to climate, fire, herbivory and land use (House et al 2003, Bond 2008), and savannas consequently exhibit a high degree of spatio-temporal variability in biomass and woody cover (Fensham et al 2005, Sankaran et al 2007, Lehmann, Ratnam et al 2009, Lehmann et al 2008).
Figure 1 Interrelationships among climate, fire, feral animals and vegetation in tropical savannas. Only main effects are shown. Arrows show direction and sign of the effect, with symbols showing – negative and + positive effects. Grass biomass may compete for soil moisture with juvenile trees, but adult trees
reduce resources for grass growth. Fire has negative effects on juvenile trees, but also reduces the long-term survival of adult trees and thus negatively affecting tree biomass.
1 School for Environmental Research, Charles Darwin University, Darwin NT 0909,
54
3.2.2 Environmental controls on fire and vegetation
First and foremost, there is strong evidence that the effects on ecosystem dynamics of one environmental control (eg. fire) varies as a function of another (eg. mean rainfall or atmospheric CO2 levels) (Beerling & Osborne 2006). Thus, fire exerts very strong direct and indirect controls over savanna vegetation structure. Tropical savannas are a unique world biome due to the frequency and importance of disturbance by fire (Bowman et al 2009). Importantly, savanna fires generally only burn the herbaceous layer, consuming grass biomass, killing shrubs and young trees, but not adult trees (Bond 2008, Hoffmann et al 2009). Fire thus consumes only a small proportion of total plant biomass, but very importantly alters the growth and survival of trees and shrubs and changes the nature of tree-grass competition.
Mean annual rainfall (MAR) and the seasonality of rainfall are key determinants of the structure of savannas (Scholes & Archer 1997). MAR and the seasonality of rainfall sets an upper bound on productivity and plant growth rates but also the frequency of disturbance by fire (Archibald et al 2009, Sankaran et al 2005). Physically, frequent fire is dependent on the presence of a grass layer; exclusion of grasses is dependent upon the density and structure of the tree canopy and fire reduces tree density (Bond 2008). Thus rainfall, the seasonality of rainfall and other environmental controls such as CO2 levels and temperature act to determine the rate at which closure of the tree canopy can occur, the density of woody plants at which grasses are eliminated, the maximum productivity of grasses and the probability of fire occurring.
The world’s changing climate and atmospheric CO2 levels are inducing change in global gradients of plant productivity, and similarly this will induce shifts in savanna vegetation via simultaneous change in fire and vegetation. Future changes to CO2 are projected to reach 700 ppmv (IPCC 2007, Fourth assessment). In addition to CO2 impacts on climate, CO2 affects plant productivity and alters the competitive advantage of savanna trees and grasses because they respond in physiologically different ways to changes in CO2 levels (Leakey 2009). The result being that trees will grow faster, but there will be little net difference in the growth rates of grasses. Climate warming will increase leaf temperatures, increasing vapour pressure deficits and reducing soil moisture. During times of the year when juvenile and adult trees normally experience optimal temperatures for growth and photosynthesis, this capacity could be reduced, offsetting the growth benefits for trees associated with elevated CO2 (Sage & Kubien 2003). These complex interactions between climate and vegetation drive the likelihood and spatial extent of fire within the system.
Feral grazers have numerous direct and indirect impacts on savanna vegetation structure. Directly, these include reductions in biomass and reproductive capacity of the grass layer, thus altering of partitioning of resources such as water, nutrients and light between grasses and trees. Grazers also generate strong indirect effects on grass or tree growth and mortality via interactions with fire. Grazers reduce grass fuel-load and thus generally reduce fire frequency and severity, altering the spatial extent of fire and generally promoting increases in tree cover and densities (Lehmann et al 2008).
3.2.3 Dynamics of savanna vegetation across Kakadu
The most important way in which fire limits savanna tree cover is thought to be via its effects on sapling trees, which need several years without fire to grow large enough to enter the canopy (Lehmann, Prior et al 2009b). This is well evidenced from multiple studies within Kakadu examining growth rates, tree mortality, tree recruitment and stand demographics
55
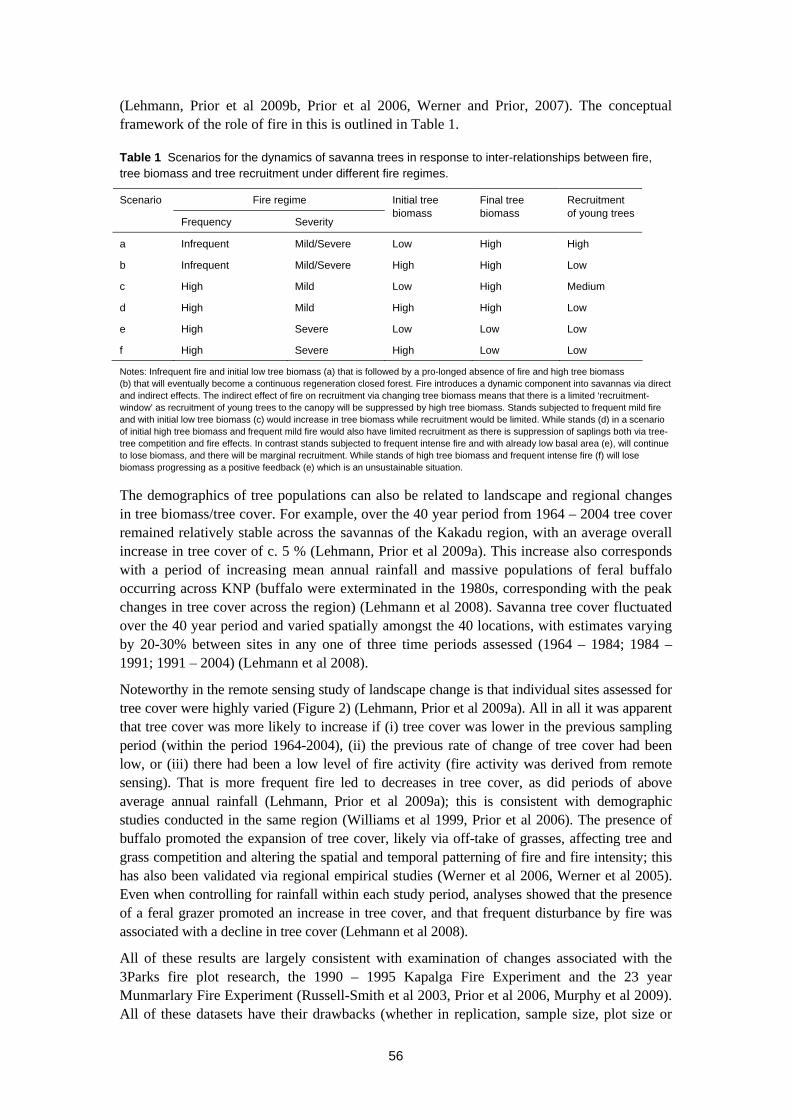
(Lehmann, Prior et al 2009b, Prior et al 2006, Werner and Prior, 2007). The conceptual framework of the role of fire in this is outlined in Table 1.
Table 1 Scenarios for the dynamics of savanna trees in response to inter-relationships between fire, tree biomass and tree recruitment under different fire regimes.
Fire regime Scenario
Frequency Severity
Initial tree biomass
Final tree biomass
Recruitment of young trees
a Infrequent Mild/Severe Low High High
b Infrequent Mild/Severe High High Low
c High Mild Low High Medium
d High Mild High High Low
e High Severe Low Low Low
f High Severe High Low Low
Notes: Infrequent fire and initial low tree biomass (a) that is followed by a pro-longed absence of fire and high tree biomass (b) that will eventually become a continuous regeneration closed forest. Fire introduces a dynamic component into savannas via direct and indirect effects. The indirect effect of fire on recruitment via changing tree biomass means that there is a limited ‘recruitment-window’ as recruitment of young trees to the canopy will be suppressed by high tree biomass. Stands subjected to frequent mild fire and with initial low tree biomass (c) would increase in tree biomass while recruitment would be limited. While stands (d) in a scenario of initial high tree biomass and frequent mild fire would also have limited recruitment as there is suppression of saplings both via tree-tree competition and fire effects. In contrast stands subjected to frequent intense fire and with already low basal area (e), will continue to lose biomass, and there will be marginal recruitment. While stands of high tree biomass and frequent intense fire (f) will lose biomass progressing as a positive feedback (e) which is an unsustainable situation.
The demographics of tree populations can also be related to landscape and regional changes in tree biomass/tree cover. For example, over the 40 year period from 1964 – 2004 tree cover remained relatively stable across the savannas of the Kakadu region, with an average overall increase in tree cover of c. 5 % (Lehmann, Prior et al 2009a). This increase also corresponds with a period of increasing mean annual rainfall and massive populations of feral buffalo occurring across KNP (buffalo were exterminated in the 1980s, corresponding with the peak changes in tree cover across the region) (Lehmann et al 2008). Savanna tree cover fluctuated over the 40 year period and varied spatially amongst the 40 locations, with estimates varying by 20-30% between sites in any one of three time periods assessed (1964 – 1984; 1984 – 1991; 1991 – 2004) (Lehmann et al 2008).
Noteworthy in the remote sensing study of landscape change is that individual sites assessed for tree cover were highly varied (Figure 2) (Lehmann, Prior et al 2009a). All in all it was apparent that tree cover was more likely to increase if (i) tree cover was lower in the previous sampling period (within the period 1964-2004), (ii) the previous rate of change of tree cover had been low, or (iii) there had been a low level of fire activity (fire activity was derived from remote sensing). That is more frequent fire led to decreases in tree cover, as did periods of above average annual rainfall (Lehmann, Prior et al 2009a); this is consistent with demographic studies conducted in the same region (Williams et al 1999, Prior et al 2006). The presence of buffalo promoted the expansion of tree cover, likely via off-take of grasses, affecting tree and grass competition and altering the spatial and temporal patterning of fire and fire intensity; this has also been validated via regional empirical studies (Werner et al 2006, Werner et al 2005). Even when controlling for rainfall within each study period, analyses showed that the presence of a feral grazer promoted an increase in tree cover, and that frequent disturbance by fire was associated with a decline in tree cover (Lehmann et al 2008).
All of these results are largely consistent with examination of changes associated with the 3Parks fire plot research, the 1990 – 1995 Kapalga Fire Experiment and the 23 year Munmarlary Fire Experiment (Russell-Smith et al 2003, Prior et al 2006, Murphy et al 2009). All of these datasets have their drawbacks (whether in replication, sample size, plot size or
56
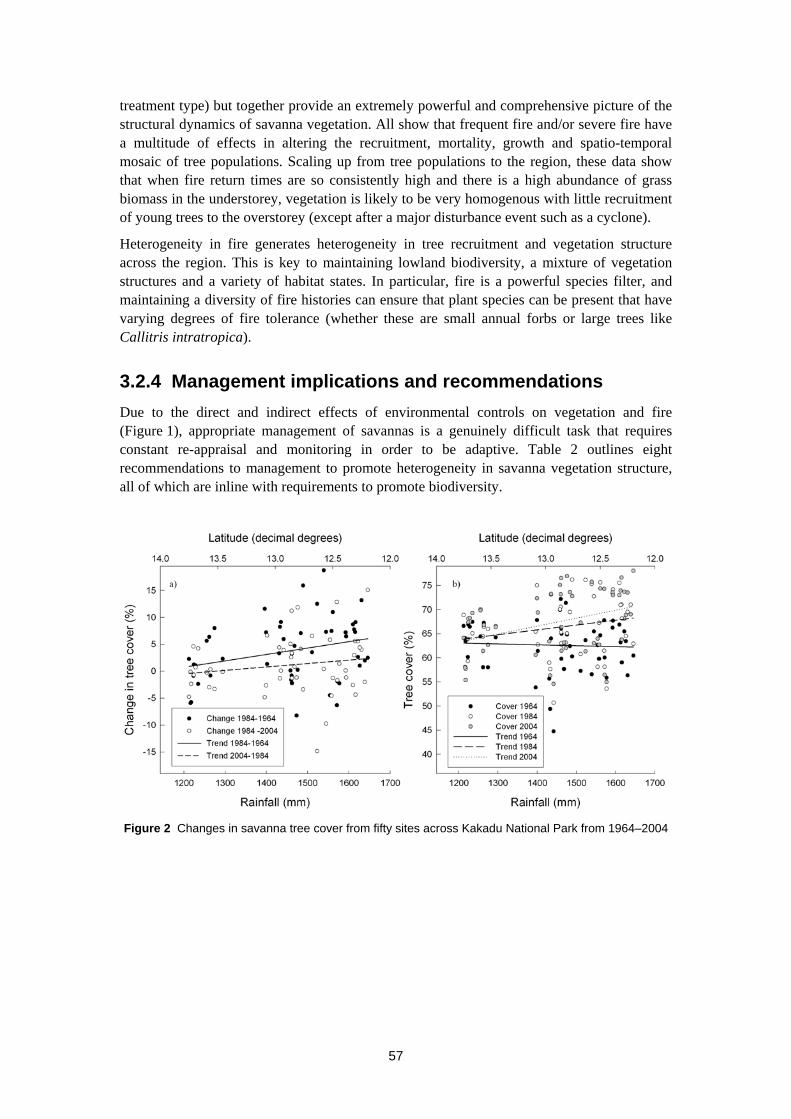
treatment type) but together provide an extremely powerful and comprehensive picture of the structural dynamics of savanna vegetation. All show that frequent fire and/or severe fire have a multitude of effects in altering the recruitment, mortality, growth and spatio-temporal mosaic of tree populations. Scaling up from tree populations to the region, these data show that when fire return times are so consistently high and there is a high abundance of grass biomass in the understorey, vegetation is likely to be very homogenous with little recruitment of young trees to the overstorey (except after a major disturbance event such as a cyclone).
Heterogeneity in fire generates heterogeneity in tree recruitment and vegetation structure across the region. This is key to maintaining lowland biodiversity, a mixture of vegetation structures and a variety of habitat states. In particular, fire is a powerful species filter, and maintaining a diversity of fire histories can ensure that plant species can be present that have varying degrees of fire tolerance (whether these are small annual forbs or large trees like Callitris intratropica).
3.2.4 Management implications and recommendations
Due to the direct and indirect effects of environmental controls on vegetation and fire (Figure 1), appropriate management of savannas is a genuinely difficult task that requires constant re-appraisal and monitoring in order to be adaptive. Table 2 outlines eight recommendations to management to promote heterogeneity in savanna vegetation structure, all of which are inline with requirements to promote biodiversity.
Figure 2 Changes in savanna tree cover from fifty sites across Kakadu National Park from 1964–2004
57
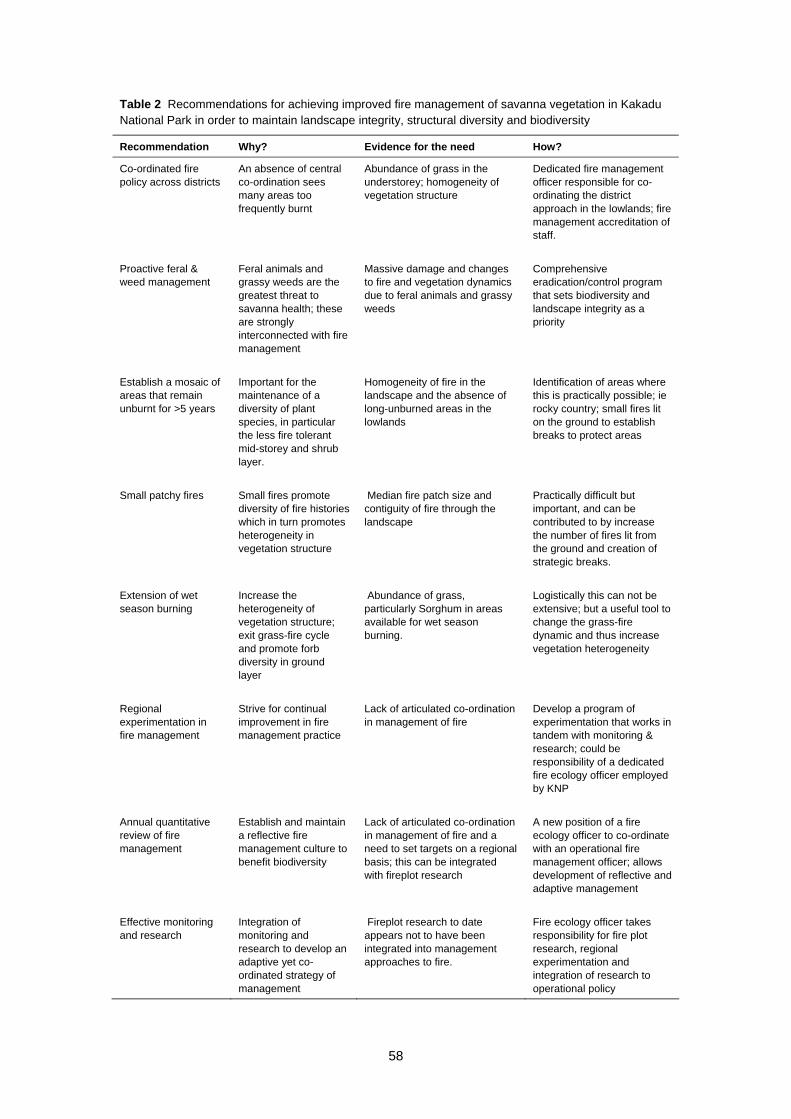
Table 2 Recommendations for achieving improved fire management of savanna vegetation in Kakadu National Park in order to maintain landscape integrity, structural diversity and biodiversity
Recommendation Why? Evidence for the need How?
Co-ordinated fire policy across districts
An absence of central co-ordination sees many areas too frequently burnt
Abundance of grass in the understorey; homogeneity of vegetation structure
Dedicated fire management officer responsible for co-ordinating the district approach in the lowlands; fire management accreditation of staff.
Proactive feral & weed management
Feral animals and grassy weeds are the greatest threat to savanna health; these are strongly interconnected with fire management
Massive damage and changes to fire and vegetation dynamics due to feral animals and grassy weeds
Comprehensive eradication/control program that sets biodiversity and landscape integrity as a priority
Establish a mosaic of areas that remain unburnt for >5 years
Important for the maintenance of a diversity of plant species, in particular the less fire tolerant mid-storey and shrub layer.
Homogeneity of fire in the landscape and the absence of long-unburned areas in the lowlands
Identification of areas where this is practically possible; ie rocky country; small fires lit on the ground to establish breaks to protect areas
Small patchy fires Small fires promote diversity of fire histories which in turn promotes heterogeneity in vegetation structure
Median fire patch size and contiguity of fire through the landscape
Practically difficult but important, and can be contributed to by increase the number of fires lit from the ground and creation of strategic breaks.
Extension of wet season burning
Increase the heterogeneity of vegetation structure; exit grass-fire cycle and promote forb diversity in ground layer
Abundance of grass, particularly Sorghum in areas available for wet season burning.
Logistically this can not be extensive; but a useful tool to change the grass-fire dynamic and thus increase vegetation heterogeneity
Regional experimentation in fire management
Strive for continual improvement in fire management practice
Lack of articulated co-ordination in management of fire
Develop a program of experimentation that works in tandem with monitoring & research; could be responsibility of a dedicated fire ecology officer employed by KNP
Annual quantitative review of fire management
Establish and maintain a reflective fire management culture to benefit biodiversity
Lack of articulated co-ordination in management of fire and a need to set targets on a regional basis; this can be integrated with fireplot research
A new position of a fire ecology officer to co-ordinate with an operational fire management officer; allows development of reflective and adaptive management
Effective monitoring and research
Integration of monitoring and research to develop an adaptive yet co-ordinated strategy of management
Fireplot research to date appears not to have been integrated into management approaches to fire.
Fire ecology officer takes responsibility for fire plot research, regional experimentation and integration of research to operational policy
58
References
Archibald SA, Kirton A, van der Merwe MR, Scholes RJ, Williams CA & Hanan N 2009. Drivers of inter-annual variability in Net Ecosystem Exchange in a semi-arid savanna ecosystem, South Africa. Biogeosciences 6, 251–266.
Beerling DJ & Osborne CP 2006. The origin of the savanna biome. Global Change Biology 12, 2023–2031.
Bond WJ 2008. What limits trees in C4 grasslands and savannas? Annual Review of Ecology, Evolution, and Systematics 39, 641–659.
Bowman DMJS, Balch JK, Artaxo P, Bond WJ, Carlson JM, Cochrane MA, D’Antonio CM, DeFries RS, Doyle JC, Harrison SP, Johnston FH, Keeley JE, Krawchuk MA, Kull CA, Marston JB, Moritz MA, Prentice IC, Roos CI, Scott AC, Swetnam TW, van der Werf G R & Pyne SJ 2009. Fire in the Earth System. Science 324, 481–484.
Fensham RJ, Fairfax RJ & Archer SR 2005. Rainfall, land use and woody vegetation cover change in semi-arid Australian savanna. Journal of Ecology 93, 596–606.
Hoffmann WA, Adasme R, Haridasan M, de Carvalho MT, Geiger EL, Pereira MAB, Gotsch SG & Franco AC 2009. Tree topkill, not mortality, governs the dynamics of savanna–forest boundaries under frequent fire in central Brazil. Ecology 90, 1326–1337.
House JI, Archer S, Breshears DD, Scholes RJ & Participants NTGI 2003. Conundrums in mixed woody-herbaceous plant systems. Journal of Biogeography 30, 1763–1777.
Leakey ADB 2009. Rising atmospheric carbon dioxide concentration and the future of C4 crops for food and fuel. Proceedings of the Royal Society B: Biological Sciences 276, 2333–2343.
Lehmann CER, Prior LD & Bowman DMJS 2009a. Decadal dynamics of tree cover in an Australian tropical savanna. Austral Ecology 34, 601–612.
Lehmann CER, Prior LD & Bowman DMJS 2009b. Fire controls population structure in four dominant tree species in a tropical savanna. Oecologia 161, 505–515.
Lehmann CER, Prior LD, Williams RJ & Bowman DMJS 2008. Spatio-temporal trends in tree cover of a tropical mesic savanna are driven by landscape disturbance. Journal of Applied Ecology 45, 1304-1311.
Lehmann CER, Ratnam J & Hutley LB 2009. Which of these continents is not like the other? Comparisons of tropical savanna systems: key questions and challenges. New Phytologist 181, 508–511.
Murphy BP, Russell-Smith J & Prior LD 2009. Frequent fires reduce tree growth in northern Australian savannas: implications for tree demography and carbon sequestration. Global Change Biology 16 (1), 331–343.
Prior LD, Brook BW, Williams RJ, Werner PA, Bradshaw CJA & Bowman DMJS 2006. Environmental and allometric drivers of tree growth rates in a north Australian savanna. Forest Ecology and Management 234, 164–180.
Russell-Smith J, Whitehead PJ, Cook GD & Hoare JL 2003. Response of Eucalyptus-dominated savanna to frequent fires: Lessons from Munmarlary, 1973-1996. Ecological Monographs 73, 349–375.
59
60
Sage R & Kubien D 2003. Quo vadis C4?* An ecophysiological perspective on global change and the future of C4 plants. Photosynthesis Research 77, 209–225.
Sankaran M, Hanan NP, Scholes RJ, RatnamJ, Augustine DJ, Cade BS, Gignoux J, Higgins SI, Le Roux X, Ludwig F, Ardo J, Banyikwa F, Bronn A, Bucini G, Caylor KK, Coughenour MB, Diouf A, Ekaya W, Feral CJ, February EC, Frost PGH, Hiernaux P, Hrabar H, Metzger KL, Prins HHT, Ringrose S, Sea W, Tews J, Worden J & Zambatis N 2005. Determinants of woody cover in African savannas Nature 438, 846–849.
Sankaran M, Ratnam J & Hanan N 2008. Woody cover in African savannas: the role of resources, fire and herbivory doi:10.1111/j.1466-8238.2007.00360.x. Global Ecology and Biogeography 17(2), 236-245
Scholes, R. J. & Archer, S. R. (1997) Tree-grass interactions in savannas. Annual Review of Ecology and Systematics, 28, 517-544.
Werner PA, Cowie ID & Cusack JS 2005. Impact of feral water buffalo on juvenile trees in savannas of northern Australia: An experimental field study in Kakadu National Park. Australian Journal of Botany 54, 283–296.
Werner PA, Cowie ID & Cusack JS 2006. Juvenile tree growth and demography in response to feral water buffalo in savannas of northern Australia: an experimental field study in Kakadu National Park. Australian Journal of Botany 54, 283–296.
Werner PA & Prior LD 2007. Tree-piping termites and growth and survival of host trees in savanna woodland of north Australia. Journal of Tropical Ecology 23, 611–622.
Williams RJ, Cook GD, Gill AM & Moore PHR 1999. Fire regime, fire intensity and tree survival in a tropical savanna in northern Australia. Australian Journal of Ecology 24, 50–59.

3.3 Woodland burning – workshop outcomes
M Ibbett1
3.3.1 Current knowledge
Fire affects tree growth in varying ways, depending on the age and size of trees, and the season and severity of fire. Studies at Kapalga have shown that late season fires lead to reduced growth in saplings (>1.5 m tall) and adult trees (>5 cm diameter at breast height (DBH)) but early season fires are more detrimental to juvenile trees (<1.5 m tall). The Three Parks study has shown that early season fires can also lead to reduced tree growth, although late season fires which tend to be more intense amplify this effect. Fire frequency also reduces tree growth, but this is not as important as fire severity.
Recruitment of trees in woodland habitats is severely reduced by both early and late season fires, and after severe fires recruitment may be totally reduced. The Three Parks study showed that recruitment in lowland habitats decreased markedly with fire frequency but this did not occur in sandstone areas. Season of fire appears to be a more important determinant of recruitment than fire severity.
Tree mortality appears to be a function of tree size and fire. Mortality rates decrease as tree size increases up to 20 cm DBH, and then remain relatively steady until trees reach 40–50 cm DBH when it dramatically increases. Although this same pattern is observed across different fire treatments, mortality rates were greatest in late fire treatments and least in early fire treatments. Mortality rates were intermediate in treatments with no fires.
The Three Parks study showed that in sandstone plots tree mortality is greater than recruitment, so tree density is declining. The opposite is true for lowland plots.
The carbon storage potential of savannas is reduced by frequent fires and the extent of this reduction is increased according to the intensity of fires.
Tree cover can vary considerably in response to grazing pressure, rainfall and fire. Studies suggest that fire generally decreases tree cover and that the frequent occurrence of fire can change the spatio-temporal mosaic of vegetation.
Consistently high fire-return times combined with high grass biomass can lead to the homogenisation of vegetation communities, with little recruitment of young trees into the overstorey.
3.3.2 Main threats
The spread of grassy weeds into the Park and the associated increase in fire risk, poses a major threat to the conservation of savanna biodiversity in Kakadu.
Climate change effects may alter the intensity and extent of fires and may lead to a change in the fire season. Fire management plans must incorporate these potential effects.
1 Kakadu National Park, Parks Operations and Tourism Branch
61
62
Lack of long unburnt patches is leading to the development and maintenance of a recruitment bottle-neck and the homogenisation of woodland habitat.
The lack of integration of feral animal, weed control and fire management hampers the successful management of all of these areas.
3.3.3 Knowledge gaps
The potential effects of climate change on fire weather, fire behaviour and impacts on biodiversity remain largely unknown.
Need to identify fire thresholds for the maintenance of tree growth and recruitment in lowland and sandstone woodlands, and for other specific elements of woodland vegetation communities eg midstorey fleshy fruit bearing trees.
Mechanisms that enable obligate seeders to survive in the woodlands are unknown.
Need to quantify the effects of wet season burning on fuel loads, particularly spear grass.
The impacts of fire regimes on specific components of woodland biodiversity eg emus remains unknown.
3.3.4 Management recommendations
Review current approach to fire management in woodlands
Need to develop a fire management strategy that incorporates specific objectives relating to area to be left unburnt, seasonality of burn, heterogeneity measures and the creation and protection of fire refuge habitat.
Some specific outcomes of the fire management strategy should be the creation of small patchy fires, an increase in the area of long unburnt woodland (>5 years) and longer fire return intervals throughout the Park (ie the same areas should not be burnt year after year). The fire management strategies need to incorporate specific threshold targets and management responses relating to these attributes.
Fire management policies should be consistent across the entire Park.
Rigorous and explicit monitoring of fire (including information about timing, extent of individual fires) is required to truly understand the impacts of fire management activities in the Park. This monitoring should be couched in an adaptive management framework to allow continued improvement of fire management in the Park.
Bininj should have input in the development of fire management strategies.
Experimental manipulation of fire may be a useful tool to inform the continual improvement of fire management in the Park.
The Park should consider the appointment of a dedicated fire ecology officer to co-ordinate quantitative reviews of fire management and to lead research and monitoring activities (including experimental studies) related to fire management
Part 4 Floodplain fire management
Introduction
Kakadu National Park is internationally recognised for its wetlands as part of the Ramsar Agreement. The mosaic of contiguous wetlands comprising the catchments of three large river systems, the East, West and South Alligator rivers and nearly all the Wildman River system. Which include the lower reaches of the East Alligator River, the lower South Alligator floodplain and the Magela Creek floodplain. These wetlands included seasonal creeks, extensive freshwater floodplains, permanent lagoons, paperbark swamps and semipermanent billabongs.
The floodplains and wetlands of Kakadu are important habitats for species including magpie geese and long necked turtle, these species and a number of aquatic plants are important food sources for local aboriginal people.
63
4.1 Representing Indigenous wetland ecological knowledge in a Bayesian Belief Network
AC Liedloff1, P Christophersen1,2, S McGregor1,2 & B McKaige1
Abstract3
It is widely appreciated that Indigenous Australians hold a wealth of ecological knowledge that could be beneficially applied to contemporary land management. However, this has rarely happened, and unfortunately a large amount of Indigenous knowledge is being lost as elders pass away. The Bayesian Belief Network (BBN) approach is ideal for recording traditional ecological knowledge and applying it to land management as it can use qualitative information in the form of expert opinion using local terminology. Once a model is developed, the BBN approach also provides an intuitive means of exploring system dynamics, therefore offering an effective educational tool for Indigenous and non-Indigenous people alike. The collaborative process of model development also fosters new relationships and a better understanding of the ecosystem by all parties. This project was designed to examine the how Indigenous land managers recognise and manage for healthy wetlands. This was achieved by working with a family of Aboriginal land managers, a number of whom are traditional owners in Kakadu National Park. A BBN was developed to formalise the integration of western and indigenous knowledge systems, and to develop a visually appealing, interactive, educational experience for a diverse audience, from Aboriginal land managers to tourists and park management. A web-based, graphical presentation was then developed to clearly present BBNs and display additional underlying knowledge. This paper presents the process and unique challenges in developing the BBN with Indigenous Australians who have not been previously exposed to western modelling approaches.
4.1.1 Introduction
Wetlands have long been important places for food collection by the Aboriginal people of Kakadu National Park, Northern Territory. Not surprisingly, food (or bush tucker) accessibility is key to the Indigenous understanding of wetland health. Indigenous Australians hold a wealth of ecological knowledge and land management understanding about wetlands. It is now widely appreciated how this understanding can be beneficially applied to contemporary land management, however this has rarely occurred. Unfortunately, a lot of valuable knowledge is lost as elders pass away before it can be passed on to the next generations.
This project aimed to use the features of Bayesian modelling, in particular Bayesian Belief Networks (BBN), to represent Aboriginal knowledge about healthy wetlands and disseminate this understanding to a wider audience. The desirable features of this approach included the ability to use expert understanding to develop the model using local terminology and present the model in a visual way to explain the interacting processes incorporated. This paper will describe the steps involved in developing this model with Aboriginal land managers and the web-based visualisation of a BBN developed.
1 CSIRO Sustainable Ecosystems, Northern Territory, Australia, Email: [email protected] 2 Bushfire Cooperative Research Centre 3 Keywords: Kakadu National Park, Aboriginal land management, wetland health, fire management
64

4.1.2 Development of the Bayesian belief network
Other studies (Baran & Jantunen 2004) have considered the process of consulting stakeholders to develop BBNs, but few if any have involved Aboriginal land managers as the group interested in developing the model. Developing BBNs for different stakeholder groups involves making the process clear and transparent with a sense of ownership maintained by the participants. This is especially important when working with Indigenous communities. Indigenous commentators have criticised the one-sided approach where conventional western science methodologies do not leave participants feeling a sense of ownership of the process and final products, often limiting applicability of the results and inhibiting future collaborative research (Henry et al 2002, Dodson, 2000).
The aims of this project were to (i) assist Aboriginal land managers to develop a model that adequately represents the traditional understanding of how healthy wetland systems provide bush tucker, and (ii) ensure that ownership of intellectual property was retained by the traditional owners during the entire process. This meant that sufficient time was needed to develop an understanding of the logic behind the model, the model’s role and potential applications. These steps built on previous interactions with Indigenous researchers and ensured that the final product was clearly a collaborative outcome with multiple benefits and uses.
The development of the BBN involved five one-day meetings undertaken in Kakadu National Park from June 2007 to May 2008. The participants included a model development coordinator, communication support officer and two Aboriginal land managers whose knowledge and understanding of wetland fire management has been passed down from Kakadu Traditional Owners. The process involved explaining the concept of models, recording traditional wetland burning understanding, developing the BBN, propagation of model probabilities and final model validation and modification. The approach undertaken aimed to lead all project participants through a progression of steps to develop the final model using plain English terminology.
4.1.2.1 Understanding models
The complexity of natural and socio-economic systems necessitates that any modelling approximation of these systems, while a simplification, will itself be somewhat complex. The wide range of modelling approaches available and their common use of mathematical equations have restricted their users to experts rather than providing a simple tool of great value to a wide range of users. It was important that all team members including project support staff and Aboriginal land managers were comfortable with the concepts used for developing the model in this project. For this reason, the first phase of this project involved discussions about models commonly used in society (eg weather forecasts, computer games etc) to ensure all participants were comfortable with the concept of modelling and the task we were attempting to perform.
4.1.2.2 Elicitation of model structure
The task of eliciting and representing Indigenous ecological wetland knowledge and wetland burning knowledge was performed over two one day meetings. The primary factors important to wetland health were first defined followed by discussion about additional influencing factors. As this was a small group with non-conflicting interests and understanding, a free dialog was undertaken and all details recorded. It was important that concepts important to local perceptions and understanding were included and western pre-conceptions were avoided in this process. To direct discussions and keep focused and specific for the model creation, broad areas of interest (eg ducks, red lilies and magpie geese) were considered separately as it
65
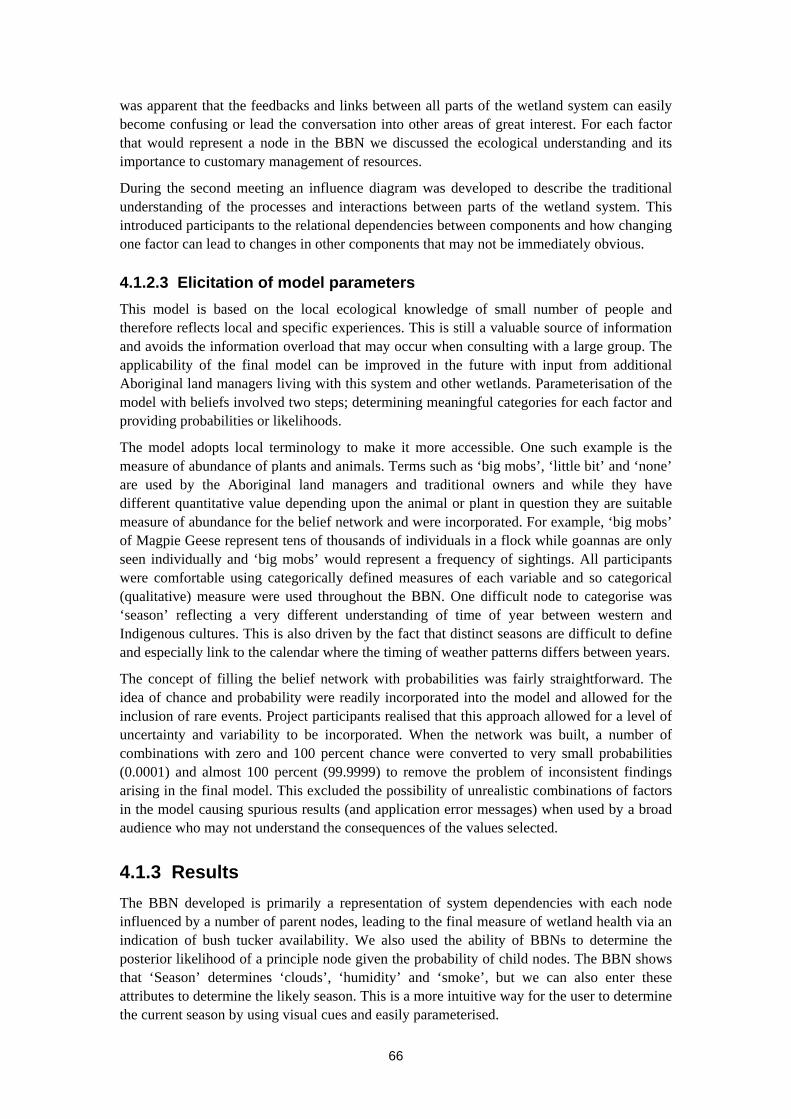
was apparent that the feedbacks and links between all parts of the wetland system can easily become confusing or lead the conversation into other areas of great interest. For each factor that would represent a node in the BBN we discussed the ecological understanding and its importance to customary management of resources.
During the second meeting an influence diagram was developed to describe the traditional understanding of the processes and interactions between parts of the wetland system. This introduced participants to the relational dependencies between components and how changing one factor can lead to changes in other components that may not be immediately obvious.
4.1.2.3 Elicitation of model parameters
This model is based on the local ecological knowledge of small number of people and therefore reflects local and specific experiences. This is still a valuable source of information and avoids the information overload that may occur when consulting with a large group. The applicability of the final model can be improved in the future with input from additional Aboriginal land managers living with this system and other wetlands. Parameterisation of the model with beliefs involved two steps; determining meaningful categories for each factor and providing probabilities or likelihoods.
The model adopts local terminology to make it more accessible. One such example is the measure of abundance of plants and animals. Terms such as ‘big mobs’, ‘little bit’ and ‘none’ are used by the Aboriginal land managers and traditional owners and while they have different quantitative value depending upon the animal or plant in question they are suitable measure of abundance for the belief network and were incorporated. For example, ‘big mobs’ of Magpie Geese represent tens of thousands of individuals in a flock while goannas are only seen individually and ‘big mobs’ would represent a frequency of sightings. All participants were comfortable using categorically defined measures of each variable and so categorical (qualitative) measure were used throughout the BBN. One difficult node to categorise was ‘season’ reflecting a very different understanding of time of year between western and Indigenous cultures. This is also driven by the fact that distinct seasons are difficult to define and especially link to the calendar where the timing of weather patterns differs between years.
The concept of filling the belief network with probabilities was fairly straightforward. The idea of chance and probability were readily incorporated into the model and allowed for the inclusion of rare events. Project participants realised that this approach allowed for a level of uncertainty and variability to be incorporated. When the network was built, a number of combinations with zero and 100 percent chance were converted to very small probabilities (0.0001) and almost 100 percent (99.9999) to remove the problem of inconsistent findings arising in the final model. This excluded the possibility of unrealistic combinations of factors in the model causing spurious results (and application error messages) when used by a broad audience who may not understand the consequences of the values selected.
4.1.3 Results
The BBN developed is primarily a representation of system dependencies with each node influenced by a number of parent nodes, leading to the final measure of wetland health via an indication of bush tucker availability. We also used the ability of BBNs to determine the posterior likelihood of a principle node given the probability of child nodes. The BBN shows that ‘Season’ determines ‘clouds’, ‘humidity’ and ‘smoke’, but we can also enter these attributes to determine the likely season. This is a more intuitive way for the user to determine the current season by using visual cues and easily parameterised.
66
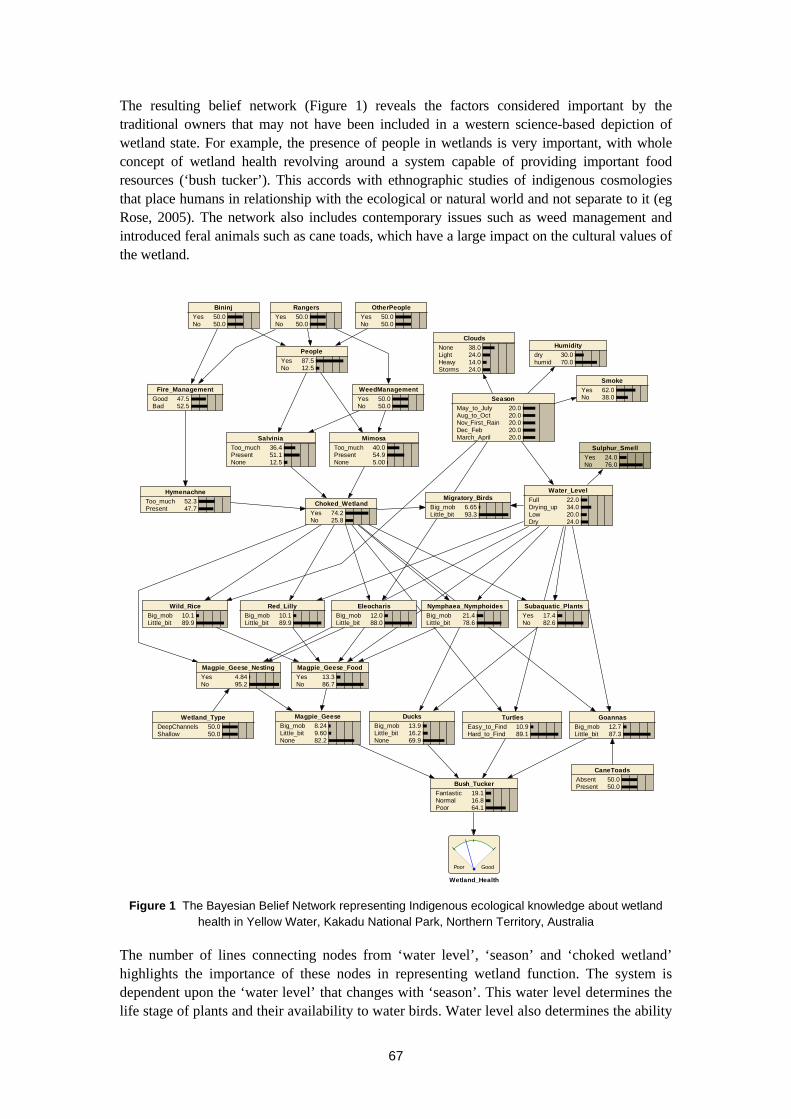
The resulting belief network (Figure 1) reveals the factors considered important by the traditional owners that may not have been included in a western science-based depiction of wetland state. For example, the presence of people in wetlands is very important, with whole concept of wetland health revolving around a system capable of providing important food resources (‘bush tucker’). This accords with ethnographic studies of indigenous cosmologies that place humans in relationship with the ecological or natural world and not separate to it (eg Rose, 2005). The network also includes contemporary issues such as weed management and introduced feral animals such as cane toads, which have a large impact on the cultural values of the wetland.
Rangers
YesNo
50.050.0
OtherPeople
YesNo
50.050.0
Bininj
YesNo
50.050.0
People
YesNo
87.512.5
WeedManagement
YesNo
50.050.0
Fire_Management
GoodBad
47.552.5
Hymenachne
Too_muchPresent
52.347.7
Mimosa
Too_muchPresentNone
40.054.95.00
Salvinia
Too_muchPresentNone
36.451.112.5
Choked_Wetland
YesNo
74.225.8
Season
May_to_JulyAug_to_OctNov_First_RainDec_FebMarch_April
20.020.020.020.020.0
Clouds
NoneLightHeavyStorms
38.024.014.024.0
Humidity
dryhumid
30.070.0
Smoke
YesNo
62.038.0
Water_Level
FullDrying_upLowDry
22.034.020.024.0
Sulphur_Smell
YesNo
24.076.0
Migratory_Birds
Big_mobLittle_bit
6.6593.3
Eleocharis
Big_mobLittle_bit
12.088.0
Red_Lilly
Big_mobLittle_bit
10.189.9
Wild_Rice
Big_mobLittle_bit
10.189.9
Nymphaea_Nymphoides
Big_mobLittle_bit
21.478.6
Subaquatic_Plants
YesNo
17.482.6
Wetland_Type
DeepChannelsShallow
50.050.0
Magpie_Geese_Food
YesNo
13.386.7
Magpie_Geese_Nesting
YesNo
4.8495.2
Ducks
Big_mobLittle_bitNone
13.916.269.9
Magpie_Geese
Big_mobLittle_bitNone
8.249.6082.2
Turtles
Easy_to_FindHard_to_Find
10.989.1
Goannas
Big_mobLittle_bit
12.787.3
CaneToads
AbsentPresent
50.050.0Bush_Tucker
FantasticNormalPoor
19.116.864.1
Wetland_Health
Poor Good
Figure 1 The Bayesian Belief Network representing Indigenous ecological knowledge about wetland health in Yellow Water, Kakadu National Park, Northern Territory, Australia
The number of lines connecting nodes from ‘water level’, ‘season’ and ‘choked wetland’ highlights the importance of these nodes in representing wetland function. The system is dependent upon the ‘water level’ that changes with ‘season’. This water level determines the life stage of plants and their availability to water birds. Water level also determines the ability
67

of people to find turtles and file snakes as bush food. All these factors, and therefore wetland health, are strongly influenced by whether the wetland is choked by weeds such as Mimosa pigra and Salvinia molesta or native Hymenachne acutigluma (Mudja). Good fire management by Bininj (the traditional owners) in collaboration with park rangers and weed management by park rangers helps keep the wetland open. The open wetland provides habitat for a range of aquatic plants and the water birds that rely on them, resulting in abundant bush foods and a characteristic of good ‘wetland health’. This understanding is similar to that presented by Rose (2005) showing how Indigenous people can ‘read the country’ and use indicators to know when to harvest and hunt.
Developing this BBN revealed the level of detailed ecological knowledge held by the traditional owners and how the final model created is only a very simple approximation of their total understanding. From the detailed discussions, the aboriginal land managers realised that there is considerable additional understanding behind the parameterisation of each connecting line between nodes. This detail, simplified in the probability tables, meant that the intellectual property around natural resource management (NRM) and wetland burning of the traditional owners is maintained and is not freely available in the model.
4.1.4 Providing a user friendly visualisation of the BBN
One of the characteristics of the BBN approach is that the network developed provides a simplified representation of a system with lines joining nodes showing where relationships exist, much like a conventional flow diagram and model representation. This allows the user to visualise a simplification of the complex system being represented. The ability to use Bayesian Software (eg Netica, Norsys, 2007) to instantly analyse a full range of scenarios ‘on the fly’ is also an advantage in model development and information dissemination. While these are clear benefits of the BBN approach, complex networks with simplified nodes can be overwhelming to a number of users not familiar with the BBNs and flow diagrams. This reduces the impact of the network’s ability to clearly present the system and provide an interactive learning experience without an expert to guide the user and explain responses.
This project attempted to overcome this shortfall by replacing the standard network (Figure 1) with a more graphical representation where nodes are represented by images indicating the current state of each node (Figure 2, Figure 3). When the state of a node changes the user witnesses the effect of the change by a change in the images displayed, information supplied and sounds generated.
The visualisation component was developed as a web-based application allowing a wide audience to access the model information across a range of platforms. This involved a server-side application to manage the databases and BBN and the user interface accessed through standard web browsers. The application was developed with C# asp.NET (Visual Studio 2005, Microsoft, 2005) and uses the Netica (Norsys, 2007) file format for BBN, which is one of the most widely used applications.
The network visualiser can be configured with any number of nodes presented on a page. Thus, a single web page could represent the entire belief network or a sub section of the network relating to a particular category. As the server application can track the current state of the network for a given user, any changes made on a page will affect the findings on other pages. This allows the user to explore the various sub sections of the model individually for ease of understanding.
68
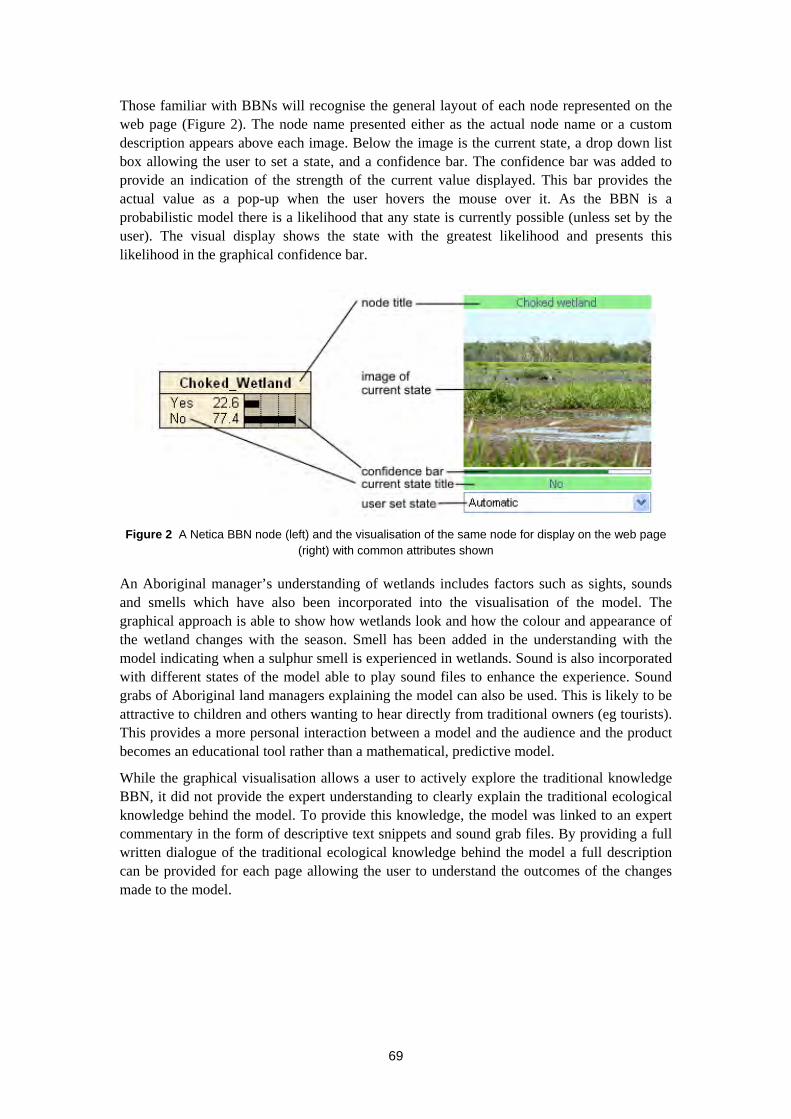
Those familiar with BBNs will recognise the general layout of each node represented on the web page (Figure 2). The node name presented either as the actual node name or a custom description appears above each image. Below the image is the current state, a drop down list box allowing the user to set a state, and a confidence bar. The confidence bar was added to provide an indication of the strength of the current value displayed. This bar provides the actual value as a pop-up when the user hovers the mouse over it. As the BBN is a probabilistic model there is a likelihood that any state is currently possible (unless set by the user). The visual display shows the state with the greatest likelihood and presents this likelihood in the graphical confidence bar.
Figure 2 A Netica BBN node (left) and the visualisation of the same node for display on the web page (right) with common attributes shown
An Aboriginal manager’s understanding of wetlands includes factors such as sights, sounds and smells which have also been incorporated into the visualisation of the model. The graphical approach is able to show how wetlands look and how the colour and appearance of the wetland changes with the season. Smell has been added in the understanding with the model indicating when a sulphur smell is experienced in wetlands. Sound is also incorporated with different states of the model able to play sound files to enhance the experience. Sound grabs of Aboriginal land managers explaining the model can also be used. This is likely to be attractive to children and others wanting to hear directly from traditional owners (eg tourists). This provides a more personal interaction between a model and the audience and the product becomes an educational tool rather than a mathematical, predictive model.
While the graphical visualisation allows a user to actively explore the traditional knowledge BBN, it did not provide the expert understanding to clearly explain the traditional ecological knowledge behind the model. To provide this knowledge, the model was linked to an expert commentary in the form of descriptive text snippets and sound grab files. By providing a full written dialogue of the traditional ecological knowledge behind the model a full description can be provided for each page allowing the user to understand the outcomes of the changes made to the model.
69

Figure 3 An example of the web-based visualisation showing the Aboriginal land management understanding of the Bayesian Belief Network developed for this project
The knowledge database allows additional information to be recorded about every node, node state and interaction between a node and all influencing parent node states. This level of information effectively provides a full narrative of the state of the model as either text or sound files. The knowledge available for any state of the model is provided on the web page and the level of detail supplied can be altered by the user. This allows a user to better explore the model and gain a detailed understanding of the traditional knowledge behind the model in words and language used by the developers of the model. This knowledge database can also be provided in any language, allowing the model to be used by Aboriginal land managers who may not have English as their first language. While this knowledge provides a more detailed representation of the BBN than the network diagram alone, it does not reveal the intellectual
70

property held in the parameterisation of the BBN. This narrative effectively provides the style of dialog one would have with an interested party and makes the experience of viewing the visual BBN more personal and easier to interpret.
4.1.5 Discussion and conclusions
Traditional ecological knowledge and western scientific ecological knowledge share much in common and yet the two disciplines rarely combine to produce a collaborative product. This project has developed a collaborative approach allowing traditional owners in Kakadu National Park to develop a model of their wetland health understanding. Bringing Aboriginal land managers and scientists together to develop models is an important first step in producing joint outcomes and developing methodologies.
The process of developing the BBN required fostering of personal relationships, open and free discussion about wetlands, clear dialogue regarding models, explanation of flow diagrams, methodology and probabilities, and recording traditional terminology for use in the final graphical product.
The act of combining western science with local ecological knowledge in a collaborative manner is a positive achievement that will lead to further collaborative opportunities. This project has also raised some additional research questions. Further research needs to consider how the final BBN can be validated with field-based data. This is a significant area of future research. One approach towards solving this problem would be to develop two parallel models, one by Indigenous land managers and one by western scientists and have each group appraise the other group’s model. This would highlight the areas considered most important by each group and foster discussion about the relative differences in understanding. This approach would be applicable to a wide range of natural resource management issues in Australia.
During this project both scientific researchers and the traditional owners developed a new understanding of the other’s view of wetlands and believe the final product will have positive benefit and application in education and natural resource management.
Acknowledgments
We are grateful to Tracy Dawes, Colette Thomas and two anonymous reviewers for their thoughtful comments on the improvement of this manuscript.
References
Baran E & Jantunen T 2004. Stakeholder consultation for Bayesian decision support systems in environmental management. In ECOMOD 2004: Proceedings of the regional conference on Ecological and Environmental Modelling. Penang, Universiti Sains, Malaysia.
Harty C 2004. Planning strategies for mangrove and saltmarsh changes in southeast Australia. Coastal Management 32, 405–415.
Lee SY, Dunn RJK & Young RA 2006. Impact of urbanization on coastal wetland structure and function. Austral Ecology 31, 149–163.
Norsys 2007. Netica V3.25. Norsys Software Corporation.
Microsoft 2005. Microsoft Visual Studio 2005, Version 8.0.
71

72
Rizzoli AE & Young WJ 1997. Delivering environmental decision support systems - software tools and techniques. Environmental Modelling and Software 12, 237–250.
Ticehurst JL, Newham LTH, Rissik D, Letcher RA & Jakeman AJ 2007., A Bayesian network approach for assessing the sustainability of coastal lakes in New South Wales, Australia. Environmental Modelling and Software 27(8), 1129–1139.
Tucker P 2006. Building a foundation for water quality improvement by engaging people in planning – the Great Lakes Coastal Catchments Initiative. 15th NSW Coastal Conference, Coffs Harbour, NSW, 7 – 9 November 2006, Conference CD.
Webster IT & Harris GP 2004. Anthropogenic impacts on the ecosystems of coastal lagoons: modelling fundamental biogeochemical processes and their implications. Marine and Freshwater Research 55, 67–78.

4.2 Yellow Water and Red Lily wetland burning
V Lawson1, M Jambrecina2 & S Atkins2
4.2.1 Introduction
Hymenachne (water couch) is a competitive native species which forms a dense mat of vegetation. Over time, Hymenachne excludes other plants, chokes waterways and reduces the habitat quality for birds, fish and reptiles, which in turn reduces the hunting and gathering opportunities for Bininj. Healthy floodplains provide abundant food resources for Bininj such as water plants, long-necked turtle, fish, file snake and magpie goose. To maintain the balance between Hymenachne and other species, floodplains must be burnt regularly during the late dry season from September to November. During this time of year floodplains progressively dry out allowing fires to ignite.
In recent years, Kakadu has supported a number of Bininj lead floodplain fire projects. This paper describes the results of a project undertaken by Violet Lawson, a senior Murrumbur traditional owner, in 2005 and 2006. Violet burnt the yellow water and red lily floodplains in these years and documented the changes. A major aim of her project was also to involve Violet’s family, including young grandchildren, in burning the floodplains, to maintain connection with these areas and pass on the knowledge and skills needed to manage the floodplains with fire. Violet gathered photo evidence of the changes to the floodplain over this two year period. This project demonstrated that burning Hymenachne opens up waterways, and increases plant and animal diversity.
4.2.2 Floodplain burning
In order to safely burn the floodplains in the late dry season, the floodplain fringe must be burnt early in the dry season to remove dry plant material from around the paperbark forest. This protects the paperbark forest from hot late season fires and prevents fires from moving out from the floodplains to the surrounding savanna woodland in the late dry season, when fires can be damaging.
The same area can be burnt multiple times over the dry season as grasslands continue to dry out and more fuel becomes available. The first burn will take some the dry thick thatch of Hymenachne.
1 Kakadu National Park Traditional Owner 2 Kakadu National Park, Parks Operations and Tourism Branch
73

Figure 1 Without regular burning, Hymenachne monocultures being to dominate the wetlands
Figure 2 Without regular burning, paperbark trees and vegetation normally associated with natural springs begin to establish on the dry dense mats of Hymenachne
74
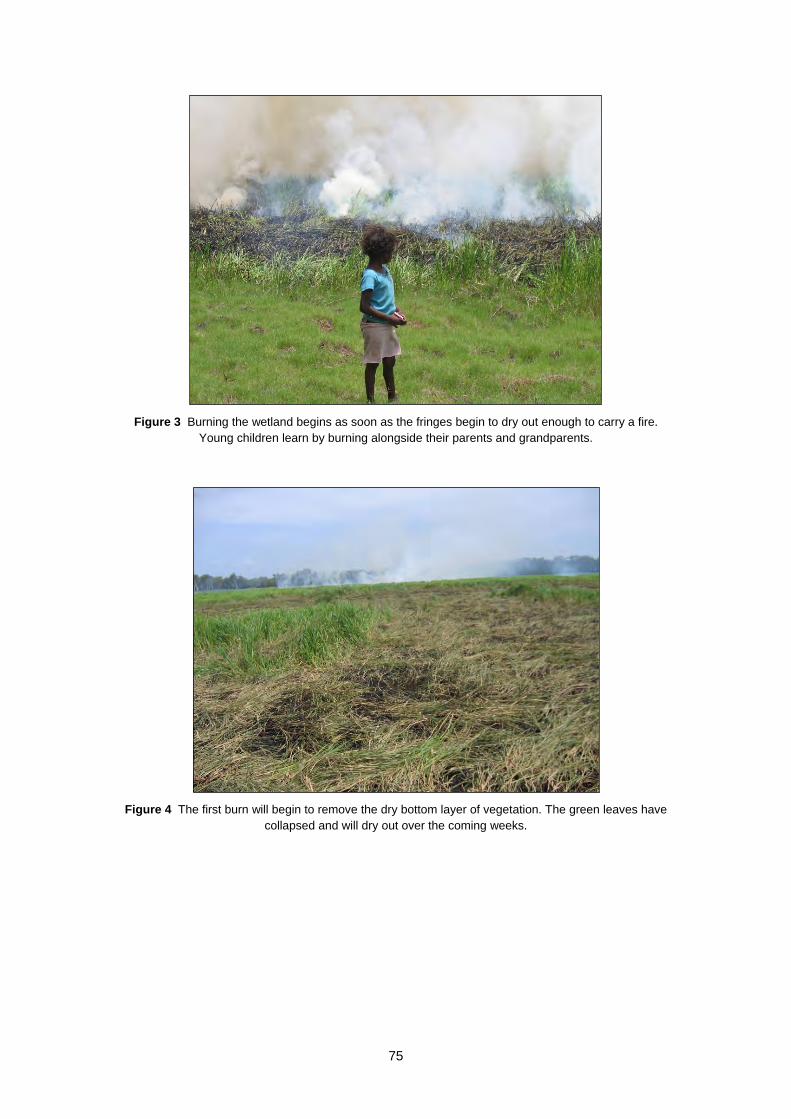
Figure 3 Burning the wetland begins as soon as the fringes begin to dry out enough to carry a fire. Young children learn by burning alongside their parents and grandparents.
Figure 4 The first burn will begin to remove the dry bottom layer of vegetation. The green leaves have collapsed and will dry out over the coming weeks.
75

Figure 5 A second or third burn is needed several weeks later to remove the remaining Hymenachne thatch
Figure 6 Enough moisture remains in the soil following the burns to allow plants to germinate and grow within a few weeks of fire
76

Figures 7 Following fire and removal of dense thatches of Hymenachne, plants such as water lily and wild rice return
Figures 8 Following fire and removal of dense thatches of Hymenachne, plants such as water lily and wild rice return
77
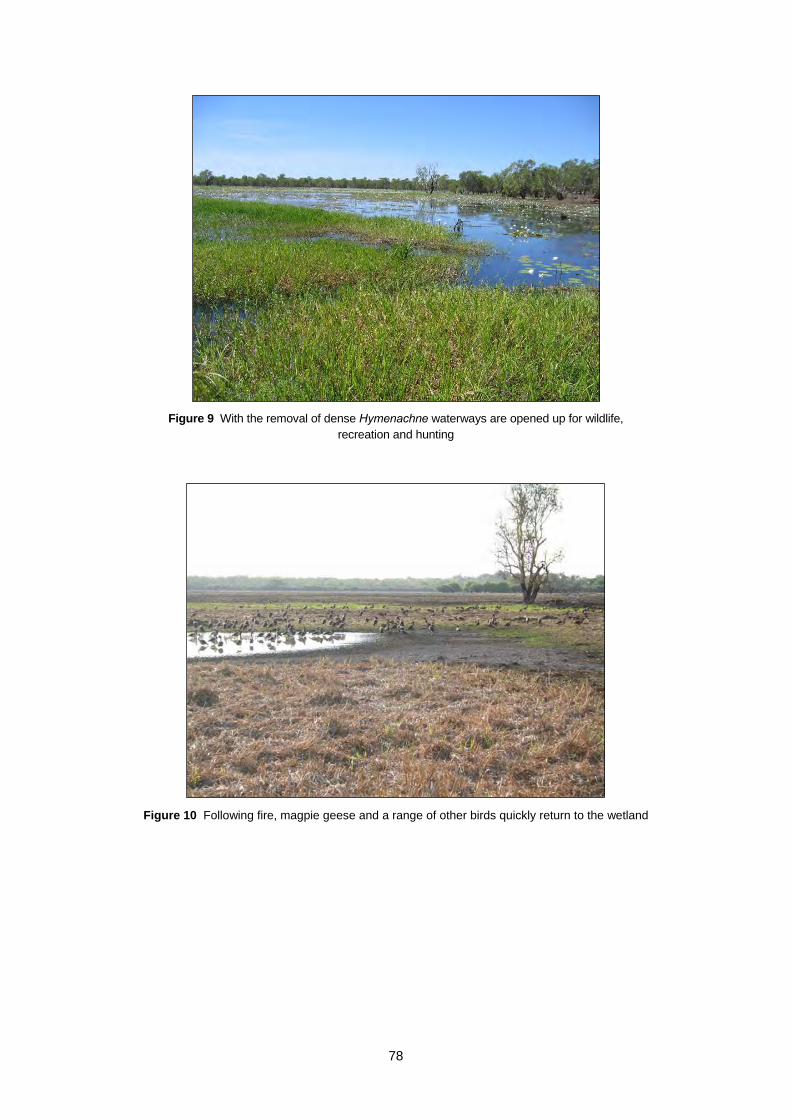
Figure 9 With the removal of dense Hymenachne waterways are opened up for wildlife, recreation and hunting
Figure 10 Following fire, magpie geese and a range of other birds quickly return to the wetland
78
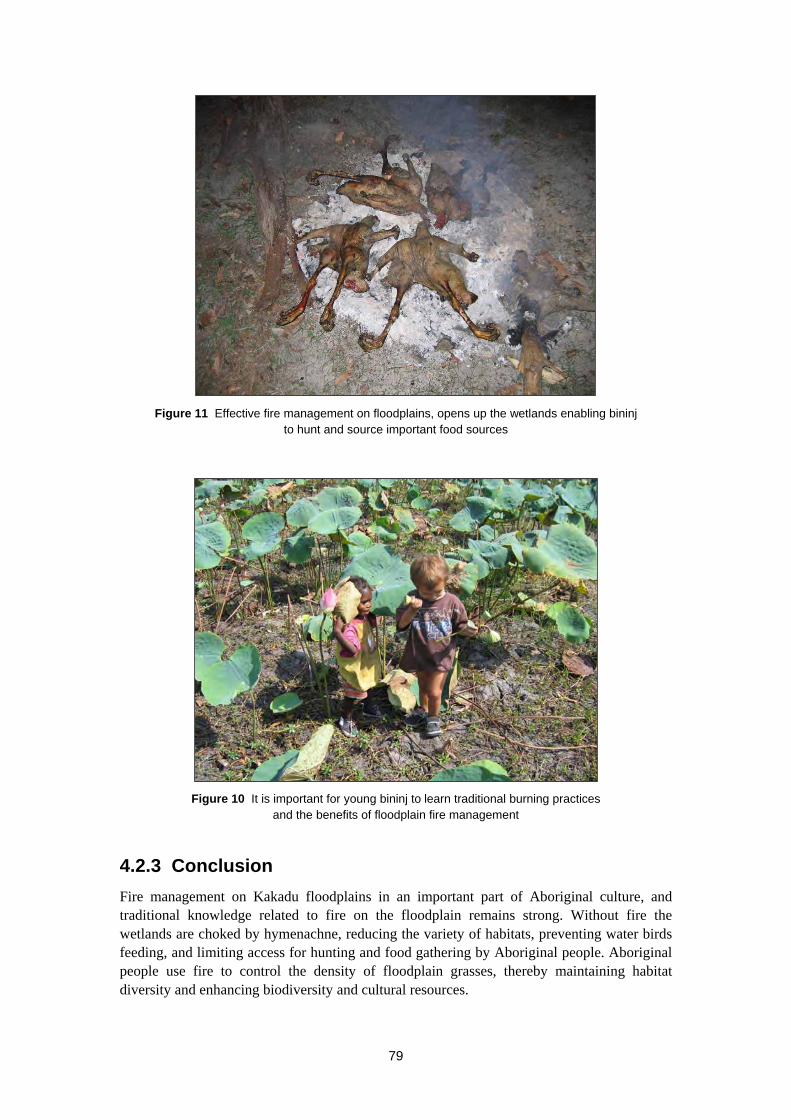
Figure 11 Effective fire management on floodplains, opens up the wetlands enabling bininj to hunt and source important food sources
Figure 10 It is important for young bininj to learn traditional burning practices and the benefits of floodplain fire management
4.2.3 Conclusion
Fire management on Kakadu floodplains in an important part of Aboriginal culture, and traditional knowledge related to fire on the floodplain remains strong. Without fire the wetlands are choked by hymenachne, reducing the variety of habitats, preventing water birds feeding, and limiting access for hunting and food gathering by Aboriginal people. Aboriginal people use fire to control the density of floodplain grasses, thereby maintaining habitat diversity and enhancing biodiversity and cultural resources.
79

4.3 Using fire to manage para grass in wetlands: a Queensland case study
T Grice1, M Nicholas1, P Williams2,3 & E Collins2
Abstract
Para grass was introduced to Australia for use as a forage species for wetland situations. It is widely naturalised and invades northern wetland and riparian environments and there are currently few options for managing large infestations. Research on the Townsville Town Common Conservation Park (TTCCP) between 2004 and 2008 tested three combinations of prescribed burning and cattle grazing as means of reducing the abundance and impact of para grass in seasonally inundated wetlands. Mid-late dry season burning and/or grazing reduced both the absolute amount of para grass and the proportional contribution of para grass to total above-ground biomass. The reductions in total biomass were substantial under all treatments. The reductions in the proportional contributions of para grass were greatest in plots that were burned but not grazed but there was considerable spatial variation in responses. On balance, results suggest that prescribed burning is a more useful and acceptable tool than grazing in the TTCCP system because it can rapidly remove the heavy thatch beneath the para grass sward and it is less demanding than cattle grazing given the infrastructure and animal husbandry required to run livestock. These approaches can be adapted to manage para grass in similar situations where it is a problem.
4.3.1 Introduction
In northern Australia, at least three introduced stoloniferous grass species have demonstrated a capacity to greatly alter the structure, composition and function of various types of wetlands and riparian zones. The species are Olive hymenachne 4(Hymenachne amplexicaulis (Rudge) Nees), aleman grass (Echinochloa polystachya (Kunth) Roberty) and para grass (Urochloa mutica (Forssk.) TQ Nguyen, syn Brachiaria mutica). Each was deliberately introduced for use as a pasture species for cattle grazing in wet situations but has naturalised, spread and, in many situations, come to dominate native communities.
Para grass is probably native to Africa but was first described from specimens collected in Brazil. It is now extremely widespread, being found in USA, Central and South America, Australia, south-east Asia, India, China and many Pacific Islands (Clayton, Harman and Williamson 2006). Para grass has been present in Australia since ca.1880 (Wesley-Smith 1973, Cameron 2008), whereas Olive hymenachne and aleman grass were first introduced to
1 CSIRO, Private Bag, PO Aitkenvale QLD 4814, Australia 2 Queensland Parks and Wildlife Service, PO Box 5597, Townsville QLD 4810, Australia 3 Current address: Vegetation Management Science, PO Box 104 Malanda QLD 4885
[email protected] 4 Throughout this publication we use the common name Olive hymenachne for Hymenachne amplexicaulis to
reduce the risk of confusion with native hymenachne Hymenachne acutigluma.
80
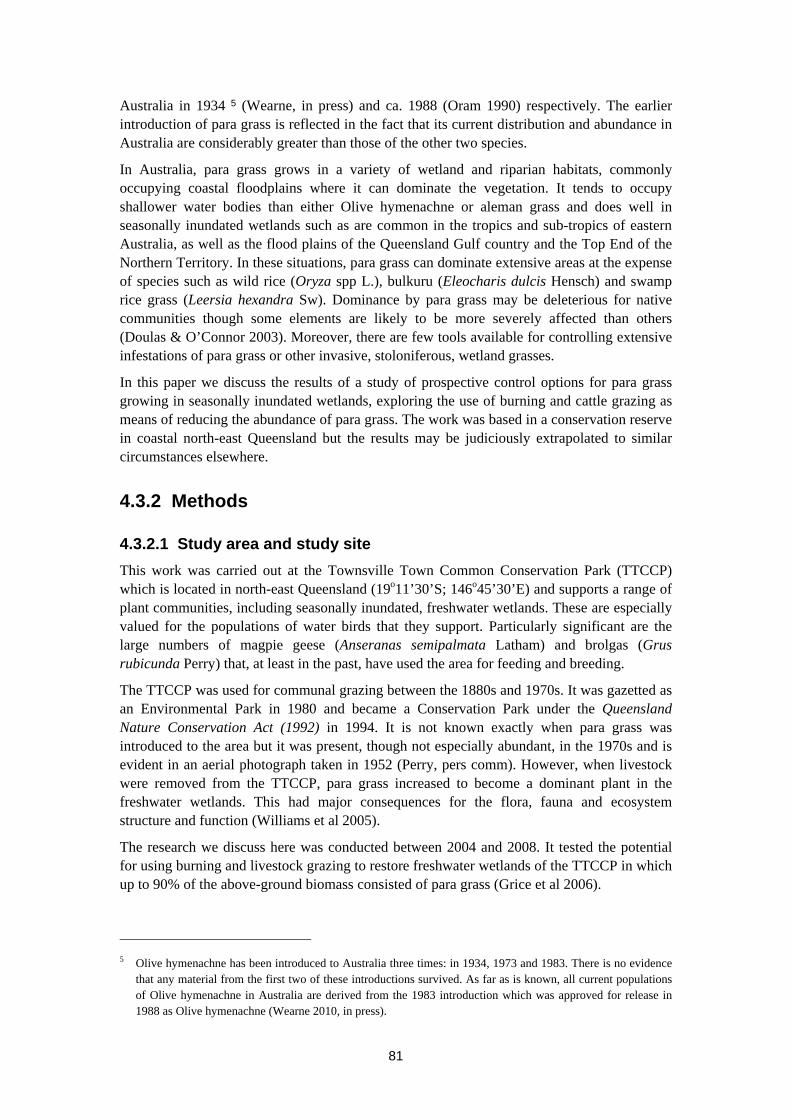
Australia in 1934 5 (Wearne, in press) and ca. 1988 (Oram 1990) respectively. The earlier introduction of para grass is reflected in the fact that its current distribution and abundance in Australia are considerably greater than those of the other two species.
In Australia, para grass grows in a variety of wetland and riparian habitats, commonly occupying coastal floodplains where it can dominate the vegetation. It tends to occupy shallower water bodies than either Olive hymenachne or aleman grass and does well in seasonally inundated wetlands such as are common in the tropics and sub-tropics of eastern Australia, as well as the flood plains of the Queensland Gulf country and the Top End of the Northern Territory. In these situations, para grass can dominate extensive areas at the expense of species such as wild rice (Oryza spp L.), bulkuru (Eleocharis dulcis Hensch) and swamp rice grass (Leersia hexandra Sw). Dominance by para grass may be deleterious for native communities though some elements are likely to be more severely affected than others (Doulas & O’Connor 2003). Moreover, there are few tools available for controlling extensive infestations of para grass or other invasive, stoloniferous, wetland grasses.
In this paper we discuss the results of a study of prospective control options for para grass growing in seasonally inundated wetlands, exploring the use of burning and cattle grazing as means of reducing the abundance of para grass. The work was based in a conservation reserve in coastal north-east Queensland but the results may be judiciously extrapolated to similar circumstances elsewhere.
4.3.2 Methods
4.3.2.1 Study area and study site
This work was carried out at the Townsville Town Common Conservation Park (TTCCP) which is located in north-east Queensland (19o11’30’S; 146o45’30’E) and supports a range of plant communities, including seasonally inundated, freshwater wetlands. These are especially valued for the populations of water birds that they support. Particularly significant are the large numbers of magpie geese (Anseranas semipalmata Latham) and brolgas (Grus rubicunda Perry) that, at least in the past, have used the area for feeding and breeding.
The TTCCP was used for communal grazing between the 1880s and 1970s. It was gazetted as an Environmental Park in 1980 and became a Conservation Park under the Queensland Nature Conservation Act (1992) in 1994. It is not known exactly when para grass was introduced to the area but it was present, though not especially abundant, in the 1970s and is evident in an aerial photograph taken in 1952 (Perry, pers comm). However, when livestock were removed from the TTCCP, para grass increased to become a dominant plant in the freshwater wetlands. This had major consequences for the flora, fauna and ecosystem structure and function (Williams et al 2005).
The research we discuss here was conducted between 2004 and 2008. It tested the potential for using burning and livestock grazing to restore freshwater wetlands of the TTCCP in which up to 90% of the above-ground biomass consisted of para grass (Grice et al 2006).
5 Olive hymenachne has been introduced to Australia three times: in 1934, 1973 and 1983. There is no evidence
that any material from the first two of these introductions survived. As far as is known, all current populations of Olive hymenachne in Australia are derived from the 1983 introduction which was approved for release in 1988 as Olive hymenachne (Wearne 2010, in press).
81
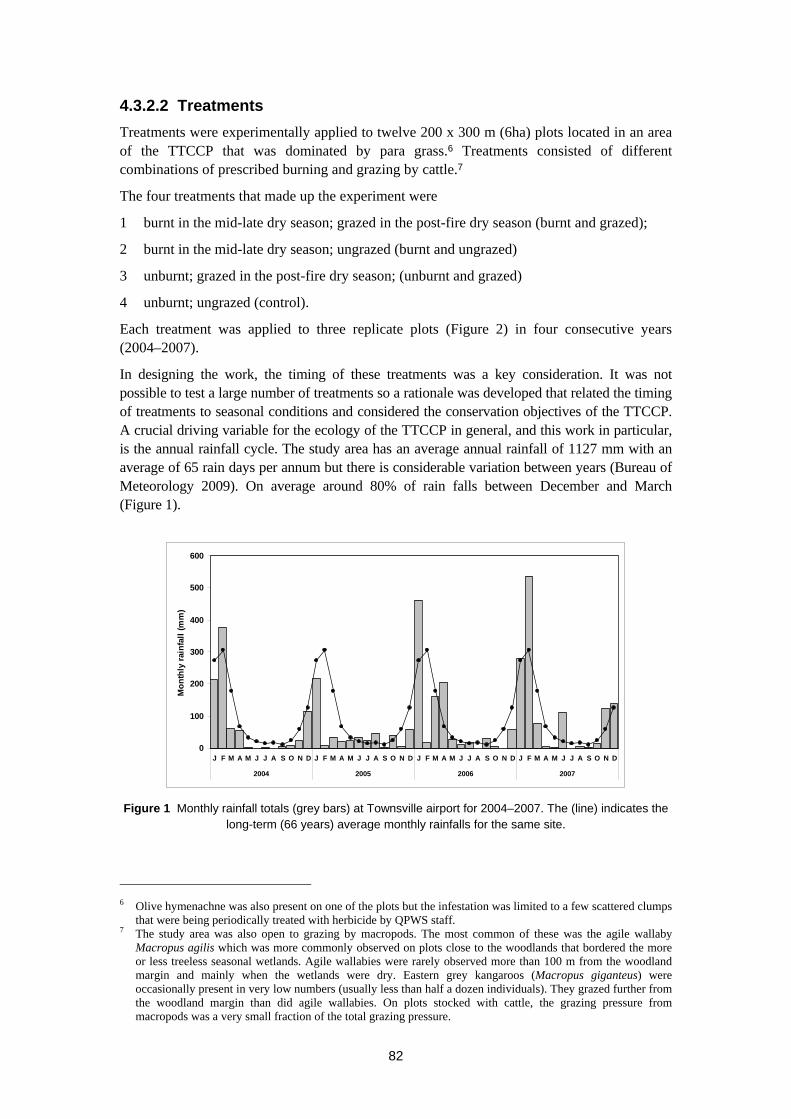
4.3.2.2 Treatments
Treatments were experimentally applied to twelve 200 x 300 m (6ha) plots located in an area of the TTCCP that was dominated by para grass.6 Treatments consisted of different combinations of prescribed burning and grazing by cattle.7
The four treatments that made up the experiment were
1 burnt in the mid-late dry season; grazed in the post-fire dry season (burnt and grazed);
2 burnt in the mid-late dry season; ungrazed (burnt and ungrazed)
3 unburnt; grazed in the post-fire dry season; (unburnt and grazed)
4 unburnt; ungrazed (control).
Each treatment was applied to three replicate plots (Figure 2) in four consecutive years (2004–2007).
In designing the work, the timing of these treatments was a key consideration. It was not possible to test a large number of treatments so a rationale was developed that related the timing of treatments to seasonal conditions and considered the conservation objectives of the TTCCP. A crucial driving variable for the ecology of the TTCCP in general, and this work in particular, is the annual rainfall cycle. The study area has an average annual rainfall of 1127 mm with an average of 65 rain days per annum but there is considerable variation between years (Bureau of Meteorology 2009). On average around 80% of rain falls between December and March (Figure 1).
0
100
200
300
400
500
600
J F M A M J J A S O N D J F M A M J J A S O N D J F M A M J J A S O N D J F M A M J J A S O N D
2004 2005 2006 2007
Mo
nth
ly r
ain
fall
(m
m)
Figure 1 Monthly rainfall totals (grey bars) at Townsville airport for 2004–2007. The (line) indicates the long-term (66 years) average monthly rainfalls for the same site.
6 Olive hymenachne was also present on one of the plots but the infestation was limited to a few scattered clumps
that were being periodically treated with herbicide by QPWS staff. 7 The study area was also open to grazing by macropods. The most common of these was the agile wallaby
Macropus agilis which was more commonly observed on plots close to the woodlands that bordered the more or less treeless seasonal wetlands. Agile wallabies were rarely observed more than 100 m from the woodland margin and mainly when the wetlands were dry. Eastern grey kangaroos (Macropus giganteus) were occasionally present in very low numbers (usually less than half a dozen individuals). They grazed further from the woodland margin than did agile wallabies. On plots stocked with cattle, the grazing pressure from macropods was a very small fraction of the total grazing pressure.
82
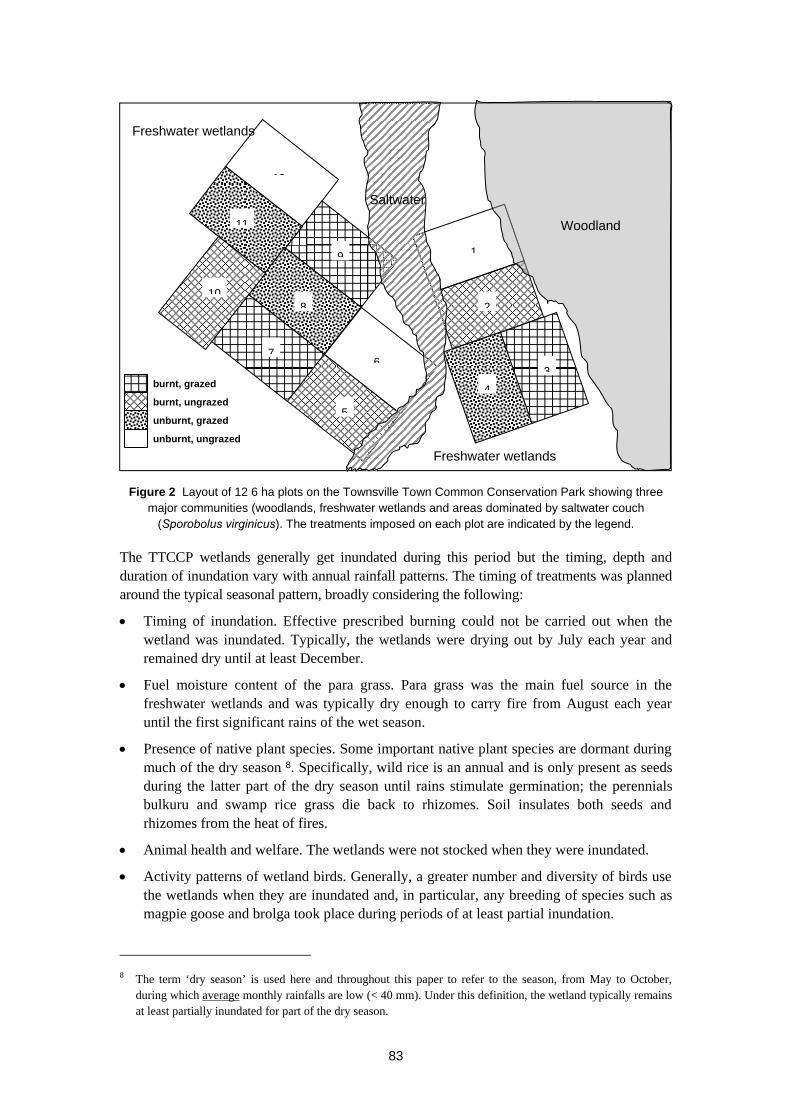
2
34
1
6
5
9
8
7
12
11
10
Freshwater wetlands
Freshwater wetlands
Saltwater
Woodland
unburnt, ungrazed
unburnt, grazed
burnt, ungrazed
burnt, grazed
Figure 2 Layout of 12 6 ha plots on the Townsville Town Common Conservation Park showing three major communities (woodlands, freshwater wetlands and areas dominated by saltwater couch
(Sporobolus virginicus). The treatments imposed on each plot are indicated by the legend.
The TTCCP wetlands generally get inundated during this period but the timing, depth and duration of inundation vary with annual rainfall patterns. The timing of treatments was planned around the typical seasonal pattern, broadly considering the following:
Timing of inundation. Effective prescribed burning could not be carried out when the wetland was inundated. Typically, the wetlands were drying out by July each year and remained dry until at least December.
Fuel moisture content of the para grass. Para grass was the main fuel source in the freshwater wetlands and was typically dry enough to carry fire from August each year until the first significant rains of the wet season.
Presence of native plant species. Some important native plant species are dormant during much of the dry season 8. Specifically, wild rice is an annual and is only present as seeds during the latter part of the dry season until rains stimulate germination; the perennials bulkuru and swamp rice grass die back to rhizomes. Soil insulates both seeds and rhizomes from the heat of fires.
Animal health and welfare. The wetlands were not stocked when they were inundated.
Activity patterns of wetland birds. Generally, a greater number and diversity of birds use the wetlands when they are inundated and, in particular, any breeding of species such as magpie goose and brolga took place during periods of at least partial inundation.
8 The term ‘dry season’ is used here and throughout this paper to refer to the season, from May to October,
during which average monthly rainfalls are low (< 40 mm). Under this definition, the wetland typically remains at least partially inundated for part of the dry season.
83
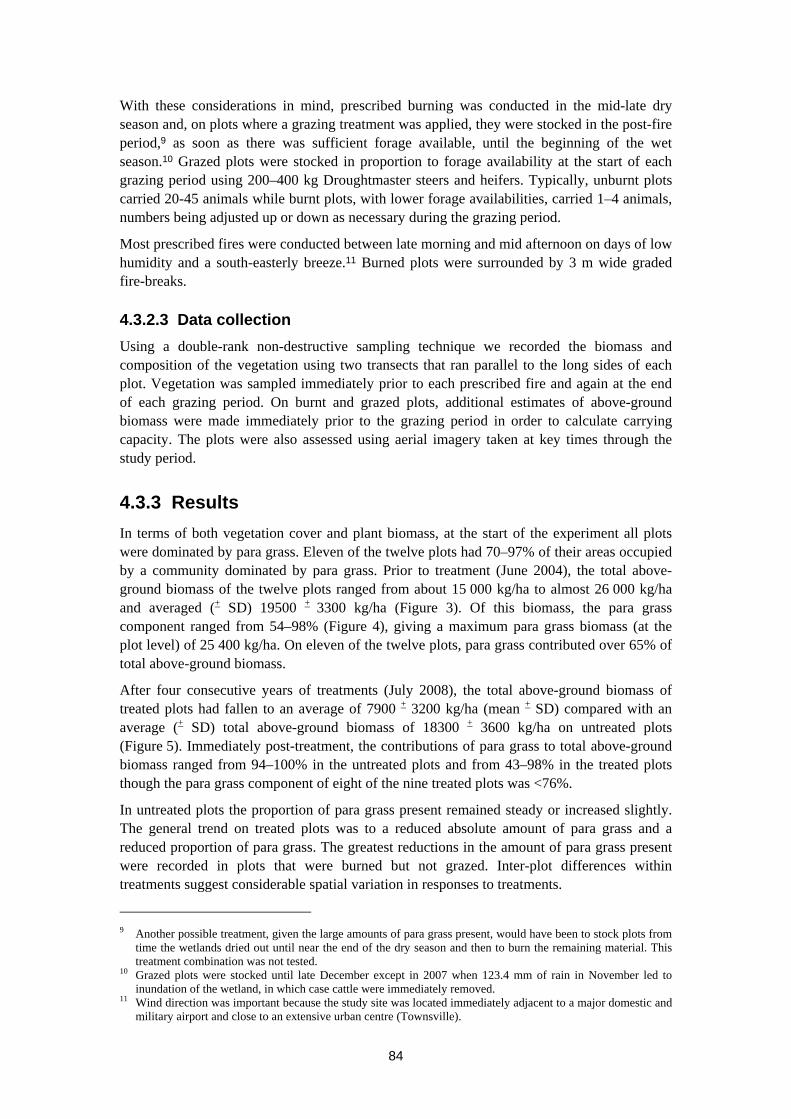
With these considerations in mind, prescribed burning was conducted in the mid-late dry season and, on plots where a grazing treatment was applied, they were stocked in the post-fire period,9 as soon as there was sufficient forage available, until the beginning of the wet season.10 Grazed plots were stocked in proportion to forage availability at the start of each grazing period using 200–400 kg Droughtmaster steers and heifers. Typically, unburnt plots carried 20-45 animals while burnt plots, with lower forage availabilities, carried 1–4 animals, numbers being adjusted up or down as necessary during the grazing period.
Most prescribed fires were conducted between late morning and mid afternoon on days of low humidity and a south-easterly breeze.11 Burned plots were surrounded by 3 m wide graded fire-breaks.
4.3.2.3 Data collection
Using a double-rank non-destructive sampling technique we recorded the biomass and composition of the vegetation using two transects that ran parallel to the long sides of each plot. Vegetation was sampled immediately prior to each prescribed fire and again at the end of each grazing period. On burnt and grazed plots, additional estimates of above-ground biomass were made immediately prior to the grazing period in order to calculate carrying capacity. The plots were also assessed using aerial imagery taken at key times through the study period.
4.3.3 Results
In terms of both vegetation cover and plant biomass, at the start of the experiment all plots were dominated by para grass. Eleven of the twelve plots had 70–97% of their areas occupied by a community dominated by para grass. Prior to treatment (June 2004), the total above-ground biomass of the twelve plots ranged from about 15 000 kg/ha to almost 26 000 kg/ha and averaged (+ SD) 19500 + 3300 kg/ha (Figure 3). Of this biomass, the para grass component ranged from 54–98% (Figure 4), giving a maximum para grass biomass (at the plot level) of 25 400 kg/ha. On eleven of the twelve plots, para grass contributed over 65% of total above-ground biomass.
After four consecutive years of treatments (July 2008), the total above-ground biomass of treated plots had fallen to an average of 7900 + 3200 kg/ha (mean + SD) compared with an average (+ SD) total above-ground biomass of 18300 + 3600 kg/ha on untreated plots (Figure 5). Immediately post-treatment, the contributions of para grass to total above-ground biomass ranged from 94–100% in the untreated plots and from 43–98% in the treated plots though the para grass component of eight of the nine treated plots was <76%.
In untreated plots the proportion of para grass present remained steady or increased slightly. The general trend on treated plots was to a reduced absolute amount of para grass and a reduced proportion of para grass. The greatest reductions in the amount of para grass present were recorded in plots that were burned but not grazed. Inter-plot differences within treatments suggest considerable spatial variation in responses to treatments.
9 Another possible treatment, given the large amounts of para grass present, would have been to stock plots from
time the wetlands dried out until near the end of the dry season and then to burn the remaining material. This treatment combination was not tested.
10 Grazed plots were stocked until late December except in 2007 when 123.4 mm of rain in November led to inundation of the wetland, in which case cattle were immediately removed.
11 Wind direction was important because the study site was located immediately adjacent to a major domestic and military airport and close to an extensive urban centre (Townsville).
84
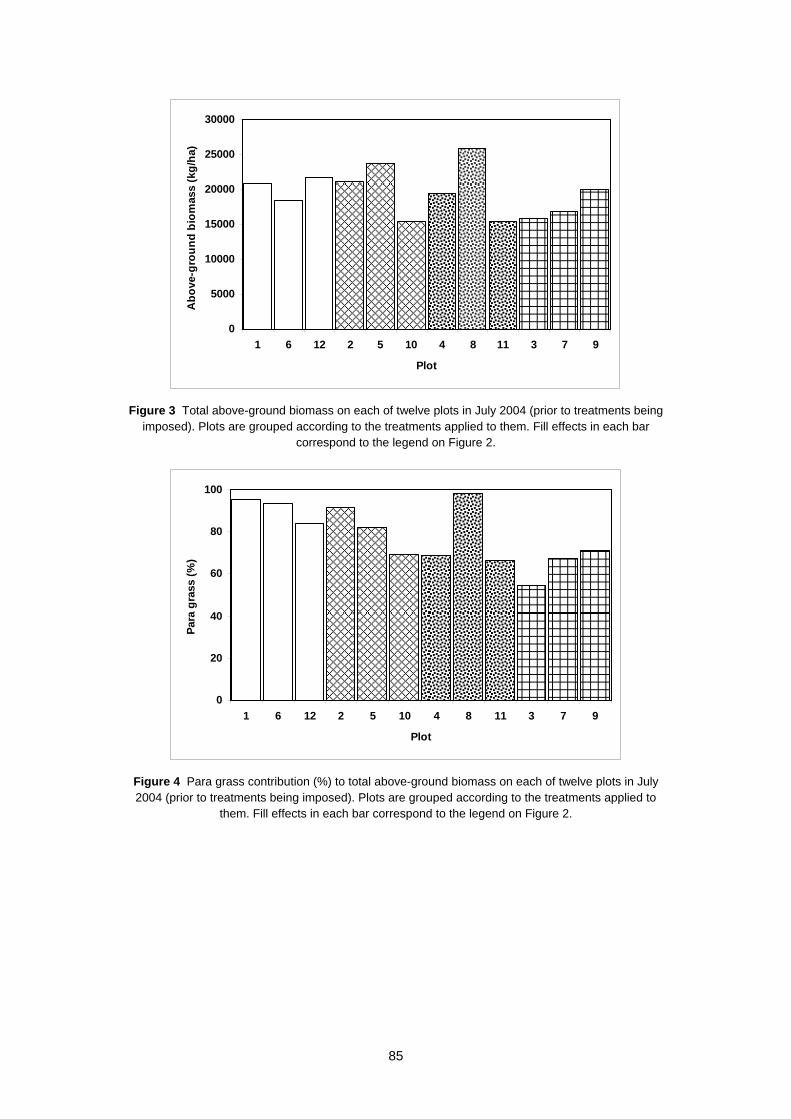
0
5000
10000
15000
20000
25000
30000
1 6 12 2 5 10 4 8 11 3 7 9
Plot
Ab
ove
-gro
un
d b
iom
ass
(kg
/ha)
Figure 3 Total above-ground biomass on each of twelve plots in July 2004 (prior to treatments being
imposed). Plots are grouped according to the treatments applied to them. Fill effects in each bar correspond to the legend on Figure 2.
0
20
40
60
80
100
1 6 12 2 5 10 4 8 11 3 7 9
Plot
Par
a g
rass
(%
)
Figure 4 Para grass contribution (%) to total above-ground biomass on each of twelve plots in July 2004 (prior to treatments being imposed). Plots are grouped according to the treatments applied to
them. Fill effects in each bar correspond to the legend on Figure 2.
85

0
5000
10000
15000
20000
25000
30000
1 6 12 2 5 10 4 8 11 3 7 9
Plot
Ab
ove
-gro
un
d b
iom
ass
(kg
/ha)
Figure 5 Total above-ground biomass on each of twelve plots in July 2008 (after four annual
treatments). Plots are grouped according to the treatments applied to them. Fill effects in each bar correspond to the legend on Figure 2.
0
20
40
60
80
100
1 6 12 2 5 10 4 8 11 3 7 9
Plot
Par
a g
rass
(%
)
Figure 6 Para grass contribution (%) to total above-ground biomass on each of twelve plots in July 2008 (after four annual treatments). Plots are grouped according to the treatments applied to them. Fill
effects in each bar correspond to the legend on Figure 2.
4.3.4 Discussion
This experiment has demonstrated that burning and/or grazing can reduce both the absolute amount of para grass and the proportional contribution of para grass to total above-ground biomass in seasonally inundated wetlands. On average, the reductions in total biomass were substantial under all treatments though there was considerable spatial variation in responses (at plot and sub-plot levels); the reductions in the proportional contributions of para grass were greatest in plots that were burned but not grazed. These results have important practical
86
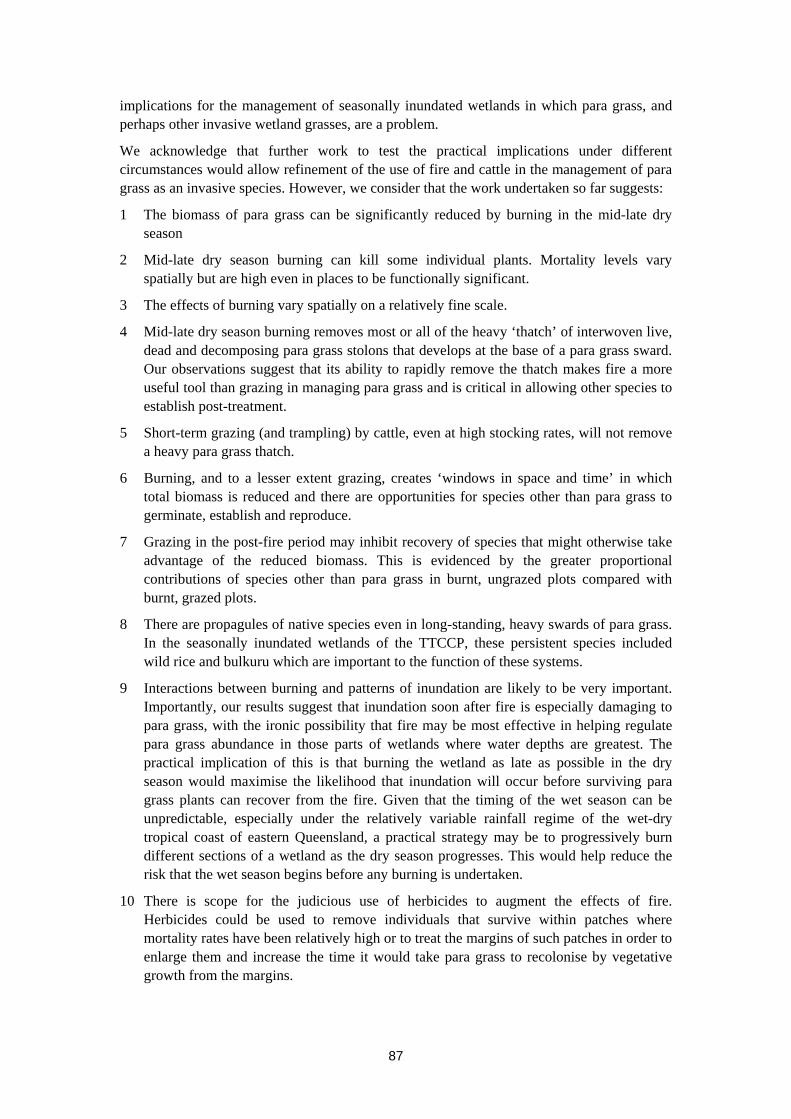
implications for the management of seasonally inundated wetlands in which para grass, and perhaps other invasive wetland grasses, are a problem.
We acknowledge that further work to test the practical implications under different circumstances would allow refinement of the use of fire and cattle in the management of para grass as an invasive species. However, we consider that the work undertaken so far suggests:
1 The biomass of para grass can be significantly reduced by burning in the mid-late dry season
2 Mid-late dry season burning can kill some individual plants. Mortality levels vary spatially but are high even in places to be functionally significant.
3 The effects of burning vary spatially on a relatively fine scale.
4 Mid-late dry season burning removes most or all of the heavy ‘thatch’ of interwoven live, dead and decomposing para grass stolons that develops at the base of a para grass sward. Our observations suggest that its ability to rapidly remove the thatch makes fire a more useful tool than grazing in managing para grass and is critical in allowing other species to establish post-treatment.
5 Short-term grazing (and trampling) by cattle, even at high stocking rates, will not remove a heavy para grass thatch.
6 Burning, and to a lesser extent grazing, creates ‘windows in space and time’ in which total biomass is reduced and there are opportunities for species other than para grass to germinate, establish and reproduce.
7 Grazing in the post-fire period may inhibit recovery of species that might otherwise take advantage of the reduced biomass. This is evidenced by the greater proportional contributions of species other than para grass in burnt, ungrazed plots compared with burnt, grazed plots.
8 There are propagules of native species even in long-standing, heavy swards of para grass. In the seasonally inundated wetlands of the TTCCP, these persistent species included wild rice and bulkuru which are important to the function of these systems.
9 Interactions between burning and patterns of inundation are likely to be very important. Importantly, our results suggest that inundation soon after fire is especially damaging to para grass, with the ironic possibility that fire may be most effective in helping regulate para grass abundance in those parts of wetlands where water depths are greatest. The practical implication of this is that burning the wetland as late as possible in the dry season would maximise the likelihood that inundation will occur before surviving para grass plants can recover from the fire. Given that the timing of the wet season can be unpredictable, especially under the relatively variable rainfall regime of the wet-dry tropical coast of eastern Queensland, a practical strategy may be to progressively burn different sections of a wetland as the dry season progresses. This would help reduce the risk that the wet season begins before any burning is undertaken.
10 There is scope for the judicious use of herbicides to augment the effects of fire. Herbicides could be used to remove individuals that survive within patches where mortality rates have been relatively high or to treat the margins of such patches in order to enlarge them and increase the time it would take para grass to recolonise by vegetative growth from the margins.
87
11 Para grass management using fire and grazing requires a continuing effort. Once the species is well-established in a wetland it likely that it will remain a component indefinitely. However, our work suggests that a management regime can be put in place that reduces the species’ abundance and impacts.
During the course of the work at the TTCCP, the likely importance of several other issues became apparent (Grice et al 2008) They should be considered when attempting to apply these results to other wetlands:
1 Other invasive plant species may be present. Controlling para grass could provide opportunities for other species to proliferate. Two species, in particular, complicate the management of para grass in the TTCCP. First, control of para grass could facilitate increases in Olive hymenachne, a small amount of which is already present. Second, Guinea grass (Megathyrsus maximus (Jacq.) BK Simon & SWL Jacobs, syn Panicum maximum), which grows in the Melaleuca-Eucalyptus woodlands immediately adjacent to the wetland produces much higher above-ground biomass than local native grasses and fuels destructive high intensity fires. Prescribed fires conducted to reduce para grass dominance could escape into these high fuel loads. Co-ordinated management of para grass and other invasive species with which it interacts may be important to the overall restoration of the wetlands and associated habitats.
2 Wetlands may contain some native species that are prone to the measures used to control para grass. On the TTCCP, a small population of Paspalidium udum ST Blake exists in close proximity to para grass infestations (Collett & Williams 2007). This species is listed as vulnerable under the Queensland Nature Conservation Act (1992). It is vulnerable to competition from para grass, but its ecology is poorly known, as is its response to burning designed to manage para grass. Management strategies for para grass must account for the ecology of species that managers wish to retain and encourage.
3 Removing or reducing para grass does not guarantee recovery of more desirable species. Our work showed that long-invaded wetlands can retain populations of at least some native species, either in the seed-bank or as established plants. It is not clear to what extent more comprehensive recovery may be possible without additional restoration action or how long recovery may take. For many wetlands, especially those that have been invaded for a long period of time, the pre-invasion species composition may not be known.
4 Recovery of a wetland under a para grass management regime may be hampered by feral animals. Formerly, the sedge bulkuru dominated significant parts of the freshwater wetlands of the TTCCP. Nowadays, this species is reduced to small patches. These patches are vulnerable to feral pigs that are abundant on the TTCCP. Feral pigs selectively root up remnant patches of bulkuru to feed on its tubers. Pigs may compete with brolgas for this resource and, in some ways, replaced them as a factor in the life cycle of bulkuru. Disturbance by pigs may also inhibit recovery of remnant bulkuru stands and so require that control programmes for para grass and feral pigs be developed in conjunction with one another.
5 The use of prescribed fire and cattle grazing must take into consideration state and local regulations. State/Territory legislation may preclude the use of cattle grazing on some conservation reserves. Socio-economic factors will also influence whether and when prescribed burning is acceptable. In the case of the TTCCP, co-operation between several organisations made possible prescribed burning in close proximity to a major urban centre
88

12 Cattle grazing was legislatively possible on the TTCCP because the area is gazetted as a Conservation Park, whereas cattle grazing is precluded from National Parks under Queensland legislation.
The results of this study on the TTCCP show some promise for the management of para grass in at least some types of seasonally inundated wetlands. On balance, prescribed burning is a more useful and acceptable tool than grazing in the TTCCP system because it can rapidly remove the heavy thatch beneath a para grass sward and it is less demanding than cattle grazing given the infrastructure (fences, watering facilities) and animal husbandry required to run livestock. Using cattle grazing as a tool in seasonally inundated wetlands means that animals must be available at short notice and for a relatively short period (2–4 months). It is important that the ideas derived from this work are tailored to other situations in which they are applied and critically assessed in different circumstances.
References
Bureau of Meteorology 2009. http://www.bom.gov.au/climate/averages/tables/cw_032040.shtml. [accessed January 4, 2009; 11:30 EAST].
Cameron AG 2008. Para grass. Agnote no E30. Serial no 285, Agdex no 131/32. Northern Territory Government, Darwin.
Clayton WD, Harman KT & Williamson H 2006. GrassBase – The Online World Grass Flora. http://www.kew.org/data/grasses-db.html. [accessed 18 December 2009; 09:52 EAST].
Collett A & Williams P 2007. A range extension, and ecological notes, for paspalidium udum: a rare grass from a common swamp. Proceedings of the Royal Society of Queensland 133, 1–2.
Douglas MM & O’Connor RA 2003. Effects of the exotic macrophyte, para grass (Urochloa mutica), on benthic and epiphytic macroinvertebrates of a tropical floodplain. Freshwater Biology 48, 962–971.
Grice AC, Nicholas DM, Williams P & Collins E 2006. Wetlands going under: can invasive grasses be managed? In Proceedings of the 15th Australian Weeds Conference. eds Preston CJH, Watts JD & Crossman ND, Weed Management Society of South Australia, Adelaide, 807–10.
Grice AC, Perry JJ, Nicholas DM & Williams PR 2008. Managing complexity: the example of invasive wetland forage grasses. In Proceedings of the 16th Australian Weeds Conference: Weed Management: Hot Topics in the Tropics. eds van Klinken RD, Osten VA, Panetta FD & Scanlan JC. Queensland Weeds Society, Brisbane, 27–29.
Oram RN 1990. Register of Australian herbage plant cultivars. A. Grasses. 25. Aleman (a) Echinochloa polystachya (HBK) Hitchcock (aleman grass) cv. Amity. CSIRO Division of Plant Industry, 109–110.
12 Prescribed burning at the TTCCP during the course of this experiment was facilitated by the co-operation of
various state and local agencies, an approach that is engendered by the existence of the Townsville Fire Management Forum. Prescribed burning was conducted using qualified teams from CSIRO, QPWS, Townsville City Council and the Queensland Department of Natural Resources and Mines (now the Department of Environment and Resource Management).
89

90
Wearne LJ 2010. The biology of Australian weeds. Hymenachne amplexicaulis (Rudge) Nees cv. Olive. Plant Protection Quarterly (in press).
Wesley-Smith RN 1973. Para grass in the Northern Territory – parentage and propagation. Tropical Grasslands 7, 249–250.
Williams PR, Collins EM & Grice AC 2005. Cattle grazing for para grass management in a mixed species wetland of north-eastern Australia. Ecological Management and Restoration 6, 75–76.
4.4 Floodplain burning workshop outcomes
S Atkins1
4.4.1 Introduction
The presentations and discussion on floodplain burning allowed scientists, land managers, and traditional owners to present information related to the current knowledge that exists for this type of habitat. On conclusion of these presentations participants undertook workshop activities to identify the main treats and knowledge gaps associated with floodplain burning and to come up with some recommendations to management to assist them in making decisions related to floodplain burning activities. It is anticipated that the outcomes of these workshops will provide assistance and direction in the development of the floodplain fire management plan to be developed by the park. This paper briefly summarises the outcomes of the floodplain burning workshops.
4.4.2 Current knowledge
The use and management of floodplains by traditional owners represents many of the natural and cultural values of Kakadu. Traditional fire management of the floodplains sees these areas being burnt periodically to maintain these values.
The native grass Hymenachne acutigluma has spread over significant areas of Kakadu’s floodplains, in some areas limiting access for hunting and gathering and reducing the habitat for wildlife.
Traditional floodplain burning regimes are being reinstated and are specifically aimed at reducing Hymenachne cover and promoting the spread of Eleocharis, and other wetland plant species and to create open water. Areas of Hymenachne are effectively and extensively burnt. Results suggest that traditional floodplain burning practices are an effective way to reduce dense Hymenachne monocultures, which are replaced by other species in areas that had been burnt
Introduced pasture species Olive hymenachne (Hymenachne amplexicaulis) and para grass (Urochloa mutica) have demonstrated a capacity to greatly alter the structure, composition and function of various types of wetlands and riparian zones – both species are present in Kakadu National Park and have thus impacted on wetland fire regimes.
Fire can be used as a tool to assist in the management of introduced weed species on floodplains. Research has shown that
– The biomass of para grass can be significantly reduced by burning in the mid-late dry Season
– Mid-late dry season burning can kill some individual plants. Mortality levels vary
1 Kakadu National Park, Parks Operations and Tourism Branch
91
– Mid-late dry season burning removes most or all of the heavy ‘thatch’ of interwoven live, dead and decomposing para grass stolons that develops at the base of a para grass sward.
– Burning, creates ‘windows in space and time’ in which total biomass is reduced and there are opportunities for species other than para grass to germinate, establish and reproduce.
– Interactions between burning and patterns of inundation are likely to be very important. Results suggest that inundation soon after fire is especially damaging to para grass, with the ironic possibility that fire may be most effective in helping regulate para grass abundance in those parts of wetlands where water depths are greatest. This would help reduce the risk that the wet season begins before any burning is undertaken.
4.4.3 Main threats
The spread of olive hymenachne throughout the floodplain areas of the park has the potential to alter burning regimes on floodplains and is potentially more invasive than native hymenachne which has proven to restrict biodiversity and traditional use of floodplains.
The loss of cultural knowledge related to particularly floodplain burning practises poses a threat to the long term cultural management and use of floodplains.
Climate change effects may alter the intensity and extent of fires and may lead to a change in the fire season. Fire management plans must incorporate these potential effects.
The lack of integration of feral animal, weed control and fire management hampers the successful management of all areas.
4.4.4 Knowledge gaps
The potential effects of climate change on floodplains including salt water inundation potential areas of increased inundation and the effect this may have on fire regimes and fire behaviour and impacts on biodiversity remain largely unknown.
The recruitment of other species onto the floodplain after the native hymenachne is burnt. What is the seed bank of these other species?
Need to identify fire thresholds for the maintenance and recruitment of wetland vegetation communities.
Measurable indication of the success of harvesting and use of the floodplains by bininj, and linking this to floodplain fire practises and species composition of floodplain habitats.
Lack hydrological data related to floodplain areas – lack of monitoring of water levels, mapping of areas subject to seasonal inundation. And the interaction between these hydrological characteristics with fire and weeds.
Impact of fire on floodplain fauna – specifically hibernating turtles and other species that utilise the floodplain
An integrated, sustained, systematic monitoring across al floodplain management areas – a system that records and documents ecological and cultural checks of floodplain function..
92

93
Understanding of the interactions between weeds such as para grass and olive hymenachne and native hymenachne with fire and seasonal inundations of wetlands.
Accurate baseline of floodplain ecology – pre buffalo
Fine scale burning of floodplains is often undetected by satellite image – in order to assess the success of floodplain burning activities accurate data associated with burns, species composition , water levels, weather conditions and species observation needs to be collected.
4.4.5 Management recommendations
There needs to be a clear objective of floodplain burning defined. An objective that sets the direction of burning in floodplain landscapes and one that is measurable.
Ongoing monitoring of fire and its impacts on the floodplain. Including rigorous and explicit monitoring of fire (including information about timing, extent of individual fires) and the long term commitment to the Three Parks Fire Monitoring Program.
Effective implementation of research and monitoring findings into park management activities. Using information
Traditional owners and Bininj need to be involved in all aspects of fire management on floodplains, they should have input in the development and implementation of fire management strategies. The integration of traditional knowledge needs to be part of all fire management strategies in the Park.
There needs to be increased encouragement of more traditional owners to participate in floodplain burning projects, this maybe achieved through increased communication and education of floodplain burning programs and opportunities for other bininj to engage in floodplain burning.
Need to be responsive to the conditions of each individual year as they vary (flexibility that is built into traditional burning backed with knowledge and assessment)

Part 5 Stone country fire management
Introduction
The Arnhem Land Plateau is an area of great importance both biologically and culturally. It has the most endemic plant and animal species found anywhere in the Northern Territory (Woinarski et al 2006). The sandstone heath vegetation is the most diverse plant community in the NT. The area is of great importance culturally to Traditional Owners for many reasons including extensive and ancient rock art sites. About 15% (5100 square kilometres) of the Arnhem Land Plateau is found within Kakadu National Park. This is over 25% of the total area of Kakadu National Park.
There is a general consensus among traditional owners, scientists, land managers and non government organisations that management of fire on the Arnhem Land Plateau needs to be improved, and there has been a significant investment in the management of the stone country by various organisations in recent years.
Reference
Woinarski JCZ, Hempel C, Cowie I, Brennan K, Kerrigan R, Leach G & Russell-Smith J 2006. Distributional pattern of plant species endemic to the Northern Territory, Australia. Australian Journal of Botany 54 (7), 627–640.
94

5.1 An aerial assessment of the incidence of fire in rocky (and associated) environments in
Kakadu National Park during the 2006 dry season
K Brennan1
5.1.1 Introduction
This survey was initiated by the NRM staff in Kakadu National Park to obtain an independent assessment of the extent of fire in escarpment areas during the dry season of 2006. The ‘stone country’ fires during 2006 were considered by many to have been particularly severe and the aim of this survey was to provide information not only about their extent but also their impact on fire sensitive vegetation communities such as sandstone shrubland (or heath) (Russell-Smith et al 1998, 2002), monsoon forest (Allosyncarpia ternata) (Bowman 1994, Russell-Smith et al 1998), and stands of Callitris intratropica woodland (Bowman & Panton 1993, Bowman et al 2001).
5.1.2 Methods
5.1.2.1 Aerial Survey
The survey was conducted from November 20–23, 2006 using a Robinson R44 helicopter flying at ~ 100 km hr-1 and 100–200 m above ground level. The flight path comprised 8 predetermined, evenly spaced (10 km apart), north-south transects which traversed much of the rocky terrain throughout Kakadu National Park (Figure 1). The total transect length was 870 km. Every 500 m along each transect an assessment was made of the fire impact, terrain type and vegetation type in a 50 m x 50 m quadrat (estimated) on the ground, directly below the aircraft. The 500 m interval between consecutive sample points was determined from a GPS unit continuously displaying the distance from the beginning of each transect.
Perc
ent
(with
in a
ll da
ta)
Terrain_class USSHLES
50
40
30
20
10
0
Veg_categoryALSHEW
Figure 1 Incidence of vegetation types among terrain classes
Vegetation categories are: AL= Allosyncarpia, SH = shrubland, EW = woodland
Terrain classes are: ES = escarpment, HL =rocky hill, USS = upland sand sheets
1 Department of Natural Resources, Environment, the Arts and Sport
95

Fire impact was scored in 3 categories:
0= unburnt
1= patchily burnt (some of the ground and/or shrub layer clearly unburnt) and
2= completely burnt (all of the ground and shrub layer burnt)
The extent of crown scorch or death amongst trees was not recorded systematically but noted incidentally wherever it was particularly severe.
Terrain type was scored in 7 categories:
0= lowland terrain, not rocky
1= escarpment scree slopes (rising from lowland environments)
2= rock sheets
3= deep gully complexes (areas of deeply incised sandstone)
4= major gorge
5= upland rocky hills
6= upland sand sheets
Vegetation type was scored in 8 general categories but for some (marked with an *), additional descriptors were also attempted. The 8 general categories were:
0= bare
1= eucalypt /Corymbia woodland*
2= shrubland*
3= Allosyncarpia forest
4= monsoon forest (other than Allosyncarpia)
5= riparian woodland / forest
6= Callitris woodland
7= swampy wetlands
*For the eucalypt/Corymbia woodland and shrubland categories an attempt was also made to record dominant co-occurring understorey vegetation. For eucalypt/Corymbia woodland these were:
10= with no understorey apparent
11= with Triodia-dominated understorey
12= with annual Sarga (Sorghum)-dominated understorey
13= with shrub-dominated understorey
Similarly for shrublands:
20= no co-existing grassy species apparent
21= with Triodia
22= with Sarga (Sorghum)
23= with Micraira
96
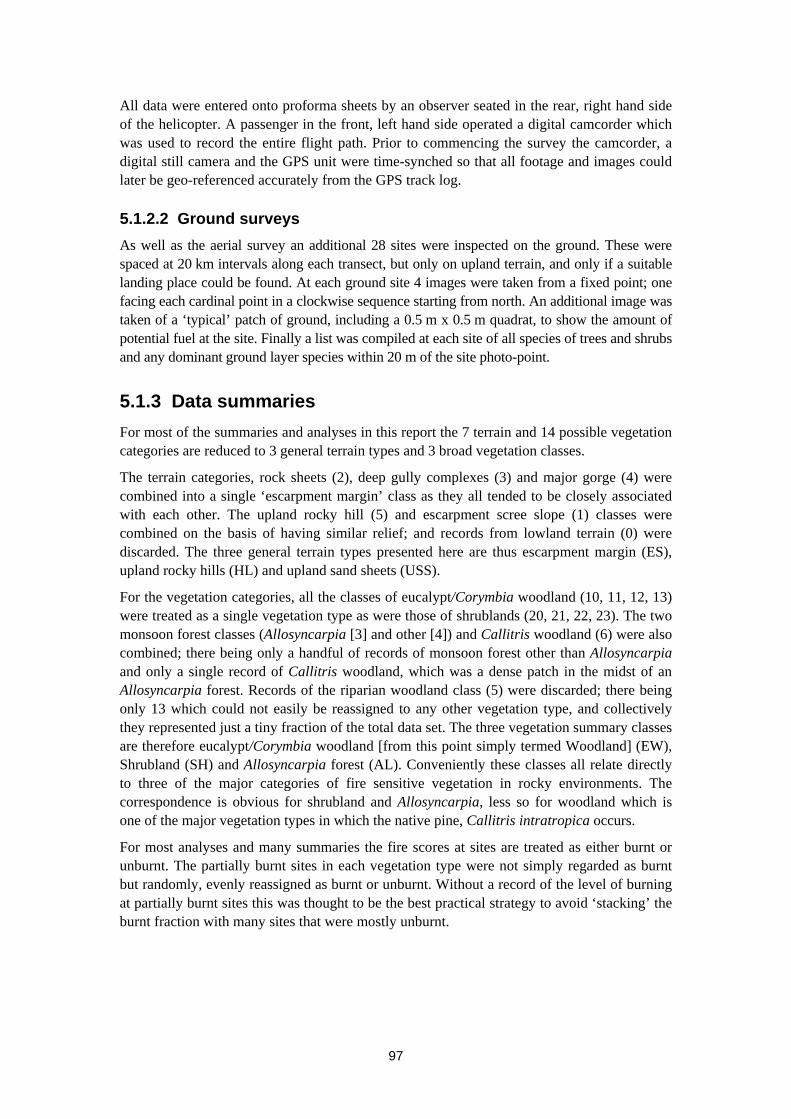
All data were entered onto proforma sheets by an observer seated in the rear, right hand side of the helicopter. A passenger in the front, left hand side operated a digital camcorder which was used to record the entire flight path. Prior to commencing the survey the camcorder, a digital still camera and the GPS unit were time-synched so that all footage and images could later be geo-referenced accurately from the GPS track log.
5.1.2.2 Ground surveys
As well as the aerial survey an additional 28 sites were inspected on the ground. These were spaced at 20 km intervals along each transect, but only on upland terrain, and only if a suitable landing place could be found. At each ground site 4 images were taken from a fixed point; one facing each cardinal point in a clockwise sequence starting from north. An additional image was taken of a ‘typical’ patch of ground, including a 0.5 m x 0.5 m quadrat, to show the amount of potential fuel at the site. Finally a list was compiled at each site of all species of trees and shrubs and any dominant ground layer species within 20 m of the site photo-point.
5.1.3 Data summaries
For most of the summaries and analyses in this report the 7 terrain and 14 possible vegetation categories are reduced to 3 general terrain types and 3 broad vegetation classes.
The terrain categories, rock sheets (2), deep gully complexes (3) and major gorge (4) were combined into a single ‘escarpment margin’ class as they all tended to be closely associated with each other. The upland rocky hill (5) and escarpment scree slope (1) classes were combined on the basis of having similar relief; and records from lowland terrain (0) were discarded. The three general terrain types presented here are thus escarpment margin (ES), upland rocky hills (HL) and upland sand sheets (USS).
For the vegetation categories, all the classes of eucalypt/Corymbia woodland (10, 11, 12, 13) were treated as a single vegetation type as were those of shrublands (20, 21, 22, 23). The two monsoon forest classes (Allosyncarpia [3] and other [4]) and Callitris woodland (6) were also combined; there being only a handful of records of monsoon forest other than Allosyncarpia and only a single record of Callitris woodland, which was a dense patch in the midst of an Allosyncarpia forest. Records of the riparian woodland class (5) were discarded; there being only 13 which could not easily be reassigned to any other vegetation type, and collectively they represented just a tiny fraction of the total data set. The three vegetation summary classes are therefore eucalypt/Corymbia woodland [from this point simply termed Woodland] (EW), Shrubland (SH) and Allosyncarpia forest (AL). Conveniently these classes all relate directly to three of the major categories of fire sensitive vegetation in rocky environments. The correspondence is obvious for shrubland and Allosyncarpia, less so for woodland which is one of the major vegetation types in which the native pine, Callitris intratropica occurs.
For most analyses and many summaries the fire scores at sites are treated as either burnt or unburnt. The partially burnt sites in each vegetation type were not simply regarded as burnt but randomly, evenly reassigned as burnt or unburnt. Without a record of the level of burning at partially burnt sites this was thought to be the best practical strategy to avoid ‘stacking’ the burnt fraction with many sites that were mostly unburnt.
97
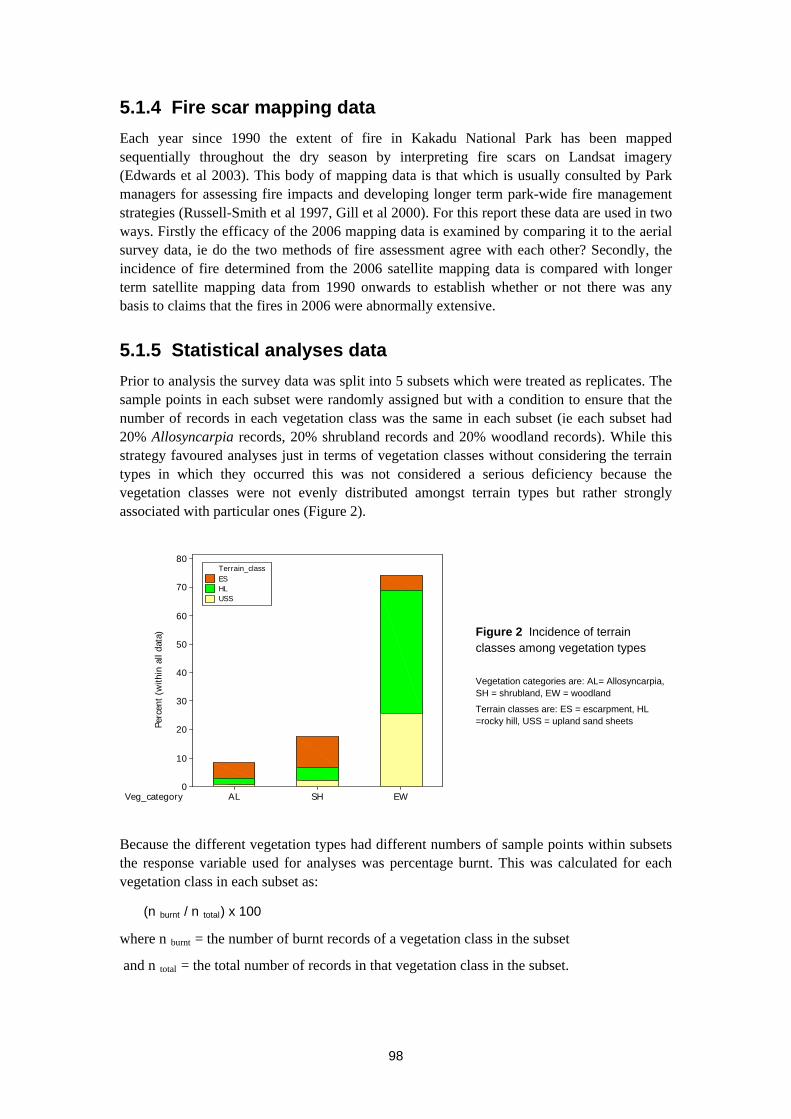
5.1.4 Fire scar mapping data
Each year since 1990 the extent of fire in Kakadu National Park has been mapped sequentially throughout the dry season by interpreting fire scars on Landsat imagery (Edwards et al 2003). This body of mapping data is that which is usually consulted by Park managers for assessing fire impacts and developing longer term park-wide fire management strategies (Russell-Smith et al 1997, Gill et al 2000). For this report these data are used in two ways. Firstly the efficacy of the 2006 mapping data is examined by comparing it to the aerial survey data, ie do the two methods of fire assessment agree with each other? Secondly, the incidence of fire determined from the 2006 satellite mapping data is compared with longer term satellite mapping data from 1990 onwards to establish whether or not there was any basis to claims that the fires in 2006 were abnormally extensive.
5.1.5 Statistical analyses data
Prior to analysis the survey data was split into 5 subsets which were treated as replicates. The sample points in each subset were randomly assigned but with a condition to ensure that the number of records in each vegetation class was the same in each subset (ie each subset had 20% Allosyncarpia records, 20% shrubland records and 20% woodland records). While this strategy favoured analyses just in terms of vegetation classes without considering the terrain types in which they occurred this was not considered a serious deficiency because the vegetation classes were not evenly distributed amongst terrain types but rather strongly associated with particular ones (Figure 2).
Perc
ent (
with
in a
ll da
ta)
Veg_category EWSHAL
80
70
60
50
40
30
20
10
0
Terrain_classESHLUSS
Figure 2 Incidence of terrain classes among vegetation types
Vegetation categories are: AL= Allosyncarpia, SH = shrubland, EW = woodland
Terrain classes are: ES = escarpment, HL =rocky hill, USS = upland sand sheets
Because the different vegetation types had different numbers of sample points within subsets the response variable used for analyses was percentage burnt. This was calculated for each vegetation class in each subset as:
(n burnt / n total) x 100
where n burnt = the number of burnt records of a vegetation class in the subset
and n total = the total number of records in that vegetation class in the subset.
98
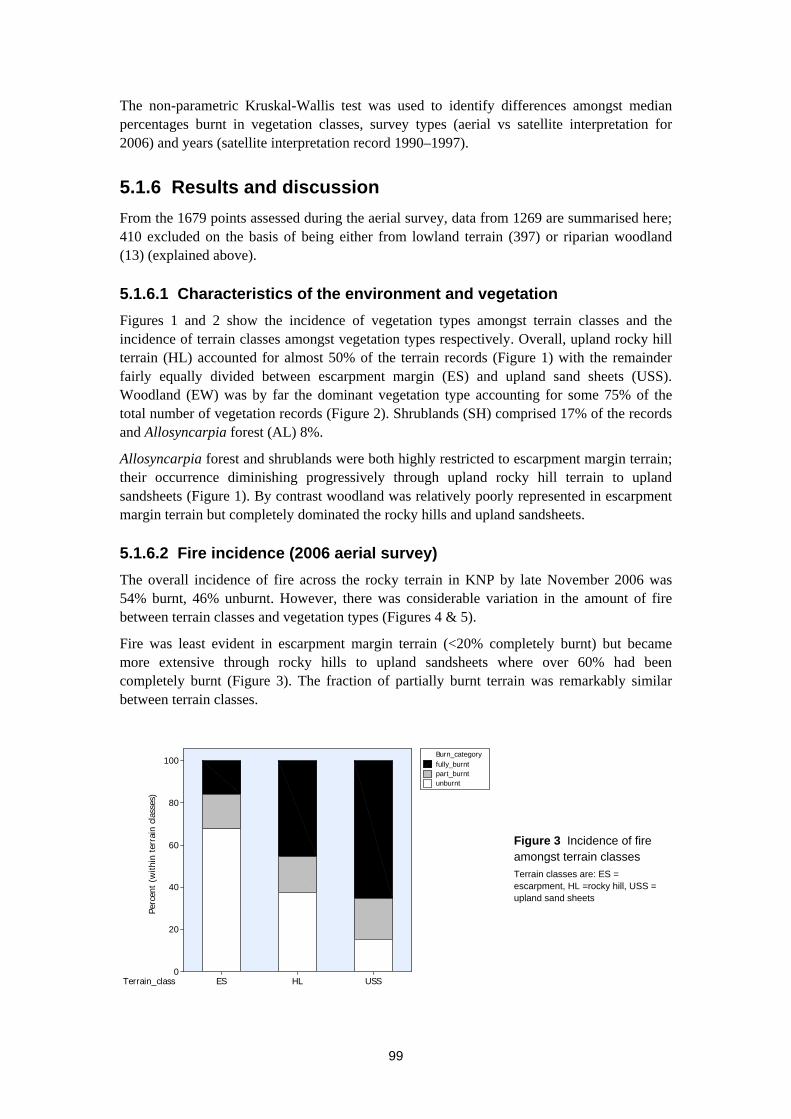
The non-parametric Kruskal-Wallis test was used to identify differences amongst median percentages burnt in vegetation classes, survey types (aerial vs satellite interpretation for 2006) and years (satellite interpretation record 1990–1997).
5.1.6 Results and discussion
From the 1679 points assessed during the aerial survey, data from 1269 are summarised here; 410 excluded on the basis of being either from lowland terrain (397) or riparian woodland (13) (explained above).
5.1.6.1 Characteristics of the environment and vegetation
Figures 1 and 2 show the incidence of vegetation types amongst terrain classes and the incidence of terrain classes amongst vegetation types respectively. Overall, upland rocky hill terrain (HL) accounted for almost 50% of the terrain records (Figure 1) with the remainder fairly equally divided between escarpment margin (ES) and upland sand sheets (USS). Woodland (EW) was by far the dominant vegetation type accounting for some 75% of the total number of vegetation records (Figure 2). Shrublands (SH) comprised 17% of the records and Allosyncarpia forest (AL) 8%.
Allosyncarpia forest and shrublands were both highly restricted to escarpment margin terrain; their occurrence diminishing progressively through upland rocky hill terrain to upland sandsheets (Figure 1). By contrast woodland was relatively poorly represented in escarpment margin terrain but completely dominated the rocky hills and upland sandsheets.
5.1.6.2 Fire incidence (2006 aerial survey)
The overall incidence of fire across the rocky terrain in KNP by late November 2006 was 54% burnt, 46% unburnt. However, there was considerable variation in the amount of fire between terrain classes and vegetation types (Figures 4 & 5).
Fire was least evident in escarpment margin terrain (<20% completely burnt) but became more extensive through rocky hills to upland sandsheets where over 60% had been completely burnt (Figure 3). The fraction of partially burnt terrain was remarkably similar between terrain classes.
Perc
ent
(with
in t
erra
in c
lass
es)
Terrain_class USSHLES
100
80
60
40
20
0
Burn_categoryfully_burntpart_burntunburnt
Figure 3 Incidence of fire amongst terrain classes Terrain classes are: ES = escarpment, HL =rocky hill, USS = upland sand sheets
99

Perc
ent (
with
in v
eg c
ateg
ory)
Veg_category EWSHAL
100
80
60
40
20
0
Burn_categoryfully_burntpart_burntunburnt
Figure 4 Incidence of fire amongst vegetation types Vegetation categories are: AL= Allosyncarpia, SH = shrubland, EW = woodland
Perc
ent (
of v
eg t
ype
with
in t
erra
in c
lass
)
Terrain_classVeg_category
USSHLESEWSHALEWSHALEWSHAL
100
80
60
40
20
0
Burn_categoryfully_burntpart_burntunburnt
Figure 5 Incidence of fire amongst vegetation types within terrain classes Vegetation categories are: AL= Allosyncarpia, SH = shrubland, EW = woodland
Terrain classes are: ES = escarpment, HL =rocky hill, USS = upland sand sheets
The incidence of fire in Allosyncarpia forest (9% fully burnt) and shrubland (15% fully burnt) was much less than for woodland which was 55% fully burnt (Figure 4). Overall, less than 30% of the Allosyncarpia and shrubland vegetation types had been affected by fire (of any intensity) whereas for woodland it was around 75%. On the basis of fire presence / absence data, there was a significant difference in the median percentages burnt amongst the vegetation classes (Kruskall-Wallace test H=9.5, df =2, p <0.05); the amount of fire in woodland being significantly greater than in either shrubland or Allosyncarpia (which were similar to each other).
Figure 5 shows that the higher incidence of fire in woodland vegetation compared to Allosyncarpia forest and shrubland was evident across all the terrain types. Furthermore it also shows that the extent of fire in woodland increased progressively from escarpment margin
100

terrain through rocky hills to the upland sandsheets and woodland on upland sandsheets was the most extensively burnt environment; 70% completely burnt and just 9% unburnt. The least burnt environment (of any spatial significance) was shrubland in escarpment margin terrain, being almost 80% unburnt, around 10% partially burnt and 10% fully burnt.
5.1.6.3 Comparison with 2006 satellite interpretation data.
Using the satellite interpreted data (from the same sample points used in the aerial survey) the rocky terrain in KNP in 2006 was 53% burnt, 47% unburnt, essentially the same as that found from the aerial survey data.
Table 1 shows how well the 2006 satellite data either agreed or, was at odds with the aerial survey results across the range of vegetation classes. The level of agreement between the methods was remarkably consistent across vegetation classes, in the range of 70 – 75%.
Table 1 Percentage disagreement/agreement between assessment methods amongst vegetation classes
Disagreement / agreement type
Vegetation class Aerial = burnt
Sat interp = unburnt
Aerial = unburnt
Sat interp = burnt
Aerial =
Sat interp
Allosyncarpia (n=105) 14% (15) 16% (17) 70% (73)
Shrubland (n=221) 12% (27) 19% (43) 69% (151)
Woodland (n=924) 14% (129) 11% (104) 75% (760)
Despite 25–30% of the satellite records disagreeing with the aerial observations there were no large biases in these disagreed fractions in any of the vegetation types so it was therefore not surprising that the patterns in the satellite data and the aerial data were identical (Table 2, Figure 6).
% b
urnt
vegetation classdata set
WoodlandShrublandA llosyncarpiasat06aer06sat06aer06sat06aer06
70
60
50
40
30
20
10
0
Figure 6 A comparison between data sources of the mean percentage burnt (± 95%CI for the mean) in each vegetation class. aer06= 2006 aerial survey data, sat06 = 2006 satellite interpreted data
101
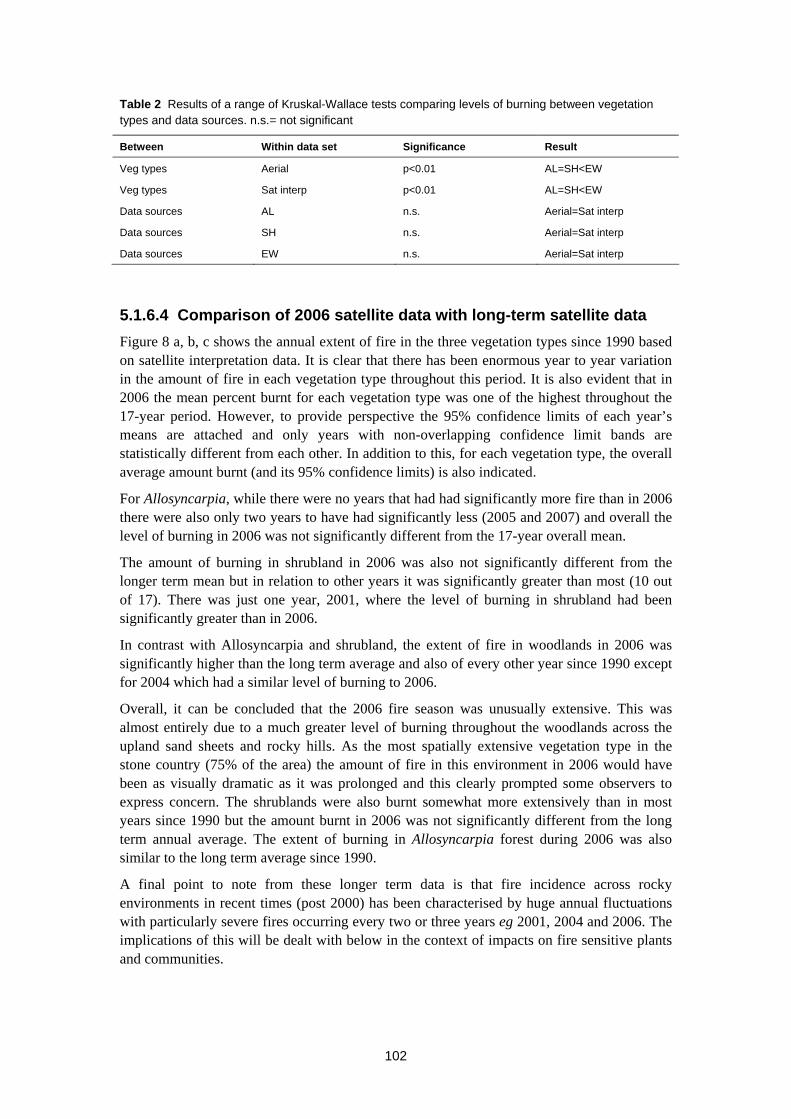
Table 2 Results of a range of Kruskal-Wallace tests comparing levels of burning between vegetation types and data sources. n.s.= not significant
Between Within data set Significance Result
Veg types Aerial p<0.01 AL=SH<EW
Veg types Sat interp p<0.01 AL=SH<EW
Data sources AL n.s. Aerial=Sat interp
Data sources SH n.s. Aerial=Sat interp
Data sources EW n.s. Aerial=Sat interp
5.1.6.4 Comparison of 2006 satellite data with long-term satellite data
Figure 8 a, b, c shows the annual extent of fire in the three vegetation types since 1990 based on satellite interpretation data. It is clear that there has been enormous year to year variation in the amount of fire in each vegetation type throughout this period. It is also evident that in 2006 the mean percent burnt for each vegetation type was one of the highest throughout the 17-year period. However, to provide perspective the 95% confidence limits of each year’s means are attached and only years with non-overlapping confidence limit bands are statistically different from each other. In addition to this, for each vegetation type, the overall average amount burnt (and its 95% confidence limits) is also indicated.
For Allosyncarpia, while there were no years that had had significantly more fire than in 2006 there were also only two years to have had significantly less (2005 and 2007) and overall the level of burning in 2006 was not significantly different from the 17-year overall mean.
The amount of burning in shrubland in 2006 was also not significantly different from the longer term mean but in relation to other years it was significantly greater than most (10 out of 17). There was just one year, 2001, where the level of burning in shrubland had been significantly greater than in 2006.
In contrast with Allosyncarpia and shrubland, the extent of fire in woodlands in 2006 was significantly higher than the long term average and also of every other year since 1990 except for 2004 which had a similar level of burning to 2006.
Overall, it can be concluded that the 2006 fire season was unusually extensive. This was almost entirely due to a much greater level of burning throughout the woodlands across the upland sand sheets and rocky hills. As the most spatially extensive vegetation type in the stone country (75% of the area) the amount of fire in this environment in 2006 would have been as visually dramatic as it was prolonged and this clearly prompted some observers to express concern. The shrublands were also burnt somewhat more extensively than in most years since 1990 but the amount burnt in 2006 was not significantly different from the long term annual average. The extent of burning in Allosyncarpia forest during 2006 was also similar to the long term average since 1990.
A final point to note from these longer term data is that fire incidence across rocky environments in recent times (post 2000) has been characterised by huge annual fluctuations with particularly severe fires occurring every two or three years eg 2001, 2004 and 2006. The implications of this will be dealt with below in the context of impacts on fire sensitive plants and communities.
102

Figure 7 Annual extent of fire in the three vegetation types 1990–2007 data points represent means +/- 95% confidence limits. 2006 data points in red
2006a = mean from 2006 aerial survey data, 2006s = mean from 2006 satellite data
Other reference lines are; the overall mean +/- 95% confidence limits (solid black lines), the 95% confidence limits for the 2006 mean from satellite data (broken red lines)
and the ecological management threshold [emt] (solid blue line).
Y e a r
%bu
rnt
200 7
2006
s
2006
a20
0520
0 420
0320
0 220
012 00
019
991 99
819
971 99
619
951 99
419
931 99
219
911 99
0
70
60
50
40
30
20
10
0
m eanem t
c. w ood land
7 0
6 0
5 0
4 0
3 0
2 0
1 0
0
a . A l l o s y n c a r p ia
%bu
rnt
m e a ne m t
7 0
6 0
5 0
4 0
3 0
2 0
1 0
b . s h r u b la n d
%bu
rnt
m e a n
e m t
103

5.1.6.5 Impact on fire sensitive plants/communities
To assess whether the extent of burning in rocky environments was abnormally extensive in 2006 comparisons were made with the longer term 17-year mean and in relation to other individual years. However, the impact of fire on fire sensitive plants / communities can only be assessed by comparison with derived ecological management thresholds (Petty et al 2007) which consider the frequency of fire that can be tolerated by fire sensitive plants without causing long term population decline. Also in this instance, the extent of fire in a single year is far less important than the longer term regime it is part of.
From Petty et al (2007) the ecological management thresholds of four rocky country vegetation types are; Allosyncarpia forest – 10%, sandstone shrubland – 20%, sandstone woodland – 33% and Callitris intratropica woodland – 10%. For Allosyncarpia forest and shrubland the amounts burnt in 2006 were not significantly different from the long term means and these are each very close to, indeed slightly less than, the respective ecological management thresholds for these vegetation types (Figure 7a,b). From this it could be tempting to conclude that the fire regime over the last 18 years has been a model of vigilant stewardship for Allosyncarpia forest or shrubland. However this conclusion assumes that each year fire occurs randomly within each vegetation type such that over time all patches within a given vegetation type receive the same frequency of burning (which hopefully equates to, or is less than, its ecological management threshold).
Table 3a shows that the fire frequency amongst sites within each vegetation type has not been distributed uniformly over the last 18 years. While many sites in all three vegetation types were burnt at frequencies close to or less than the ecological management threshold there were also many others that were overburnt. In particular almost 30% of the Allosyncarpia forest and woodland and almost 20% of the shrublands has been overburnt in the period since 1990.
The assessment of the case of the native pine, Callitris intratropica, is a little more complex because it occurs as a component of woodlands as well as in denser forest associated with Allosyncarpia. However, on the basis of its ecological management threshold (10%), Callitris could not persist sustainably in over 90% of the woodlands or 30% of the Allosyncarpia sites. The demise of Callitris in woodland situations has been well documented (Bowman & Panton 1993, Bowman et al 2001).
Another extremely important element of non-random fire incidence within vegetation types is the impact of ‘runs’ or sequences of short fire-intervals within longer time spans. During such sequences communities may get burnt at levels exceeding their ecological management thresholds to a greater extent than is apparent by just considering fire frequencies ‘averaged’ over the longer term. In this case the 6 year period from 2001 to 2006 seemed a particularly relevant example, comprising a set of years that included three years (2001, 2004 & 2006) where fires were unusually extensive compared to the 17-year average (Figure 7 a,b,c). The fire frequencies for this 6-year period are summarised in Table 3b and it plainly demonstrates the point, showing that during this time 40–50% of each vegetation class was excessively burnt relative to desirable ecological management thresholds; levels nearly twice those evident from the uncritical treatment of the 17-year period as a whole.
104
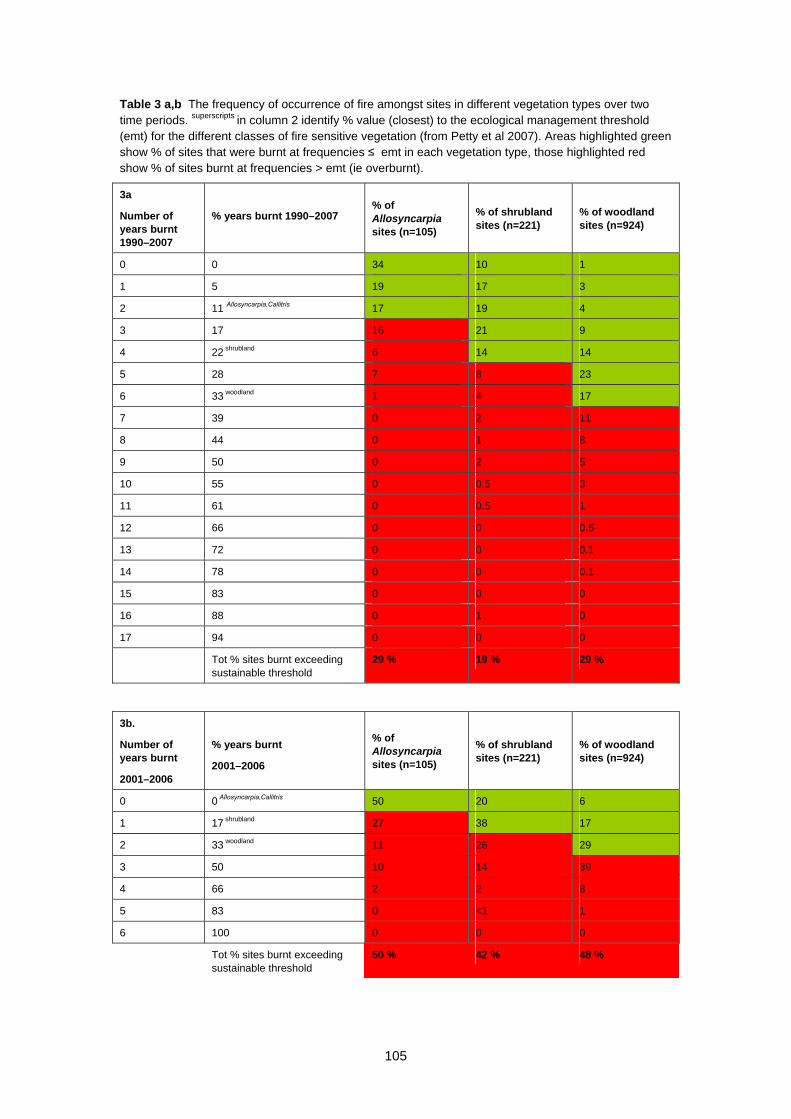
Table 3 a,b The frequency of occurrence of fire amongst sites in different vegetation types over two time periods. superscripts in column 2 identify % value (closest) to the ecological management threshold (emt) for the different classes of fire sensitive vegetation (from Petty et al 2007). Areas highlighted green show % of sites that were burnt at frequencies ≤ emt in each vegetation type, those highlighted red show % of sites burnt at frequencies > emt (ie overburnt).
3a
Number of years burnt 1990–2007
% years burnt 1990–2007 % of Allosyncarpia sites (n=105)
% of shrubland sites (n=221)
% of woodland sites (n=924)
0 0 34 10 1
1 5 19 17 3
2 11 Allosyncarpia,Callitris 17 19 4
3 17 16 21 9
4 22 shrubland 6 14 14
5 28 7 8 23
6 33 woodland 1 4 17
7 39 0 2 11
8 44 0 1 8
9 50 0 2 5
10 55 0 0.5 3
11 61 0 0.5 1
12 66 0 0 0.5
13 72 0 0 0.1
14 78 0 0 0.1
15 83 0 0 0
16 88 0 1 0
17 94 0 0 0
Tot % sites burnt exceeding sustainable threshold
29 % 19 % 29 %
3b.
Number of years burnt
2001–2006
% years burnt
2001–2006
% of Allosyncarpia sites (n=105)
% of shrubland sites (n=221)
% of woodland sites (n=924)
0 0 Allosyncarpia,Callitris 50 20 6
1 17 shrubland 27 38 17
2 33 woodland 11 26 29
3 50 10 14 39
4 66 2 2 8
5 83 0 <1 1
6 100 0 0 0
Tot % sites burnt exceeding sustainable threshold
50 % 42 % 48 %
105

Figure 8 Geographical distribution of the overburnt sites
Overall there is clearly a substantial fraction of Callitris intratropica, Allosyncarpia forest, shrubland, and even ‘fire-tolerant’ woodland vegetation that, relative to accepted ecological management thresholds, is being burnt too frequently and therefore prone to, or in the grip of long term floristic degradation. Figure 8 shows the geographical distribution of the overburnt sites. Its most striking feature is the concentration of excessively burnt woodlands in the southern part of the Park, south of the South Alligator River, particularly across the Marrawal plateau. There are also concentrations of overburnt Allosyncarpia forest sites on the sandstone plateau and sandsheet country bounded by Twin Falls, Koolpin Gorge, Gunlom, Maguk and
106

Graveside Gorge, as well as on the Mt Brockman outlier. During the aerial survey we opportunistically noted areas showing conspicuous damage from excessive long term burning (prompted purely by shock value!). By coincidence, at the end of the survey all these notes all concerned the poor state of the woodland and open forest on the Marrawal plateau and the degradation of Allosyncarpia patches in the Koolpin -Graveside region. In the case of the Marrawal plateau extensive woodland damage was also noted in other parts, in the adjoining Nitmiluk National Park during a ground-based fauna survey there in 2005 (K Brennan pers obs). There is clearly a need to develop a [better?] co-operative fire management strategy between agencies to manage this area more effectively.
In closing it is also worth noting two final issues concerning the vulnerability of sandstone vegetation to fire. They are linked by a common example. The first is that vulnerability to degradation from overburning at a range of frequently burnt sites in fire sensitive communities, particularly shrublands, could be somewhat overstated for areas where there are particular physical or topographic features (such as large areas of bare rock, cliffs etc) that prevent sites from being totally incinerated, leaving small, fire-free refuges in which a range of fire-sensitive species may persist (Price et al 2003). An example is the highly restricted, fire sensitive, spindly shrub, Calytrix inopinata, which maintains healthy populations in southern Kakadu in rocky areas identified as overburnt. It grows from fissures in sandstone pavement and is largely protected from fire by surrounding areas of bare rock. But even its situation may be under long term threat from yet another agent that can influence fire sensitive sandstone vegetation; that of invasion by tall annual spear grasses, Sarga (Sorghum) spp.
In rocky areas the dominant grasses that carry fire are usually species of annual spear grass, Sarga (Sorghum) spp, or perennial, hummock-forming spinifex, Triodia spp. Most of the fire sensitive shrubland communities occur in association with spinifex grasses. While spinifex grasses are highly flammable, when burnt they are relatively slow to regenerate and bare patches between plants, which take time (years) to fill, provide a level of insulation from successive annual fires while the community as a whole is regenerating. However, in the company of spear grasses, communities have much less potential for respite. Their annual, intense production of biomass provides a ready source of dry fuel early in the season, and its collapsed long stems can carry fire relatively efficiently between patches of vegetation, across the small-scale topographic features which, under a spinifex ‘regime’ might serve periodically as effective fire barriers. There is certainly evidence of annual spear grass colonisation along the fissures where Calytrix inopinata grows but no indication of the time over which this has occurred or of the rate at which the population might be declining because of it. Spear grass invasion into sandstone communities seems to be legacy of frequent burning (Russell-Smith et al 2002) but it is one important aspect of the fire ecology of these environments that has not been properly studied.
5.1.6.6 Suggestion for improving the survey method
Almost 20% of the sites on this survey were recorded as patchily burnt. Price et al (2003) identified that fire patchiness in rough, rocky country was often the norm and this attribute was important for conserving fire sensitive species at a range of regularly burnt sites, but also recognised that these patches occur a scales mostly undetectable through interpretation of Landsat imagery. Consequentially on the basis of Landsat interpretation the amount, or implied impact of fire in rocky environments may be systematically overestimated. Aerial observation is much better, though not perfect, at discriminating patchily burnt sites but unfortunately on this survey patchiness was merely noted without reference to the amount
107
108
burnt. Had this been done the estimates of the extent of burning in the different vegetation types may have been improved.
Acknowledgments
Thanks to Steve Winderlich and Tida Nou for co-ordinating the survey, to Tida Nou for assisting with the aerial work and to North Australian Helicopters (NAH) for faultless operations. Felicity Watt extracted the satellite interpretation records from the Bushfires Council GIS data-base. Tony Griffiths provided statistical advise and Jeremy-Russell Smith provided helpful comments on an earlier draft.
References
Bowman DMJS 1994. Preliminary observations on the mortality of Allosyncarpia ternata stems on the Arnhem Land plateau, northern Australia. Australian Forestry 57, 62–64.
Bowman DMJS & Panton WJ 1993. Decline of Callitris intratropica in the northern Territory: Implications for pre-European and post-European colonisation fire regimes. Journal of Biogeography 20(4), 373–381.
Bowman DMJS, Price O, Whitehead PJ & Walsh A 2001. The ‘wilderness effect’ and the decline of Callitris intratropica on the Arnhem Land plateau, northern Australia, Australian Journal of Botany 49, 665–672.
Gill AM, Ryan PG, Moore PHR & Gibson M 2000. Fire regimes of World Heritage Kakadu National Park, Australia. Austral Ecology 25(6), 616–625.
Petty A, Alderson J, Muller R, Scheibe O, Wilson K & Winderlich S 2007. Kakadu National Park, Arnhemland Plateau draft fire management plan. Kakadu National Park, Jabiru, NT.
Price O, Russell-Smith J, & Edwards A 2003. Fine scale patchiness of different fire intensities in sandstone heath vegetation in northern Australia. International Journal of Wildland Fire 12, 227–236.
Russell-Smith J, Ryan PG & Cheal DC 2002. Fire regimes and the conservation of sandstone heath in monsoonal northern Australia: frequency, interval and patchiness. Biological Conservation 104, 91–106.
Russell-Smith J, Ryan PG & Durieu R 1997. A Landsat MSS-derived fire history of Kakadu National Park, monsoonal northern Australia, 1980–94: season extent, frequency and patchiness. Journal of Applied Ecology 34, 748–766.
Russell-Smith J, Ryan PG, Klessa D, Waight G & Harwood R 1998. Fire regimes, fire sensitive vegetation and fire management of the sandstone Arnhem Plateau, monsoonal northern Australia. Journal of Applied Ecology 35, 829–846.

5.2 Development of stone country fire management plan
A Petty1
5.2.1 Introduction
The Arnhemland Plateau is a region of exceptional biodiversity. Largely this is because it is a fire refuge for hundreds of plant and animal species that have disappeared from the fire prone lowlands. Historically as Aboriginal people lived and travelled across the Plateau they would burn the countryside, creating a patchy mosaic of burnt and unburnt regions. Since the depopulation of the Plateau, sometime after the end of World War II, the region has become increasingly susceptible to extensive late season fires emanating from the south east of the Plateau. There is growing concern that increasing fire frequency has been detrimental to many plant and animal species, particularly the obligate seeders (plants that can’t resprout after fires). In 2004 and 2006 fires engulfed most of the Plateau region and became emblematic of the difficulties of managing the remote Plateau. A survey of the 2006 fire found that although the fires impacted all vegetation communities, they burnt a very high percentage of the sandstone woodland community. However, although the 2004 and 2006 fires were extensive, they were not without historical precedent; outbreaks of unusually extensive fires appear to recur every four to eight years.
In response to the unacceptably high fire frequencies on the Plateau, Kakadu National Park has developed a fire management program to treat the Plateau region as a whole, to coordinate management with neighbouring groups, particularly West Arnhem Land and Nitmiluk National Park, to increase bininj involvement, and to increase monitoring of fire management activities. The plan is a strategic document and is designed to allow significant flexibility in the year to year planning of the fire program. One innovation of the plan is to assign a fire threshold to each vegetation community type. This threshold is compared with the historical fire record to determine if regions have exceeded the fire threshold. This allows for improved prioritisation in implementing fire breaks to prevent fires in the worst affected areas, and improves monitoring, including the development of measures of success for fire management. For example, the worst affected regions at present are in the southern part of the Park, although the low incidence of fire in 2007 has decreased the number of areas that are outside of the fire threshold. The fire plan will continue to be refined and developed as Park staff begin to incorporate the Plan into their fire programs.
The fire plan is available online at: www.environment.gov.au/parks/publications/kakadu/fire-management-plan.html
1 Charles Darwin University, NT 0909
109
5.3 Implementation of stone country fire management plan
A Pickworth1
5.3.1 Introduction
The Arnhem Land Plateau is an area of great importance both biologically and culturally. It has the most endemic plant and animal species found anywhere in the Northern Territory (Woinarski et al 2006). The sandstone heath vegetation is the most biodiverse plant community in the NT. The area is of great importance culturally to Traditional Owners for many reasons including extensive and ancient rock art sites. About 15% (5100 square kilometres) of the Arnhem Land Plateau is found within Kakadu National Park. This is over 25% of the total area of Kakadu National Park.
There is a general consensus among Traditional Owners, Scientists, Land Managers and Non Government Organisations that management of fire on the Arnhem Land Plateau needs to be improved. Evidence of this is widespread and includes:
an application to list the sandstone heath communities as threatened under the Environment Protection and Biodiversity Conservation Act 1999 (EPBC Act). The threatening process being the current fire regime. This application has been submitted by The Threatened Species Network in Darwin and is currently being processed by The Department of Environment and Water Resources (DEW).
Establishment in recent years of the Western Arnhem Land Fire Abatement project (WALFA). A proactive fire management program in neighbouring Arnhem Land implemented by Traditional Owners and Aboriginal ranger groups aimed at stopping late season fires on the Plateau.
Many scientific papers, projects, reports, presentations and discussions providing extensive evidence of the biological significance of the Plateau and the detrimental effects of current fire regimes.
Recognition in the current Kakadu Plan of Management that ‘unplanned large late season fires continue to be an issue in some areas of the Park, in particular within the sandstone country’ (Kakadu National Park Management Plan 2007–2014).
Kakadu National Park has legal responsibilities and obligations to manage its natural and cultural values under such things as:
The lease agreement (between Traditional Owners and the government)
Kakadu National Park Plan of Management
Environment Protection and Biodiversity Conservation Act 1999 (EPBC Act)
The Bushfires Act (NT)
World Heritage obligations
1 Kakadu National Park, Parks Operations and Tourism Branch, Northern Territory
110
For example it is stated in the lease that ‘the flora, fauna, cultural heritage and natural environment of the Park shall be preserved, managed, and maintained according to the best comparable management practices established for National Parks anywhere in the world or where no comparable management practices exist, to the highest standards practicable’.
Kakadu staff and Traditional Owners, past and present, have been managing fire in this section of the Park for many years with well developed skills and experience. This management has stopped some late season fires, however, overall it has not resulted in a long-term sustainable fire regime for the Plateau.
Kakadu National Park has lacked a consistent, committed management approach to fire on the Plateau. This, in addition to time and resource constraints, has limited the ability of the Park to give the Plateau the time and attention it requires. Time and resource constraints include:
opening of visitor areas after the wet season, requiring massive clean ups and crocodile surveys.
fire management of the lowland areas.
decline in the capacity of Districts in recent years caused by position vacancies, lack of skilled staff, increased workloads and budget constraints.
limited helicopter budgets.
There is a great deal more Kakadu National Park can do to improve fire management on the Plateau. Important elements to more successful fire management on the Plateau include:
consistent and committed approach each year.
more extensive burning in mitigation zones in the early dry season
more strategic burning (including having time and resources to investigate what are the best strategies).
considering the plateau as a whole landscape. This involves working across Kakadu district boundaries as well as Kakadu/Arnhem Land and Kakadu /Nitmiluk boundaries.
managing the plateau for the long term and not on an annual basis.
In response to the above and after another destructive late season fire over the whole of the Arnhem Land Plateau in 2006, Kakadu National Park developed a specific management plan for fire on the plateau (Kakadu National Park Arnhem Land Plateau Fire Management Plan). In 2007 Kakadu National Park engaged in a more proactive approach to fire management on the Plateau. This included, as a trial, appointing an off line coordinator and allocating separate funds to manage fire on the plateau. The following report details the implementation of the fire management plan and includes the following:
2007 program
Recommendations and Options for future fire management
2008 Draft Implementation Plan including a budget estimate
5.3.2 2007 program
The basic aim of the program was to decrease the negative impacts of fire on the Plateau, particularly on sandstone heath and rainforest communities. This was attempted by burning along selected major creeks and rivers and around the base of the plateau (all mitigation
111

zones) in an attempt to create ‘fire breaks’. These fire breaks attempt to stop late season fires getting onto the Plateau or contain their spread.
5.3.2.1 Implementation
There were many aspects to implementing the 2007 program, some of which are listed below:
Taking one Kakadu staff member off line for 3 months to assist in coordination and implementation of the plan.
Kakadu staff and traditional owners liaising with WALFA, Jawoyn Association, Bushfires Council and Nitmiluk National Park to better coordinate a whole Plateau approach to fire management. This approach has been improving each year.
Kakadu staff and Traditional Owners developing, through discussion, the on ground plans for the year.
District staff conducting ground and helicopter burns with emphasis on burning scree slopes, around the edge of the Plateau and key valleys eg Deaf Adder and Magela Creek.
Bushwalks with Traditional Owners and other indigenous people burning country along major valleys dissecting the plateau (Figure 1).
Helicopter burns retracing bushwalking routes and other selected major creeks and rivers conducted by off line coordinator with Traditional Owners and relevant park staff (such as Sally-Anne Atkins, Project Officer Planning and Knowledge Management for Kakadu). Some of these burns were outside the Kakadu boundary in consultation with relevant people (Figure 13).
Joint helicopter burns with WALFA, Jawoyn Association and Nitmiluk National Park conducted by off line coordinator and District staff.
Working with the Natural and Cultural Programs staff to use GIS to plan and develop the program with consideration to such things as threatened species.
While on walks, combining burning with a few other activities such as recording locations of Cypress Pine stands, checking on a few art sites and checking on threatened plants for the NT Herbarium.
Continued consultation and communication throughout the program with and between staff, neighbours, Traditional Owners, scientists and Bushfires Council.
Preparation of this report and maps to assist in evaluating the implementation and in deciding on future directions.
Preparation of maps to demonstrate many aspects of the program including locations of weak points (to assist in possible fire mitigation) and wet season burn possibilities.
5.3.2.2 Bushwalks
Table 1 Bushwalks undertaken in the implementation of the 2007 stone country burning program
Date Location Days Participants
25.4–27.4 Maguk to Gunlom 3 3
8.5–11.5 Koolpin Creek 4 6
22.5–24.5 Upper Twin Falls 3 5
30.5–1.6 Maguk to Gunlom 3 4
19.6–22.6 Maguk to Koolpin 4 2
112
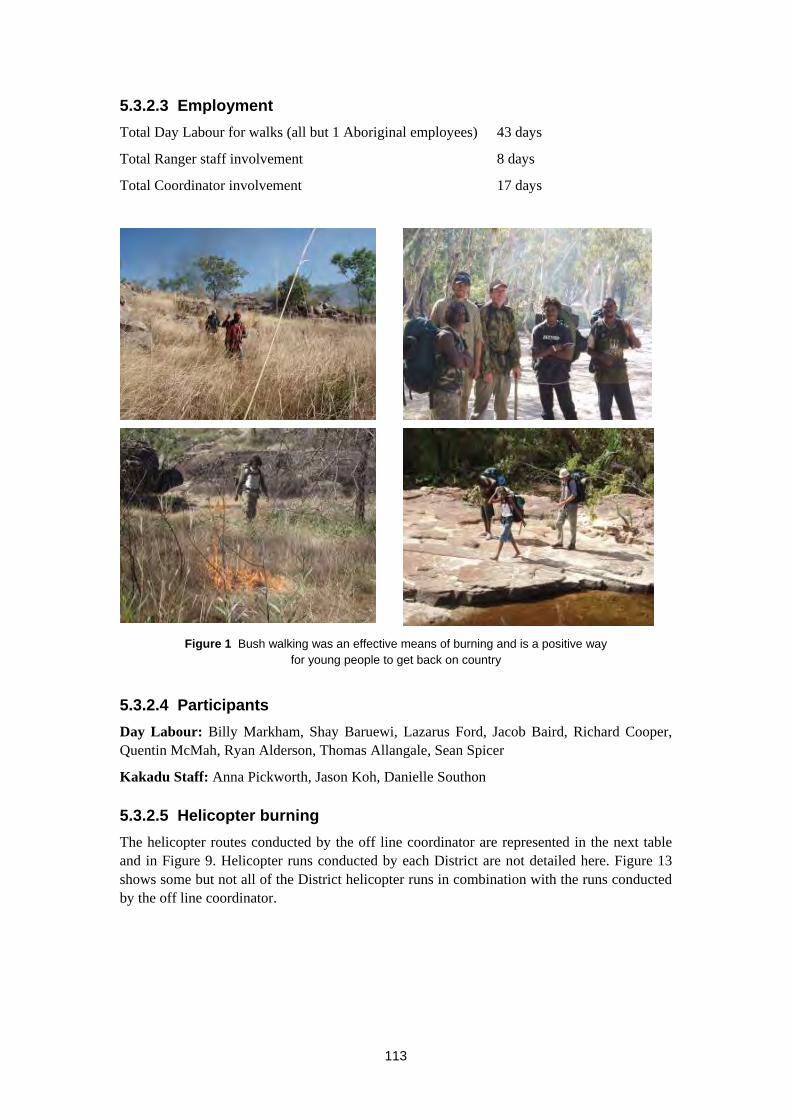
5.3.2.3 Employment
Total Day Labour for walks (all but 1 Aboriginal employees) 43 days
Total Ranger staff involvement 8 days
Total Coordinator involvement 17 days
Figure 1 Bush walking was an effective means of burning and is a positive way for young people to get back on country
5.3.2.4 Participants
Day Labour: Billy Markham, Shay Baruewi, Lazarus Ford, Jacob Baird, Richard Cooper, Quentin McMah, Ryan Alderson, Thomas Allangale, Sean Spicer
Kakadu Staff: Anna Pickworth, Jason Koh, Danielle Southon
5.3.2.5 Helicopter burning
The helicopter routes conducted by the off line coordinator are represented in the next table and in Figure 9. Helicopter runs conducted by each District are not detailed here. Figure 13 shows some but not all of the District helicopter runs in combination with the runs conducted by the off line coordinator.
113
Date Staff Purpose Hours
2.5.07 Anna Pickworth, Jeff Lee Surveillance 2.9
8.5.07 Bushwalkers x 6 Drop walkers at Koolpin Creek 2.5
15.5.07 Anna Pickworth, Sally-Anne Atkins Burning, GIS, photography 5.5
22.5 – 24.5
Bushwalkers x 5 Drop and pick up walkers at
Twin Falls Creek
4.4
28.5.07 Anna Pickworth, Bessie Coleman Burning 5.9
5.6.07 Anna Pickworth, Jessie Alderson Burning 6.8
8.6.07 Anna Pickworth, Peter Cooke (WALFA) Burning 2.6
12.6.07 Anna Pickworth, Michelle Hatt Burning 5.4
13.06.07 Anna Pickworth, Ray Whear (Jawoyn Association)
Burning 7
3.07.07 Anna Pickworth, Jessica Vergona Burning 5.9
5.3.2.6 Expenses
The following expenses include those of the off line component of the 2007 program. Specific Plateau components of Districts were to difficult to extract from their overall budget. This data could be collected in future years particularly with development of GIS capacity in Kakadu.
Description Cost $
Helicopter Burning 25 400
Helicopter Drop off Bushwalkers 5 692
Helicopter for Surveillance/Field Trips 2 320
Total helicopter 33 412
Day Labour for Bushwalks 43 days 8 195
Day Labour for helicopter runs 2 days 380
Gear including backpacks, camping gear, walkie talkies 1 365
Incendiaries and glycol 4 500
Matches 1 800
Food for Bushwalks 529
Off Line Coordinator 3 months EA4 level 27 000
Camping Allowance 800
Total 77 981
5.3.2.7 Outcomes
The 2007 program has been successful as a trial and gives us a basis to assess the program and develop future programs.
At the time of writing this report the satellite images the Park purchases during the year were not available. An assessment of these will be attached to this report at a later date. The images will provide an important tool for assessing the effectiveness of the program.
114
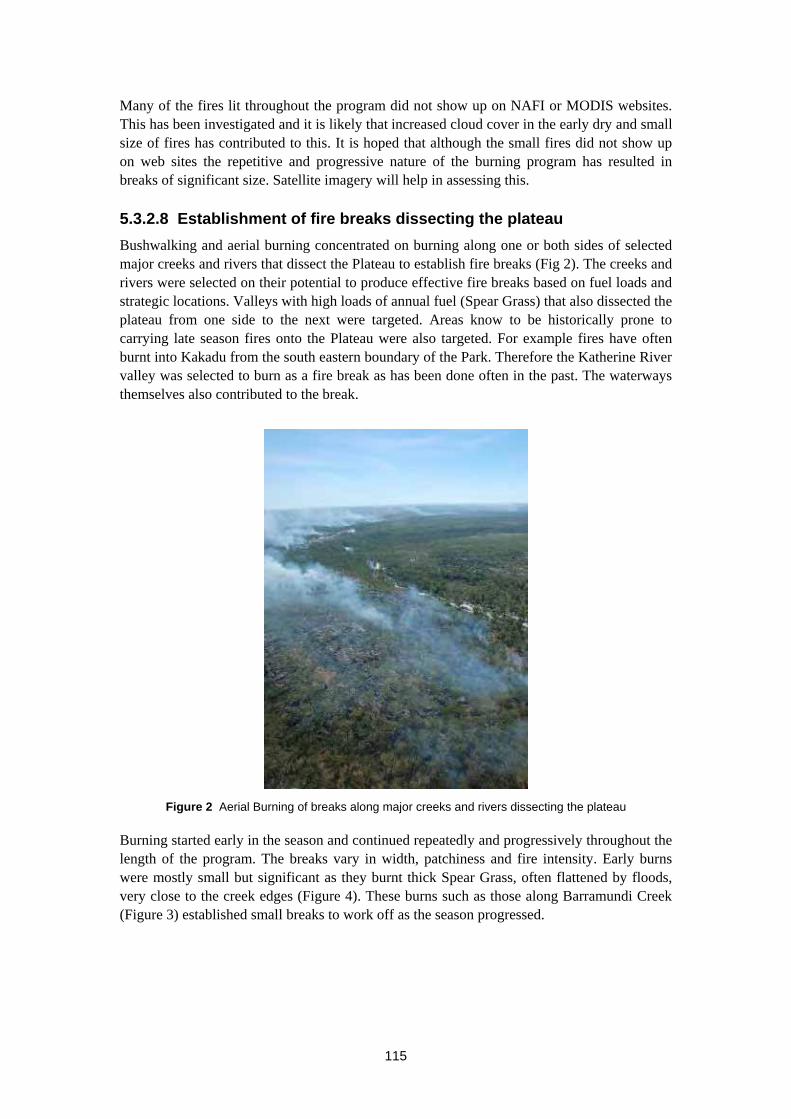
Many of the fires lit throughout the program did not show up on NAFI or MODIS websites. This has been investigated and it is likely that increased cloud cover in the early dry and small size of fires has contributed to this. It is hoped that although the small fires did not show up on web sites the repetitive and progressive nature of the burning program has resulted in breaks of significant size. Satellite imagery will help in assessing this.
5.3.2.8 Establishment of fire breaks dissecting the plateau
Bushwalking and aerial burning concentrated on burning along one or both sides of selected major creeks and rivers that dissect the Plateau to establish fire breaks (Fig 2). The creeks and rivers were selected on their potential to produce effective fire breaks based on fuel loads and strategic locations. Valleys with high loads of annual fuel (Spear Grass) that also dissected the plateau from one side to the next were targeted. Areas know to be historically prone to carrying late season fires onto the Plateau were also targeted. For example fires have often burnt into Kakadu from the south eastern boundary of the Park. Therefore the Katherine River valley was selected to burn as a fire break as has been done often in the past. The waterways themselves also contributed to the break.
Figure 2 Aerial Burning of breaks along major creeks and rivers dissecting the plateau
Burning started early in the season and continued repeatedly and progressively throughout the length of the program. The breaks vary in width, patchiness and fire intensity. Early burns were mostly small but significant as they burnt thick Spear Grass, often flattened by floods, very close to the creek edges (Figure 4). These burns such as those along Barramundi Creek (Figure 3) established small breaks to work off as the season progressed.
115
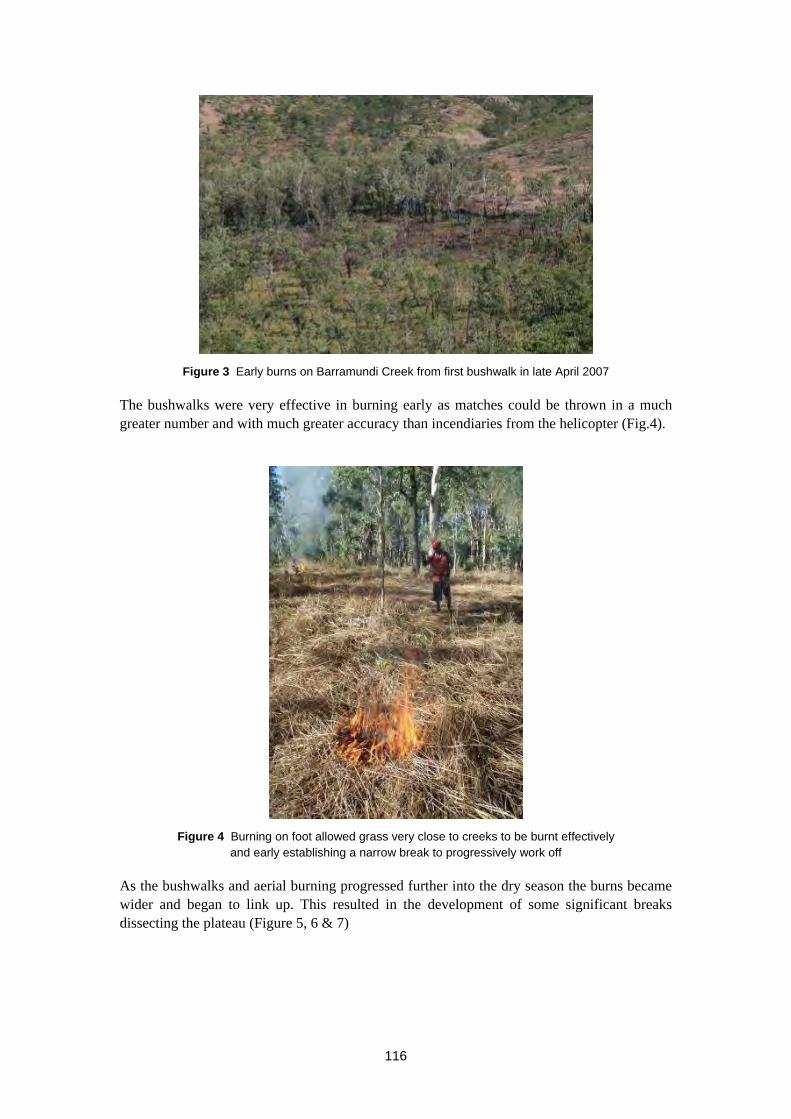
Figure 3 Early burns on Barramundi Creek from first bushwalk in late April 2007
The bushwalks were very effective in burning early as matches could be thrown in a much greater number and with much greater accuracy than incendiaries from the helicopter (Fig.4).
Figure 4 Burning on foot allowed grass very close to creeks to be burnt effectively and early establishing a narrow break to progressively work off
As the bushwalks and aerial burning progressed further into the dry season the burns became wider and began to link up. This resulted in the development of some significant breaks dissecting the plateau (Figure 5, 6 & 7)
116
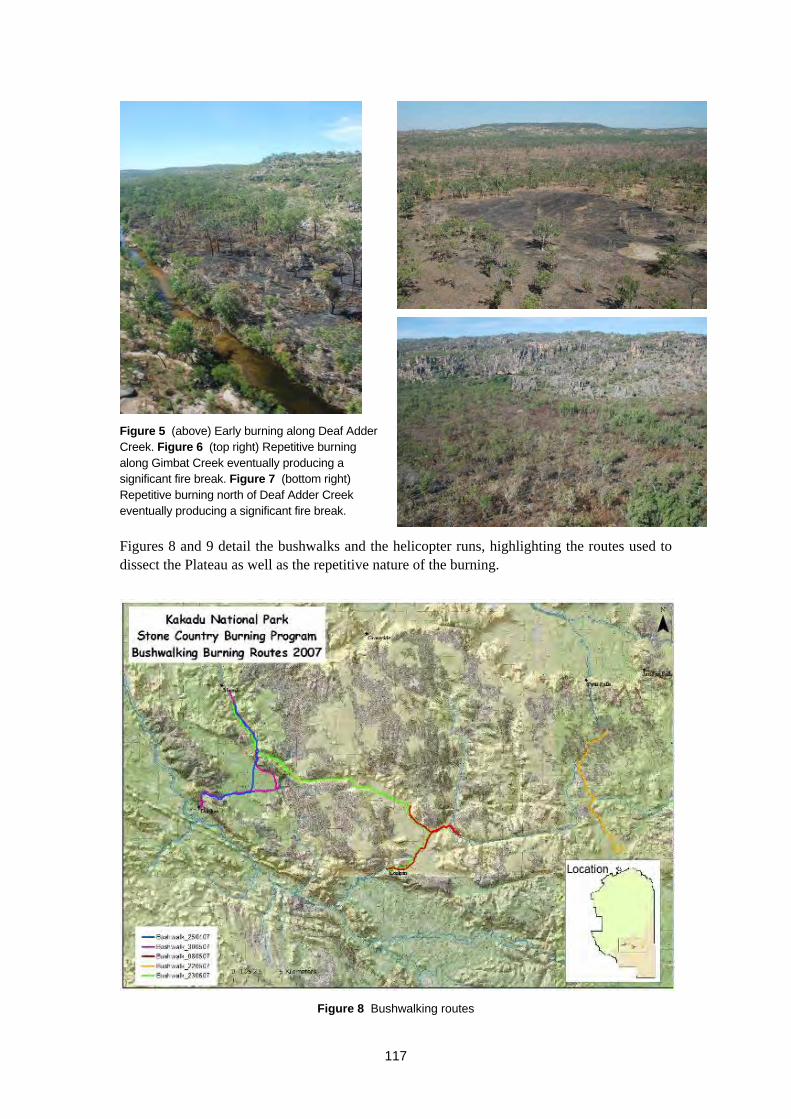
Figure 5 (above) Early burning along Deaf Adder Creek. Figure 6 (top right) Repetitive burning along Gimbat Creek eventually producing a significant fire break. Figure 7 (bottom right) Repetitive burning north of Deaf Adder Creek eventually producing a significant fire break.
Figures 8 and 9 detail the bushwalks and the helicopter runs, highlighting the routes used to dissect the Plateau as well as the repetitive nature of the burning.
Figure 8 Bushwalking routes
117

Figure 9 Helicopter burning routes conducted by off line coordinator
118
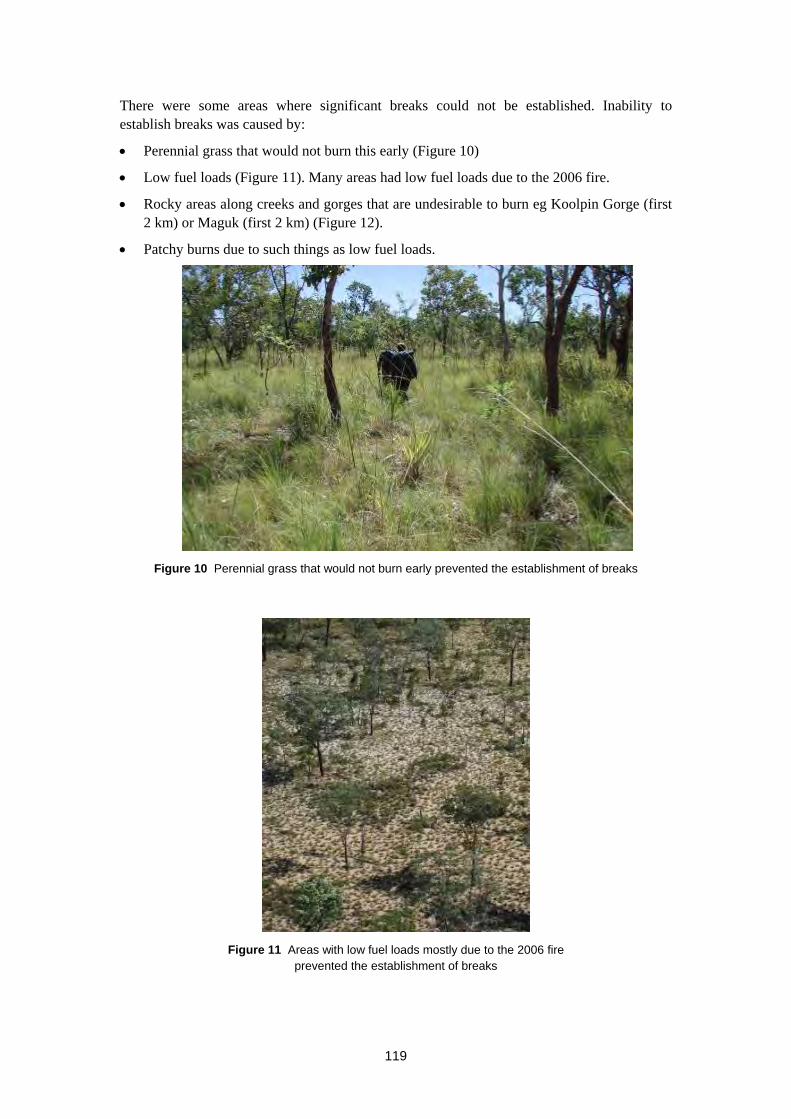
There were some areas where significant breaks could not be established. Inability to establish breaks was caused by:
Perennial grass that would not burn this early (Figure 10)
Low fuel loads (Figure 11). Many areas had low fuel loads due to the 2006 fire.
Rocky areas along creeks and gorges that are undesirable to burn eg Koolpin Gorge (first 2 km) or Maguk (first 2 km) (Figure 12).
Patchy burns due to such things as low fuel loads.
Figure 10 Perennial grass that would not burn early prevented the establishment of breaks
Figure 11 Areas with low fuel loads mostly due to the 2006 fire prevented the establishment of breaks
119
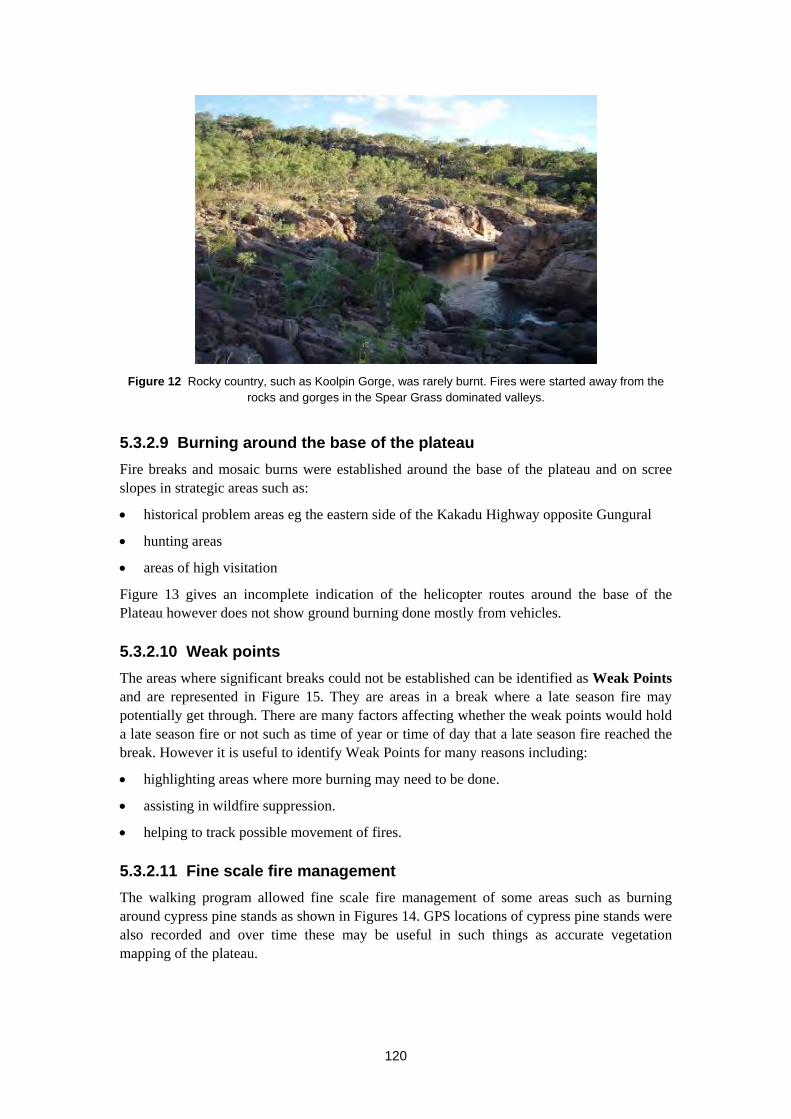
Figure 12 Rocky country, such as Koolpin Gorge, was rarely burnt. Fires were started away from the rocks and gorges in the Spear Grass dominated valleys.
5.3.2.9 Burning around the base of the plateau
Fire breaks and mosaic burns were established around the base of the plateau and on scree slopes in strategic areas such as:
historical problem areas eg the eastern side of the Kakadu Highway opposite Gungural
hunting areas
areas of high visitation
Figure 13 gives an incomplete indication of the helicopter routes around the base of the Plateau however does not show ground burning done mostly from vehicles.
5.3.2.10 Weak points
The areas where significant breaks could not be established can be identified as Weak Points and are represented in Figure 15. They are areas in a break where a late season fire may potentially get through. There are many factors affecting whether the weak points would hold a late season fire or not such as time of year or time of day that a late season fire reached the break. However it is useful to identify Weak Points for many reasons including:
highlighting areas where more burning may need to be done.
assisting in wildfire suppression.
helping to track possible movement of fires.
5.3.2.11 Fine scale fire management
The walking program allowed fine scale fire management of some areas such as burning around cypress pine stands as shown in Figures 14. GPS locations of cypress pine stands were also recorded and over time these may be useful in such things as accurate vegetation mapping of the plateau.
120

Figure 13 Park wide helicopter routes highlighting effort and repetitive nature of burning
121
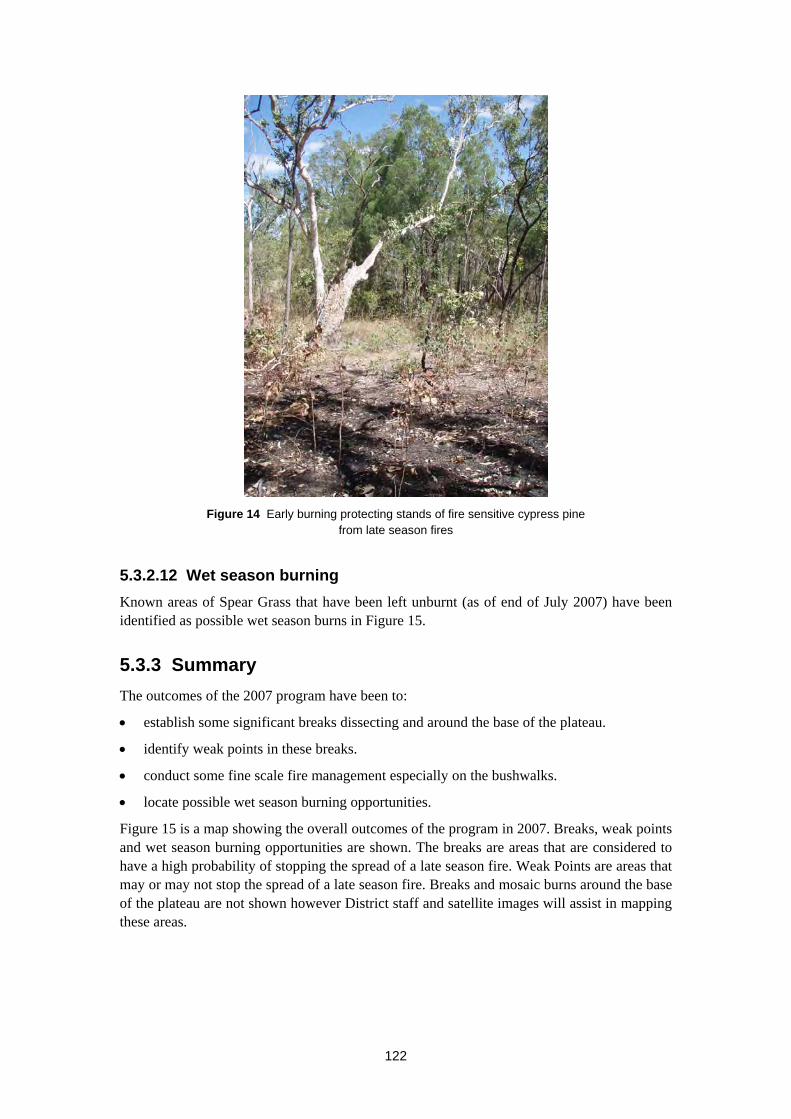
Figure 14 Early burning protecting stands of fire sensitive cypress pine from late season fires
5.3.2.12 Wet season burning
Known areas of Spear Grass that have been left unburnt (as of end of July 2007) have been identified as possible wet season burns in Figure 15.
5.3.3 Summary
The outcomes of the 2007 program have been to:
establish some significant breaks dissecting and around the base of the plateau.
identify weak points in these breaks.
conduct some fine scale fire management especially on the bushwalks.
locate possible wet season burning opportunities.
Figure 15 is a map showing the overall outcomes of the program in 2007. Breaks, weak points and wet season burning opportunities are shown. The breaks are areas that are considered to have a high probability of stopping the spread of a late season fire. Weak Points are areas that may or may not stop the spread of a late season fire. Breaks and mosaic burns around the base of the plateau are not shown however District staff and satellite images will assist in mapping these areas.
122

Figure 15 Overall outcomes of 2007 program
123
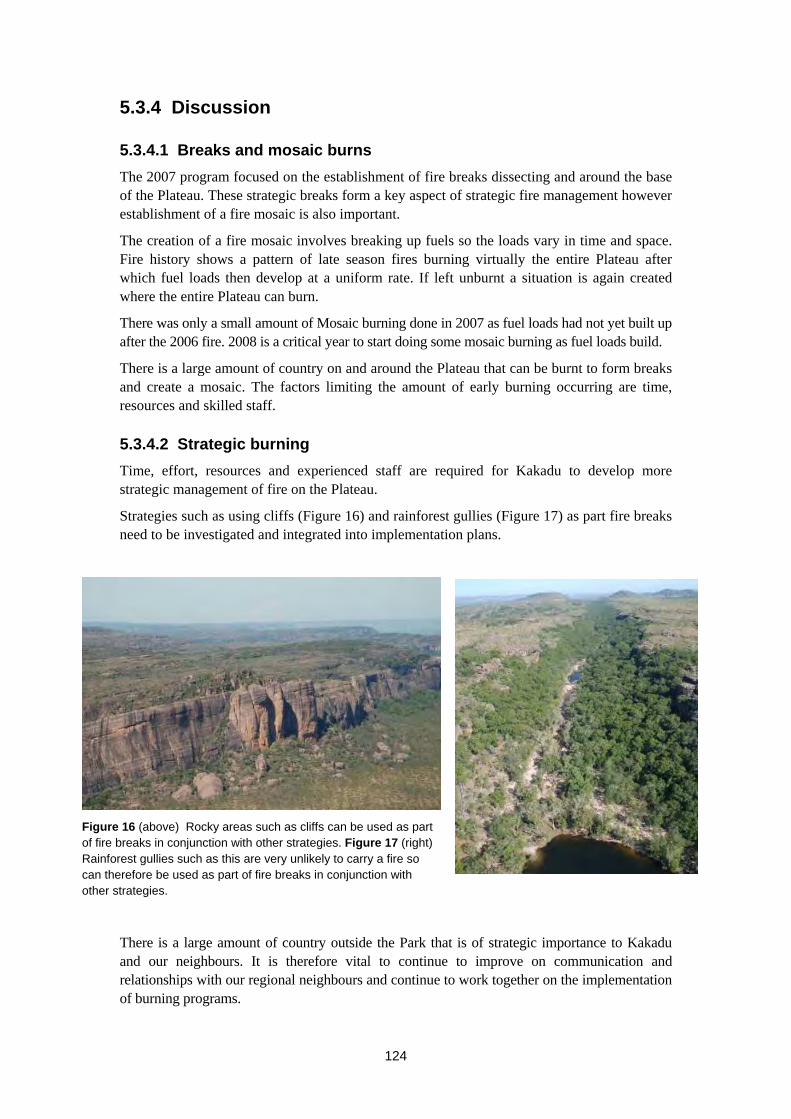
5.3.4 Discussion
5.3.4.1 Breaks and mosaic burns
The 2007 program focused on the establishment of fire breaks dissecting and around the base of the Plateau. These strategic breaks form a key aspect of strategic fire management however establishment of a fire mosaic is also important.
The creation of a fire mosaic involves breaking up fuels so the loads vary in time and space. Fire history shows a pattern of late season fires burning virtually the entire Plateau after which fuel loads then develop at a uniform rate. If left unburnt a situation is again created where the entire Plateau can burn.
There was only a small amount of Mosaic burning done in 2007 as fuel loads had not yet built up after the 2006 fire. 2008 is a critical year to start doing some mosaic burning as fuel loads build.
There is a large amount of country on and around the Plateau that can be burnt to form breaks and create a mosaic. The factors limiting the amount of early burning occurring are time, resources and skilled staff.
5.3.4.2 Strategic burning
Time, effort, resources and experienced staff are required for Kakadu to develop more strategic management of fire on the Plateau.
Strategies such as using cliffs (Figure 16) and rainforest gullies (Figure 17) as part fire breaks need to be investigated and integrated into implementation plans.
Figure 16 (above) Rocky areas such as cliffs can be used as part of fire breaks in conjunction with other strategies. Figure 17 (right) Rainforest gullies such as this are very unlikely to carry a fire so can therefore be used as part of fire breaks in conjunction with other strategies.
There is a large amount of country outside the Park that is of strategic importance to Kakadu and our neighbours. It is therefore vital to continue to improve on communication and relationships with our regional neighbours and continue to work together on the implementation of burning programs.
124

5.3.4.3 Bushwalking
The bushwalking component of the 2007 program was a success in many ways including:
Traditional owners and other local indigenous people, mostly young men, getting out on country with a backpack and lots of matches, burning country early (Figure 1). Traditional Owners have consistently expressed the desire for more burning to be done on foot and by traditional owners. There are many benefits of young Aboriginal people getting back to walk on country that is now little known or visited.
Fires lit by bushwalkers very early in the dry were more successful than those lit from the chopper. This was possible because matches can be thrown in a much greater number and with much greater accuracy than incendiaries (Figure 4). This is mostly the case early in the season when fires are more difficult to get going.
4 day labour staff walking all day cost the equivalent of 1 hour in the helicopter. Walking is a cost effective way of burning, especially in the early dry, apart from the other benefits it creates.
The differences between burning on foot or from the chopper are significant. Some of this difference is in the perception of the burning. On the ground the smell, sound and sight of the fires are much more real. The chopper gives a great top down view of what is happening but is much more removed. Both methods of burning have their advantages and disadvantages and it is important that people involved with fire management experience both.
5.3.5 Recommendations
There has been widespread support for the more proactive approach Kakadu National Park has taken to fire management on the Arnhem Land Plateau in 2007. There is wide consensus and strong opinion that Kakadu needs to continue and improve on this proactive management. In this regard it is recommended that Kakadu National Park do the following:
5.3.5.1 Program
Commit to formalising an ongoing program to implement the Kakadu National Park Arnhem Land Plateau Fire Management Plan.
Commit to allocating appropriate funds to implement the Kakadu National Park Arnhem Land Fire Management Plan (including funds for wet season burning and fire mitigation).
Consider and decide on the various options (as outlined below and discussed by staff and managers in meetings) as to how the implementation program will develop into the future.
Appoint some kind of coordinator/s to implement the plan each year from at least April to end of June.
Commit to further expanding on and developing bushwalking programs with Traditional Owners.
Further investigate the most strategic places to burn in 2008 and future years.
Investigate, with the help of the new Business Manager position, external funding possibilities.
125
Recognise that District staff would need further resources to fully implement the plan. These resources include skilled staff.
Continue to improve coordination and communication with neighbours.
Formalise fire meetings with staff and neighbours in terms of attendance and times.
Identify one person for neighbours to be able to contact regarding burning issues.
Review District helicopter budgets as they are consistently overspent.
Develop some criteria to measure the success of future implementation.
Consider options about how to fully inform Park visitors with bushwalking permits that burning may be in progress while on their walks.
5.3.5.2 Training
Commit to developing and implementing a training package for all staff involved in the implementation program
Assure that staff implementing the program are competent in all skills and experience required including:
– GPS
– GIS
– data recording
– vegetation species and community ID
– good understanding of fire management plan for the Plateau
– Raindance Machine
– navigational skills
Produce a booklet of obligate seeders and other information to assist in training
Develop induction training for new helicopter pilots so they have a better idea of how, why and where we burn
5.3.5.3 GIS and mapping
Commit to making the resources available to increase the use and effectiveness of GIS.
Use GIS to aid in the development, implementation and assessment of strategic burning programs.
Use data on threatened species to develop strategic burning programs.
Improve on data collection and management.
Establish a system where all burning tracks and waypoints are made into a map each week that can be used by Districts and others to monitor and assess burning programs. Include weak points and breaks on maps such as suggested in Figure 15.
Investigate purchasing satellite images on a more regular basis throughout the burning season. Monthly images could assist in assessing the burning programs across the Park in real time.
Investigate use of fine scale imagery such as ‘Quickbird’.
126
Investigate producing a map of areas of spear grass on the plateau to assist in easily and economically identifying areas that could be used as ‘breaks’.
5.3.5.4 Equipment
Purchase a ‘Raindance’ machine to increase effectiveness and efficiency of aerial burning program.
Purchase Trimble Handheld Computer and Camera with inbuilt GPS to aid in data collection.
5.3.6 Options
5.3.6.1 Options for a coordinator
Staff member/s taken off line and their position backfilled with competent replacements.
Temporary contract for one or two non staff members.
Staff member/s take on additional duties of coordinator while still in district but an additional position in district is created.
One staff member from each District (with Plateau in it) have an implementation role.
Operational Support District or Team run program.
5.3.6.2 Options for program
Day Labour with various Traditional Owners and other local people conducting walks.
Walking Team employed for 3 months each year (burning, law enforcement, rock art).
Traditional Owner Burning Contracts.
Rock Art Maintenance team also run bushwalking/burning program.
5.3.6.3 Options for training
Interested and competent staff trained to take responsibility for all or parts of program.
Interested and competent Traditional Owners trained to take responsibility for all or parts of program.
5.3.7 2008 Draft Implementation Plan
Following are some recommendations about a possible implementation program in 2008:
2008 is an important year to try to burn strategic areas that could not be burnt well in 2007 due to low fuel loads after the 2006 fire. The Plateau has burnt late after an interval of 3 years highlighting the importance of strategic fuel reduction 2 years after a fire. These areas are generally Spinifex dominated open woodland eg Jim Jim and Twin Falls Creek and between the East Alligator River, Mann River and Katherine River. The Plateau Vegetation Map that will soon be available to the Park will assist in identifying areas to mosaic burn.
127
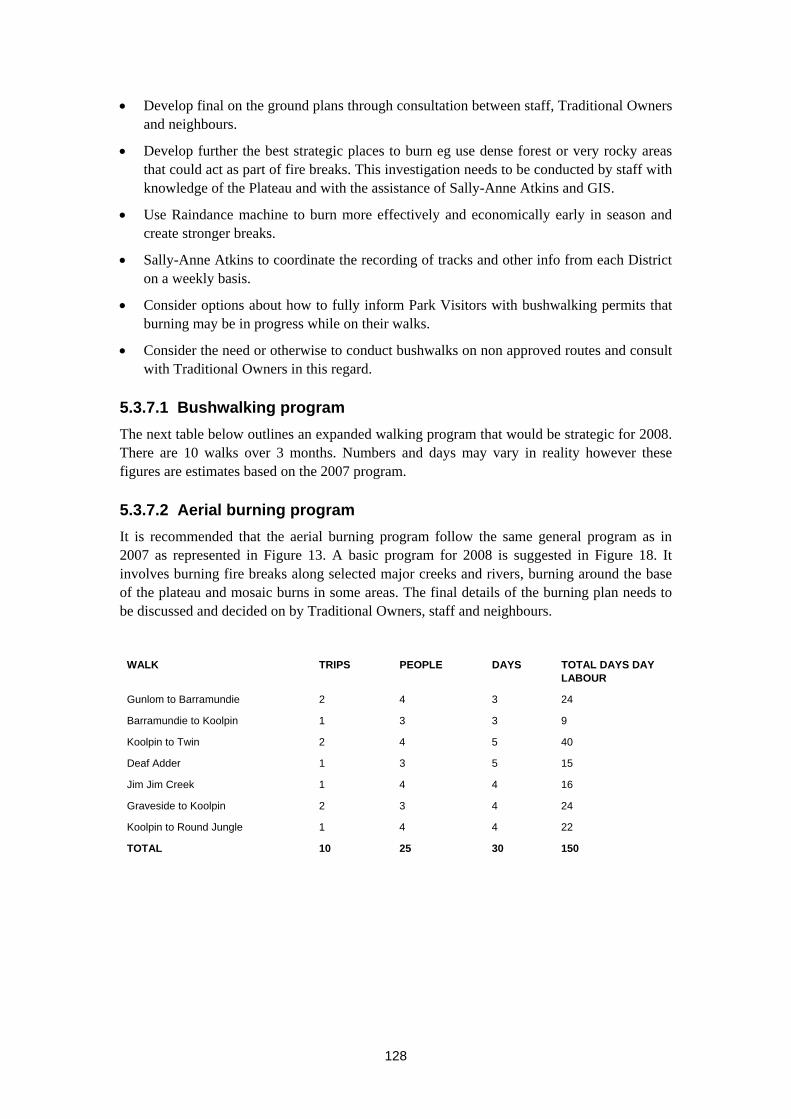
Develop final on the ground plans through consultation between staff, Traditional Owners and neighbours.
Develop further the best strategic places to burn eg use dense forest or very rocky areas that could act as part of fire breaks. This investigation needs to be conducted by staff with knowledge of the Plateau and with the assistance of Sally-Anne Atkins and GIS.
Use Raindance machine to burn more effectively and economically early in season and create stronger breaks.
Sally-Anne Atkins to coordinate the recording of tracks and other info from each District on a weekly basis.
Consider options about how to fully inform Park Visitors with bushwalking permits that burning may be in progress while on their walks.
Consider the need or otherwise to conduct bushwalks on non approved routes and consult with Traditional Owners in this regard.
5.3.7.1 Bushwalking program
The next table below outlines an expanded walking program that would be strategic for 2008. There are 10 walks over 3 months. Numbers and days may vary in reality however these figures are estimates based on the 2007 program.
5.3.7.2 Aerial burning program
It is recommended that the aerial burning program follow the same general program as in 2007 as represented in Figure 13. A basic program for 2008 is suggested in Figure 18. It involves burning fire breaks along selected major creeks and rivers, burning around the base of the plateau and mosaic burns in some areas. The final details of the burning plan needs to be discussed and decided on by Traditional Owners, staff and neighbours.
WALK TRIPS PEOPLE DAYS TOTAL DAYS DAY LABOUR
Gunlom to Barramundie 2 4 3 24
Barramundie to Koolpin 1 3 3 9
Koolpin to Twin 2 4 5 40
Deaf Adder 1 3 5 15
Jim Jim Creek 1 4 4 16
Graveside to Koolpin 2 3 4 24
Koolpin to Round Jungle 1 4 4 22
TOTAL 10 25 30 150
128
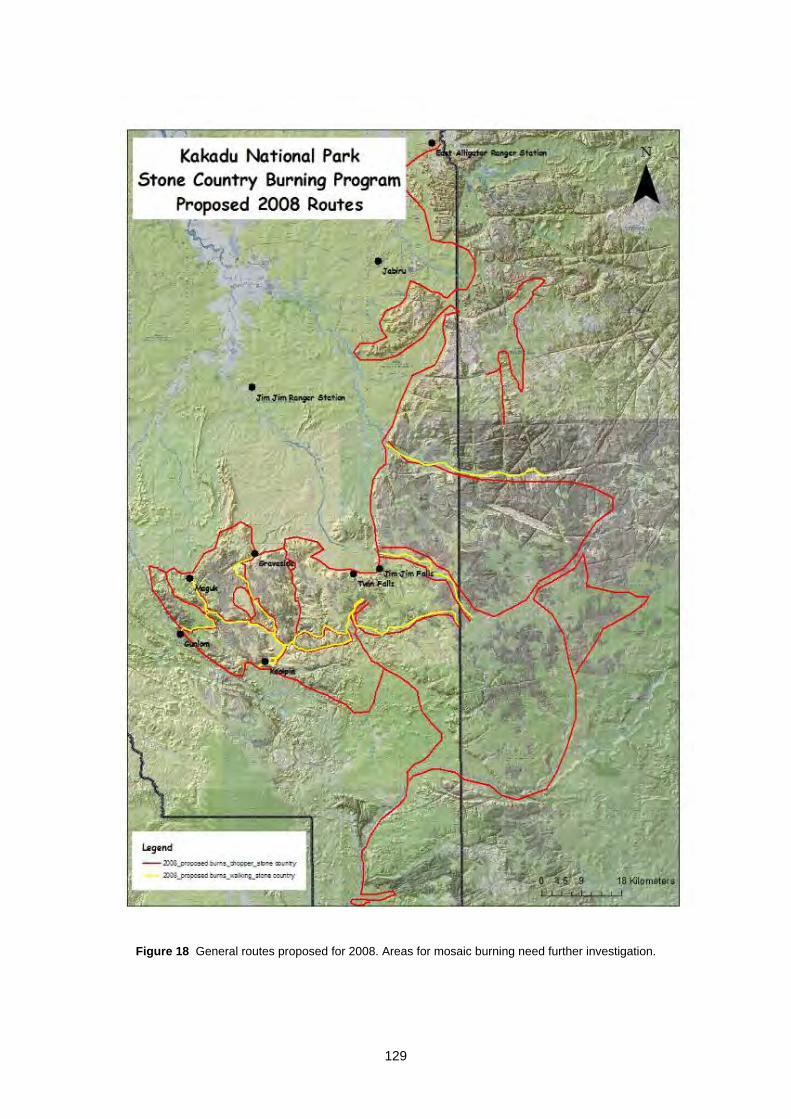
Figure 18 General routes proposed for 2008. Areas for mosaic burning need further investigation.
129

130
5.3.7.3 Budget proposal for 2008
Item Cost/unit Units Total
EA4?? Salary (total cost to Park) 3 months $27000
Day Labour $190/day 160 days $30400
Camping Allowance $95/day 75days $7125
Helicopter Aerial Burning $825/hr 48 hours $39600
Helicopter Bushwalking Support $825/hr 16 hours $13200
Helicopter Wet Season Burning $825/hr 10 hours $8250
Helicopter Fire Mitigation $825/hr 10 hours $8250
Incendiaries $276/box 16 boxes $4416
Matches $369/box 12 $4428
Gear $3000
Food $10/day/person 180 $1800
Trimble PDA $3500
Digital Camera with inbuilt GPS $2000
Noise Reduction Headsets $1500 2 $3000
TOTAL $155969
5.3.8 Conclusion
Current fire regimes are threatening the Arnhem Land Plateau, one of the most important landscapes in the Northern Territory. Kakadu National Park is responsible for managing 5100 square kilometres of the Plateau. It is a vast, remote, and little visited landscape. This, in combination with its biologically sensitive nature requires a detailed, consistent and committed approach to fire management. There is a great deal more that Kakadu National Park could do to improve fire management on the Plateau. The major factors limiting successful fire management are lack of time and resources for staff with the skills and experience to do the strategic, repetitive and intensive burning that is required.
References
Woinarski JCZ, C Hempel, I Cowie, K Brennan, R Kerrigan, G Leach & J Russell-Smith 2006. Distributional pattern of plant species endemic to the Northern Territory, Australia. Australian Journal of Botany 54(7), 627–640.
Kakadu National Park Management Plan 2007 – 2014.
Kakadu National Park Arnhem Land Plateau Fire Management Plan 2007.

5.4 West Arnhem Land fire management
P Cooke1 & J Russell-Smith2
5.4.1 Introduction
The West Arnhem Land Fire Abatement Project represents an important new way that skilled Indigenous fire managers in Australia’s fire-prone tropical savannas can work with the broader community to reduce greenhouse gas emissions, protect culture and biodiversity on their country, and bring in social and economic benefits to their communities.
The project is a partnership between the Aboriginal Traditional Owners and Indigenous ranger groups, Darwin Liquefied Natural Gas (DLNG), the Northern Territory Government and the Northern Land Council. Through this partnership Indigenous Ranger groups are implementing strategic fire management across 28 000 km2 of Western Arnhem Land (yellow area in picture below), in Australia’s Northern Territory, to offset some of the greenhouse gas emissions from the Liquefied Natural Gas plant at Wickham Point in the city of Darwin.
Figure 1 The Arnhem Land Plateau (in yellow and orange) rises from the savanna lowlands (in green). Kakadu National Park covers part of the Western edge and the West Arnhem Land
Fire Abatement Project (outlined) covers most of the remainder of the Plateau.
The project is now reducing greenhouse gas emissions from this area by the equivalent of over 100 000 tonnes of CO2 each year. It does this by undertaking strategic fire management from early in the dry season to reduce the size and extent of unmanaged wildfires. Such practices are also helping to conserve environmental and cultural values in the project region - values equivalent to those in the adjacent World Heritage-listed Kakadu National Park.
1 WALFA – West Arnhem Land Fire Abatement 2 Bushfires Council NT, Department of Natural Resources, Environment, the Arts and Sport; Kakadu Research
Advisory Committee
131

In return Darwin LNG is paying the Indigenous fire managers around $1Million a year to provide this service – with this funding also bringing in new jobs, networks and educational opportunities to the region.
5.4.2 Cultural heritage of global importance
The project is helping to revive Indigenous culture on the Arnhem Land Plateau. This is a living tradition involving various aspects of culture including rock wall painting and customary land management that extends back over tens of thousands of years. The thousands of rock art sites alone likely represent the world’s oldest continuing record of artistic endeavour – and the project is helping to protect some of these sites and other sites of cultural significance from the ravages of wildfire. To find out more see ‘A rich culture’ on the West Arnhem Land Fire Abatement Project website: www.savanna.org.au/all/arnhem_culture.html
5.4.3 Plant and animal species of international significance
The project is also helping to safeguard habitats of a rich assemblage of species of plants and animals – many of them unique to the plateau. Over millions of years the sandstone country has provided a stable environment that has allowed many species to evolve with adaptations. To find out more see ‘Refuge for plants and animals’ on the West Arnhem Land Fire Abatement Project website: www.savanna.org.au/all/arnhem_refuge.html
5.4.4 Exodus and the age of wildfire
The destructive pattern of frequent wildfires in the plateau appears to date from several decades ago when Aboriginal people had largely left the region and the newly emptied landscape started being swept by large fires that had their origins in the more settled areas in the surrounding lowlands. This new fire pattern has had significant and severe consequences for cultural sites and plants and animals. It also has consequences for greenhouse gas emissions as this new fire regime likely emits significantly more of these gases than the fire patterns of the past. To find out more see ‘The impact of wildfire’ on the West Arnhem Land Fire Abatement Project website: www.savanna.org.au/all/arnhem_fire_strategic.html
5.4.5 Burning to reduce greenhouse gas emissions
In these extensive, sparsely peopled landscapes that are naturally prone to burn every dry season, the most effective tool to prevent fire is fire itself. Aboriginal people have known this for a long time, and the idea of burning patchy fires and fire breaks in the early, cooler part of the dry season to prevent uncontrollable wildfires in the late, hotter part of the dry season is still a practical solution to managing wildfire today. Reducing the incidence of wildfire in this way can be shown to also reduce greenhouse gas emissions from the region. To find out more see ‘Fire and greenhouse gases’ on the West Arnhem Land Fire Abatement Project website: www.savanna.org.au/all/greenhouse_emissions.html
5.4.6 Reviving the Plateau using two tool kits
Traditional Indigenous methods of fire management worked well in the past when there were many groups on the plateau, today however, there are far fewer people who work in Indigenous Ranger groups, and the wildfire threat they need to manage is probably greater
132

133
than it was in the past. To help them, modern Indigenous fire managers have added some useful items from the western tool kit: helicopters and aircraft help them put in fire breaks quickly over large areas and close-to-real time satellite data on the location of fires can be accessed over websites. Nor did Indigenous people in the past have to measure the amount of greenhouse gases abated because of their fire management, so today researchers are contracted to do this job. To find out more see ‘Reviving the plateau’ on the West Arnhem Land Fire Abatement Project website: www.savanna.org.au/all/reviving_plateau.html
5.4.7 What’s been achieved?
The first four years of the project have been remarkably successful, abating the equivalent of around 488 000 tonnes of Carbon Dioxide, or 122 000 tonnes a year – ahead of the 100 000 tonnes a year the project is contracted to deliver. There has been a significant reduction in the incidence of destructive wildfires, however, it will take some time to verify that this has produced a recovery in the status of threatened and declining species on the plateau. The fire management has involved over one hundred part-time jobs for Indigenous Rangers and others and has allowed many different ranger groups and communities to coordinate their activities and build regional collaboration. To find out more see ‘What’s been achieved?’ on the West Arnhem Land Fire Abatement Project website: www.savanna.org.au/all/achievements.html
5.4.8 Where to from here?
The outcomes achieved by the West Arnhem Fire project have potential application across fire-prone tropical Australia and other fire-prone savannas of the tropics. Major companies are investigating the feasibility of entering into similar Greenhouse Gas offsets agreements using this approach. Governments and Indigenous land management groups are also looking to extend the practice of managing fire as an environmental service to other areas in fire-prone, biodiversity-rich, primarily Indigenously owned landscapes in northern Australia.
5.5 Stone country fire management workshop outcomes
S Atkins1
5.5.1 Introduction
This paper briefly summaries the outcomes of the Stone Country Burning workshops. Following the presentations on Stone country burning the symposium participants were involved in workshops aimed at identifying the treats and knowledge gaps associated with stone country fire management practises. Participants contributed their thoughts, ideas and recommendations these have been collated and appear in this paper.
5.5.2 Current knowledge
The Arnhem Land Plateau is an area of great importance both biologically and culturally. It has the most endemic plant and animal species found anywhere in the Northern Territory.
Fire frequency has been detrimental to many plant and animal species on the stone country, particularly the obligate seeders
Kakadu National Park has developed a specific stone country fire management plan, the implementation of the plan is largely coordinated and implemented by a dedicated ranger employed specifically for the task. With input from district staff, traditional owners and bininj the implementation of the stone country burning program has been in place for three years. It will take some time to verify if the implementation of the management plan has produced a recovery in the status of threatened and declining species on the plateau. The appointment of a dedicated ranger to coordinate and implement the program is supported amongst park staff and various stakeholders.
Fine scale fire management practises are effective in managing specific vegetation types such as cypress and need to be implemented into the program.
The West Arnhemland Fire Abatement program (WALFA) has begun to utilise a leaf blower to assist in fire suppression activities. Fire can trickle a significant distance through leaf litter. In these circumstances breaks are not enough on their own. Leaf blowers were very good at blowing the leaf litter back to create the break. Leaf blowers are used a lot in the centre and down south. Some can spray a mist.
Walking and burning country is it a valuable tool for fire management of the stone country, with the programs such as WALFA and the implementation of the Kakadu National Park Stone Country Management Plan the opportunity for bininj participate and get back on the stone country and actively participate in its management has increased.
1 Kakadu National Park, Parks Operations and Tourism Branch
134

The valleys are used as fire breaks, however they are very difficult to burn effectively, and to do so takes a lot of resources. Maybe be more effective to go late in evening or later in the year to burn?
5.5.3 Main threats
The allocation of adequate resources, posses a significant threat to the stone country. There seems to be a massive conflict over priorities at some time of the year particularly the early dry season. There is a lot of pressure from the tourism industry for ranger time to be spent on the opening up of areas for the public, so intensive management issues (such as fire management) tend to be neglected.
There are very few old bininj left that have a significant understanding and knowledge of the stone country. This knowledge is threatened and therefore it is important for people to re establish that connection with stone country.
NT Parks and Wildlife identified the following issues as the main threats to there parks.
There is a shortage of resources to implement programs within NT Parks.
Some burning is occurring in Litchfield stone country, and there are small windows of opportunity to undertake small amounts of burning.
There are issues with helicopter availability and this is a limiting factor to undertaking additional management.
Early burning is constrained be access to areas and helicopter availability.
Like Kakadu there are significant conflicts in priorities particular at the beginning of the dry season when these programs need to be implemented.
5.5.4 Knowledge gaps
Accurate and detailed mapping of vegetation and habitat communities on the plateau.
Deciding the best places to burn, use of satellite imagery to map spear grass. Better data and mapping
Documentation of long term Kakadu staff on their knowledge and understanding of fire management – the changes, their observations
Accurate recording of fire tracks.
Should we be continually burning at base of escarpment as this is an important foraging areas for rock rats and rock wallabies ?
NT Parks and Wildlife Identified the following knowledge gaps associated with managing fire on the stone country in their parks.
Try and manage certain areas such as the callitris stands at Tolmer Falls, what is lacking for this type of management elsewhere in the Parl it an vegetation map that identifies areas of callitris,
There is a lack of base line data for some of the NT Parks
There is a need increased monitoring sites and programs on the stone country. Having these in place would ensure that staff are monitoring and assessing the impact of fire management practises on this environment.
135

There needs to be greater information exchange in relation to fire management of the stone country between Kakadu National Park and other NT Parks such as Nitmiluk and Litchfield.
5.5.5 Management recommendations
The collaboration with neighbours is important.
The collaboration of neighbours is essential in managing the stone country. The Jawoyn association camp at Bindaluk on Mann River could be a good spot for KNP and Jawoyn fire management staff to meet.
Stone Country Walks are popular amongst bininj and are effective way to engage bininj in fire management on the stone country, this needs to be encouraged and supported by management.
Greater use of fire mapping is needed in the planning of fire management activities.
It would be brilliant to have one ranger in each district dedicated to fire management coordinated by a central coordinator. With this you would see real changes and improvements in fire management in the districts.
Need to utilise the recommendations of scientists and researchers ie to identify and manage specific areas to limit fire or protect fire. Need to maintain some small scale long unburnt areas within landscapes.
There needs to be better sharing of resources across districts particularly when districts are short staffed or have multiple activities being undertaken
The development of a template or format for district plans.
On going monitoring and assessment of stone country fire management plan
Need to take suppression seriously and act quickly on fires in threatened areas immediately and don’t wait and see what happens. When we see a lightning fire or late season fire we have to react quickly. Need to have a quick response strategy. BFC spend money necessary to control the wildfire and worry about money later. We need a wildfire contingency system.
Need dedicated full time fire officer not just for 3 months.
There needs to be a clear direction and prioritisation set and supported by management.
Need to secure resources and funding for ongoing fire monitoring programs of the stone country and an ongoing dedicated position to manage fire all year round.
Why are seasonal rangers wasted on interpretation? Perhaps they should be doing fire management at those intensive times. Maybe the tourism industry should be providing interpretation rangers? Why are skilled rangers who are skilled as land managers spending their time mowing lawns, opening camp grounds and cleaning toilets when this could be contracted out at these busy times of the year?
Should be able to burn confidently late in the year because you have done your burning well earlier in the year. Late season fires have always been used for hunting and have there place but you’re early burning needs to be in place.
136

137
Use species and veg data to choose areas to set aside for biodiversity conservation. Invest in modelling techniques to put the data together and identify location for specific management. Use of this data species and veg data in fire planning and fire suppression
Specifically prescribe areas for certain things – this particular area will not be burnt of x number of year. If this area is threatened by fire then suppression will be undertaken immediately in order to main prescribed plan for area.
Need to a have a central repository for all fire related data.
Districts need clear direction from people who know exactly what they are talking about. District rangers need to develop that knowledge. NCP strategies should be guidance only but districts should be developing and maintaining there own knowledge.
Need to be aware of moving between different clans. Problems with changes to district boundaries meaning knowledge about one district is now in another district.
Rock art maintenance and stone country burning need to be combined.

Part 6 Wet season burning
Introduction
Wet season burning occurs during the months of December to March. It relies on a dry break during the monsoonal rains, and to be effective requires a body of cured grass and a fuel load to be retained through the dry season.
Throughout northern Australia wet season burning has become a useful tool in the management of large stands of sorghum. The following paper discusses some of the research and observations of land managers associated with wet season burning including the impact on native and non native species and the potential for wet season burning to contribute to soil erosion and loss.
138
6.1 Using wet season burning for fuel management
J Russell-Smith1
6.1.1 Introduction
Wet season burning is widely used in the Top End for reducing fuel loads associated particularly with annual grasses, and especially native Sorghum spp (now Sarga timorense). The practice takes advantage of the reproductive biology of annual Sorghum—burning grassy swards after seeds have germinated with the onset of the new wet season rains, but before they have developed viable seed. Given that there is no carry-over of soil-stored seed beyond one wet season, burning in this manner effectively breaks the regeneration cycle—and especially if all regenerating Sorghum is burnt in the target management area. The window of opportunity for effective Sorghum fuel reduction fire management occurs generally over a two month period, often between December – January, but with actual timing depending on the onset of wet season rains. For effective management, target swards need to have remained unburnt throughout the preceding dry season in order to carry sufficient dry fuels to propagate a complete Sorghum-burning fire.
While the practice is straight-forward, there are a number of questions which land managers rightly need to ask. First, what effects does wet season burning have on other species? And second, are there any other negative effects to be aware of. In fact, substantial research (mostly unpublished) and observational experience is available which at least starts to address such issues.
Additionally, while these issues are not addressed here, burning in the wet season may have other broader management purposes – eg reduction of very large fuel loads under relatively safe climatic conditions. Such practice was evidently undertaken traditionally for fine-scale management of large spinifex fuels in the escarpment country (Lofty Nadjamerrek pers. comm.), and may well have useful application in similar situations today.
6.1.2 Effects of wet season burning
Effects on other native species
Two studies have explored the effects of wet season burning on native vegetation in the Top End. The most extensive of these examined the response of vegetation to wet season burning on 12 experimental plots (6 burnt in wet season, 6 unburnt but subsequently burnt in the next dry season) at the Bradshaw Field Training Area (formerly Bradshaw Station) south of Darwin (Russell-Smith et al 2001). The main findings were that wet season burning substantially reduced cover of annual Sorghum, but all other woody and herbaceous species prospered, with the possible exception of two geophyte (yam) species and for which only limited observations were available. Removing the Sorghum competition facilitated much
1 Bushfires NT, Department of Natural Resources, Environment, the Arts and Sport & Kakadu Research
Advisory Committee
139
greater representation of other annual herbaceous species without any negative detriment to most perennials (eg other grass species). The noted possible exceptions, both with perennial below-ground parts which shoot annually from or before the start of the wet season, provide a salutary warning that populations of plant species exhibiting similar lifeform traits may be at risk if they are burnt while in an active growing phase.
The second study, undertaken at Ranger mine (Brennan 1997), similarly found no negative effects on herbaceous species other than annual Sorghum – annual species in fact increased by a factor of 4.5–6 times, per 0.5 m2 quadrat.
How long may the effects of wet season burning on Sorghum fuel reduction last?
At Bradshaw, wet season burning substantially reduced (generally by around 50%) fine fuels (grass and litter) for at least two following wet seasons (Russell-Smith et al 2001). At Ranger, Williams and Lane (1999) considered that the positive effects of removing annual Sorghum by wet season burning may last only a couple of years. Unpublished data (Kym Brennan pers comm), however, show that, if a large enough area is burnt through wet season burning to restrict recolonisation by Sorghum from remaining unburnt areas , such effects may last at least four years.
Are there detrimental side-effects of wet season burning on other plant species?
While not formally documented, management staff in Kakadu’s Mary River District have long observed that wet season burning promotes the spread of some weed species with soil-stored dormant seedbanks, particularly Crotalaria gorensis and Hyptis. The clear management implication is that wet season burning needs to be undertaken very advisedly in situations where the potential for weed invasion / promotion may far outweigh any benefit derived from annual Sorghum fuel reduction.
What about effects of wet season burning on soil erosion and loss?
This is a very significant side-effect of wet season burning, especially on any slopes over a few degrees, and follows the general principle that maintaining soil cover (leaf litter, herbaceous cover) at the start of, and through the wet season is the primary key to soil retention. In a recent assessment of soil loss at two northern Australian savanna sites, soil loss was compared between unburnt and late dry season-burnt hillslopes over one wet season (Russell-Smith et al 2006). Although very significant erosion was observed in both unburnt and burnt treatments, overall there was roughly three times net soil loss, and two times more soil movement (taking into account redistribution of soil from upslope), on late dry season burnt plots. The short message is: fires in the late dry season and wet season can result in severe soil loss, even in moderately sloping (>50) situations.
References
Brennan K 1997. The impact of wet season burning on herbaceous plants in savanna woodlands in the Jabiru area. In Bushfire ’97 Proceedings, eds BJ McKaige, RJ Williams & WM Waggitt, CSIRO Tropical Ecosystems Research Centre, Darwin, 24.
Russell-Smith J, Yates CP & Lynch B 2006. Fire regimes and soil erosion in north Australian hilly savannas. International Journal of Wildland Fire 15, 551–556.
140

141
Russell-Smith J, Yates C & May T 2001. A comparison between the effects of late dry season (LDS) and wet season burning (WSB) on soil erosion, fuel loads, and species composition in sandstone-derived landforms of the Bradshaw Field Training Area, Northern Territory. Final Report to the Department of Defence. Bushfires Council of the Northern Territory, Darwin.
Williams RJ & Lane AM 1999. Wet season burning as a fuel management tool in wet-dry tropical savannas: applications at Ranger Mine, Northern Territory, Australia. In Proceedings of VIIth International Rangeland Congress, Townsville, vol 2, eds D Eldridge & D Freudenberger, VII International Rangeland Conference, Inc., Townsville, 972–977.
Part 7 Impact of fire on native fauna
Introduction
The effects of fire on fauna are many, varied and often complicated. Fire is one of the most important determinants of habitat quality for fauna, primarily as a result of the impact that it has on resource availability and access. Some components of the fauna of Kakadu appear to prefer long unburnt habitat while some prefer, or at least can persist, in more frequently burnt areas. Others still require a mix of burnt and unburnt patches in order to obtain all the resources that they need to survive. For many other species, we can do no more than infer their requirements from the knowledge we have of other species. Since species have such a variety of preferences in relation to fire, there is no one regime that will suit all. Identifying an approach to fire management that will accommodate as much of the faunal biodiversity as possible is a major challenge to land managers across northern Australia, including Kakadu.
142
7.1 Fire and fauna
J Woinarski1
7.1.1 Introduction
Fire is both threat to biodiversity and an effective and necessary management tool. The expertise is in finding the fine line between these apparently contradictory factors. This delicate positioning is possible if:
(1) park managers recognise that they are responsible primarily for managing environmental and biodiversity (and cultural) values. Managing fire is not an end in itself, but a means to achieving the protection and enhancement of these assets.
(2) there is adequate knowledge of the responses to fire (and requirements for fire) of significant environmental values;
(3) these requirements and responses can be built into, as primary drivers of, a fire management program with spatially explicit targets and performance measures;
(4) this fire management program is effectively implemented; and
(5) there is ongoing and adequate monitoring to ensure that this management is working – or, if it is shown to be not working, that the program can be appropriately modified.
7.1.2 Threats to biodiversity
How serious an issue is fire? In Table 1 below, I tally the identified threats to listed threatened species that occur in Kakadu.
Table 1 The threats that are most significant for biodiversity in Kakadu National Park
Threat Plants (n=9 spp)
Nearby plants (n=9 spp)
Animals (n=20 spp)
Total
(n=38 spp)
fire 5 5 15 25
weeds 2 1 8 11
feral herbivores 3 2 4 9
feral predators 0 0 8 8
Fire is by far the factor that affects the most of Kakadu’s threatened species. These threatened species are generally indicators of problems that also affect other species, so provide a good measure of environmental issues more generally.
We can compare such information more broadly across the Northern Territory (Figure 1). Not only is fire the major threat to biodiversity (as indicated by threatened species) in Kakadu, but
1 Department of Natural Resources, Environment, the Arts and Sport, Northern Territory Government
143
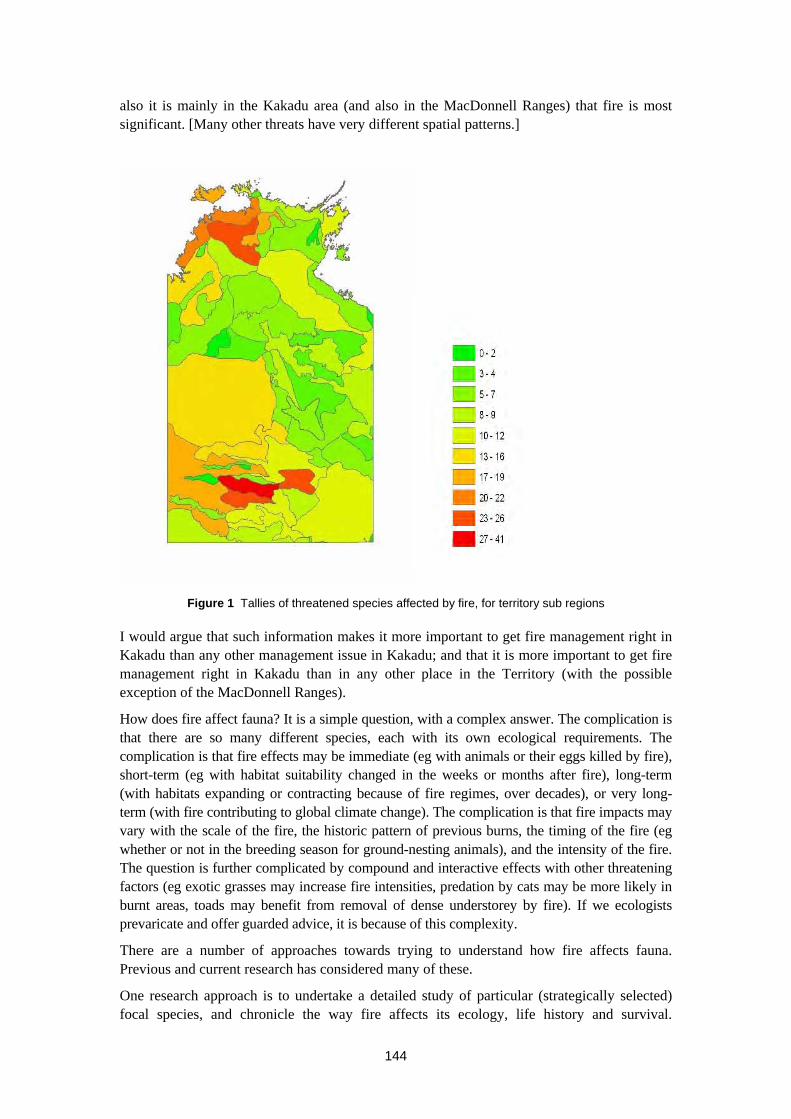
also it is mainly in the Kakadu area (and also in the MacDonnell Ranges) that fire is most significant. [Many other threats have very different spatial patterns.]
Figure 1 Tallies of threatened species affected by fire, for territory sub regions
I would argue that such information makes it more important to get fire management right in Kakadu than any other management issue in Kakadu; and that it is more important to get fire management right in Kakadu than in any other place in the Territory (with the possible exception of the MacDonnell Ranges).
How does fire affect fauna? It is a simple question, with a complex answer. The complication is that there are so many different species, each with its own ecological requirements. The complication is that fire effects may be immediate (eg with animals or their eggs killed by fire), short-term (eg with habitat suitability changed in the weeks or months after fire), long-term (with habitats expanding or contracting because of fire regimes, over decades), or very long-term (with fire contributing to global climate change). The complication is that fire impacts may vary with the scale of the fire, the historic pattern of previous burns, the timing of the fire (eg whether or not in the breeding season for ground-nesting animals), and the intensity of the fire. The question is further complicated by compound and interactive effects with other threatening factors (eg exotic grasses may increase fire intensities, predation by cats may be more likely in burnt areas, toads may benefit from removal of dense understorey by fire). If we ecologists prevaricate and offer guarded advice, it is because of this complexity.
There are a number of approaches towards trying to understand how fire affects fauna. Previous and current research has considered many of these.
One research approach is to undertake a detailed study of particular (strategically selected) focal species, and chronicle the way fire affects its ecology, life history and survival.
144
Examples in Kakadu include studies of northern quoll, partridge pigeon, sandstone antechinus and rock-rats, yellow-snouted gecko, Leichhardt’s grasshopper and brush-tailed rabbit-rat. Fiona Fraser’s studies of partridge pigeon demonstrated that this almost entirely ground-dwelling bird requires dense undergrowth (grasses) for nesting (during the early dry season) but open (patchily burnt) areas in which to forage effectively (for fallen seeds). Life is good for the partridge pigeon if it can have both burnt and unburnt patches within its territory, suggesting that managers should aim for fires in the early dry season that are a hectare or so in scale. If fires are more extensive, that year’s reproduction may be lost. If there are no fires, then reduced feeding efficiency may mean that there are fewer young produced and fewer adults surviving over the course of the year. Meri Oakwood’s study of northern quolls in the lowlands around Kapalga demonstrated that the major cause of mortality of quolls was predation, and that this predation was most significant in areas of intense and extensive fires. Ted Johansen’s study of yellow-snouted geckos demonstrated that a dense leaf litter was important for protecting the eggs (and adults) of this declining woodland species, and populations were likely to be exterminated by intense fires, and recolonised only from adjacent unburnt areas – the larger the fire the more likely the species would disappear from very large areas. Bob Begg’s studies at Little Nourlangie Rock (Nawurlandja) showed that a single fire event in the stone country could cause very significant declines in the population for a range of mammal species, with decline evident for well over a year after the fire. Ron Firth’s studies on brush-tailed rabbit-rat have shown that this lowland woodland species does far better in infrequently burnt habitats than in places that have been burnt recently or frequently. Single fires reduce the availability of the hollow logs in which it shelters, regimes of frequent fires reduce the availability of its preferred perennial grass seeds. We conducted a detailed radio-tracking study of a translocated population of this species. The population was doing well over a 4-month period, with new young entering the population: but within a week of a single fire event, the entire population disappeared. Of course, not all species are disadvantaged by fire: for example, bustards and kites will track recently burnt areas across the landscape to feast on more readily available prey.
Another research approach is to experimentally manipulate fire regimes. The largest such study was by CSIRO at Kapalga. Results for vertebrate fauna were mixed, and perhaps the study was too short to show clearcut results. But the most substantial analysis of the Kapalga results (by Guy Pardon and others) demonstrated that all the fire regimes imposed were detrimental to northern brown bandicoots, with the worst being the imposition of frequent late dry season fires. A conclusion from this study was that the bandicoot needed a spatially intricate fire mosaic, and did worst when fires extended over very extensive areas. Studies of smaller areas that have remained unburnt for longer periods than the Kapalga study (notably at Solar Village near Darwin) have demonstrated that there is a distinct set of birds, reptiles and mammals that prefer long-unburnt woodlands. Long-unburnt woodlands provide denser leaf litter, more shade and/or more fruit (because of the development of a dense shrubby understorey), and hence support species (such as white-throated honeyeater, brushtail possum, black-footed tree-rat, northern fantail, and many others) that rely on these habitat features.
Another research approach is to use the natural variation in fire regimes as a de facto experiment. Using GIS or local knowledge, it is possible to find sites that are comparable but have had very contrasting fire histories (eg infrequent fire, tight mosaic of different fire histories, very frequent fire), and then to document the species present and their abundance in these sites. There have been few of these natural experimental studies, partly because they provide relatively little statistical power (and especially so if there was no baseline sampling to ensure that the sites had comparable faunas initially).
145

146
Another research approach involves the use of long-term fixed plot monitoring. This has proven very effective for understanding the dynamics and fire response of vegetation at Kakadu (and other national parks in the Top End). The fire monitoring plots in Kakadu have been sampled for fauna, but less substantially and regularly than for vegetation. There are particular traits of fauna sampling that make it a more difficult issue than for vegetation. Whereas a monitoring plot can be sampled for vegetation in a few hours, with little equipment other than a tape measure, plant press, pencil and folder, fauna sampling requires far more equipment, sampling over a 48–72 hr period, and overnight stays for spotlight searching. Especially with remote (helicopter access) sites, this makes for far more expense. But sampling vegetation is also simpler because the trees and shrubs don’t tend to move, whereas animals do, not all animals are readily detectable, and there may be more variation in identification between observers for an animal seen than for a plant collected. For these reasons, there is likely to be far more ‘noise’ (unwanted variability) for fauna monitoring than for vegetation sampling, reducing the statistical power of the monitoring program, and making it far more difficult to detect trends.
We don’t yet know enough about enough species in Kakadu to be definitive about fire management. But that will always be the way. There is sufficient information to provide ingredients to fire management planning generally, and detailed information to develop fire management plans for some (particularly threatened) species. My take (and some of these are contestable and open to interpretation) on these are:
extensive, hot, late dry season fires are generally the most detrimental for biodiversity – of these components, the extent is probably the worst;
fires that are small-scale and patchy (burnt and unburnt vegetation in patches of about 1 ha scale) are preferable to fires that are large-scale and uniform;
frequent fires (eg return times of 2 years or less) are generally detrimental for biodiversity;
there is insufficient area of long (>5–10 years) unburnt vegetation, especially in the lowlands;
too much area is burnt per year (I’d suggest a target of no more than 30% burnt per year);
many of the most fire-sensitive species are restricted to the stone country, and fires in this area should be few and fine-scale;
many of the most fire-sensitive species are restricted to rainforest patches, and these should be actively protected from fire;
there are some threatened species in fire-prone areas (eg brush-tailed rabbit-rat near Mardugal) that need particular targeted management intervention.
Some of these ingredients may be particularly difficult to accommodate in management planning; some may sit uneasily with cultural priorities; some may be expensive and demand substantially more fire suppression or other intensive management than that currently undertaken. I acknowledge any such discomfit, but would argue that fire management in Kakadu should have as its cornerstone the conservation of biodiversity.
7.2 Impact of fire regimes on Leichhardt’s grasshoppers
P Barrow1
Leichhardt’s grasshopper (Petasida ephippigera) lives only on a few species of sandstone heath shrubs within the genus Pityrodia and is endemic to the sandstone escarpment and plateau country of the ‘Top End’ of the Northern Territory. There is some evidence that the distribution of the grasshoppers is in decline and it has been suggested that adverse fire regimes are responsible. The aims of this study were:
1 to investigate the factors affecting the distribution and abundance of Pityrodia: why does it occur where it does?
2 to investigate the population dynamics of both Pityrodia and the grasshoppers: how do the populations grow and what happens when they are burnt?
3 to examine sandstone fire regimes: current burning patterns and how these might have changed in recent times;
4 to create computer fire and population models to investigate the effects of different fire regimes on populations of Leichhardt’s grasshopper; and
5 to discuss the implications of the results for management of populations of Leichhardt’s grasshopper
Field studies on Pityrodia and fire were conducted mostly in Kakadu and Nitmiluk National Parks, but were focussed in the Gubara area of Kakadu. Floristic, environmental and firescar data were collected at many sites, mainly using transects of contiguous 5 m x 5 m quadrats. In addition, two large existing datasets from both parks and nearby areas were analysed. Grasshopper population studies were conducted using mark-recapture methods, with marking done by super-gluing numbers (apiarists bee-tags) on the backs of the grasshoppers.
The distribution of Pityrodia is markedly patchy, with the single most important variable associated with Pityrodia presence being rock cover, particularly of large rocks and boulders. Pityrodia is more weakly associated with open vegetation and with shallow, sandy soils. The plant species most commonly found with Pityrodia were short-lived obligate seeder shrubs, but the only long lived plant species associated with Pityrodia were resprouters. This result indicates that Pityrodia populations are currently subject to fairly frequent fires, but not so frequent as to burn out all the obligate seeding species. The density of Pityrodia stems increased after fire and decreased in the absence of fire. Two examples of mass mortality of Pityrodia in the absence of fire, in different species, are reported. All the Pityrodia species that Leichhardt’s grasshoppers live on resprout after fire, but reproduction by seed also appears to be common in at least two species.
1 Weeds Branch, Department of Natural Resources, Environment, the Arts and Sport
147
In Kakadu the life cycle of the grasshoppers is as follows. Eggs are laid in the soil during the wet season, and the first nymphs hatch in early May. The nymphs, which are wingless and cannot fly, grow slowly throughout the dry season. The growth rate increases in the late dry season and the bright colours first appear in September–October. The winged adults first appear in December. Breeding commences soon after and continues throughout the wet season. By the end of April all the grasshoppers are dead. A notable observation of aggregation of nymphs was made during this study. In one population 73% of the nymphs converged, in August, in one 5 m x 5 m quadrat, with more than 120 nymphs on each of just two plants.
Most Leichhardt’s grasshopper populations were very small and sparsely distributed. The highest population density of adults recorded was approximately 300 grasshoppers per hectare. In four years of monitoring, this population doubled each year, until it was reduced after half the Pityrodia patch it occupied was burnt. Grasshopper numbers were always lower in the year after a population was burnt, but a few local extinctions of very small populations occurred in the absence of fire. Most grasshoppers did not move very far in their lives – the average distance was 27 metres – but a few moved longer distances. Most long distance movements were made by males; few females (1.5%) moved between habitat (Pityrodia) patches.
Most of the fire literature indicates that contemporary sandstone fire regimes are characterized by fires that are later, more frequent, and more intense than those prevalent under traditional burning practices in the past. Fires in the more rocky areas of the sandstone, typical of Leichhardt’s grasshopper habitat, generally leave some unburnt patches, but those patches tend to be smaller in late fires than in early dry season fires. Unburnt patches are likely to be critical as refuges for grasshoppers, providing protection from flames during the passage of fire and from predation after fires. However, even in rocky areas, some continuously burnt areas are large enough to encompass entire habitat patches, and therefore entire (sub)populations of grasshoppers.
Modelling results indicate that changes in fire regimes to later, more frequent, more intense and less patchy fires are likely to be detrimental to populations of Leichhardt’s grasshopper. Management recommendations for the grasshoppers are precisely consistent with those for the conservation of obligate seeding sandstone heath shrubs. The Leichhardt’s grasshopper populations on or around the Mt Brockman outlier are amongst the few, anywhere, that are relatively easily accessible by road. It is recommended that consideration be given to intensive fire management to protect these grasshopper populations, at least until further monitoring clarifies the broader conservation status of the species. A further possible management response to be considered, at least until fire impacts are better understood, is to trial the translocation of grasshoppers from healthy populations to areas in which they are locally extinct.
Many questions regarding fire and Leichhardt’s grasshopper remain unanswered. Among the most important of these are:
What are the direct fire-caused mortality rates for grasshoppers under different conditions and growth stages? This data may be obtained during regular surveys of nymphs if a fire occurs serendipitously, or it may be obtained by experimental investigation. The latter case would require careful discussion and evaluation of the issues involved.
Is there a diapause stage in the life cycle (do the eggs lie dormant in the soil for one or more years, as is common in some other grasshopper species)?
148
149
What is the relationship between dispersal or migration rate and distance between habitat patches? This determines the rate of recolonisation of patches after local extinction due to fire.
What is the full distribution range of Leichhardt’s grasshopper? This knowledge is required for a full assessment of the species’ conservation status and it is probable that many populations remain unknown, even in Kakadu National Park.
A regular monitoring program would help answer some of these questions, and also provide information relating to the assessment of fire management of the sandstone heaths in general. The adult grasshoppers are charismatic and conspicuous, and are easy to survey in areas known to be occupied; several populations could be estimated by a small group of workers, armed only with felt-tipped marker pens and clicking counters, in just three days of work every January. Monitoring of unoccupied habitat patches presents a few difficulties, not insurmountable, and should be done in order to investigate the ability of grasshoppers to recolonize after local extinction. Monitoring nymph populations will be important, as described above, in order to determine fire-caused mortality rates for this most susceptible life stage.
Finally, while many of the results presented are purely descriptive natural history, it is important to note that the modelling results are just that. With rare species the input parameters are almost always based on imperfect data sets, precisely because of that rarity. There are also well known problems involved in extrapolating modelling results to larger scales. Nevertheless, in the words of Hamish McCallum: ‘it will usually be the case that a set of approximate parameter estimates in a formal mathematical model is preferable to an arm waving argument’. Any imprecisely estimated parameters have been acknowledged and the sensitivity of the results to them tested, and all the predictions made are relative and not absolute. The models are relatively simple, and are easily amenable to development and improvement as extra data become available. They also provide considerable learning value, and are a useful aid to managers in understanding the fire ecology of Leichhardt’s grasshopper.
Further reading
Lowe L 1995. Preliminary investigations of the biology and management of Leichhardt’s grasshopper, Petasida ephippigera White. Journal of Orthoptera Research 4, 219–21.
Price O, Russell-Smith J & Edwards A 2003. Fine-scale patchiness of different fire intensities in sandstone heath vegetation in northern Australia. International Journal of Wildland Fire 12, 227–36.
Wilson CG, Barrow PH & Michell CR 2003. New locations and host plants for Leichhardt’s grasshopper Petasida ephippigera White (Orthoptera: Pyrgomorphidae) in the Northern Territory. Australian Entomologist 30, 167–76.