IR Supplemental Material
15
IR Supplemental Material Consolidated Quarterly Financial Results for FY2014 (Six-month period ended September 30, 2014) ・ Principal Subsidiaries and Associated Companies Contributing to Consolidated Results/Overseas Four Broad Regions p1 ・ Supplemental materials by Segment p2-12 (Performance Overview, Medium-to long-term Strategy) ・ Supplemental materials by Segment p13 (Media, Network, Lifestyle Related Goods & Services Business Unit and Mineral Resources, Energy, Chemical & Electronics Business Unit) ・ Historical Data p14 (P/L, C/S, B/S, Key Financial Indicator) October 31, 2014 Sumitomo Corporation
Transcript of IR Supplemental Material

IR Supplemental Material
Consolidated Quarterly Financial Results for FY2014
(Six-month period ended September 30, 2014)
・ Principal Subsidiaries and Associated Companies Contributing to
Consolidated Results/Overseas Four Broad Regions p1
・ Supplemental materials by Segment p2-12
(Performance Overview, Medium-to long-term Strategy)
・ Supplemental materials by Segment p13
(Media, Network, Lifestyle Related Goods & Services Business Unit and
Mineral Resources, Energy, Chemical & Electronics Business Unit)
・ Historical Data p14
(P/L, C/S, B/S, Key Financial Indicator)
October 31, 2014
Sumitomo Corporation

Sumitomo Corporation
Unit: billions of yen (rounded to the nearest 100 million)
FY2013Apr.-Sep.Results
FY2014Apr.-Sep.Results
FY2014Annual Forecasts(as of Oct. 2014)
Metal Products
ERYNGIUM Ltd. *1 *100.00 Manufacturing, processing and distribution of speciality metals for OCTG market 2.3 3.1 5.8
SC Pipe Services Inc. 100.00 Investment in pipe manufacturing and sales company in the U.S. 1.4 1.6 2.8
Edgen Group *100.00 Global distributor of metal and tubular products for energy industry - 1.1 3.8
Sumisho Metalex Corporation 100.00 Sale of non-ferrous metal products, materials for home heat solution 0.7 0.6 1.4
Transportation & Construction Systems
Sumitomo Mitsui Finance and Leasing Company, Limited *40.00 Finance & Lease 10.4 10.0 17.8
Sumitomo Mitsui Auto Service Company, Limited 46.00 Leasing of motor vehicles 2.3 2.5 4.1
P.T. Summit Oto Finance *100.00 Financing of motorcycles in Indonesia 1.5 1.9 3.0
Sumisho Machinery Trade Corporation *2 *100.00 Trading of automobiles, construction equipment, machinery and equipment 0.5 0.8 1.4
P.T. Oto Multiartha *100.00 Financing of automobiles in Indonesia 2.6 0.8 2.0
Environment & Infrastructure
Sumisho Global Logistics Co., Ltd. 100.00 Global logistics provider 0.7 0.7 1.3
Perennial Power Holdings Inc. *100.00 Development, ownership and management of power plant in the U.S. 0.6 0.7 1.1
Media, Network, Lifestyle Related Goods & Services
Jupiter Telecommunications Co., Ltd. *3 50.00 Operation of multiple cable TV systems (MSO) and channels (MCO) 10.8 12.5 25.6
Jupiter Shop Channel Co., Ltd. 50.00 Operation of TV shopping channel 3.2 3.3 7.2
SCSK Corporation 50.78System Integration, IT infrastructure implementation, IT management, BPO, and IThardware software sales
2.7 2.9 7.3
2 companies in the banana business *- Import and sale of fruits and vegetables 1.5 1.4 1.8
Summit, Inc. 100.00 Supermarket chain 0.1 1.2 2.0
MobiCom Corporation 33.98 Integrated telecommunication service in Mongolia 0.6 0.6 0.9
S.C.Cement Co.,Ltd *100.00 Sale of cement, ready-mixed concrete, and concrete products 0.3 0.4 1.0
Grain business companies in Australia *4,5 *100.00 Grain accumulation and investment in grain storage and export terminal operatingbusiness
(0.3) 0.2 1.1
Sumisho Brand Management Corporation *100.00 Import, design and sale of the German luxury line of Chenille fabrics brand "FEILER"and women's apparel and accessories brand, "NARA CAMICIE"
0.4 (0.0) 0.4
TBC Corporation *6 *100.00 Retail and wholesale of tires in the U.S. (1.1) (1.5) (23.2)
Mineral Resources, Energy, Chemical & Electronics
2 silver, zinc and lead business companies in Bolivia *100.00 Investment in silver, zinc, and lead mine operating, and ore concentrate salescompanies in Bolivia
2.4 6.7 12.3
Oresteel Investments (Proprietary) Limited *49.00 Investment in Assmang iron ore and manganese mine in South Africa 8.0 4.9 6.8
LNG Japan Corporation 50.00 Trading of LNG, investment and financing related to LNG business 1.0 3.6 7.5
SC Minerals America, Inc. *100.00 Investment in the Morenci copper mine, the Pogo gold mine in the U.S. and theCandelaria & Ojos del Salado copper mines in Chile
3.2 2.1 4.7
Iron ore mining business in Brazil *6 *- Iron ore mining business in Brazil 2.2 1.5 (48.0)
2 companies with oil field interests in the North Sea *-Development, production and sale of crude oil and natural gas in the British andNorwegian zones of the North Sea
1.3 1.1 0.9
Sumitomo Shoji Chemicals Co., Ltd. 100.00 Sale and trade of chemicals and plastics 0.6 1.0 1.6
SMM Cerro Verde Netherlands B.V. 20.00 Investment in the Cerro Verde copper mine in Peru 1.0 0.9 1.9
Sumitronics Corporation 100.00 Electronics manufacturing service 0.6 0.7 1.5
SC Mineral Resources Pty. Ltd. *100.00 Investment in the Northparkes copper mine in Australia 0.5 0.6 1.0
Nusa Tenggara Mining Corporation 74.29 Investment in and financing of the Batu Hijau copper/gold mine project in Indonesia 0.1 (1.9) (2.6)
Nickel mining and refining business in Madagascar - Investment in and financing of the Ambatovy nickel mining project in Madagascar (0.5) (4.5) (9.7)
Companies related to coal business in Australia*6,7 *- Investment in coal mines in Australia (0.2) (22.8) (40.4)
Tight oil business in the U.S.*6,7 *100.00 Exploration,development,production,sale of and investment in tight oil and naturalgas in North America
(0.2) (174.6) (173.0)
Overseas *8
Europe, Middle East, Africa & CIS - Export, import and wholesale 6.0 8.6 12.7
Asia & Oceania*6,7 - Export, import and wholesale 4.7 4.7 5.6
East Asia - Export, import and wholesale 2.0 2.0 4.7
Americas*6,7 - Export, import and wholesale 8.7 (32.4) (36.7)
Some portions of the impact mentioned above are included in the annual forecasts of Asia & Oceania and Americas. (Asia & Oceania -4.0, Americas -58.2 (billions of yen))
Principal Subsidiaries and Associated Companies Contributing to Consolidated Results/Overseas Four Broad Regions
Shares inequity
(as of Sep. 30, 2014)
(%)
Main Business
Equity in earnings
Notes)
(*) Shares in equity and equity in earnings for companies marked with an asterisk are the percentage shares and equity amounts company-wide including other segments.
(*1) We changed our consolidated periods from the forth quarter of FY2013, the results show equity in earnings for the period of FY2014 Apr.-Sep., FY2013 Jan.-Jun. respectively.
(*5) We changed our consolidated periods from the forth quarter of FY2013, the results show equity in earnings for the period of FY2014 Apr.-Sep., FY2013 Mar.-Aug. respectively.
(*6) The amount of impairment and possible impairment losses announced on September 29, 2014 is included in the annual forecasts.
(*7) The impairment losses included in FY2014 Apr.-Sep. Results: Companies related to coal business in Australia -17.5, Tight oil business in the U.S. -173.6 (billions of yen)
We disclose results of overseas four broad regions accordingly.
(*2) The majority shareholder was changed from Environment & Infrastructure business unit to Transportation & Construction Systems business unit.
(*3) As Jupiter Telecommunications merged with Japan Cablenet (JCN) in December 2013, the equity in earnings of FY2013 and FY2014 are calculated by adding consolidation adjustments.
(*4) In February 2014, our shares in Grain business companies in Australia were increased to 100.00%. (FY 2013 Apr.-Sep.:50.00%)
(*8) We have regrouped all of our overseas regional organizations into four broad regions, namely, "Americas," "Europe, Middle East, Africa & CIS," "East Asia" and "Asia & Oceania."
The impact to the equity in earnings of each company is as follows: TBC Corporation -20.0, Iron ore mining business in Brazil -50.0,
Companies related to coal business in Australia -30.0, Tight oil business in the U.S. -173.6 (billions of yen)
Some portions of the impairment losses are included in FY2014 Apr.-Sep. Results of Asia & Oceania and Americas. (Asia & Oceania -2.1, Americas -45.0 (billions of yen))
1

Performance OverviewPerformance Overview
※We eliminated the Kansai Regional Business Unit and Chubu Regional Business Unit on 1 April, 2014. These two regional business units were incorporated into organizations under business units and divisions. The p io ea es lts a e also sho n on a ne o gani ation basis acco dinglThe prior year results are also shown on a new organization basis accordingly.
Metal Products
(Ref )【P fit f th i d 16 2 billi 】
(unit: billions of yen)
2013
Apr.-Sep.
2014
Forecasts
(Ref.)
2014 Original
Forecasts
Gross profit 44.1 - 103.0
Operating profit 14.9 - -
2014
Apr.-Sep.
51.7
20.4
【Profit for the period (Apr.-Sep. 2014):16.2 billion yen】
(3.6 billion yen increase from Apr.-Sep. 2013)
・Steel sheets Share of profit of
Investments accounted for
using the equity method3.2 - -3.3
Profit/loss(-) for the year
attributable to owners of the 12.616.2
33.0 31.0
Steel service center: stable
・Tubular productsNorth America: stable
Basic Profit 12.1 - -
Mar, 2014
884.4
parent 1Q:7.9 2Q:8.3
Total assets --886.2
16.3
【Results of major subsidiaries and associated companies】Company Equity in earnings of the segment (shares in equity owned by the segment / 2013 2014 2014 (Ref.)2014owned by whole company) Apr.-Sep. Apr.-Sep. Forecasts Original
【Investment & Replacement in FY14】
・ Participated in the second phase of aluminum smelting project in Malaysia (Apr. 2014)
Forecasts
・SC Pipe Services: 1.4 1.6 2.8 2.4
・ERYNGIUM(30/100)*1: 0.7 0.9 1.7 1.6
【Business Outlook】
・Tubular products in North America: stable
・Steel service center: stable
・Sumisho Metalex: 0.7 0.6 1.4 1.3
・Edgen Group(29/100): - 0.3 1.1 1.1
*1 As the consolidated period was changed, the results show equity in earnings of Jan.-Jun. 2013 for Apr.-Sep. 2013 and Apr.-Sep. 2014 for Apr.-Sep. 2014.
2

Transportation & Construction Systems
【P fit f th i d 25 5 billi 】 (Ref )【Profit for the period (Apr.-Sep. 2014):25.5 billion yen】
(4.2 billion yen decrease from Apr.-Sep. 2013)
・Ships, aerospace and railway carShipping market : sluggish
(unit: billions of yen)
2013
Apr.-Sep.
2014
Forecasts
(Ref.)
2014 Original
Forecasts
Gross profit 63.7 - 133.0
Operating profit 19.7 - -
2014
Apr.-Sep.
61.5
14.0pp g gg
・AutomobileAuto finance businesses in Indonesia : decreased
・Construction equipmentDi ib i b i i R i d Chi l d
Share of profit of
Investments accounted for
using the equity method16.6 - -15.9
Profit/loss(-) for the year
attributable to owners of the 29.725.5
48.0 46.0Distribution business in Russia and China : slowdownThe U.S. : stable
Basic Profit 28.0 - -
Mar, 2014
1,443.5
parent 1Q:12.5 2Q:13.0
Total assets --1,513.1
26.0
【Results of major subsidiaries and associated companies】Company Equity in earnings of the segment (shares in equity owned by the segment / 2013 2014 2014 (Ref.)2014owned by whole company) Apr.-Sep. Apr.-Sep. Forecasts Original
【Investment & Replacement in FY14】
・Invested in a construction equipment sales/service company in Saudi Arabia (July 2014)
Forecasts
・Sumitomo Mitsui Finance and Leasing (35/40): 9.1 8.7 15.6 14.7
・Sumitomo Mitsui Auto Service: 2.3 2.5 4.1 3.8
( y )
【Business Outlook】
・Automobile : weak due to worsening situations
in some emerging countries such as the Middle-East
・SOF(90/100): 1.3 1.7 2.7 2.5
・Oto Multiartha(90/100): 2.3 0.7 1.8 0.9
・Sumisho Machinery
・Lease and finance businesses : stabley
Trade Corporation(60/100) *1: 0.2 0.5 0.8 0.8
*1 Shares in equity of the segment were changed from 44.5% to 60% on 1 Apr., 2014.
Environment & Infrastructure
【P fit f th i d 8 7 billi 】 (Ref )【Profit for the period (Apr.-Sep. 2014):8.7 billion yen】
(1.7 billion yen increase from Apr.-Sep. 2013)
・Overseas power infrastructure business:
(unit: billions of yen)
2013
Apr.-Sep.
2014
Forecasts
(Ref.)
2014 Original
Forecasts
Gross profit 32.2 - 66.0
Operating profit 8.9 - -
2014
Apr.-Sep.
30.8
9.4
stable
【Investment & Replacement in FY14】
・ Started construction of wind farm in the U S (Apr 2014)
Share of profit of
Investments accounted for
using the equity method1.6 - -2.1
Profit/loss(-) for the year
attributable to owners of the 7.08.7
24.0 21.0・ Started construction of wind farm in the U.S. (Apr. 2014)
・ Started construction of biomass power plant in Japan(Jun. 2014)
・ Participated off-shore wind power generation business
Basic Profit 6.1 - -
Mar, 2014
597.0
parent 1Q:3.0 2Q:5.7
Total assets --593.0
7.3
【Results of major subsidiaries and associated companies】Company Equity in earnings of the segment (shares in equity owned by the segment / 2013 2014 2014 (Ref.)2014owned by whole company) Apr.-Sep. Apr.-Sep. Forecasts Original
p p gin Belgium (Sept. 2014)
・ Progress in expansion project of industrial park in Vietnam
・ Progress in construction of solar and wind farm in Japan Forecasts
・Sumisho Global Logistics*1: 0.6 0.7 1.3 1.1
・Perennial Power
Progress in construction of solar and wind farm in Japan, wind farm in South Africa and industrial park in Myanmar
【Business Outlook】
・Overseas power infrastructure business: stable
and contribution from a new project in the 2nd half
Holdings(40/100) *2: 0.3 0.3 0.4 0.4
・Temporary gain through value realization in renewable
energy power generation business in the 2nd half
*1 Shares in equity of the segment were changed from 95% to 100% on 1 Apr., 2014.*2 Shares in equity of the segment were changed from 50.01% to 40% on 1 Apr., 2014.
3

Media, Network, Lifestyle Related Goods & Services
【P fit f th i d 22 1 billi 】 2013 2014(Ref.)
2014【Profit for the period (Apr.-Sep. 2014):22.1 billion yen】
(4.7 billion yen increase from Apr.-Sep. 2013)
・Major group companiesJ:COM and Jupiter Shop Channel etc. : stable
(unit: billions of yen)
2013
Apr.-Sep.
2014
Forecasts2014 Original
Forecasts
Gross profit 137.6 - 301.0
Operating profit 13.2 - -
2014
Apr.-Sep.
136.8
12.5p p
・Condominium : decrease in the number of delivery
Share of profit of
Investments accounted for
using the equity method15.3 - -16.8
Profit/loss(-) for the year
attributable to owners of the
parent17.5
22.154.0
50.0
(including impairment loss -8.0)*
Basic Profit 19.7 - -
Mar, 2014
1,871.2
parent 1Q:9.6 2Q:12.6
Total assets --1,795.7
22.9
*We announced impairment loss (expected) of tire business in the U.S. (TBC) on Sept. 29th, 2014.
【Results of major subsidiaries and associated companies】Company Equity in earnings of the segment (shares in equity owned by the segment / 2013 2014 2014 (Ref.)2014owned by whole company) Apr.-Sep. Apr.-Sep. Forecasts Original
Forecasts
【Investment & Replacement in FY14】
・ Invested in sugar milling business in Thailand (Apr. 2014)
・ Agreed to participate in telecommunications business
We announced impairment loss (expected) of tire business in the U.S. (TBC) on Sept. 29 , 2014.The effect to this segment is shown above as “impairment loss.”
・J:COM*1: 10.8 12.5 25.6 25.7・Jupiter Shop Channel: 3.2 3.3 7.2 7.2・SCSK: 2.7 2.9 7.3 7.5・Banana business: 1.4 1.3 1.6 1.5・Summit: 0 1 1 2 2 0 2 0
・ Agreed to participate in telecommunications business in Myanmar (July 2014)
・Established private REIT (Aug. 2014)
【Business Outlook】
・Major group companies such as J:COM and Jupiter Shop
Channel etc. : stable
Summit: 0.1 1.2 2.0 2.0・Mobicom: 0.6 0.6 0.9 0.8・S.C.Cement(98/100): 0.3 0.4 1.0 1.0・Grain business in Australia(70/100)*2,3:-0.2 0.1 0.8 0.7・Sumisho Brand Management(99.08/100): 0.4 -0.0 0.4 0.7・TBC(40/100): -0 4 -0 6 -9 3 0 3
・Real estate business : stable
・Possibility of impairment loss in TBC
TBC(40/100): 0.4 0.6 9.3 0.3
*1 The result for Apr.-Sept. 2013 was restated due to adjustments for consolidation according to JCN acquisition by J:COM in Dec., 2013.
*2 Shares in equity of the segment in Apr.-Sept. 2013: 35%.*3 As the consolidated period was changed, the results show equity in earnings of
Mar.-Aug. 2013 for Apr.-Sept. 2013 and Apr.-Sept. 2014 for Apr.-Sept. 2014.
Mineral Resources, Energy, Chemical & Electronics
【P fit f th i d 97 5 billi 】 (Ref )【Profit for the period (Apr.-Sep. 2014):-97.5 billion yen】
(121.0 billion yen decrease from Apr.-Sep. 2013)
・ Tight oil development project in the U.S. : Posted impairment loss
(unit: billions of yen)
2013
Apr.-Sep.
2014
Forecasts
(Ref.)
2014 Original
Forecasts
Gross profit 39.2 - 97.0
Operating profit 8.8 - -
2014
Apr.-Sep.
37.5
-133.5Posted impairment loss
・ Coal mining business in AustraliaPosted impairment losses and expenses for interest acquisition
Share of profit of
Investments accounted for
using the equity method16.8 - -5.7
Profit/loss(-) for the year
attributable to owners of the 23.5
-97.5
(including impairment loss -120.3)* 38.0-154.0
・ Nickel business in MadagascarIncreased in cost due to start of commercial production
・ Iron ore businesses in South Africa and BrazilDecline in price
(including impairment loss -179.7)*
Basic Profit 20.4 - -
Mar, 2014
1,614.5
parent1Q:3.3 2Q:-100.8
Total assets --1,611.5
10.2
【Results of major subsidiaries and associated companies】Company Equity in earnings of the segment (shares in equity owned by the segment / 2013 2014 2014 (Ref.)2014owned by whole company) Apr.-Sep. Apr.-Sep. Forecasts Original
Decline in price
・Chemical & Electronics : stable
【Investment & Replacement in FY14】
・ Participated in phenol production business in China
*We announced impairment losses (expected) of tight oil development project in the U.S., coal mining projects in Australia and iron ore project in Brazil on Sept. 29th, 2014.The effect to this segment are shown above as “impairment loss.”
Forecasts
・Silver, zinc and lead business in Bolivia(93/100): 2.2 6.2 11.5 10.0・Oresteel Investments(45/49): 7.3 4.5 6.2 9.8・LNG Japan: 1.0 3.6 7.5 6.1・SC Minerals America(84.75/100): 2.7 1.8 4.0 4.0・Iron Ore Mining Business in Brazil: 2.2 1.5 -46.9 5.4
Participated in phenol production business in China (Apr. 2014)
・ Acquired coal mining interest in Australia (May 2014)
・Sold part of oilfield interest in the North Sea (July 2014)
【Business Outlook】
・Decline in commodity prices
・Nusa Tenggara Mining : Decrease in sales volume
・Tight oil development project in the U S and
Iron Ore Mining Business in Brazil 2.2 1.5 46.9 5.4・Sumitomo Shoji Chemicals: 0.7 1.0 1.6 1.6・Oil fields interests in the North Sea: 1.2 1.0 1.0 1.1・SMM Cerro Verde Netherlands: 1.0 0.9 1.9 1.4・Sumitronics: 0.6 0.7 1.5 1.5・SC Mineral Resources(70/100): 0.4 0.4 0.7 0.7Nusa Tenggara Mining: 0 1 1 9 2 6 2 7Tight oil development project in the U.S. and
Coal mining projects in Australia : Impairment losses
・Iron ore mining project in Brazil : Possibility of impairment loss
・Nusa Tenggara Mining: 0.1 -1.9 -2.6 2.7・Nickel mining and refining business in Madagascar: -0.5 -4.5 -9.7 -11.2・Companies related to Coal business in Australia: 0.3 -20.4 -35.6 -12.1・Tight Oil Business in the U.S.(70/100): -0.1 -122.2 -121.1 0.3
4

Mineral Resources, Energy, Chemical & Electronics
FY13 FY14 Sensitivity to net income ( l b /
Mineral Resources Equity Share of Production and Sensitivity to Profit for the Year
(annual base/
excluding prices hedge)Annual Results 1Q Results 2Q Results Forecasts
Coking coal
Equity share of shipping
volume 〔mil t〕 3.1 0.8 0.4 3.0 ¥240 mil (before tax)Coking coal
($1/t)Prices〔$/t〕 153 120 120 120
Thermal coal
Equity share of shipping
volume 〔mil t〕 2.5 0.6 0.7 5.6*1¥450 mil (before tax)
($1/t)P i 〔$/t〕 93 82 *2 82 ($1/t)Prices〔$/t〕 93 82 - 2 82
Iron ore Equity share of shipping
volume 〔mil t〕
4.8 0.5 1.9 4.3¥330 mil
($1/t)MUSA 2.0 0.5 0.5 1.6
Prices〔$/t〕 135 120 103 101
Manganese ore
Equity share of shipping
volume 〔mil t〕0.5 - 0.2 0.5 ¥30 mil
($1/t)Prices〔$/t〕 259 251 215 221$
Copper Equity share of
production 〔Kt〕
45 12 10 45¥230 mil
($100/t)Batu Hijau 14 4 3 12
Prices〔$/t〕 7,326 7,038 6,790 6,945Prices〔$/t〕 7,326 7,038 6,790 6,945
Note) Prices are general market price. FY14 forecasts and sensitivity to net income are as of May, 2014.
The shipping volume of Iron ore and manganese of Oresteel Investments are recognized semiannually (in second and fourth quarter).
*1 The figure includes equity share of shipping volume of Clermont coal mine in Australia, which we acquired in FY2014. *2 Index-linked price
Mineral Resources, Energy, Chemical & Electronics
Mineral Resources Equity Share of Production and Sensitivity to Profit for the Year
FY13 FY14 Sensitivity to net incomeSe s t ty to et co e
(annual base/
excluding prices hedge)Annual Results
1Q Results 2Q Results Forecasts
Equity share of production
〔 〕314(10 1) 78(2 5) 93(3 0) 364(11 7) ¥700 il
Silver〔t(mil oz)〕
314(10.1) 78(2.5) 93(3.0) 364(11.7) ¥700 mil
($1/oz)Prices〔$/oz〕 21.0 19.6 19.7 20.6
Equity share of production 〔Kt〕 170 39 50 194 ¥1.1 bil
Zinc〔Kt〕 ¥1.1 bil
($100/t)Prices〔$/t〕 1,909 2,073 2,312 2,172
Lead
Equity share of production 〔Kt〕
53 9 13 53¥300 mil
Lead($100/t)
Prices〔$/t〕 2,093 2,096 2,183 2,121
Crude oil, gas
Equity share of production
〔mil bbl〕2.5 0.6 0.2 1.8
¥10 mil
($1/bbl)($1/bbl)Prices〔$/bbl〕 108 108 109 106
LNG Equity share of production 〔Kt〕
350 80 90 340 -
Note) Prices are general market price. FY14 forecasts and sensitivity to net income are as of October, 2014.) g p y ,
5

Overseas Subsidiaries and Branches
【P fit f th i d 17 1 billi 】 2013 2014(Ref.)
2014
*We announced impairment losses (expected) of tight oil development project in the U.S., coal mining projects in Australia, iron ore project in Brazil and tire business in the U.S.
(TBC) on Sept. 29th, 2014.The effect to this segment are shown above as “impairment loss.”
【Profit for the period (Apr.-Sep. 2014):-17.1 billion yen】
(38.5 billion yen decrease from Apr.-Sep. 2013)
・Tight oil development project in the U.S. and
(unit: billions of yen)
2013
Apr.-Sep.
2014
Forecasts2014 Original
Forecasts
Gross profit 116.4 - 260.0
Operating profit 25.0 - -
2014
Apr.-Sep.
134.5
-19.7
Coal mining projects in Australia : Posted impairment losses
・Metal products related business : Stable
Share of profit of
Investments accounted for
using the equity method5.1 - -4.6
Profit/loss(-) for the year
attributable to owners of the
parent21.5
-12.050.0
-17.1
(including impairment loss -47.0)*2013 2014 2014 (Ref.) 2014(including impairment loss -62.2)*
Basic Profit 20.8 - -
Mar, 2014
1,889.7
parent 1Q:12.5 2Q:-29.5
Total assets --1,959.5
25.1
Apr.-Sep. Apr.-Sep. Forecasts Original
Forecasts
Americas 8.7 -32.4 -36.7 23.4(including impairment loss-45.0)* (including impairment loss-58.2)*
【Results of major subsidiaries and associated companies】Company Equity in earnings of the segment (shares in equity owned by the segment / 2013 2014 2014 (Ref.)2014owned by whole company) Apr.-Sep. Apr.-Sep. Forecasts Original
Forecasts
Europe, Middle East,
Africa & CIS 6.0 8.6 12.7 12.1
Asia & Oceania 4.7 4.7 5.6 9.2(including impairment loss-2.1)* (including impairment loss-4.0)*
East Asia 2 0 2 0 4 7 5 0 Forecasts
・ERYNGIUM(70/100)*1: 1.6 2.2 4.1 3.9
・Edgen Group(71/100): - 0.8 2.7 2.7
・Silver, zinc and lead business in Bolivia (7/100): 0.2 0.5 0.8 0.7・Perennial Power Holdings(60/100)*2: 0 3 0 4 0 7 0 7
【Investment & Replacement in FY14】・ Acquired office building in Chicago (Apr. 2014)
East Asia 2.0 2.0 4.7 5.0
【Business Outlook】
・Metal products related business: Stable
・Tight oil development project in the U.S. and
coal mining projects in Australia : Impairment losses
・Perennial Power Holdings(60/100) 2: 0.3 0.4 0.7 0.7・Oresteel Investments(4/49): 0.7 0.4 0.6 0.9・SC Minerals America(15.25/100): 0.5 0.3 0.7 0.7・Iron Ore Mining Business in Brazil: 0.0 0.0 -1.1 0.2・TBC(60/100): -0.7 -0.9 -13.9 0.4・Companies related to Coal business in Australia:-0 5 -2 4 -4 8 -1 4coal mining projects in Australia : Impairment losses
・Tire business in the U.S. (TBC) and iron ore mining project in Brazil :
Possibility of impairment losses
Companies related to Coal business in Australia: 0.5 2.4 4.8 1.4・ Tight Oil Business in the U.S. (30/100): -0.1 -52.4 -51.9 0.1
*1 As the consolidated period was changed, the results show equity in earnings of Jan.-Jun. 2013 for Apr.-Sept. 2013 and Apr.-Sept. 2014 for Apr.-Sept. 2014.
*2 Shares in equity of the segment were changed from 49.99% to 60% on 1 Apr., 2014.
6

Medium-to long-term Strategy by SegmentMedium to long term Strategy by Segment
Medium-to long-term Strategy
What We Aim to Be in FY2019, Our Centennial Year
-A Vision Based on Our Corporate Mission Statement-A Vision Based on Our Corporate Mission Statement
■ We aim to be a corporate group that is recognized by society as meeting
and exceeding the high expectations directed toward us creating value thatand exceeding the high expectations directed toward us, creating value that
nobody else can match in ways benefitting our distinctive identity.
■ We aim to build a solid earnings base and aim for an even higher level of
profit growth while maintaining financial soundness.
Total assets: ¥9-10 trillion
Consolidated net income: ¥400 billion or more
7

Metal Products
St t i f FY2019Strategies for FY2019
Existing Earnings Pillars to enhance Future Earnings Pillars to develop
Tubular products
・Expand value chain in oilfield related field based on
Aluminum smelting and rolling business
・Build value chain from upstream (smelting) OCTG business
- Expand to oilfield equipment, material and services- Build distribution network for oil & gas transport
pipelines and special pipes in addition to OCTG network
to middle stream (rolling)
Specialty steel
Electrical steel sheet
Metal products for transportation
・Establish strong position in railway field(rail / wheel / axle)
Gain 10% of global market share in automobile
Electrical steel sheet
・Gain 10% of global market share in automobile equipment field
・Steel service centers : enhance in strategic regions
Be the Best, Be the One 2014
Focus on Fields Major Initiatives in Focus on Fields
■Tubular products ■Tubular products
・Expand oilfield services
・Enhance distribution network for oil & gas transport pipelines and special pipes
・Establish distribution network for oil & gas transport pipelines and special pipes
- Acquired 100% shares of Edgen Group, a global distributor of metal and tubular products for energyindustry (Nov 2013 Amount of share acquisition: $520mil)
■Steel sheets
・Deepen and enhance manufacturing business of railway wheels and axles in the U.S.
industry (Nov. 2013, Amount of share acquisition: $520mil)
> Strengthen middle- downstream distribution networkfor pipelines and special pipes
> Establish value chain from upstream to downstream combined with our strong OCTG businessrailway wheels and axles in the U.S.
・Establish and strengthen steel service centers in strategic areas
・Manufacturing and selling secondary processing of
combined with our strong OCTG business
■Steel sheets
・Manufacturing and sales of motor core parts in Europe- Acquired 100% shares of Kienle+Spiess, German motor core manufacturing and sales company (Mar 2013)・Manufacturing and selling secondary processing of
specialty steel products in India
・Manufacturing and sales of motor core parts in Europe
core manufacturing and sales company (Mar. 2013) Aim to be no.1 motor core manufacturer in the world
・Constructed transport vessel which enables a transport of the world longest 150-meter rails
- Aim to increase overseas sales to meet the worldwide
■Non-ferrous products
・Additional investment in aluminum smelting business in Malaysia
demand for long rails
■Non-ferrous products
・Made additional investment in second aluminum smelting plant project by Press Metal in Malaysia (Apr. 2014)
・Enhance aluminum rolling business and trading- Aim to increase sales in Asia, where demand is growing
8

Transportation & Construction Systems
St t i f FY2019Strategies for FY2019
Existing Earnings Pillars to enhance Future Earnings Pillars to develop
Leasing business・Expand business base by utilizing Sumitomo Mitsui
Finance & Leasing Company as major platform
Railways related business・Implement existing EPC contracts successfully
and secure new contracts
Shipping business・Strengthen new building ship trade business・Expand ship-owning / joint owning business
Aerospace
Car manufacturing business in Mexico・Produce new generation vehicles for the Americas
and Europe in JV with Mazda・Produce Toyota-brand vehiclesp
・Promote growth of aviation-related business including aircraft leasing
Automobile・Expand auto leasing business to abroad
y
and diversify finance businesses・Expand sale and distribution mainly to growing market
such as Africa, the Middle East and its neighbor countries・Strengthen manufacturing mainly in emerging countries
C t ti i t Construction equipment・Strengthen and expand existing sales and service
businessesPursue business chances in emerging and resource-rich countries
・Expand globally rental construction equipment p g y q pbusiness based in developed countries
Be the Best, Be the One 2014
Focus on Fields
■Ships, aerospace and railway car■Ships aerospace and railway car
Major Initiatives in Focus on Fields
・Expand aircraft leasing and other leasing businesses
・Enhance quality and quantity in ship trading Replace and increase assets of ship-owning / joint owning business
■Ships, aerospace and railway car・Expanding aircraft related leasing businesses - Promoting SMBC Aviation Capital aircraft leasing as core business
Number of leased aircraft including managed assets: 380(Sept. 2014)Signed 115 aircraft purchase contract with Airbus(delivery starts in 2016)E i l i
j g
・Acquiring order of large EPC rail project
■Automobile
・Expand automotive leasing
- Engine leasingEstablished JV with German major partner (Dec. 2013)Anticipate synergy with aircraft leasing business in accumulating prime assets
■Automobile・Expand automotive leasing
from Japan to mainly Asian emerging countries
・Diversify finance businesses in emerging countries
・Manufacturing automobile parts and automobiles
・Expanding overseas business of Sumitomo Mitsui Auto Service- Promote auto leasing business in Asia in addition to Thailand, Australia and India
・Working based on “quality over quantity” policy for new loans in OTO(automobiles) and SOF(motorcycles)Manufacturing automobile parts and automobiles
- Increase global parts production capacity of KIRIU etc.- Start to expand production, increase car lines and
fabricate engines in automobile assembly plant in Mexico
■Construction equipment
for new loans in OTO(automobiles) and SOF(motorcycles)
・Enhancing production capacity of KIRIU- Started operation of second factory in Thailand(July 2013) - Started operation of third factory in Mexico (Aug. 2014)
■Construction equipment
・Strengthen and diversify existing businesses andlaunch new distributor/service business in Asia and the Middle East
・Started mass-production in automobile assembly plant in Mexico (Jan. 2014), and expanding production capacity step-by-step
■Construction equipment・Expanding operation of Sunstate Equipment Company in the U.S.
・Enhance rental business base in Japan and the U.S.Expand rental business to emerging markets
・Expand sales in Saudi Arabia through ALJ Summit Company
9
Environment & Infrastructure
St t i f FY2019Strategies for FY2019
Existing Earnings Pillars to enhance Future Earnings Pillars to develop
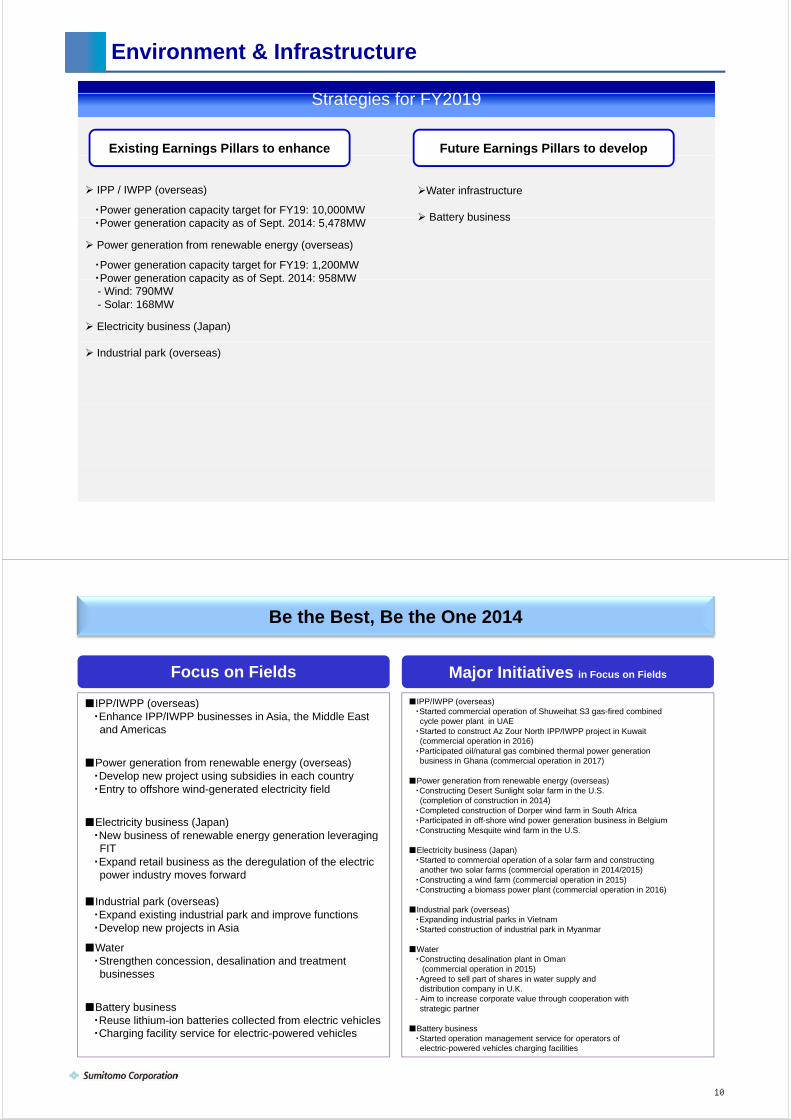
IPP / IWPP (overseas)
・Power generation capacity target for FY19: 10,000MW
Water infrastructure
Battery business・Power generation capacity as of Sept. 2014: 5,478MW
Power generation from renewable energy (overseas)
・Power generation capacity target for FY19: 1,200MW・Power generation capacity as of Sept 2014: 958MW
Battery business
Power generation capacity as of Sept. 2014: 958MW- Wind: 790MW- Solar: 168MW
Electricity business (Japan)
Industrial park (overseas)
Be the Best, Be the One 2014
Focus on Fields
■IPP/IWPP (overseas)Enhance IPP/IWPP businesses in Asia the Middle East
■IPP/IWPP (overseas)・Started commercial operation of Shuweihat S3 gas-fired combined
Major Initiatives in Focus on Fields
・Enhance IPP/IWPP businesses in Asia, the Middle Eastand Americas
■Power generation from renewable energy (overseas)・Develop new project using subsidies in each country
p gcycle power plant in UAE
・Started to construct Az Zour North IPP/IWPP project in Kuwait(commercial operation in 2016)
・Participated oil/natural gas combined thermal power generation business in Ghana (commercial operation in 2017)
Develop new project using subsidies in each country・Entry to offshore wind-generated electricity field
■Electricity business (Japan)・New business of renewable energy generation leveraging
■Power generation from renewable energy (overseas)・Constructing Desert Sunlight solar farm in the U.S. (completion of construction in 2014)
・Completed construction of Dorper wind farm in South Africa・Participated in off-shore wind power generation business in Belgium・Constructing Mesquite wind farm in the U.S.New business of renewable energy generation leveraging
FIT・Expand retail business as the deregulation of the electric
power industry moves forward
■Industrial park (overseas)
■Electricity business (Japan) ・Started to commercial operation of a solar farm and constructinganother two solar farms (commercial operation in 2014/2015)
・Constructing a wind farm (commercial operation in 2015)・Constructing a biomass power plant (commercial operation in 2016)
■Industrial park (overseas)・Expand existing industrial park and improve functions・Develop new projects in Asia
■Water・Strengthen concession desalination and treatment
■Industrial park (overseas)・Expanding industrial parks in Vietnam・Started construction of industrial park in Myanmar
■Water・Constructing desalination plant in Oman Strengthen concession, desalination and treatment
businesses
■Battery business・Reuse lithium-ion batteries collected from electric vehicles
g p(commercial operation in 2015)
・Agreed to sell part of shares in water supply and distribution company in U.K.
- Aim to increase corporate value through cooperation with strategic partner
・Charging facility service for electric-powered vehicles ■Battery business・Started operation management service for operators of electric-powered vehicles charging facilities
10

Media, Network, Lifestyle Related Goods & Services
St t i f FY2019Strategies for FY2019
Existing Earnings Pillars to enhance Future Earnings Pillars to develop
Further strengthen business base of core companies in media, ICT and retail field (J:COM / SCSK / SHOP etc.)
Expand successful business models in media, ICT and retail field from Japan to abroad
Acquire upstream interests and strengthen business base and expand value chain from upstream to middle-stream area in food business
(four strategic fields: i l t d / / t / f it & t bl )
Woody biomass fuel related business
Overseas real estate, real estate fund including logistics facilities and private REIT related business
grain related / sugar / meat / fruit & vegetables)
Strengthen earnings base of timber resources and tire business
Urban real estate business leveraging our integrated corporate strength
Be the Best, Be the One 2014
Focus on Fields
■Media, ICT and RetailJ:COM
■Media, ICT and Retail・J:COM
Major Initiatives in Focus on Fields
・J:COM- Implement capital restructuring- Establish joint management scheme with KDDI - Complete JCN integration
Promote businesses in emerging countries such as Asia
J:COM- Completed capital restructuring (end of Aug. 2013)- Integrated services and brands (Jun. 2013) after JCN integration
on 1 Apr. 2014・Participated in telecom business in Myanmar(fixed/mobile phones, internet business etc.) St t j i t ti (S t 2014)・Promote businesses in emerging countries such as Asia
Media / TV shopping / E-commerce / Mobile / Drugstore
■Food・Acquire upstream interests and strengthen business base
Start joint operation (Sept. 2014)・Started business in emerging countries- TV shopping: Thailand- E-commerce: China, Indonesia, Vietnam, Malaysia - Drugstore: Taiwan
Meat / Grain related etc.
■Materials and supplies
■Food・Enhancing business base- Signed contracts on flour milling business in Vietnam,
sugar production business in China and Thailand- Established food wholesale company in Vietnam- Made Australian grain company a subsidiary■Materials and supplies
・Strengthen business base of timber resources in Asia-Pacific basin
■Construction and real estate・Promote development of real estate businesses
- Made Australian grain company a subsidiary
■Materials and supplies・Started full-fledged woodland operation in New Zealand・Implementing measures based on TBC restructuring plan
・Promote development of real estate businesses in domestic strategic area- Redevelopment plan of the Tokyo Denki University site- Joint business in reconstruction of Kandanishikicho
buildings - Urban retail facilities and condominium sales etc
■Construction and real estate・Promoting development of real estate businesses in domestic strategic area- Redevelopment plan of the Tokyo Denki University site / Ginza 6-chome / Higashi-ikebukuro
- Condominium sales centered on CLASSY HOUSE- Urban retail facilities and condominium sales etc.・Started logistics property business・Established private REIT
11

Mineral Resources, Energy, Chemical & Electronics
St t i f FY2019Strategies for FY2019
Existing Earnings Pillars to enhance Future Earnings Pillars to develop
Enhance earnings base in upstream area of mineral resources & energy
・Value-up existing interests by strengthening earning power
Promote middle and down stream businesses leveraging synergy with upstream business
・Shale oil & gas related business in the U.S. (LNG & LPG t / G h i l t )
・Enhance earnings base by promoting mid-long term portfolio strategy
- CommoditiesIncrease interests in four key strategic resources (copper / coal / iron ore / crude oil & gas)
(LNG & LPG export / Gas chemical etc.)
・Value chain from raw material of fertilizer to sales of product
・Establish stable supply by development and trading of rare earth
- TimeCreate a best mix of exploration, development and production
- RegionDisperse and mitigate country risk
Create new additional value through combining our functions
・Promote sales of pesticide and fertilizer globally and expand multifaceted support for crop production business to emerging countries
Disperse and mitigate country risk
- Form of participationCooperate with prime partners and improve our function
・Expand each value chain in chemicals from energy and minerals, electronics etc.
The Strategies for FY2019 and Focus on Fields of mineral resources and energy for BBBO2014 were as shown. However, we are reviewing the upstream investment strategy after we recognized losses in large projects such as the Tight Oil Development project in the U.S.
Be the Best, Be the One 2014
Focus on Fields
■ Upstream of mineral resources and energy・Promote project under development
■ Upstream of mineral resources and energy
Major Initiatives in Focus on Fields
・Promote project under development ・Strengthen earning power of existing interests・Strengthen earnings base by asset replacement
- Nickel (Madagascar)- Sierra Gorda copper mine (Chile)
(Projects which posted impairment losses or have a possibility of impairment losses (announced Sept. 29, 2014))
・Tight Oil Development project (U.S.)- Northern part : to divest, Southern part : continue to hold
・Iron Ore (Brazil)- Shale oil & gas (U.S.) - Iron ore (Brazil)- Copper (Americas)- Coal (Australia)- Silver, zinc & lead (Bolivia)
・Iron Ore (Brazil)- Focus on further reducing costs due to decline in price
・Coal (Australia)- Working on amelioration of operating efficiency and promoting asset replacement to prime interestAcquired Clermont coal mining interest
■Middle and down stream trading and investment
- Carbon related businessChemical from energy (Shale gas chemistry etc )
- Acquired Clermont coal mining interest
(Other businesses)・Nickel (Madagascar)- Ramp-up toward full scale operation
・Sierra Gorda copper mine (Chile)- Chemical from energy (Shale gas chemistry etc.)- Chemical from minerals (Rare earth, soda ash, high purity quartz)
- Strengthen EMS* business base*Electronics Manufacturing Service
- Promote multifaceted support for crop production
pp ( )- Focusing on achieving early full scale operation
・Shale gas (U.S.)- Promoting development by optimizing drilling work efficiency
Copper (Americas)Promote multifaceted support for crop production business globally
- Formulator of cosmetic ingredients
■LNG export business in the U S
・Copper (Americas)- Promoting expansion at Morenci and Cerro Verde as planned
・Silver, zinc & lead (Bolivia)- Completed expansion plan of ore throughput capacity
■LNG export business in the U.S.・Cove Point LNG project ■LNG export business in the U.S.
・Export 2.2 mil ton per annum of LNG to Japan for 20 years from 2017
12

Sumitomo Corporation
Unit: Billions of yen (rounded to the nearest 100 million yen)
Media, Network, Lifestyle Related Goods & Services
Gross profit 136.8 137.6 (0.8)
Media, IT and retail*2 88.7 89.6 (0.8)
Food & agriculture business division 10.9 8.6 2.3
Materials & supplies division 28.3 28.8 (0.6)
Construction & real estate division 9.4 10.8 (1.4)
Profit for the period attributable to owners of the parent 22.1 17.5 4.7
Media, IT and retail*2 16.6 11.2 5.4
Food & agriculture business division 2.2 1.7 0.5
Materials & supplies division 0.6 0.9 (0.3)
Construction & real estate division 2.8 3.7 (0.9)
Total assetsAs of
Sep. 30, 20141,795.7
As of
Mar. 31, 20141,871.2 (75.4)
Media, IT and retail*2 985.7 1,034.0 (48.3)
Food & agriculture business division 171.1 182.1 (11.0)
Materials & supplies division 246.2 238.2 8.0
Construction & real estate division 394.0 417.7 (23.7)
Mineral Resources, Energy, Chemical & Electronics
Gross profit 37.5 39.2 (1.7)
Mineral resources and energy*3 12.0 13.2 (1.2)
Chemical and electronics*4 25.4 26.0 (0.5)
Profit (loss) for the period attributable to owners of the parent (97.5) 23.5 (121.0)
Mineral resources and energy*3 (105.3) 16.1 (121.4)
Chemical and electronics*4 7.9 7.4 0.4
Total assetsAs of
Sep. 30, 20141,611.5
As of
Mar. 31, 20141,614.5 (2.9)
Mineral resources and energy*3 1,277.1 1,305.6 (28.5)
Chemical and electronics*4 334.3 308.8 25.5
Supplemental materials by segment
FY2014 Apr.-Sep.
Results
FY2013 Apr.-Sep.*1
Results
Increase/
(decrease)
*1 We reclassified FY2013 Apr.-Sep. Results, according to the reorganization of Business Units on April 1, 2014.
*2 Media, IT and retail is a sum of Media division, Network division, and Lifestyle & retail business division.
*3 Mineral resources and energy is a sum of Mineral resources division No.1, Mineral resources division No.2 and Energy division.
*4 Chemical and electronics is a sum of Basic chemicals & electronics division and Life science division.
13

Historical Data(1) P/L, C/S
(Billion yen) FY2005 FY2006 FY2007 FY2008 FY2009 FY2010 FY2011 FY2012 FY2013FY2014six months
ended Sept. 30
U.S.GAAP IFRSGG Plan FOCUS'10 f(x) BBBO2014AG Plan
ended Sept. 30
Gross profit 706.6 857.7 934.5 935.2 779.5 864.0 918.8 827.0 894.4 450.3Selling, general and administrative expenses (515.8) (609.9) (669.4) (654.4) (639.2) (660.7) (686.4) (657.1) (706.4) (358.4)Interest expense, net (20.0) (37.1) (42.8) (36.1) (24.1) (18.1) (15.1) (15.8) (17.4) (6.8)Dividends 10.4 14.1 15.3 14.6 11.3 10.0 11.2 13.4 14.9 10.010.4 14.1 15.3 14.6 11.3 10.0 11.2 13.4 14.9 10.0Share of profit of investmentsaccounted for using the equity method 51.4 70.3 56.9 90.0 76.1 95.6 110.6 107.4 126.2 51.7
Gain on securities and other investments, net 41.8 44.4 94.9 4.5 32.9 9.5 14.8 51.5 8.8 13.9Gain (loss) on property, plant and equipment, net (12.8) (7.5) (10.1) (15.1) 5.0 (17.6) (9.0) (5.8) (19.8) (190.7)Other, net 1.0 (1.8) (0.7) (1.6) 1.5 (2.2) (3.6) (1.6) 3.5 (0.7)Profit(loss) before tax 247.8 331.9 367.6 319.6 223.3 280.5 341.4 319.0 304.2 (30.6) Income tax expense (80.7) (114.8) (119.8) (96.3) (61.8) (70.7) (77.7) (75.3) (70.4) (3.6)Profit(loss) for the year 167.1 217.1 247.8 223.3 161.5 209.8 263.7 243.7 233.9 (34.3)Profit(loss) for the year attributable to:
owners of the parent 160.2 211.0 238.9 215.1 155.2 200.2 250.7 232.5 223.1 (38.4) Non-controlling interests 6.9 6.1 8.9 8.3 6.3 9.6 13.0 11.2 10.8 4.1
Total trading transactions 10,336.3 10,528.3 11,484.6 10,750.0 7,767.2 8,349.4 8,273.0 7,502.7 8,146.2 4,170.2Basic profit 158.3 202.9 197.1 243.0 151.4 220.5 251.5 216.5 245.0 115.7
Net cash from operating activities (60.8) 194.3 323.7 348.8 510.4 219.5 190.4 280.3 278.2 77.3Net cash used in investing activities (137.9) (449.7) (298.0) (261.5) (59.4) (469.4) (35.7) (186.2) (249.9) (274.4)Free cash flows (198.7) (255.5) 25.6 87.3 451.0 (249.9) 154.7 94.1 28.4 (197.1)Net cash from (used in) financing activities 256.7 169.7 7.9 (5.8) (150.1) 155.9 (33.3) (24.7) 145.9 (28.8)
Historical Data(2) B/S, Key Financial Indicator
(Billion yen) FY2005 FY2006 FY2007 FY2008 FY2009 FY2010 FY2011 FY2012 FY2013FY2014six months
ended Sept. 30
U.S.GAAP IFRSBBBO2014GG Plan FOCUS'10 f(x)AG Plan
p
Total Assets 6,711.9 8,430.5 7,571.4 7,018.2 7,137.8 7,230.5 7,226.8 7,832.8 8,668.7 8,813.0Equity attributable to owners of the parent 1,304.0 1,473.1 1,492.7 1,353.1 1,583.7 1,570.5 1,689.1 2,052.8 2,404.7 2,428.1Interest-bearing liabilities (net) 2,622.2 2,913.3 3,247.6 3,186.8 2,781.8 3,056.3 2,786.7 2,930.3 3,123.5 3,410.9
Equity attributable to owners of the parent ratio (%)
19.4 17.5 19.7 19.3 22.2 21.7 23.4 26.2 27.7 27.6
ROE (%) 14.3 15.2 16.1 15.1 10.6 12.9 15.4 12.4 10.0 -ROA (%) 2.6 2.8 3.0 2.9 2.2 2.8 3.5 3.1 2.7 -Debt-Equity Ratio (net) (times) 2.0 2.0 2.2 2.4 1.8 1.9 1.6 1.4 1.3 1.4
(Yen)Stock price of Sumitomo Corp. 1 676 2 120 1 313 843 1 075 1 189 1 196 1 178 1 313 1 210 5 (closing price)
1,676 2,120 1,313 843 1,075 1,189 1,196 1,178 1,313 1,210.5
(highest) 1,705 2,330 2,445 1,658 1,113 1,297 1,284 1,276 1,616 1,419.5 (lowest) 804 1,280 1,221 556 811 874 875 984 1,101 1,195.0Nikkei stock average (closing price) 17,059.66 17,287.65 12,525.54 8,109.53 11,089.94 9,755.10 10,083.56 12,397.91 14,827.83 16,173.52Shares of common stock issued (unit: thousand)
1,250,603 1,250,603 1,250,603 1,250,603 1,250,603 1,250,603 1,250,603 1,250,603 1,250,603 1,250,603
Earnings per share attributable to owners of the parent (basic)
130.18 169.93 192.51 172.06 124.15 160.17 200.52 185.92 178.59 (30.78)We have prepared consolidated financial statements in accordance with U.S. GAAP for FY2009 or earlier and International Financial Reporting Standards (“IFRSs”) for FY2010 or later.Under U.S. GAAP, “Share of profit of investments accounted for using the equity method” corresponds to “Equity in earnings of associated companies, net,” “Profit for the year attributable to owners of the parent” corresponds to
“Net income attributable to Sumitomo Corporation,” “Equity attributable to owners of the parent” corresponds to “Sumitomo Corporation shareholders’ equity” and “Equity attributable to owners of the parent ratio” corresponds to “Sumitomo Corporation shareholders’ equity ratio.”
14