Engineering Fly Ash-based Geopolymer ConcreteGeopolymer Concrete

An IPRF Research Report Innovative Pavement Research Foundation Airport Concrete Pavement Technology Program Report IPRF-01-G-002-06-2 Research Report for
Proportioning Fly Ash as Cementitious Material in Airfield Pavement Concrete Mixtures
Programs Management Office 5420 Old Orchard Road Skokie, IL 60077 April 2011

An IPRF Research Report Innovative Pavement Research Foundation Airport Concrete Pavement Technology Program Report IPRF-01-G-002-06-2 Research Report for
Proportioning Fly Ash as Cementitious Material in Airfield Pavement Concrete Mixtures
Principal Investigators
Chetana Rao, Ph.D., Applied Research Associates, Inc. Richard D. Stehly, P.E., American Engineering Testing, Inc.
Contributing Author
Ahmad Ardani, P.E., formerly of Applied Research Associates, Inc.
Applied Research Associates, Inc. 100 Trade Centre Drive, Suite 200
Champaign, IL 61820 Phone: (217) 356-4500
American Engineering Testing, Inc.
550 Cleveland Avenue North Saint Paul, MN 55114 Phone: (651) 659-9001
Programs Management Office 5420 Old Orchard Road Skokie, IL 60077 April 2011


This report has been prepared by the Innovative Pavement Research Foundation under the Airport Concrete Pavement Technology Program. Funding is provided by the Federal Aviation Administration under Cooperative Agreement Number 01-G-002. Dr. Satish Agrawal is the Manager of the FAA Airport Technology R&D Branch and the Technical Manager of the Cooperative Agreement. Mr. Jim Lafrenz, P.E., is the Program Director for the IPRF. The Innovative Pavement Research Foundation and the Federal Aviation Administration thank the Technical Panel that willingly gave their expertise and time for the development of this report. They were responsible for the oversight and the technical direction. The names of those individuals on the Technical Panel follow.
Hank Keiper, P.E. The SEFA Group Kevin MacDonald, Ph.D., P.E. Cemstone John F. Walz, P.E. Reynolds, Smith and Hill Matthew J. Zeller, P.E. Concrete Paving Association of Minnesota
The contents of this report reflect the views of the authors who are responsible for the facts and the accuracy of the data presented within. The contents do not necessarily reflect the official views and policies of the Federal Aviation Administration. This report does not constitute a standard, specification, or regulation.

Proportioning Fly Ash as Cementitious Material in Airfield Pavement Concrete Mixtures
ii
ACKNOWLEDGEMENTS This report was prepared by the following project team members: Principal Investigators
• Dr. Chetana Rao, ARA • Mr. Richard D. Stehly, AET
Contributing Author
• Mr. Ahmad Ardani, formerly of ARA
The project team would like to acknowledge the invaluable insights and guidance of the IPRF Program Manager, Mr. Jim Lafrenz, and the members of the Technical Panel. In addition, the contributions of the following individuals are recognized and greatly appreciated:
• Dr. P.K. Mehta, Emeritus Professor, University of California, Berkeley, for his technical inputs and review.
• Dr. Suri Sadasivam of ARA, who assisted with reviewing literature. • Mr. Mark Stanley of ARA, who developed the software program for the catalog. • Mr. Adam Brewer of AET, who performed the laboratory tests related to freeze-
thaw durability, petrographic examination, and scaling resistance. • Mr. Joseph Johnson of AET, who performed the calorimetry tests assisted with
data collection. • Mr. David Neal of Boral Ash, Mr. Mac Shaffer of Transit Mix Aggregate in
Colorado Springs, Mr. Mike Sheehan of Front Range Aggregate in Colorado Springs, Mr. Kevin Kane and Mr. Rick Archuletta of Holcim Cement, Mr. Dean Rue of CH2MHill, and Mr. Robert Seghetti of Acme Concrete Paving, Inc., who provided materials and/or materials-related information used in the laboratory study and catalog validation.
Information was provided by several airport authorities and contractors whose participation and support are greatly appreciated.

Proportioning Fly Ash as Cementitious Material in Airfield Pavement Concrete Mixtures
Applied Research Associates, Inc. iii
TABLE OF CONTENTS
ACKNOWLEDGEMENTS ................................................................................................ ii
CHAPTER 1. INTRODUCTION ...................................................................................... 1
1.1 Background .................................................................................................................. 1 Use of Fly Ash as a Supplementary Cementitious Material ........................................... 2 Fly Ash for Sustainable Development of the Concrete Industry .................................... 3
1.2 Research Objectives ..................................................................................................... 4
1.3 Technical Approach ..................................................................................................... 4
1.4 Research Products ........................................................................................................ 5
1.5 Definition of Key Terms .............................................................................................. 6
CHAPTER 2. LITERATURE REVIEW ........................................................................... 7
2.1 Sources of Fly Ash ....................................................................................................... 7
2.2 Chemical and Mineralogical Characteristics of Fly Ash ............................................. 7
2.3 Granulometric Characteristics of Fly Ash ................................................................. 10
2.4 Classifications of Fly Ash .......................................................................................... 12 2.4.1 Unites States Standards ....................................................................................... 12 2.4.2 Canadian Standards ............................................................................................. 13 2.4.3 European Standards ............................................................................................ 14 2.4.4 Japanese Standards .............................................................................................. 15 2.4.5 Notable Studies of Relevance to Fly Ash Classification .................................... 16
2.5 Properties of Fresh Concrete Containing Fly Ash ..................................................... 17 2.5.1 Workability and Water Demand ......................................................................... 17 2.5.2 Set Time .............................................................................................................. 18 2.5.3 Air Content.......................................................................................................... 19 2.5.4 Plastic and Autogeneous Shrinkage .................................................................... 19
2.6 Early Age Properties of Fly Ash Concrete ................................................................ 20 2.6.1 Strength Gain Rate .............................................................................................. 20
2.7 Durability Aspects of Fly Ash Concrete .................................................................... 21 2.7.1 Freeze-Thaw Resistance ..................................................................................... 21 2.7.2 Permeability ........................................................................................................ 22 2.7.3 Carbonation ......................................................................................................... 22 2.7.4 Sulfate Resistance ............................................................................................... 23 2.7.5 Alkali Silica Reaction ......................................................................................... 26
2.8 Summary of Findings from Literature Review .......................................................... 27

Proportioning Fly Ash as Cementitious Material in Airfield Pavement Concrete Mixtures
iv
TABLE OF CONTENTS, CONTINUED
CHAPTER 3. DEVELOPMENT OF GUIDELINES ...................................................... 29
3.1 Introduction ................................................................................................................ 29 Scope of the Mix Optimization Catalog ....................................................................... 29 Key Considerations in Developing Recommendations ................................................ 29
3.2 Framework for Mix Optimization Catalog ................................................................ 31 3.2.1 Project Conditions ............................................................................................... 31
Deicer Exposure ........................................................................................................ 32 Aggregate Reactivity ................................................................................................ 32 Cement Type ............................................................................................................. 33 Opening Time Requirements .................................................................................... 33 Paving Weather ......................................................................................................... 34
3.2.2 Recommendations for Fly Ash Properties .......................................................... 34 Calcium Oxide .......................................................................................................... 34 Fineness..................................................................................................................... 35 Loss on Ignition ........................................................................................................ 35 Recommended Substitution Level ............................................................................ 35
3.2.3 Recommendations for Admixtures and Curing .................................................. 35 Admixtures ................................................................................................................ 36 Curing Practices ........................................................................................................ 36
3.2.4 Recommendations for Standard Tests ................................................................ 36 Fresh Concrete Tests ................................................................................................. 37 Hardened Concrete Tests .......................................................................................... 37 Mortar Bar Tests ....................................................................................................... 38 Materials Review ...................................................................................................... 38
3.2.5 Sulfate Check ...................................................................................................... 38
3.3 Using the Mix Design Optimization Catalog ............................................................. 39 3.3.1 Using the Catalog ................................................................................................ 39 3.3.2 Mix Optimization Using the Catalog .................................................................. 45
CHAPTER 4. AIRPORT PROJECT CASE STUDIES ................................................... 51
4.1 Selection of Case Studies ........................................................................................... 51
4.2 Details of Case Studies .............................................................................................. 51 4.2.1 Airport A – Airport in Colorado with Good Performance .................................. 52 4.2.2 Airport B – Airport in Colorado with Poor Performance ................................... 55 4.2.3 Airport C – Airport in Washington ..................................................................... 57 4.2.4 Airport D – Airport in California ........................................................................ 58 4.2.5 Airport E – Airport in Alaska ............................................................................. 59 4.2.6 Airport F – Airport in Arizona ............................................................................ 61
4.3 Additional Case Studies of Projects with High Volume Fly Ash .............................. 63 4.3.1 Project G in North America ................................................................................ 64

Proportioning Fly Ash as Cementitious Material in Airfield Pavement Concrete Mixtures
Applied Research Associates, Inc. v
TABLE OF CONTENTS, CONTINUED 4.3.2 Projects H, I, and J in Asia .................................................................................. 64
4.4 Conclusions from Project Case Studies Validation ................................................... 69
CHAPTER 5. LABORATORY TESTING ..................................................................... 71
5.1 Introduction ................................................................................................................ 71
5.2 Laboratory Test Plan .................................................................................................. 71 5.2.1 Mix Design Details ............................................................................................. 75 5.2.2 Standard Tests Included in Test Plan .................................................................. 77
5.3 Test Results ................................................................................................................ 77 5.3.1 Fresh Concrete Tests ........................................................................................... 77 5.3.2 Strength Tests...................................................................................................... 79 5.3.3 Durability Tests ................................................................................................... 81
Mortar Bar Expansion Test ....................................................................................... 81 Freeze-Thaw Test ...................................................................................................... 83 Scaling Test ............................................................................................................... 84
5.3.4 Validation of the Mix Optimization Catalog from Laboratory Tests ................. 84 Mix 1 and Mix 2 ....................................................................................................... 84 Mix 3 and Mix 4 ....................................................................................................... 86 Mix 5 and Mix 6 ....................................................................................................... 86 Mix 7 ......................................................................................................................... 88 Mix 8 ......................................................................................................................... 89 Mix 9 ......................................................................................................................... 90
5.4 Semi-Adiabatic Calorimetry – A Tool in Optimizing Fly Ash Content .................... 90 5.4.1 Introduction ......................................................................................................... 90 5.4.2 Semi-adiabatic Calorimetry and its Applications ............................................... 90
Applications of Calorimetry ..................................................................................... 93 5.4.3 Prediction of Set Times and Flexural Strength for Mixes 1 through 7 ............... 94
Prediction of Strength and Set Times Using Thermal History ............................... 101 5.4.4 Conclusions from Calorimetry Data Evaluations ............................................. 113
5.5 Conclusions from Laboratory Test Validations ....................................................... 113
CHAPTER 6. SUMMARY, RECOMMENDATIONS, AND CONCLUSIONS ......... 115
6.1 Summary .................................................................................................................. 115
6.2 Recommendations .................................................................................................... 117 Verification and Validation ......................................................................................... 120
6.3 Conclusions .............................................................................................................. 120

Proportioning Fly Ash as Cementitious Material in Airfield Pavement Concrete Mixtures
vi
TABLE OF CONTENTS, CONTINUED
REFERENCES ............................................................................................................... 121
Relevant ASTM Tests ..................................................................................................... 121 Fly Ash Tests .............................................................................................................. 121 Tests for Fresh Concrete ............................................................................................. 121 Tests of Strength ......................................................................................................... 121 Tests for Concrete Durability ...................................................................................... 122
References in Report ....................................................................................................... 123
Appendix – Petrographic Analysis of Cores Extracted from Airfield Pavements under Case Studies A and B .......................................................................................................... 1

Proportioning Fly Ash as Cementitious Material in Airfield Pavement Concrete Mixtures
Applied Research Associates, Inc. vii
LIST OF TABLES Table 1. Oxide analyses of some North American fly ashes (Malhotra & Mehta, 1996;
2008) ................................................................................................................................... 9
Table 2. Chemical composition of fly ash from various coal sources in the U.S. and for
portland cement (Frohnsdorff & Clifton, 1981; Aïtcin, 2008) ........................................... 9
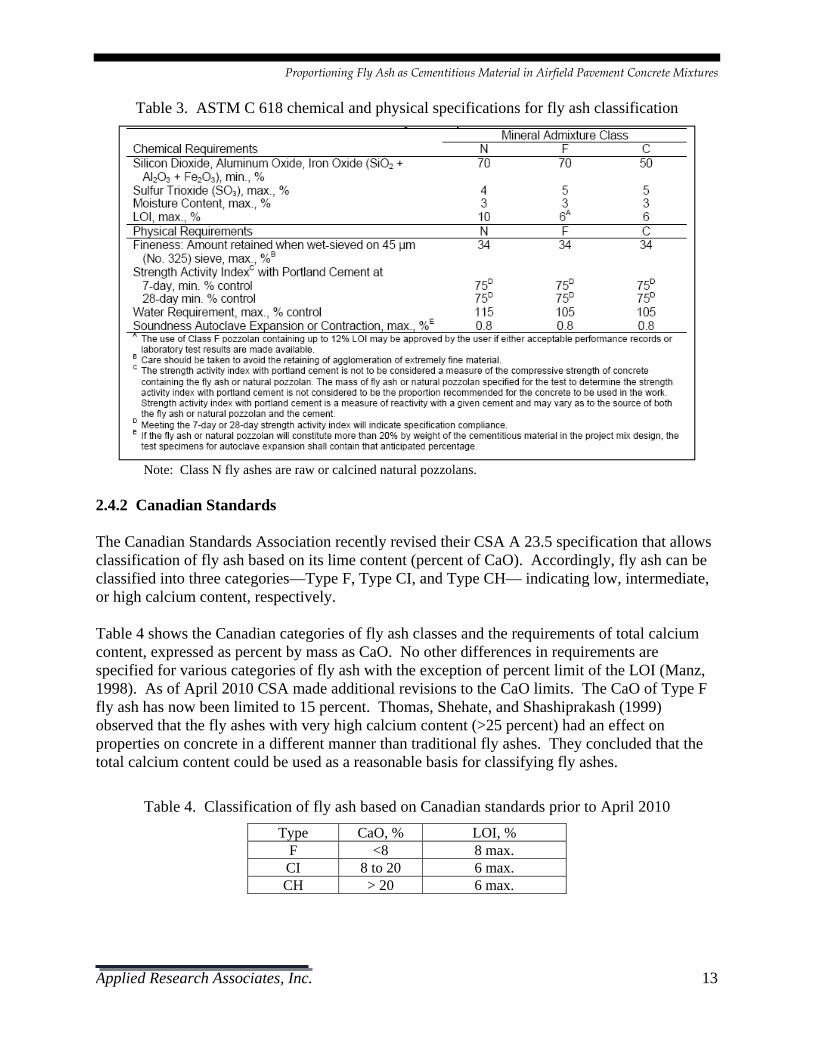
Table 3. ASTM C 618 chemical and physical specifications for fly ash classification ... 13
Table 4. Classification of fly ash based on Canadian standards prior to April 2010 ....... 13
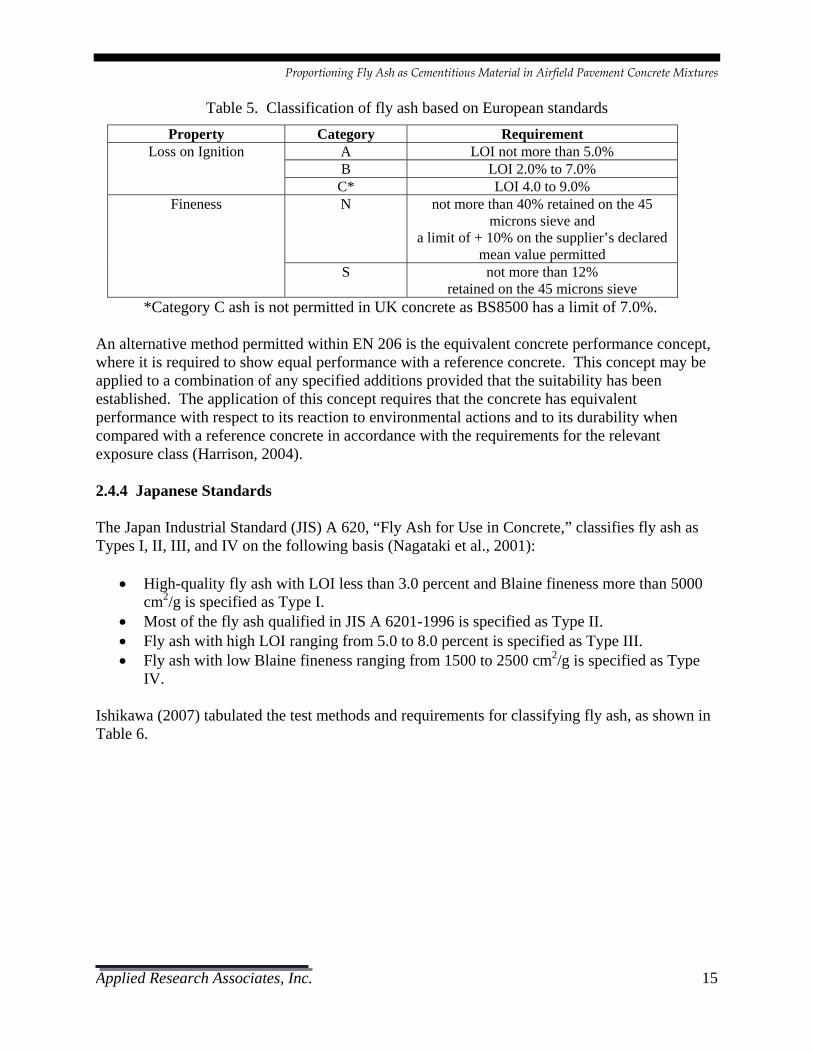
Table 5. Classification of fly ash based on European standards ...................................... 15
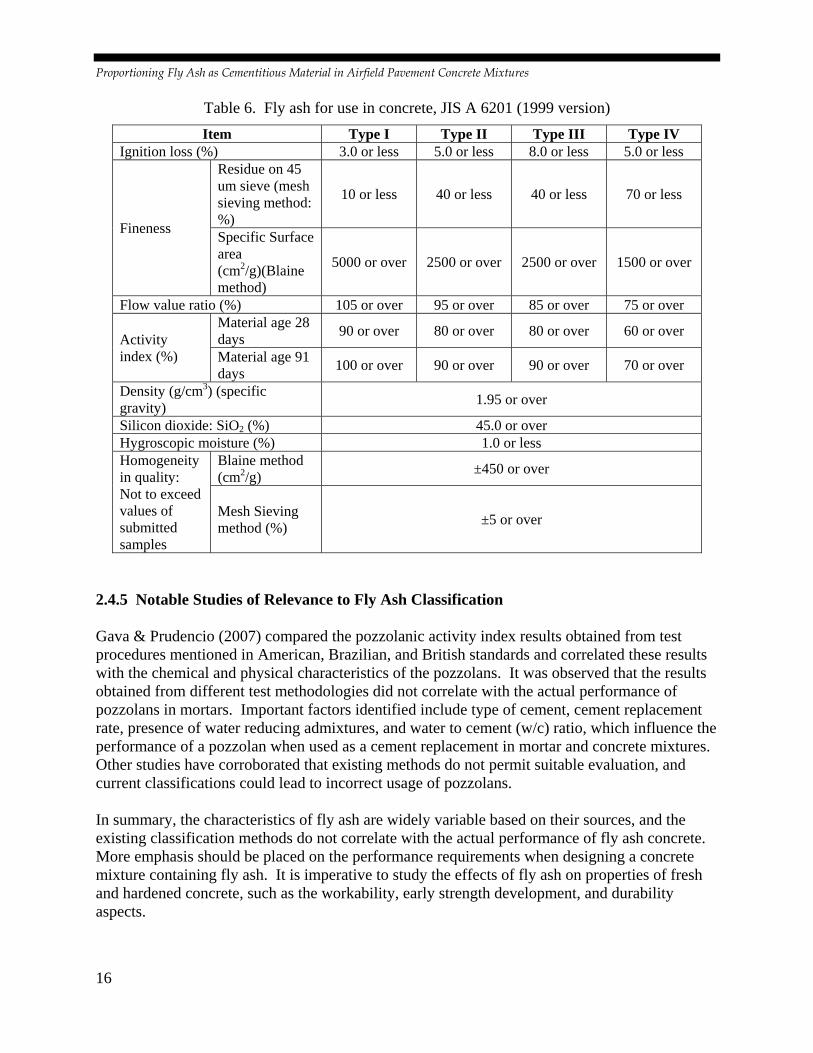
Table 6. Fly ash for use in concrete, JIS A 6201 (1999 version) ..................................... 16
Table 7. Proposed limits of R values at 25 percent replacement ..................................... 25
Table 8. Sample report of fly ash testing which is a reference to use mix optimization
catalog ............................................................................................................................... 30
Table 9. Fly ash recommendations for sulfate exposure .................................................. 39
Table 10. Criteria to determine feasible range of fly ash replacement for a given set of
materials ............................................................................................................................ 48
Table 11. Mix design for case study project A and properties of the materials used. ..... 53
Table 12. Original mix design intended for airfield in Arizona ...................................... 62
Table 13. Mix design for high volume fly ash mix used in the lower lift and the
conventional fly ash concrete mix used in the upper lift (Source SHRP Project R 21,
Ongoing) ........................................................................................................................... 65
Table 14. Details for projects H and I that used high volume fly ash (Malhotra & Mehta,
2008) ................................................................................................................................. 67
Table 15. Summary of mixes included in the revised test plan ....................................... 72
Table 16. Description of materials used in the laboratory test plan ................................. 74
Table 17. Mix designs for the laboratory test plan .......................................................... 75
Table 18. Tests proposed for the various mixes in the revised laboratory test plan ........ 76
Table 19. Summary of fresh concrete tests for all mixes ................................................. 78
Table 20. ASTM C 1567 test results for all mix designs ................................................. 82
Table 21. Reactivity tests for mix 8 at 14 days ................................................................ 83
Table 22. Freeze-thaw results for mix 3 ........................................................................... 83

Proportioning Fly Ash as Cementitious Material in Airfield Pavement Concrete Mixtures
viii
LIST OF TABLES, CONTINUED
Table 23. Scaling test results for mix 3 ............................................................................ 84
Table 24. Set times expressed as percentage of time taken to reach maximum
temperature ..................................................................................................................... 103
Table 25. Model coefficients for the prediction of flexural strength and set time ......... 108
Table 26. Summary of predicted and measured flexural strengths ................................ 109
Table 27. Summary of predicted and measured set times ............................................. 110
Table 28. Project-specific conditions required for using the mix optimization catalog 117

Proportioning Fly Ash as Cementitious Material in Airfield Pavement Concrete Mixtures
Applied Research Associates, Inc. ix
LIST OF FIGURES Figure 1. Fly ash is a by-product from coal fired power plants [Courtesy SEFA Group] . 7
Figure 2. Distribution of calcium content in North American fly ash (Thomas, 2007) .. 10
Figure 3. Relationship between fly ash fineness and 28 day strength (Dhir et al., 1998) 11
Figure 4. Comparison of ASTM and CSA specifications for North American fly ash
sources (Thomas, 2007) .................................................................................................... 14
Figure 5. Effect of the proportion and particle size of fly ash on water demand for equal
workability of concrete (Owen, 1979) .............................................................................. 18
Figure 6. Calcium oxide-alumina-silica ternary phase diagram (Tikalsky & Carrasquillo,
1993) ................................................................................................................................. 25
Figure 7. Mix optimization catalog recommendations for project with deicer exposure,
reactive aggregates, high alkali cement, non-critical opening time, and moderate paving
weather .............................................................................................................................. 41
Figure 8. Mix optimization catalog recommendations for project with deicer exposure,
reactive aggregates, high alkali cement, quick opening time, and moderate paving
weather .............................................................................................................................. 42
Figure 9. Mix optimization catalog recommendations for project with deicer exposure,
reactive aggregates, low alkali cement, quick opening time, and moderate paving weather
........................................................................................................................................... 43
Figure 10. Mix optimization catalog recommendations for project with no deicer
exposure, non-reactive aggregates, low alkali cement, non-critical opening time, and
moderate paving weather .................................................................................................. 44
Figure 11. Steps involved in the mix optimization procedure ......................................... 46
Figure 12. States with airport projects selected for case studies ...................................... 52
Figure 13. Mix optimization catalog recommendations for case study project A in
Colorado ............................................................................................................................ 54
Figure 14. Surface condition of pavement in airport B ................................................... 55
Figure 15. Mix optimization catalog recommendations for case study project B in
Colorado ............................................................................................................................ 56
Proportioning Fly Ash as Cementitious Material in Airfield Pavement Concrete Mixtures
x
LIST OF FIGURES, CONTINUED
Figure 16. Mix optimization catalog recommendations for case study project C in
Washington ....................................................................................................................... 58
Figure 17. Mix optimization catalog recommendations for case study project D in
California .......................................................................................................................... 60
Figure 18. Mix optimization catalog recommendations for case study project E in Alaska
........................................................................................................................................... 61
Figure 19. Mix optimization catalog recommendations for case study project F in
Arizona .............................................................................................................................. 63
Figure 20. Mix optimization catalog recommendations for paving projects in North
America that used high volume fly ash............................................................................. 66
Figure 21. Mix optimization catalog recommendations for paving projects in Asia that
used high volume fly ash .................................................................................................. 68
Figure 22. States represented in the materials used in the laboratory test program; note
that four mixes tested represented materials from Colorado and two mixes were from
Florida ............................................................................................................................... 71
Figure 23. Parameters covered in the laboratory test plan ............................................... 73
Figure 24. Strength gain for mix 1 – cool weather paving for quick opening ................. 79
Figure 25. Strength gain for mix 3 – hot weather paving for quick opening ................... 79
Figure 26. Strength gain for mix 5 – moderate weather paving for non-critical opening 80
Figure 27. Strength gain for mix 6 - moderate weather paving for non-critical opening 80
Figure 28. Strength gain for mix 7 – moderate weather paving for non-critical opening 81
Figure 29. Visual examination of the freeze thaw samples used for mix 3 ..................... 84
Figure 30. Mix optimization catalog recommendations for Mix 1 .................................. 85
Figure 31. Mix optimization catalog recommendation for mixes 5 and 6 with non-critical
opening time requirement ................................................................................................. 87
Figure 32. Mix optimization catalog recommendation for mixes 5 and 6 with early
opening time requirement ................................................................................................. 88
Figure 33. Mix optimization catalog recommendation for mix 7 .................................... 89
Figure 34. Sample semi-adiabatic temperature monitoring data plot .............................. 91

Proportioning Fly Ash as Cementitious Material in Airfield Pavement Concrete Mixtures
Applied Research Associates, Inc. xi
LIST OF FIGURES, CONTINUED
Figure 35. Temperature history and set time for mix 1 at 30 percent fly ash replacement
........................................................................................................................................... 92
Figure 36. Maturity in mix 1 with 30 percent fly ash replacement .................................. 92
Figure 37. Effect of fly ash replacement for mix 1 .......................................................... 93
Figure 38. Effect of fly ash replacement for mix 3 .......................................................... 94
Figure 39. Effect of fly ash replacement for mix 5 .......................................................... 95
Figure 40. Effect of fly ash replacement for mix 6 .......................................................... 96
Figure 41. Effect of fly ash replacement for mix 7 .......................................................... 97
Figure 42. Adiabatic temperature rise vs. fly ash replacement level for mix 1 ............... 98
Figure 43. Adiabatic temperature rise vs. fly ash replacement level for mix 3 ............... 98
Figure 44. Adiabatic temperature rise vs. fly ash replacement level for mix 5 and mix 6
........................................................................................................................................... 99
Figure 45. Adiabatic temperature rise vs. fly ash replacement level for mix 7 ............... 99
Figure 46. Set time vs. fly ash content in mix 1 ............................................................ 100
Figure 47. Maximum temperature from calorimetry vs. set time in mix 1 .................... 100
Figure 48. Time at maximum temperature from calorimetry vs. set time in mix 1 ....... 101
Figure 49. Good correlation between final set time and maturity measured at final set
time ................................................................................................................................. 102
Figure 50. Correlation between final set time and time at maximum first derivative ... 102
Figure 51. Poor correlation between final set time vs. maturity at time of maximum first
derivative......................................................................................................................... 104
Figure 52. Poor correlation between final set time vs. maturity measured at the time of
peak temperature for all mixes ........................................................................................ 105
Figure 53. Poor correlation between 28-day flexural strength vs. maturity at time of final
set .................................................................................................................................... 105
Figure 54. Good correlation between temperature rise and 7-day flexural strength ..... 106
Figure 55. Good correlation between temperature rise and 28-day flexural strength ... 106
Figure 56. Good correlation between linear slope and 7-day flexural strength ............. 107
Figure 57. Good correlation between linear slope and 28-day flexural strength ........... 107
Figure 58. Predicted vs. measured 7-day flexural strength for all mixes ...................... 111

Proportioning Fly Ash as Cementitious Material in Airfield Pavement Concrete Mixtures
xii
LIST OF FIGURES, CONTINUED
Figure 59. Predicted vs. measured 28-day flexural strength for all mixes .................... 111
Figure 60. Predicted vs. measured initial set time for all mixes .................................... 112
Figure 61. Predicted vs. measured final set time for all mixes ...................................... 112

Proportioning Fly Ash as Cementitious Material in Airfield Pavement Concrete Mixtures
Applied Research Associates, Inc. 1
CHAPTER 1. INTRODUCTION
1.1 BACKGROUND The Federal Aviation Administration (FAA) Advisory Circular (AC) 150/5370-10E (USDOT FAA, 2009) provides guidelines and specifications for materials and methods used in the construction of airports. Item P-501 addresses portland cement concrete (PCC) pavement, providing guidance on materials, construction methods, material acceptance, contractor quality control (QC), method of measurement, and basis of payment. The current specification, while emphasizing the use of locally available materials, provides general requirements for the selection and proportioning of materials for concrete mixes and details the expected performance requirements. With reference to the current study, Item P-501 gives a critical consideration for mitigating alkali silica reaction (ASR) problems by setting limitations on aggregate reactivity and cement alkalinity in the selection of materials. Fly ash is expected to meet the requirements of ASTM C 618 Class C, F, or N, and the loss of ignition (LOI) is limited to 6 percent for Classes F and N. Additionally, the Class C fly ash materials are disallowed for projects with ASR potential. Item P-501 refers to the Portland Cement Association's (PCA) manual for mix design (PCA, 2008) procedures but provides general proportioning and strength requirements. A minimum 28-day flexural strength of 600 psi is required for most projects. However, for projects with critical opening time requirements, a strength requirement for the designated age is specified. A minimum cementitious material content of 564 lb/yd3 and maximum water to cementitious materials content of 0.45 is specified. Fly ash is permitted for partial replacement of cement and can range between 15 and 30 percent by weight of the total cementitious content. If combined with ground granulated blast furnace slag, the replacement rate may not exceed 10 percent. The Unified Facilities Guide Specifications (UFGS) for concrete airfields and other heavy-duty pavements (USACE, 2008) uses the ASTM C 618 classification for fly ash. It also suggests the use of fly ash replacement for cementitious materials when sulfate bearing soils or water are encountered along with the use of Type II or V cements. It disallows the use of Class C fly ash as well as any fly ash with an LOI exceeding 3 percent. For ASR mitigation, the calcium oxide content of the fly ash and the total equivalent alkali content are limited to 13 and 3 percent, respectively. Fly ash replacement levels are limited to a maximum of 35 percent and to a minimum level of 15, 20, or 25 percent for sums of principal oxides exceeding 70, 80, and 90 percent. Strength and mix design requirements are comparable to the P-501 specifications. Neither specification details the basis for the fly ash replacement requirements. Studies have demonstrated that equal replacement levels of fly ash from different sources do not produce comparable levels of benefits when combined with different local materials, or when construction practices and paving conditions change. Within the confines of the P-501 or UFGS specifications, fly ashes with a wide range of mineralogical, chemical, and granulometric properties can be used in a concrete mix design that can bear little or no impact on the
Proportioning Fly Ash as Cementitious Material in Airfield Pavement Concrete Mixtures
2
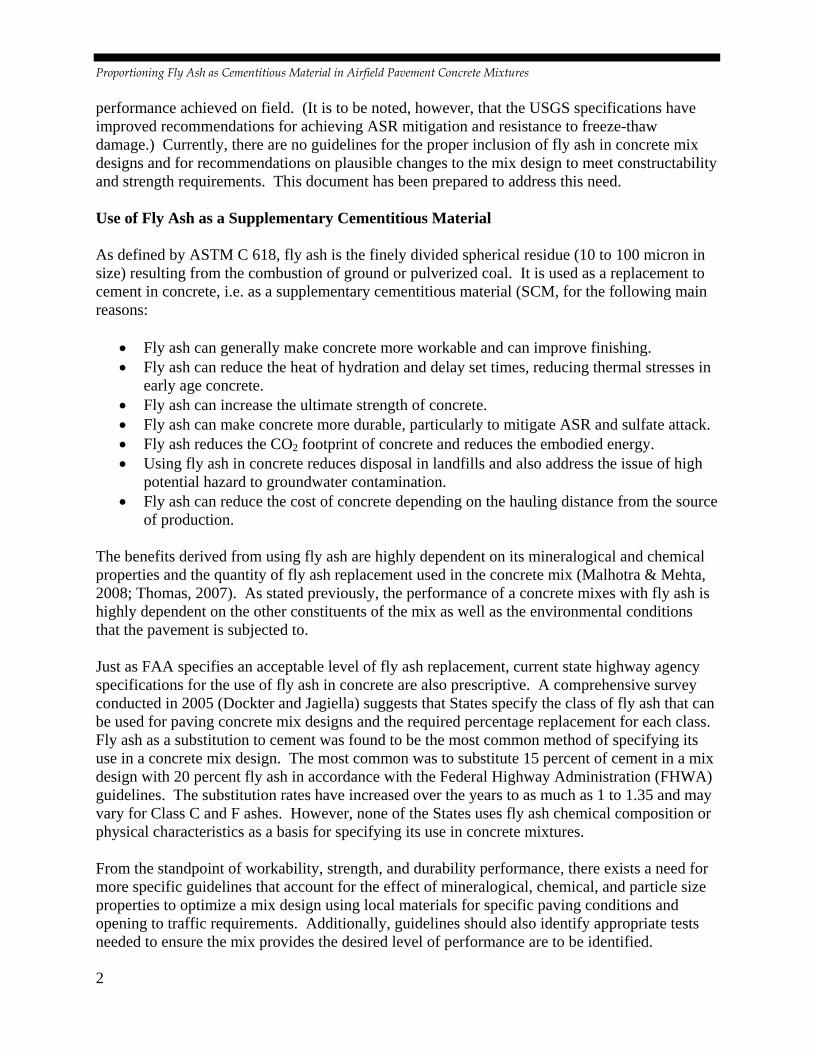
performance achieved on field. (It is to be noted, however, that the USGS specifications have improved recommendations for achieving ASR mitigation and resistance to freeze-thaw damage.) Currently, there are no guidelines for the proper inclusion of fly ash in concrete mix designs and for recommendations on plausible changes to the mix design to meet constructability and strength requirements. This document has been prepared to address this need. Use of Fly Ash as a Supplementary Cementitious Material As defined by ASTM C 618, fly ash is the finely divided spherical residue (10 to 100 micron in size) resulting from the combustion of ground or pulverized coal. It is used as a replacement to cement in concrete, i.e. as a supplementary cementitious material (SCM, for the following main reasons:
• Fly ash can generally make concrete more workable and can improve finishing. • Fly ash can reduce the heat of hydration and delay set times, reducing thermal stresses in
early age concrete. • Fly ash can increase the ultimate strength of concrete. • Fly ash can make concrete more durable, particularly to mitigate ASR and sulfate attack. • Fly ash reduces the CO2 footprint of concrete and reduces the embodied energy. • Using fly ash in concrete reduces disposal in landfills and also address the issue of high
potential hazard to groundwater contamination. • Fly ash can reduce the cost of concrete depending on the hauling distance from the source
of production. The benefits derived from using fly ash are highly dependent on its mineralogical and chemical properties and the quantity of fly ash replacement used in the concrete mix (Malhotra & Mehta, 2008; Thomas, 2007). As stated previously, the performance of a concrete mixes with fly ash is highly dependent on the other constituents of the mix as well as the environmental conditions that the pavement is subjected to. Just as FAA specifies an acceptable level of fly ash replacement, current state highway agency specifications for the use of fly ash in concrete are also prescriptive. A comprehensive survey conducted in 2005 (Dockter and Jagiella) suggests that States specify the class of fly ash that can be used for paving concrete mix designs and the required percentage replacement for each class. Fly ash as a substitution to cement was found to be the most common method of specifying its use in a concrete mix design. The most common was to substitute 15 percent of cement in a mix design with 20 percent fly ash in accordance with the Federal Highway Administration (FHWA) guidelines. The substitution rates have increased over the years to as much as 1 to 1.35 and may vary for Class C and F ashes. However, none of the States uses fly ash chemical composition or physical characteristics as a basis for specifying its use in concrete mixtures. From the standpoint of workability, strength, and durability performance, there exists a need for more specific guidelines that account for the effect of mineralogical, chemical, and particle size properties to optimize a mix design using local materials for specific paving conditions and opening to traffic requirements. Additionally, guidelines should also identify appropriate tests needed to ensure the mix provides the desired level of performance are to be identified.
Proportioning Fly Ash as Cementitious Material in Airfield Pavement Concrete Mixtures
Applied Research Associates, Inc. 3
Fly Ash for Sustainable Development of the Concrete Industry Carbon dioxide (CO2) emissions are at the highest levels in recorded history. CO2 concentrations are estimated to have increased from 315 ppm (mg/L) in 1950 to the current levels of about 390 ppm according to the National Oceanographic and Atmospheric Administration, with annual global output of over 29,000 million tons. Current rates of increase in CO2 levels are at an alarming level, and there is widespread recognition of the need for immediate actions to control irreversible and large-scale damage to humanity and the planet. Portland cement is the most common building material worldwide. Currently, production is about 2.5 billion tons/yr. In the cement clinker manufacturing process, direct release of CO2 occurs from two sources. The first is from the decomposition of the principal raw material, calcium carbonate, amounting to about 0.53 ton of CO2/ton of clinker. The second source is from the combustion of fossil fuels amounting to about 0.37 ton of CO2/ton of clinker. Therefore, nearly a ton of CO2 is produced for each ton of cement. Over 7 percent of the total human-produced CO2 is from the production of cement, and the potential for cement replacement with fly ash is a big step in the direction of reducing greenhouse gas emissions. The use of fly ash reduces environmental impacts in two ways: it diverts coal power generation residue from landfills to beneficial use, and it reduces the use of cement and hence cement production’s impact on CO2 emissions. Additionally, because fly ash is simply a byproduct of coal burned for electricity generation, no process energy is attributed to fly ash. According to the annual survey results published by the American Coal Ash Association (ACAA, 2009), for the year 2009 the following statistics are offered:
• 63 million tons of fly ash were produced. • 25 million tons were used in various applications. • 10 million tons were used in concrete and concrete products, and about 2.5 million tons
were used in blended cements and raw feed for clinker. Fly ash is one of several coal combustion residues (CCRs). CCRs also contain contaminants such as mercur, cadmium, and arsenic, which can pose a threat to the environment and public health in general, particularly through leaching into ground water. Concerns have been raised by environmental groups and private citizens, prompting the Environmental Protection Agency (EPA) to propose two approaches for regulating the disposal of CCRs under the Resource Conservation and Recovery Act (RCRA). These regulations proposed are under Subtitle C and Subtitle D, which have identical engineering requirements but differ in enforcement and implementation. The rule was published in the Federal Register in June 2010 (75 FR 35123) and included a comment period until November 2010. The EPA recognizes that the use of fly ash in concrete provides significant environmental benefits and was cautious about regulatory decisions that limit beneficial uses. Therefore, even after the proposed ruling and comment period, the EPA has not modified the existing Bevill exemption for beneficial use. The Beville exemption, commonly referred to as the Beville exclusion to RCRA, remains in effect for the beneficial use of CCRs, which includes the use of fly ash in concrete. The Beville exclusion has been described by the EPA as follows
Proportioning Fly Ash as Cementitious Material in Airfield Pavement Concrete Mixtures
4
“The Beville In October, 1980, RCRA was amended by adding section 3001(b)(3)(A)(ii), known as the Bevill exclusion, to exclude "solid waste from the extraction, beneficiation, and processing of ores and minerals" from regulation as hazardous waste under Subtitle C of RCRA. This exclusion held pending completion of a study and a Report to Congress, required by section 8002 (f) and (p), and pending a determination by the EPA Administrator either to promulgate regulations under Subtitle C or to declare such regulations unwarranted.”
Currently, there exist no changes to federal regulations that limit the use of fly ash in concrete. 1.2 RESEARCH OBJECTIVES This project addresses issues involved in the selection of fly ash source and replacement level to optimize a concrete mix for airfield paving operations. The goal was to identify issues (or material and project parameters) that need to be considered for the use of fly ash in optimum quantities without affecting the ability to pave as well as the long-term performance of the concrete pavement. The study was designed to provide airfield pavement contractors and concrete materials engineers systematic guidelines for optimizing mixes incorporating fly ash and local materials to obtain the desired level of workability, finishing and placement properties, strength, performance, durability, and cost-effectiveness. The main objectives, as stated in the proposal and reiterated here, are to:
• Define the protocol to establish the beneficial use quantity of fly ash used as a replacement for cement, which provides the flexibility to use local materials.
• Establish critical elements to optimizing a concrete mix that incorporates fly ash to meet workability, durability, finish, cost, and strength requirements.
• Define the threshold quantity for the replacement of cement when using fly ash. • Develop a stand-alone user guide that provides information to the user about the myths
and benefits of using fly ash, construction difficulties that using fly ash can create and remedial measures when problems do occur.
1.3 TECHNICAL APPROACH A material characterization approach is used to select the optimal fly ash replacement level, and a laboratory testing approach is used to verify whether the mix has the potential to provide the desired construction quality and performance relative to the project environment. This methodology is in line with ACI 232.2R, Use of Fly Ash in Concrete, which notes that the most effective method to evaluate the performance of a given fly ash in concrete and establish proper mixture proportions for a specific application is through a trial batch and testing program. Therefore, the recommendations provided by this study consider the quality of the fly ash based on the mineralogy and chemical composition to select an optimal range of fly ash replacement in the trial batches. In addition, the recommendations are based on other project-specific variables that equally influence performance, including aggregate type, cement type, aggregate reactivity,

Proportioning Fly Ash as Cementitious Material in Airfield Pavement Concrete Mixtures
Applied Research Associates, Inc. 5
paving weather, opening to traffic requirements, exposure to deicers, and potential for sulfate attack. Appropriate tests are recommended to verify the performance of the trial batch mixes to select the most feasible fly ash replacement level. At the initiation of the project, an extensive literature review was performed to understand the properties of fly ash, the effects of using fly ash in concrete mixtures, and the physical and chemical mechanisms that cause them. Preliminary guidelines were developed based on findings from this literature review, combined with empirical information synthesized from a review of best practices in the nation. These guidelines were evaluated, validated, and revised in two subsequent phases of project evaluation. The first set of revisions was based on case studies of projects that used fly ash in the concrete pavement and that showed both good and poor performance. The second set of revisions was based on a laboratory test plan conducted using wide-ranging materials from various geographic locations. The guidelines are presented in a software tool convenient for selecting project conditions to determine the optimum fly ash replacement level. 1.4 RESEARCH PRODUCTS This research effort has produced three documents:
• Research report. • Handbook or user guide. • Catalog for recommendation on fly ash replacement for project-specific conditions.
This document is the Research Report that documents the research effort. This report contains 7 chapters. The current chapter, Chapter 1, presents an introduction to the study. Chapter 2 is the literature review that describes previous work on concrete incorporating fly ash as pertinent to this study. Chapter 3 summarizes the basis for the development of the guidelines under this study and the formulation of the catalog. Chapter 4 provides case studies of projects that used fly ash in the concrete pavement and that showed both good and poor performance. Chapter 5 explains the laboratory test plan and discusses the results from the tests, particularly in the context of how the results were relevant to the catalog. Chapter 6 provides the summary, recommendations, and conclusions for this study. A list of references is included at the end of the report. Results of a petrographic examination of cores from two airfields are included in the appendix. The final recommendations from this study are presented in the handbook and it includes information that will help the user understand and apply the tenets of using fly ash. The guide also provides supplemental information on projects that have utilized mix designs to either address a specific problem or that resulted in unforeseen problems due to incompatibility between mix components and site conditions. The catalog is essentially the implementable product from this study and provides the most likely range(s) of fly ash replacement levels, mix design components/admixtures, and curing practices for project-specific conditions. It also contains the standard tests that need to be performed to
Proportioning Fly Ash as Cementitious Material in Airfield Pavement Concrete Mixtures
6
evaluate the feasibility of using the recommended replacement level. Project-specific conditions are defined by:
• Deicer exposure – Yes/No. • Aggregate reactivity – Reactive/Non-reactive Aggregates. • Cement type – High Alkali/Low Alkali Cement. • Opening time requirements – Critical/Non-critical. • Paving weather – Cool/Moderate/Hot.
1.5 DEFINITION OF KEY TERMS This report makes several references to fly ash replacement and fly ash substitution. These terms are not used synonymously. Fly ash replacement is the fly ash content in the mix, which represents a given percentage of the total cementitious material in the mix, not the total cement content in the mix. For example, for a baseline mix with 550 lb/yd3 of cement, a 20 percent fly ash replacement results in using a cement content of 440 lb/yd3 supplemented with 110 lb/yd3 of fly ash. Fly ash replacement results in a reduction of cement content but does not change the total cementitious content of the mix. Fly ash substitution, on the other hand, refers to the removal of a certain amount of cement combined with a rate of addition of fly ash. For example, the cement content may be reduced from 550 lb/yd3 to 440 lb/yd3 of cement and supplemented with of 138 lb/yd3 of fly ash when a substitution rate of 1 to 1.25 is used. Fly ash substitution results in a reduction of cement content and may change the total cementitious content of the mix. While mix optimization, in the context of this report, typically involves evaluating various percent replacements of a given fly ash and/or evaluating various fly ash sources, it does not limit the total cement content that may be adjusted during the iterative process to meet specification requirements. P-501 specifies only a minimum total cementitious content, not a maximum cementitious content. These guidelines provide a contractor/producer the utmost ability to be innovative with mix designs and still vary the total cementitious content as necessary to meet project performance requirements. However, increasing the total cement content of the mix might produce other undesirable effects; increasing cement is not the ultimate goal of the mix optimization process. Finally, the mixes considered in the development of the guidelines are limited to those that incorporate cement and only fly ash as an SCM. The recommendations do not apply to ternary mixes or mixes with other SCMs such as slag, silica fume, and blended cements.

Proportioning Fly Ash as Cementitious Material in Airfield Pavement Concrete Mixtures
Applied Research Associates, Inc. 7
CHAPTER 2. LITERATURE REVIEW
2.1 SOURCES OF FLY ASH Coal-fired power plants use pulverized coal, which typically is ground to fineness with 75 percent or more passing the No. 200 sieve (see Figure 1). Depending on the source and grade of coal, it consists of 10 to 40 percent non-combustible impurities in the form of clay, shale, quartz, feldspar, dolomite, and limestone. In the high temperature zone of a furnace, the volatile matter and carbon are burnt, leaving the non-combustible impurities to be carried by the flue gases in the form of ash. This travels through the combustion zone where the particles become fused. As the molten ash leaves the combustion zone, it is cooled rapidly (from about 1500 °C to 200 °C), making it solidify into spherical glassy particles. While a fraction of the fused matter agglomerates and settles to form the bottom ash, a majority of it “flies” out with the flue gas stream to be collected later as fly ash. Fly ash undergoes a sequence of processes to be separated from the flue gas. It passes through a series of mechanical separators followed by electrostatic precipitators. Fly ashes from modern thermal power plants do not require any further processing for use as a supplementary cementitious material.
Figure 1. Fly ash is a by-product from coal fired power plants [Courtesy SEFA Group]
2.2 CHEMICAL AND MINERALOGICAL CHARACTERISTICS OF FLY ASH Fly ash is a complex, heterogeneous material consisting of glassy and crystalline phases. The glassy phase consists of 60 to 90 percent of the total mass of fly ash, with the remaining fraction made up of crystalline phases. The glassy phase consists of two types of spheres: solid and hollow (cenospheres). The glassy spheres and crystalline phases are not completely independent
Chunks of Coal
Transported by Truck to Concrete Plant
Coal‐Fired Power PlantsChunks of Coal
Coal Mills pulverize coal.

Proportioning Fly Ash as Cementitious Material in Airfield Pavement Concrete Mixtures
8
of one another and vary in their proportions, which makes fly ash a complex material to classify and characterize (ACI, 2004) Depending on the type and composition of the source coal used for combustion, the physical, chemical, and mineralogical characteristics of the fly ash may vary. Irrespective of the variability in their sources, fly ash is composed of varying proportions of silica (SiO2), alumina (Al2O3), ferrous oxide (Fe2O3), and calcium oxide or lime (CaO). The alumina content comes from the presence of clay in the coal. The source of Fe2O3 content is the iron-containing materials present in the coal. The primary sources of CaO in fly ash are calcium carbonates and calcium sulfates. In addition to these oxides, other chemicals such as MgO, SO3, alkalis, and carbon are present in the fly ash. Anthracite and bituminous coals (high-rank coals) normally contain a higher percentage of clay minerals than lignite and sub-bituminous coals (low-rank coals). Fly ash produced from the burning of sub-bituminous and lignite coals contain more lime, often in excess of 10 percent and up to 35 percent. Fly ash produced from high-rank coals generally is called low-calcium fly ash, and fly ash produced from low-rank coals is called high-calcium fly ash. The chemical composition and the reactivity of the glass phase depend on the calcium content of the fly ash. Note that calcium oxide is also referred to as “calcium” in the context of chemical composition of fly ash. Further, lignite coals contain higher amounts of alkalis and sulfates (mostly in the form of sodium sulfate) and less iron than bituminous and anthracite coals. The carbon in fly ash is a result of incomplete combustion of coal, and its content depends on the system of combustion used in thermal plants. Fly ash from modern thermal power plants tends to have very low unburnt carbon content and low LOI. The mineralogical composition of fly ash includes silicates, alumino silicates, iron minerals, and lime. The important minerals found in the fly ash are magnetite, hematite, quartz, mullite, smectite, illite, kaolinite, and free calcium oxide. Other minerals, like wustite, goethite, pyrite, calcite, anhydrite, and periclase, range from trace amounts to 2.5 percent. The proportion of different minerals in fly ash depends on the source of coals. The crystalline minerals in low-calcium fly ashes usually consist of quartz, mullite, sillimanite, hematite, and magnetite. These minerals do not possess any pozzolanic properties. High-calcium fly ashes contain quartz and cement minerals such as C3A, calcium aluminosulfate, anhydrite, free lime, periclase, and alkali sulfates. All the crystalline minerals in high-calcium fly ash materials except quartz and periclase react with water, making these fly ashes more reactive. Some of them also tend to flash set unless other additives, such as gypsum, can be used in the concrete mix to retard set. Numerous studies (Carette & Malhotra, 1986; Frohnsdorff & Clifton, 1981; Malhotra et al., 1989; Manz et al., 1989) have reported that fly ash generated from different sources of coal differ significantly in their chemical and mineralogical composition. An alteration to the coal burning process may also significantly vary the chemical composition. This fact is illustrated in Table 1, showing the chemical compositions of fly ashes from various sources in North America

Proportioning Fly Ash as Cementitious Material in Airfield Pavement Concrete Mixtures
Applied Research Associates, Inc. 9
(Malhotra & Mehta, 1996). Likewise, Table 2 shows the composition of various fly ashes for different classes of coals in the United States (Frohnsdorff & Clifton, 1981; Aïtcin, 2008) as well as for typical cement. Figure 2 (Thomas, 2007) shows the distribution of calcium oxide content in fly ash sources from North America. Note that this information was compiled in 2007 and can vary in the future..
Table 1. Oxide analyses of some North American fly ashes (Malhotra & Mehta, 1996; 2008)
Source Percent by mass Classification
SiO2 Al2O3 Fe2O3 CaO MgO Alkalies SO3 LOI ASTM Class
CSA Type
Bituminous 55.1 21.1 5.2 6.7 1.6 3.0 0.5 0.6 F F
Bituminous 50.9 25.3 8.4 2.4 1.0 3.1 0.3 2.1 F F
Bituminous 52.2 27.40 9.25 4.4 1.0 0.8 0.5 3.5 F F
Bituminous* 48.0 21.5 10.6 6.7 1.0 1.4 0.5 6.9 F F
Bituminous* 47.1 23.0 20.4 1.2 1.2 3.7 0.7 2.9 F F
Subbituminous 38.4 13.0 20.6 14.6 1.4 2.4 3.3 1.6 F CI
Subbituminous 36.0 19.8 5.0 27.2 4.9 2.1 3.2 0.4 C CH
Subbituminous* 55.7 20.4 4.6 10.7 1.5 5.7 0.4 0.4 C CI
Lignite 36.9 9.1 3.6 19.2 5.8 8.6 16.6 - C CI
Lignite* 44.5 21.1 3.4 12.9 3.1 7.1 7.8 0.8 C CI
Max 55.7 27.4 20.6 27.2 5.8 8.6 16.6 6.9
Min 36.0 9.1 3.4 1.2 1.0 0.8 0.3 0.4
Average 46.5 20.2 9.1 10.6 2.3 3.8 3.4 2.1 Note: Sources with “*” are Canadian sources and the rest are from the US
Table 2. Chemical composition of fly ash from various coal sources in the U.S. and for portland
cement (Frohnsdorff & Clifton, 1981; Aïtcin, 2008) Chemical
Composition Anthracite Bituminous Sub-bituminous Lignite Portland
cement SiO2 47–68 7–68 17–58 6–45 18-24 (21) Al2O3 25–43 4–39 4–35 6–23 4-8 (6) Fe2O3 2–10 2–44 3–19 1–18 1-8 (3) CaO 0–4 1–36 2–45 15–44 60-69 (65) MgO 0–1 0–4 0.5–8 3–12 0-5 (2) Na2O – 0–3 – 0–11 0-2 (1) K2O – 0–4 – 0–2 0-2 (1) SO3 0–1 0–32 3–16 6–30 0-3 (1)

Proportioning Fly Ash as Cementitious Material in Airfield Pavement Concrete Mixtures
10
Figure 2. Distribution of calcium content in North American fly ash (Thomas, 2007)
A significant point to note from Table 2 is that these chemical or mineralogical compositions vary to much greater degree in fly ash than in PCC. In other words, the variability that can be expected by changing the cement source might have a smaller implication on concrete performance relative to a change in the fly ash source. 2.3 GRANULOMETRIC CHARACTERISTICS OF FLY ASH Granulometric properties of fly ash such as the particle shape, fineness and particle size distribution including particle packing effect have a profound effect on the properties of fly ash concrete (Mehta, 1987). Inclusion of fly ash as a partial cement replacement usually improves workability and reduces the water demand of concrete. The pozzolanic properties are governed by both granulometric and mineralogical properties. Fly ash is a fine-grained material consisting mostly of spherical, glassy particles. Some ashes also contain irregular or angular particles. The particle shape depends on the nature and granulometry of the coal burned and on the combustion conditions in the power plant (Alonso & Weshe, 1991). The spherical shape of the fly ash particles produces a ball-bearing effect at the point of aggregate contact, thereby reducing the friction at the aggregate paste interface (Lane, 1983). This effect improves the fluidity of the cement paste. However, the inclusion of ground fly ash that has approximately the same degree of fineness has been shown to result in lower workability due to the loss of its spherical shape and lubricant effect (Patoary & Nimityongskul, 2001) during the grinding process. Lane and Best also observed that fineness of fly ash is a more consistent indicator of its performance in concrete and that performance improves with increased fineness (ACI, 2004). Fly ash particles less than 10μm in size are pozzolanic, and those larger than 45μm show no pozzolanic activity. Fly ash from North American sources typically contains 40 to 50 percent particles smaller than 10μm in size and less than 20 percent particles larger than 45μm. The average size is generally in the 15 to 20μm range.
05101520253035
0‐5 5‐10 10‐15 15‐20 20‐25 25‐30 >30
Num
ber of sou
rces
Calcium content (% CaO)

Proportioning Fly Ash as Cementitious Material in Airfield Pavement Concrete Mixtures
Applied Research Associates, Inc. 11
Malhotra (2008) found that the proportion of finer particles (<45μm) in fly ash is the major factor in reducing the water demand, whereas the inclusion of larger fly ash particles (>45μm) had no effect on the water requirement. A research study by Dhir et al. (1998) showed that use of coarser fly ash leads to a reduction in compressive strength for equal water to cementitious materials (w/cm) ratios. This effect increases with decreasing w/cm ratio, as shown in Figure 3.
Figure 3. Relationship between fly ash fineness and 28 day strength (Dhir et al., 1998)
Chindaprasirta et al, (2005) studied the effect of Class F fly ash fineness on compressive strength, porosity, and pore size distribution of hardened cement pastes. An original fly ash and a classified fly ash, with median particle sizes of 19.1 and 6.4μm, respectively, were used to partially replace portland cement at 0, 20, and 40 percent by weight. The researchers observed that the blended cement paste with classified fly ash produced paste with lower porosity and higher compressive strength than that with original fly ash. The authors also studied the effects on pore size and microstructure of hardened blended cement pastes (Chindaprasirta et al., 2007) and found that that the hardened blended cement paste containing finer fly ash produced a denser structure than the one containing coarser fly ash. The blended cement paste with classified fly ash was more effective at reducing the intensity of Ca(OH)2 than that with the original fly ash. They also observed that the hydration reaction, pozzolanic reaction, packing effect, and nucleation effect were enhanced by the inclusion of finer fly ash. The particle-size distribution of fly ash can be determined by various means, such as x-ray sedigraph, laser particle-size analyzer, and Coulter counter. In some cases, agglomeration of a number of small particles may form a large particle. In most cases, fly ashes contain particles greater than 1 µm in diameter (Malholtra, 2008). Mehta (1994), using an x-ray sedimentation
0
10
20
30
40
50
60
70
80
0 10 20 30 40 50
Fly ash fineness, % (45μm sieve retention)
28 d
ay c
ube
stre
ngth
, N/m
m2
BS EN 450upper limit
water content = 185 l/m3
water/(cement + fly ash)
0.34*
0.41
0.53
0.74
* water reducing admixture used to maintain equal slump
Proportioning Fly Ash as Cementitious Material in Airfield Pavement Concrete Mixtures
12
technique, reported particle-size distribution data for several U.S. fly ashes. Mehta found that high-calcium fly ashes were finer than low-calcium fly ashes and related this difference to the presence of larger amounts of alkali sulfates in the high-calcium fly ashes. The variability in particle size distribution of fly ash influences the packing density of the blended cement paste, thus resulting in the variability of water retention in the pastes. Lee et al. (2003) studied the effect of particle size distribution of fly ash–cement system on the fluidity of the cement pastes using Class F fly ash. They found that the fluidity of the cement pastes improves with the widening of the particle size distribution. 2.4 CLASSIFICATIONS OF FLY ASH 2.4.1 Unites States Standards ASTM C 618 classifies fly ash into two types according to their chemical composition: Classes C and F. ASTM C 618 states that the sum of the three principal constituents—SiO2, Al2O3, and Fe2O3— must be a minimum of 70 percent in Class F fly ash, whereas the sum must only be a minimum of 50 percent to be classified as Class C fly ash. Table 3 shows the classification of fly ash materials based on ASTM C 618. The ASTM C 311 standard procedure is followed to test a fly ash material and generate results to compare against the ASTM C 618 requirements. Class C fly ash generally contains more than 20 percent CaO, whereas CaO in Class F fly ash typically ranges from 1 to 12 percent. ASTM C 618 also states that Class F fly ash is “normally produced from burning anthracite or bituminous coal” and Class C fly ash is “normally produced from lignite or sub-bituminous coal.” ASTM C 618 differentiates the two classes of fly ash based only their coal source and chemistry (Cain, 1994). There are requirements on physical properties of fly ash for use in concrete, but the requirements do not differentiate classes of fly ash. Fly ash classification based on coal source and the sum of the three principal constituents was considered inadequate, as the variations in the constituents for any fly ash have not been seen to correlate with the properties of fresh and hardened concrete. Cain (1994) noted that there was a suggestion, at one point in the development of the specification, to remove the requirement, as it served only to define the material as fly ash. Key points regarding ASTM C 618 include the following:
• Routine QC of fly ash performed based on ASTM C 618 determines the oxides of the ash. The mineralogical composition is not determined in routine QC tests.
• While the calcium oxide content is determined in a fly ash characterization test under ASTM C 311, the C 618 standard does not consider the quantity of calcium oxide in the classification.
• Routine QC of fly ash only determines the retention of 45 μm sieve based on ASTM C 618. The actual distribution of fly ash particle size is rarely known.
Proportioning Fly Ash as Cementitious Material in Airfield Pavement Concrete Mixtures
Applied Research Associates, Inc. 13
Table 3. ASTM C 618 chemical and physical specifications for fly ash classification
Note: Class N fly ashes are raw or calcined natural pozzolans.
2.4.2 Canadian Standards The Canadian Standards Association recently revised their CSA A 23.5 specification that allows classification of fly ash based on its lime content (percent of CaO). Accordingly, fly ash can be classified into three categories—Type F, Type CI, and Type CH— indicating low, intermediate, or high calcium content, respectively. Table 4 shows the Canadian categories of fly ash classes and the requirements of total calcium content, expressed as percent by mass as CaO. No other differences in requirements are specified for various categories of fly ash with the exception of percent limit of the LOI (Manz, 1998). As of April 2010 CSA made additional revisions to the CaO limits. The CaO of Type F fly ash has now been limited to 15 percent. Thomas, Shehate, and Shashiprakash (1999) observed that the fly ashes with very high calcium content (>25 percent) had an effect on properties on concrete in a different manner than traditional fly ashes. They concluded that the total calcium content could be used as a reasonable basis for classifying fly ashes.
Table 4. Classification of fly ash based on Canadian standards prior to April 2010 Type CaO, % LOI, %
F <8 8 max. CI 8 to 20 6 max. CH > 20 6 max.

Proportioning Fly Ash as Cementitious Material in Airfield Pavement Concrete Mixtures
14
The ASTM and CSA specifications have an overlap across the categories, but for most part, there exists a correlation between the CaO content and the SiO2 + Al2O3 + Fe2O3, as shown in Figure 4 for classifications prior to the April 2010 changes. CSA Type CI fly ashes overlap into both ASTM Class C and F ashes. This also is observed in the sample of North American fly ash sources shown previously in Table 1. The CSA standards also provide certain additional specifications on the allowable ranges or levels of specific components.
Figure 4. Comparison of ASTM and CSA specifications for North American fly ash sources
(Thomas, 2007)
2.4.3 European Standards The European Union Standards (EN 450, ”Fly Ash for Concrete”) classify fly ashes based on their LOI and particle fineness, as shown in Table 5. The rationale behind this classification is that the variations in fineness of fly ash from a given source lead to variations in the water content and strengths of the resulting concrete, and the variations in LOI lead to color variations and difficulties when trying to entrain air for frost-resistant concrete (Sear, 2001). The variability stems from the limitations of the power production process. The European Standard BS EN 206 and a complementary U.K. Standard BS 8500 introduced significant changes in the use of fly ash additions to concrete mixtures. Additions are classified as Type I or Type II. A Type I addition is a nearly inert filler or pigment, and Type II is a pozzolanic or latent hydraulic addition. The EN 206 standard sets specific rules for a Type II addition of EN 450 fly ash which allows fly ash to be partially counted towards the cement content of the mix using the k-value concept (Sear, 2005). BS EN 206-1. 5.2.5.2 states that the term “water to cement ratio” should be replaced by a water/(cement + k* addition) ratio. The addition may be taken into account towards the minimum cement content. The k-value assumes a value of 0.2 for CEM I 32.5 and 0.4 for CEM I 42.5 cements. Up to a maximum of 25 percent fly ash by mass of the (cement + ash) is allowed to be counted cementitious. In other words, the fly ash/cement ratio shall not be greater than 33 percent of the total mass. Any additional ash content is assumed to act as an inert filler (Type I addition).
Proportioning Fly Ash as Cementitious Material in Airfield Pavement Concrete Mixtures
Applied Research Associates, Inc. 15
Table 5. Classification of fly ash based on European standards Property Category Requirement
Loss on Ignition A LOI not more than 5.0% B LOI 2.0% to 7.0%
C* LOI 4.0 to 9.0% Fineness N
not more than 40% retained on the 45
microns sieve and a limit of + 10% on the supplier’s declared
mean value permitted S not more than 12%
retained on the 45 microns sieve *Category C ash is not permitted in UK concrete as BS8500 has a limit of 7.0%.
An alternative method permitted within EN 206 is the equivalent concrete performance concept, where it is required to show equal performance with a reference concrete. This concept may be applied to a combination of any specified additions provided that the suitability has been established. The application of this concept requires that the concrete has equivalent performance with respect to its reaction to environmental actions and to its durability when compared with a reference concrete in accordance with the requirements for the relevant exposure class (Harrison, 2004). 2.4.4 Japanese Standards The Japan Industrial Standard (JIS) A 620, “Fly Ash for Use in Concrete,” classifies fly ash as Types I, II, III, and IV on the following basis (Nagataki et al., 2001):
• High-quality fly ash with LOI less than 3.0 percent and Blaine fineness more than 5000 cm2/g is specified as Type I.
• Most of the fly ash qualified in JIS A 6201-1996 is specified as Type II. • Fly ash with high LOI ranging from 5.0 to 8.0 percent is specified as Type III. • Fly ash with low Blaine fineness ranging from 1500 to 2500 cm2/g is specified as Type
IV. Ishikawa (2007) tabulated the test methods and requirements for classifying fly ash, as shown in Table 6.
Proportioning Fly Ash as Cementitious Material in Airfield Pavement Concrete Mixtures
16
Table 6. Fly ash for use in concrete, JIS A 6201 (1999 version) Item Type I Type II Type III Type IV
Ignition loss (%) 3.0 or less 5.0 or less 8.0 or less 5.0 or less
Fineness
Residue on 45 um sieve (mesh sieving method: %)
10 or less 40 or less 40 or less 70 or less
Specific Surface area (cm2/g)(Blaine method)
5000 or over 2500 or over 2500 or over 1500 or over
Flow value ratio (%) 105 or over 95 or over 85 or over 75 or over
Activity index (%)
Material age 28 days 90 or over 80 or over 80 or over 60 or over
Material age 91 days 100 or over 90 or over 90 or over 70 or over
Density (g/cm3) (specific gravity) 1.95 or over
Silicon dioxide: SiO2 (%) 45.0 or over Hygroscopic moisture (%) 1.0 or less Homogeneity in quality: Not to exceed values of submitted samples
Blaine method (cm2/g) ±450 or over
Mesh Sieving method (%) ±5 or over
2.4.5 Notable Studies of Relevance to Fly Ash Classification Gava & Prudencio (2007) compared the pozzolanic activity index results obtained from test procedures mentioned in American, Brazilian, and British standards and correlated these results with the chemical and physical characteristics of the pozzolans. It was observed that the results obtained from different test methodologies did not correlate with the actual performance of pozzolans in mortars. Important factors identified include type of cement, cement replacement rate, presence of water reducing admixtures, and water to cement (w/c) ratio, which influence the performance of a pozzolan when used as a cement replacement in mortar and concrete mixtures. Other studies have corroborated that existing methods do not permit suitable evaluation, and current classifications could lead to incorrect usage of pozzolans. In summary, the characteristics of fly ash are widely variable based on their sources, and the existing classification methods do not correlate with the actual performance of fly ash concrete. More emphasis should be placed on the performance requirements when designing a concrete mixture containing fly ash. It is imperative to study the effects of fly ash on properties of fresh and hardened concrete, such as the workability, early strength development, and durability aspects.
Proportioning Fly Ash as Cementitious Material in Airfield Pavement Concrete Mixtures
Applied Research Associates, Inc. 17
2.5 PROPERTIES OF FRESH CONCRETE CONTAINING FLY ASH 2.5.1 Workability and Water Demand The fineness and spherical shape of the fly ash particles influence the rheological properties of concrete, primarily improved workability and reduced water demand. Three physical phenomena are attributed to the improved workability:
• Fly ash particles get adsorbed on the oppositely charged cement particles, preventing flocculation in the mix and more evenly dispersing the cement.
• Fly ash particles reduce the inter-particle friction in a mixture because of their spherical shape.
• Fly ash particles improve the particle packing in the system and act as excellent void fillers.
Thus, concrete mixtures containing fly ash generally require less water content than mixes without fly ash for equal workability. Several studies that have evaluated the rheological properties have demonstrated the interaction effects of other parameters in their observations, which might include purely physical effects associated with the presence of fine particles or physico-chemical effects associated with pozzolanic and cementitious reactions. Naik and Ramme (1990) observed that the replacement of cement with Class C fly ash improved workability and reduced water demand. The w/c ratio decreased significantly as the fly ash content increased from 0 to 60 percent replacement. Studies also have shown that the water demand can be reduced by as much as 20 percent (see Figure 5), and that the reduction in water demand depends on the fineness of the fly ash (Owen, 1979). In other words, the finer the fly ash, the larger the reductions in water demand due to the addition of fly ash. Another study (Lane, 1983) observed that the water demand decreased as the fly ash content increased. However, the water demand increased with an increase in LOI values of fly ash. Higher carbon content absorbs a larger quantity of water. Ravina (1984) observed that the slump of concrete increased with increasing replacement of cement with Class F fly ash. However, the inclusion of Class F fly ash reduced the slump loss of prolonged mix concrete. The slump loss reduction increased with higher LOI values and higher cement replacement percentages. The amount of retempering water required for restoring the lost slump was smaller for the fly ash mix than for the ordinary PCC mix. At times, the spherical fly ash particles may contain hollow particles or smaller spheres (called cenospheres or plerospheres, respectively) that can be observed through microscopic investigations (Malhotra and Mehta, 2008). The presence of such particles increases the demand for air entraining and water-reducing admixtures. This may not be obvious by reviewing the fly ash chemical and physical characteristics test results.

Proportioning Fly Ash as Cementitious Material in Airfield Pavement Concrete Mixtures
18
Figure 5. Effect of the proportion and particle size of fly ash on water demand for equal
workability of concrete (Owen, 1979)
2.5.2 Set Time There is a general agreement that Class F fly ash replacement slows the setting time of concrete for comparable cementitious material content. However, the apparent delay in set time is not due to the addition of fly ash; instead, it is because of reduced cement content in the mix design for the same total cementitious content. Early strength is mostly a function of aluminates and the C3S provided by ordinary portland cement. Low calcium fly ashes, typically Class F fly ashes, contain aluminosilicates, which are less reactive than the calcium aluminosilicates present in high calcium fly ashes or Class C fly ashes. The contribution to early strength and set time is negligible. The extended set time can be attributed to the secondary influence of the dilution of cement rather than the addition of fly ash. This also necessitates longer curing times, preferably wet curing, for Class F ash. Often, the loss in strength is, at least partially, as a result of lack of additional curing. Class C fly ashes have shown mixed behavior in setting characteristics of concrete. The initial and final setting times may increase, decrease, or remain unaffected depending on the properties and proportion of fly ash used. Dodson (1981) found that the addition of all sources of fly ash but one Class C fly ash increased the setting time of concrete. Carette and Malhotra (1986) observed a similar trend, where the data showed that all but 2 of the 11 ashes used significantly increased setting times. Naik and Ramme (1990) reported that the initial and final set times were not significantly different when the content of Class C fly ash was increased from 35 percent
Proportioning Fly Ash as Cementitious Material in Airfield Pavement Concrete Mixtures
Applied Research Associates, Inc. 19
cement replacement to 55 percent replacement. In a later study, Naik and Singh (1997) observed the behavior of four different Class C fly ashes in Wisconsin and found that the setting times of concrete were influenced significantly by both the source and the amount of fly ash used. Their results indicated that the setting times were retarded up to a certain level of cement replacement, typically about 60 percent. Beyond this level, a reverse trend with a tendency to flash set was noted. The setting times varied with the source of fly ash used. Brooks (2002) developed a predicting model for setting time of fly ash concrete. The influencing parameters identified in the development of the model were fineness and specific gravity of cementitious material, water-cementitious material ratio, temperature, and the chemical composition of the blended cement, which is expressed as the blended oxide ratio CaO/ (SiO2 + Al2O3 + Fe2O3). 2.5.3 Air Content All concretes with fly ash require more air-entraining admixture than PCC without fly ash. Generally, concretes containing Class C fly ash require less air-entraining admixture than those with Class F fly ash. Gebler and Klieger (1983) offered the following summary of the findings and conclusions relevant to air entrainment in fresh concrete:
• Plastic concretes containing Class C fly ash tend to lose less air than concretes with Class F ash.
• As the air-entraining admixture requirement increases for a concrete containing fly ash, the air loss increases.
• Air contents in plastic concrete containing Class F fly ashes decrease as much as 59 percent, 90 minutes after completion of mixing.
• As the organic matter content, carbon content, and LOI of fly ash increase, the air entraining admixture requirement increases, as does the loss of air in plastic concrete.
• Generally, as the total alkalis in fly ash increase, the air-entraining admixture requirement decreases.
• As the specific gravity of a fly ash increases, the retention of air in the concrete also increases. Concrete containing a fly ash that has a high lime content (Class C fly ash) and less organic matter tends to be less vulnerable to loss of air.
• Generally, as the SO3 content of fly ash increases, the retained air in concrete increases. 2.5.4 Plastic and Autogeneous Shrinkage Tangtermsirikul (1995, 1999) conducted experiments to study the effect of Class C fly ash on both autogeneous and drying shrinkage of cement. It was found that Class C fly ash was more effective in reducing autogeneous shrinkage than Class F fly ash due to the chemical expansion that occurred in the samples containing Class C fly ash. Class C fly ash was also effective in reducing drying shrinkage of samples when compared to samples with and without fly ashes. Class C fly ash that contained higher SO3 content was more effective than those with the lower SO3 contents in reducing shrinkage.

Proportioning Fly Ash as Cementitious Material in Airfield Pavement Concrete Mixtures
20
In a separate study, Tangtermsirikul (1999) also studied the effect of fly ash particle size on autogeneous shrinkage. With the average size of fly ash particles larger than cement, the autogeneous shrinkage in 50 percent fly ash paste was smaller than that of 20 percent fly ash paste. However, this trend reversed when the average size of fly ash particles was smaller than cement particles. As autogeneous shrinkage is related to the content and structure of the pores in the paste, denser pastes having discontinuous pore structure are considered to undergo higher autogeneous shrinkage. Cement pastes with longer submerged curing (7 days) had lower autogeneous shrinkage than pastes with a 3-day curing period. To support this conclusion, Gopalan and Haque (1987) emphasized the importance of curing conditions for fly ash concrete. They concluded that the poor curing conditions could be more detrimental to the compressive strength development of fly ash concrete as compared to ordinary PCC. This can be largely attributed to the curing required during the delayed pozzolanic reaction of fly ash, much beyond the peak activity in cement particles. 2.6 EARLY AGE PROPERTIES OF FLY ASH CONCRETE 2.6.1 Strength Gain Rate Generally, concrete with fly ash can result in a slower rate of strength gain and lower compressive strengths than ordinary PCC. However, as the rate of strength gain of the portland cement decreases, the continued pozzolanic activity in the fly ash concrete contributes to faster strength gain and higher compressive strengths at later stages. The slower rate of strength gain in early stages of fly ash concrete is attributed to the reactivity of fly ash. Class F or low calcium fly ashes are generally less reactive than Class C or high calcium fly ashes because of the presence of Ca(OH)2 and other reactive components. Thus, concrete containing Class C fly ash exhibits higher early strength than concrete containing Class F fly ashes. Gebler and Klieger (1986) evaluated cement concretes containing Class F and Class C fly ashes from 10 different sources for their mixing water requirement, time of setting, bleeding, compressive strength, drying shrinkage, abrasion resistance, and absorption. This study concluded that concretes containing Class C fly ash developed higher early age compressive strength than concretes with Class F fly ash. Compressive strengths of concretes with Class F fly ash were more susceptible to low curing temperatures than those for concretes with Class C fly ash. Class F fly ash concretes required more initial moist curing for long-term, air-cured compressive strength development than did concretes containing Class C fly ashes or the control concretes. Abrasion resistance of control concretes and concretes containing fly ash depended on compressive strength. Naik and Ramme (1990) conducted compressive strength tests on concrete with and without Class C fly ashes. They observed that the compressive strengths of fly ash blended concrete samples were generally lower than those of concrete samples with no fly ash at 1, 3, and 7 days. However, the strengths of fly ash concrete samples were higher than ordinary PCC samples at later stages (28, 56, and 91 days).
Proportioning Fly Ash as Cementitious Material in Airfield Pavement Concrete Mixtures
Applied Research Associates, Inc. 21
Researchers have found that the curing regime has a significant influence on strength development in concrete containing fly ashes (Swamy, 1983; Gopalan and Haque, 1987). Gopalan and Haque (1987) conducted the compressive and flexural strengths of ordinary portland cement and fly ash concretes using fog and air curing. Fog curing gives an upper bound of strength development, and continuous air curing gives a lower bound. The test results indicated that the development of compressive strength under air curing was less than that with fog curing for all concretes with and without fly ash. The loss of strength due to air curing was much more pronounced in fly ash concrete than in ordinary PCC. However, the flexural strengths of fly ash concrete were less affected by air curing. To improve the early age properties of fly ash cement and concrete, several methods are employed to activate the pozzolanic reactivity of fly ash. The activation methods include elevated temperature curing, grinding of fly ash and addition of chemical activators such as sodium sulfate and calcium chloride (Shi and Qian, 2001). Elevated curing of concrete containing fly ash accelerates the strength development but decreases ultimate strength of the concrete. The grinding of fly ash can increase the strength development and ultimate strength of the concrete containing fly ash but decreases the workability of the concrete. Grinding breaks down the spherical particles of fly ash into finer particles of angular or irregular shape, which significantly affects the workability of the fresh concrete. Moreover, grinding is an energy intensive process. Adding a small quantity of silica fume can offset loss in early strength. The replacement of portland cement with a large volume of Class F fly ash decreased the strength of cement significantly. The addition of 3 percent industrial grade calcium chloride to a blended cement of 50 percent fly ash resulted in increased strength by 50 to 70 percent, and a blended cement of 70 percent fly ash resulted in increased strength by approximately 100 percent. However, an increase in calcium chloride from 3 percent to 5 percent resulted in decreased strength of cement pastes (Shi and Qian, 2001). The elastic modulus, creep, and drying shrinkage resistance depend on the strength development of concrete containing fly ash. The elastic modulus of concrete containing fly ash is lower than that of ordinary PCC at early ages and somewhat higher at 90 days and thereafter. The elastic modulus increased with increasing compressive strength; however, this was not true with high-strength concrete with superplasticizers and lower w/c ratio. The aggregate characteristics become a limiting factor to elastic modulus in high-strength concrete. Creep and drying shrinkage are higher at early ages but lower at later ages. Creep strains and shrinkage were found to be higher at higher proportions of fly ash (Mehta, 1989). 2.7 DURABILITY ASPECTS OF FLY ASH CONCRETE 2.7.1 Freeze-Thaw Resistance The freeze-thaw resistance of concrete made with or without fly ash depends on the adequacy of the air-void system, the soundness of aggregates, age, degree of hydration (maturity), strength of the cement paste, and moisture condition of the concrete. All other variables being favorable, fly ash concrete can achieve good free-thaw resistance if proper air-void system is present.

Proportioning Fly Ash as Cementitious Material in Airfield Pavement Concrete Mixtures
22
Virtanen (1983) observed that concrete containing fly ash showed better resistance than ordinary PCC when air-entrained and poorer resistance when non-air-entrained. Langan and Ward (1987) drew a similar conclusion that the interrupted and/or prolonged periods of freezing did not affect the freeze-thaw resistance of fly ash concretes with air contents greater than 5 percent. However, concrete with inadequate air contents experienced a rapid decrease in freeze-thaw resistance. The application of deicers caused higher loss of surface mortar or surface scaling in concrete containing fly ash, probably due to their finer pore structures. More scaling damage is likely to occur with increasing proportions of fly ash. The carbon content of fly ash affects the freeze-thaw resistance of concrete due to high adsorption of air-entraining mixtures by carbonaceous particles that have a large specific area (Mehta, 1989). Klieger and Gebler (1987) also evaluated the durability of concretes containing Class F and Class C fly ashes. Their results indicated that air-entrained concretes, with or without fly ash, that were moist cured at 23 °C generally showed good resistance to freezing and thawing. However, when the specimens were cured at a lower temperature (4.4°C), air-entrained concretes with Class F fly ash showed slightly less resistance to freezing and thawing than concrete with Class C fly ash. Larson (1994) summarized the effects of fly ash on freezing and thawing durability: “Fly ash has no apparent ill effects on the air voids in hardened concrete. When a proper volume of air is entrained, characteristics of the void system meet generally accepted criteria.” 2.7.2 Permeability Permeability has a profound effect on the durability of the fly ash concrete. Permeability controls the penetration of harmful elements such as CO2, chloride, and sulfate ions. Generally, fly ash concrete is believed to have lower permeability than ordinary PCC due to the following factors: reduction in water content for a given workability and the pore structure refinement due to pozzolanic reaction (Thomas & Matthews, 1992). However, an adequate curing regime is necessary to achieve these benefits. 2.7.3 Carbonation Carbonation occurs by the diffusion of CO2 into the concrete, where it dissolves in the pore solution. The diffused CO2 then reacts with dissolved Ca(OH)2, resulting in the formation of CaCO3. Permeability and fly ash reactivity are the key factors that influence the carbonation process. Lower permeability slows the diffusion process, resulting in a lower carbonation rate. The pozzolanic reaction between reactive silica and Ca(OH)2 results in a denser microstructure of the hardened cement paste so that the diffusivity of CO2 is reduced. When more Ca(OH)2 is available, more CO2 molecules can react, which leads to a slower ingress of CO2 (Lammertijn and De Belie, 2008). Therefore, well-compacted and properly cured concrete at a low w/c ratio will be sufficiently impermeable to resist the advance of carbonation beyond the first few millimeters (Malhotra, 2008).

Proportioning Fly Ash as Cementitious Material in Airfield Pavement Concrete Mixtures
Applied Research Associates, Inc. 23
Thomas and Matthews (1992) conducted a study on the effects of curing and strength grade on the carbonation of concrete with and without fly ash. Their results indicated that the carbonation of concrete with 15 to 30 percent fly ash is similar to or slightly higher than equivalent strength concrete without fly ash. They observed that the poorly cured concrete with 50 percent fly ash carbonated at a significantly faster rate than control specimens of the same grade. They emphasized the importance of curing in fly ash concrete and stated, “These results merely reinforce the need to pay particular attention to curing when using high levels of fly ash and should not become a barrier to using concrete with high levels of fly ash.” The effects of inadequate curing on carbonation of concrete containing fly ash persist even in the long term. Bouzoubaa et al. (2006) found that the reactivity of fly ash used significantly influenced the depth of carbonation in concrete. The researchers observed that the depth of carbonation deceased with increasing fly ash reactivity. They concluded that the carbonation was not an issue for high-volume fly ash concrete due mainly to its low w/c ratio and dense structure. 2.7.4 Sulfate Resistance The calcium hydroxide and alumina bearing phases of hydrated portland cement are more vulnerable to sulfate attack. Sulfate ions reacts with Ca(OH)2 to form calcium sulfate, which in turn attacks calcium aluminate hydrate C3A to form calcium sulfoaluminate, also known as ettringite. The addition of fly ash binds the free lime of the hydrated cement to prevent the reaction of sulfates with Ca(OH)2. Mehta (1973) attributes improvements in the sulfate resistance of fly ash concretes to the reduction in the free lime content due to the chemical pozzolanic reaction and the reduction in permeability due to pore refinement by the extra hydration product deposited by the fly ash. The replacement of cement with fly ash also has a “dilution effect” by decreasing the total amount of C3A in the concrete mixture. Dikeou (1970) observed that fly ash from bituminous coal significantly improved the sulfate resistance of concrete in the 20 to 35 percent replacement range. Dunstan (1982) showed that sulfate resistance may be reduced significantly in concretes containing lignite or sub-bituminous ashes as compared to concretes with bituminous (Type F) ashes. A research study conducted by the Bureau of Land Reclamation (1967) concluded that the sulfate resistance of concrete improved regardless of the type of cement and fly ash used. Interestingly, the chemical composition of fly ashes indicated that only Class F fly ashes were used in this study. Davis et al. (1937), who conducted extensive tests to determine the feasibility of using fly ash in PCC, probably were the earliest to report that some fly ashes increased the sulfate resistance of concrete, others were ineffective, and others had a deleterious effect on sulfate resistance. Tikalsky and Carrasquillo (1992) drew a similar conclusion that the fly ashes with higher amounts of CaO and amorphous calcium aluminates increased the susceptibility of concrete to sulfate attack; fly ashes with low amounts of CaO decreased susceptibility. Folliard and Drimalas (2007) made a similar observation with the use of high-calcium fly ash in sulfate environments. They observed that the fly ashes that showed a tendency towards containing more calcium aluminates in the glassy phase exhibited the worst sulfate resistance in ASTM C 1012 testing. Class C fly ash exhibited poor sulfate resistance in all but one of the fly

Proportioning Fly Ash as Cementitious Material in Airfield Pavement Concrete Mixtures
24
ashes tested. They concluded that the use of Class C fly ashes in a sulfate environment is not appropriate. Shehata et al. (2008), who investigated the effectiveness of high-calcium fly ash in mitigating sodium sulfate attack, observed that low-sulfate resistance of high-calcium fly ash could be enhanced by blending with 5 percent silica fume or an optimum proportion of gypsum. Thus, the addition of fly ash does not automatically guarantee sulfate resistance. It has varying effects on the sulfate resistance (Klieger and Lamond, 1994). Not all pozzolans are effective in improving sulfate resistance. Some ashes have a significant effect in improving resistance, while others have no effect or adverse effects (Popovics, 1992). The apparent inconsistencies are due in part to the differences in the composition and fineness of the pozzolans, and also to the amount of pozzolan and the amount and type of cement in the mixture. Klieger and Lamond (1994) made the following generalization on using the ASTM C 618 classification for mitigating sulfate attacks:
• Most Class F fly ashes are more effective than Class C ashes to improve sulfate resistance.
• While using Type II and Type V cements, Class F fly ash replacement is more efficient than Class C fly ash replacement for sulfate resistance.
• High alumina content in the fly ash reduces sulfate resistance. • Low calcium Class C fly ashes are often good; but high calcium Class C ashes are
variable, often poor, and may reduce sulfate resistance. • Replacement levels greater than 75% are needed to achieve sulfate resistance in some
Class C fly ash sources. However, other studies contradict these findings by proposing that pozzolans of high fineness, high silica content, and highly amorphous silica are the most effective for reducing sulfate expansion (Popovics, 1992). Mather (1980) examined the effect of fly ash from eight different coal sources on sulfate attack and observed that the three subbituminous fly ashes exhibited the best resistance, the single bituminous ash produced an intermediate resistance, and the four lignite ashes provided the worst resistance. Mather concluded that the most effective fly ashes were those which had high fineness and high silica content and were highly amorphous. Dunstan (1980) proposed an analytical method called the sulfate resistance factor (R) that is based on the bulk chemical compostion of fly ash. The R-value is derived using the proportions of calcium oxide and ferric oxide in the estimated glassy portion of fly ash. This factor was developed based on the idea that the increase in sulfate resistance of concrete is directly proportional to ferric oxide content and inversely proportional to free lime content of fly ash. R is defined as:
R = (CaO percent – 5) / (Fe2O3 percent) where the suggested lower limit of F2O3 is 2 percent. Table 7 shows the cut-off values that Dunstan (1980) proposed for R in concretes containing 25 percent fly ash replacement. The obvious limitations of the direct application of R-value limits

Proportioning Fly Ash as Cementitious Material in Airfield Pavement Concrete Mixtures
Applied Research Associates, Inc. 25
with no practical considerations are the effect of high w/c ratio on porosity and the source of available alumina for the ettringite formation. The concept of R-value can be explained by the ternary phase diagram of calcium oxide-alumina-silicates shown in Figure 6. Dunstan (1980) observed that fly ash in the mullite (A3S2) field (with higher proportions of silica and alumina) exhibited good resistance to sulfate expansions, whereas the fly ash in the gehlenite (C2AS) field (with higher proportions of calcium and alumina) had reduced resistance to sulfate expansions. Fly ashes with the same content of alumina but different contents of lime exhibited drastically different sulfate resistance. This observation presumably led to the exclusion of alumina content in the determination of R-value.
Table 7. Proposed limits of R values at 25 percent replacement
R limits Sulfate Resistance* < 0.75 0.75 to 1.5 1.5 to 3.0 > 3.0
Greatly improved Moderately improved No significant change Reduced
* compared to a Type II cement at w/c ratio of 0.45
Figure 6. Calcium oxide-alumina-silica ternary phase diagram (Tikalsky & Carrasquillo, 1993)
Dunstan (1980) took the findings of Kalousek and Benton (1970) into consideration by including the role of ferric oxide in ettringite formation. Kalousek and Benton (1970) theorized that the crystals of iron-rich ettringite did not grow to cause expansion, or grew very slowly. In contrast, Tikalsky and Carrasquillo’s test results (1992) indicated no linear relationship between the iron oxide content and the sulfate expansion. Tikalsky and Carrasquillo (1992) confirmed the validity of the Dunstan’s hypothesis regarding the effect of CaO content on sulfate expansions through the test results conducted on 18 fly ashes with varying chemical composition. They extended the R-value concept by incorporating the composition of the glassy portion of the fly ash. They observed that the glassy portion of the fly ash rich in both alumina and calcium oxide dissolved over time to form calcium sulfoaluminates in a sulfate environment. Based on these observations, Tikalsky and Carrasquillo made the following recommendations to determine the suitability of fly ash for sulfate resistance:
Proportioning Fly Ash as Cementitious Material in Airfield Pavement Concrete Mixtures
26
• Fly ash meeting the requirements of ASTM C 618 and containing less than 10 percent of
CaO may be used to increase sulfate resistance of concrete. • Fly ash meeting the requirements of ASTM C 618 and containing more than 25 percent
of CaO may not be used in concrete exposed to sulfate environments. • Fly ash meeting the requirements of ASTM C 618 and containing between 10 and 25
percent of CaO should be subjected to sulfate exposure testing. 2.7.5 Alkali Silica Reaction ASR is the reaction between the alkali hydroxide in portland cement and certain forms of reactive silica, such as opal, chert, chalcedony, tridymite, cristobalite, and strained quartz. The reaction starts with the attack on siliceous minerals in the aggregate by the alkaline hydroxides, such as NaOH and KOH, in pore water derived from the alkalis in the cement. The product of this reaction is an alkali-silicate gel, which has a tendency to swell in the presence of water. This swelling can be detrimental and manifest as cracking, and ultimately failure of concrete. Fly ash is effective in preventing ASR. This effectiveness may vary based on its fineness, mineralogical, and chemical characteristics (Malvar and Lenke, 2006). The proportion of fly ash and the percentage of calcium oxide in the fly ash also influence the effectiveness of fly ash. The silica is considered the most beneficial constituent in preventing ASR, whereas the CaO is considered the most deleterious constituent in expanding ASR (Malvar and Lenke, 2006). Class F fly ashes are considered more beneficial than Class C fly ashes. Dunstan (1981) observed that the minimum replacement percentage to reduce ASR may be approximately equal to the calcium oxide percentage of the fly ash. This study also cautions against the use of smaller amount of fly ash. It was observed that there is a pessimum limit for fly ashes with regard to alkali aggregate reaction, when small amounts of fly ash, typically in the range of 5 to 10 percent, tend to increase the expansion. This pessimum effect is very pronounced for Class C fly ash (with typical CaO contents between 10 and 30 percent) and is also present with Class F fly ash (with typical CaO contents between 0 and 10 percent). For Class F fly ash with 10 percent CaO, the pessimum effect often occurs for replacements around 10 to 15 percent, and the minimum replacement to reduce the expansion to an acceptable level is at least 30 percent (Malvar et al., 2002). Boudreau et al. (2006) investigated the effect of different dosages of lithium nitrate on early age properties of concrete with 20% fly ash. This study observed that the concrete with 20% fly ash exhibited some retardation in early heat generation and maturity at higher proportions (200% and 400%) of lithium nitrate. Malvar et al (2002) offered the following recommendations in using fly ash for ASR mitigation:
• Current practices using 15 percent fly ash cement replacement may worsen the ASR expansion, even with Class F fly ash.
• A minimum replacement of 25 percent for Class F fly ash is recommended. A practical upper limit for the replacement could be approximately 40 percent due to increased

Proportioning Fly Ash as Cementitious Material in Airfield Pavement Concrete Mixtures
Applied Research Associates, Inc. 27
difficulties with concrete finishing and lower strength gain rates at higher volume replacements. The fly ash also should have a maximum 1.5 percent available alkali, a maximum 6 percent LOI (3 percent would be preferable), and a maximum 8 percent CaO (2 percent would be preferable). Contents of CaO between 8 and 10 percent could be allowed if the minimum replacement is 30 percent (by weight).
• Class C fly ash is not recommended for ASR mitigation, as it has been shown to be ineffective even aggravate the ASR problem.
• For very reactive aggregates, lithium nitrate may be needed in addition to Class F fly ash. Rangaraju (2007a, 2007b) investigated the effectiveness of ASR mitigation methods, such as fly ashes, slag, and lithium admixtures, in mitigating the effects of deicing chemicals on airfield pavements. This study investigated the effects of three sources of fly ashes with different lime contents at different proportions on four different sources of reactive aggregates. The lime contents in the fly ash sources were 5.2, 15.7, and 29.4 percent of CaO. The dosage levels were 15, 25, and 35 percent cement replacement by mass. This study found that the mortar bars with low and moderate levels of reactive aggregates required only about 25 percent dosage level of low-lime and intermediate-lime fly ash, whereas the highly reactive aggregates required higher proportions of the same types of fly ashes. Fly ashes with high lime contents were found to be ineffective irrespective of their proportions. The potential for acceleration of ASR in the presence of deicer chemicals were also evaluated, which resulted in the development of EB-70, an interim test protocol to screen aggregates for ASR potential in deicer environments (FAA, 2005). EB-70 essentially used a 6.4M potassium acetate (KAc) solution to replace the 1N sodium hydroxide (NaOH) soak solution used in the ASTM C 1260 standard procedure. EB-70 was introduced after confirming the absence of reactivity in mortar bars made with a known innocuous aggregate and soaked in pavement deicers. This protocol was critically evaluated by the FAA using further field validation efforts under an ongoing IPRF study, 01-G-002-05-7. This study, which evaluated case studies from 6 different airfields, was unable to establish a positive link between KAc deicer and ASR observations. Instead, based on testing 31 different aggregate samples, it was found that changing the soak solution to a 3M Ka + 1N NaOH was more effective to examine aggregates for both ASR potential and deicer sensitivity simultaneously. A revised test procedure has been developed and is currently an interim procedure for screening aggregates to be used in concrete (ACPA, 2011). 2.8 SUMMARY OF FINDINGS FROM LITERATURE REVIEW The literature provides ample evidence that current specifications for fly ash use in PCC are not adequate from a performance standpoint. There are many variables that factor into optimal fly ash use for a particular situation. At the same time, it is recognized that standard specifications are necessarily simple, direct, and prescriptive; hence, they are limited to the class of fly ash and the replacement rate to be used. The recommendations tend to stay conservative in fly ash use, and they are likely to be effective in most cases. However, this conservative approach may result in the underutilization of fly ash, or in using it in quantities detrimental to the performance of the pavement.
Proportioning Fly Ash as Cementitious Material in Airfield Pavement Concrete Mixtures
28
The literature review also indicates that, while the mineralogical and chemical compositions of a fly ash affect the early age properties, long-term strength, and durability of the concrete mix, there is a significant level of interaction with properties of other materials in the mix design. There exists a great potential to optimize the mix to achieve the desired levels of workability, strength, and durability by specifying:
• Appropriate levels of fly ash replacement. • Appropriate admixtures and dosages of admixtures. • Appropriate curing and temperature management regimes.
Material selection and mix optimization also should include verification using standard tests to ensure that the desired results are achieved.

Proportioning Fly Ash as Cementitious Material in Airfield Pavement Concrete Mixtures
Applied Research Associates, Inc. 29
CHAPTER 3. DEVELOPMENT OF GUIDELINES
3.1 INTRODUCTION The guidelines that follow have been integrated into a mix optimization protocol. The protocol addresses the specific technology gaps and practical needs identified in the initial phase of this study. The recommendations therein are based largely on empirical mix design and performance data collected from various sources, including literature, laboratory tests, and real-world projects. This effort also attempted to utilize the best available theoretical information to create a pragmatic tool that can be used by practitioners. The methodology adopted in developing the recommendations involved careful selection of the combination of materials, mix proportioning and mix design routines, curing regimes, and verification testing required to ensure the desired levels of workability, constructability, strength, and durability are achieved. The guidelines were evaluated and refined using information collected from airfield pavement project case studies and laboratory testing, which are discussed in detail in the next two chapters. The mix optimization protocol has been condensed into a catalog format, which is available as a stand-alone document: Recommendations for Proportioning Fly Ash as Cementitious Materials in Airfield Pavement Concrete Mixtures (Rao et al., 2011). The catalog recommendations also have been incorporated into a software tool that provides a quick and easy way to evaluate the effect of changing project parameters. Scope of the Mix Optimization Catalog The catalog is intended to:
• Guide the user to a range of fly ash replacements for a project. • Alert the user to additional requirements needed to use fly ash successfully in a project. • Outline the tests that need to be run to select the optimum fly ash content.
Based on the recommendation, the user is expected to select three fly ash replacement rates within the range and perform the recommended tests to verify its performance (note that the tests recommended are project-specific as well). Next, the user is required to review and plot data for analysis so that an optimum may be estimated. Finally, the user needs to re-batch and test at optimum and submit the required results for approval. Key Considerations in Developing Recommendations Practicality was an important consideration in the development of the mix optimization catalog. The recommendations developed were intended for immediate implementation into current practice with the use of information that is routinely available. Clearly, the implementation of the catalog will warrant the use of information in excess of what is used routinely in current

Proportioning Fly Ash as Cementitious Material in Airfield Pavement Concrete Mixtures
30
practice; however, this additional information is obtained from standard procedures for material tests and materials review that are already available in using fly ash. For example, ASTM C 311 develops data for comparison with the requirements of ASTM C 618. A sample of ASTM C 311 test data is shown in Table 8 for a material that has been classified as Class C fly ash per ASTM C 618. This information typically is furnished by the fly ash vendor for each fly ash shipment and is provided by the contractor for mix design approval. This test also may be performed by the contractor for verification.
Table 8. Sample report of fly ash testing which is a reference to use mix optimization catalog
SOURCE: XYZ
CONFORMANCE: The sample meets the chemical and physical requirements listed below, as per ASTM C 618 for a Class C fly ash
TEST METHOD ASTM : C 311 ASTM C 618 REQUIREMENTS
CLASS F CLASS C
CHEMICAL COMPOSITION
Silicon Dioxide (SiO2), % 39.8 Aluminum Dioxide (Al2O3), % 19.3 Iron Oxide (Fe2O3), % 7.1
Total 66.2 70 min 50 min
Calcium oxide (CaO), % 20.4 Magnesium oxide (MgO), % 4.6 Sulfate (SO3), % 1.4 5.0 max 5.0 max Moisture content, % 0.11 Loss on ignition, % 0.25 6.0 max 6.0 max
PHYSICAL REQUIREMENTS
Fineness: Retained on #325 sieve, % 6.0 34 max 34 max Density, g/cm 2.67 Strength Activity Index -
7 days, % of control 100 75 min at 7 or 28 days
75 min at 7 or 28 days 28 days, % of control 106
Water Requirement, % of control 96 Soundness, % ±0.05 ±0.8 max ±0.8 max
Under current practice (P-501 specification), the material’s conformance to ASTM C 618 and the classification as Class C or Class F is the most important information used for the mix design. The new mix optimization catalog uses additional information available from this report, which includes the calcium oxide content, the LOI, and the fineness information.

Proportioning Fly Ash as Cementitious Material in Airfield Pavement Concrete Mixtures
Applied Research Associates, Inc. 31
Likewise, as an example for selecting aggregates, the ASTM C 1260 test is performed to identify deleterious reactivity with alkalis in cement. These test results will be utilized in the mix optimization process to classify aggregate reactivity and select the fly ash type and replacement rates for the project. 3.2 FRAMEWORK FOR MIX OPTIMIZATION CATALOG The mix optimization catalog was designed with five distinct sections:
1. Project Conditions: This section lists the project conditions that are known to affect the selection of fly ash type and quantities.
2. Recommendations for Fly ash Properties: This section lists the fly ash properties that are recommended for the project conditions selected by the user.
3. Recommendations for Admixtures and Curing: This section lists the factors that need to be considered in the mix design and during construction.
4. Recommended Tests: This section lists the standard tests that need to be performed while evaluating the mix.
5. Sulfate Check: Based on the final recommendations, this section provides a check on the fly ash properties to resist sulfate attack for different levels of sulfate exposure.
Item 1 is the only section where user’s selection is displayed. Items 2, 3, and 4 form the recommendations for optimizing the mix. Item 5 is applicable only to projects subject to sulfate exposure. In other words, the recommendations are tailored to project-specific conditions. Under items 2, 3, and 4, the catalog provides two levels of recommendations—primary and secondary which refer to recommendations that are a priority or optional respectively. Primary recommendations imply the specified value for a given parameter is the optimum case, but the secondary recommendation also has significant potential to meet performance requirements. For example, the catalog might present a primary recommendation of 30 to 50 percent replacement and a secondary recommendation of 15 to 30 percent replacement of a fly ash with a specified limit on the calcium oxide level for a project in a deicer environment using reactive aggregates and high alkali cements. Under circumstances when hauling the required fly ash to a project location is economically not feasible, the secondary recommendation for the range of fly ash may be evaluated in the trial batches instead of a range from the primary recommendation. For the given example, it might be possible to meet project specifications at a replacement level closer to 30 percent, in which case a 25 percent replacement may be the optimum. 3.2.1 Project Conditions The recommendations were developed for five broad categories of project conditions:
• Deicer exposure – deicer or non-deicer. • Aggregate reactivity – reactive or non-reactive aggregates. • Cement type – high alkali or low alkali cement. • Opening time requirements – quick opening time or non-critical opening time. • Paving weather – cool, moderate, or hot.

Proportioning Fly Ash as Cementitious Material in Airfield Pavement Concrete Mixtures
32
This results in 48 possible combinations of project-specific variables, each of which is provided with a unique set of recommendations for fly ash properties, mix design methods, and construction practices for good performance. For each combination of variables, the catalog also recommends tests that are necessary to evaluate the mix design and verify its strength and durability characteristics. These tests also are appropriate for the project environment and for preventing potential problems that can arise with the recommended materials and mix design. The specific variables, and the reasons for using them, are discussed in detail in the following subsections. Deicer Exposure How is it Defined The catalog does not define a criterion to classify a project location as one with deicer exposure or not. The user is expected to select this category based on past experience for the airport or other airports in the general area. Why is it Important Deicer exposure is one of the key factors that could influence the recommendations because a project built in a cold temperature environment will require attention to air void characteristics in the hardened concrete. Therefore, the recommendations include lower LOI in the fly ash, appropriate use of air entraining admixtures, and tests to verify that the required freeze-thaw resistance is achieved. These conditions also will expose the pavement to deicer chemicals during the winter. In cases where reactive aggregates are used, the catalog recommends appropriate tests to verify ASR mitigation. Aggregate Reactivity How is it Defined The catalog uses FHWA’s standards to classify aggregate reactivity (Thomas et al., 2008). This classification is based on accelerated mortar bar tests in accordance with ASTM C 1260 (also required by P-501) to be performed individually for coarse and fine aggregates. The criteria used are as follows:
• Aggregates that result in 14-day expansion less than 0.1 percent are considered non-reactive.
• Aggregates that result in 14-day expansion greater than 0.2 percent are considered reactive.
• Aggregates that result in expansions between 0.1 and 0.2 percent are potentially reactive. The user can classify such aggregates based on two options:
o Further testing is required to confirm it reactivity using the ASTM C 1293 concrete prism test, which is considered a more reliable test to determine aggregate reactivity. Aggregates that result in 1-year expansions below 0.04

Proportioning Fly Ash as Cementitious Material in Airfield Pavement Concrete Mixtures
Applied Research Associates, Inc. 33
percent can be classified as non-reactive, and those with 1-year expansions above 0.04 percent can be classified as reactive.
o A conservative approach—classifying the aggregate as reactive—may be adopted without further testing.
Note that this screening process does not examine the aggregate’s sensitivity to deicer environment and therefore uses the same protocols for projects with and without deicer exposure. Additionally, the reactivity of both coarse and fine aggregates is to be considered individually under this screening protocol. Coarse and fine aggregates may be tested separately using ASTM C 1260; this test should not be used to evaluate the job combination of coarse and fine aggregate blends. Why is it Important Aggregate reactivity is an important consideration from the standpoint of fly ash incorporation to concrete mix designs. Reactive aggregates, when used in combination with cements containing high alkalis, require fly ashes with low calcium oxide content. Additionally, material tests to confirm the mitigation of ASR need to be performed for selecting the optimum fly ash replacement level. The test procedure depends on the project’s exposure to deicer chemicals. In deicer environments, the material test should evaluate if ASR damage is exacerbated in the presence of deicers. Cement Type How is it Defined The catalog classifies cements as low alkali and high alkali cements—those with alkali content of less than 0.6 percent are classified as low alkali cements, and those with 0.6 percent or greater are classified as high alkali cements. These reports typically are provided by the cement vendor. Why is it Important The alkali content of the cement is critical, particularly in combination with the reactivity of the aggregates, so that appropriate ASR mitigation strategies may be recommended for mix optimization. Cements that increase the ASR potential (i.e., in combination with reactive aggregates) require the use of low oxide fly ash and higher replacement levels for ASR resistance. Additionally, the catalog recommends material tests to verify ASR expansion control for high alkali cements used with reactive aggregates. In projects with deicer exposure, tests evaluate if ASR damage is aggravated in the presence of deicer chemicals. Opening Time Requirements How is it Defined Opening time requirements are classified as quick or non-critical. Quick opening time refers to projects that need to be opened to traffic at 14 days and, therefore, have early age strength

Proportioning Fly Ash as Cementitious Material in Airfield Pavement Concrete Mixtures
34
requirements. Projects that need conventional opening to traffic times and those that specify only 28-day strength requirements are classified as non-critical under this category. Why is it Important As fly ash replacements generally tend to slow strength gain, the level of replacement can be critical for projects with early opening requirements. The tests recommended should track strength gain characteristics rather than the conventional 28-day strength. Construction practices and other mix design considerations also are critical to early strength development. Projects, especially those placed in cold paving weather, require the use of curing blankets or autogeneous curing. Paving Weather How is it Defined In the catalog, paving weather is classified as cool (below 60 °F), moderate (between 60 and 80 °F), or hot (above 80 °F). Why is it Important This parameter can be significant for fly ash replacement levels. Cooler paving weathers should use lower fly ash replacement rates, and hot paving weathers can afford high replacement rates from a strength gain standpoint. Especially in combination with quick opening time, cooler paving will require the use of set accelerators for the mix design as well as curing blankets and extended curing regimes. 3.2.2 Recommendations for Fly Ash Properties Information provided in this section forms the recommendation for mix optimization and is not a user-defined parameter for the project. The recommended fly ash properties are included here. The recommendations for fly ash include the chemical and physical properties as well as the substitution level. Listed below are the categories for fly ash recommendations and the reasons for the approach adopted. Calcium Oxide The calcium oxide content has been identified as one of the primary indicators of the reactivity of a fly ash. The recommendations provided for the calcium oxide content for fly ash are provided in three categories:
• Low – defined as calcium oxide levels below 10 percent. • Moderate – defined as calcium oxide levels between 10 and 20 percent. • High – defined as calcium oxide levels above 20 percent.
The ranges selected for each level of calcium oxide contents are comparable to the CSA standards, and more conservative than the 2010 revisions. Using data from various fly ash sources in North America, a comparison of calcium oxide contents in relation to their mineralogical properties, suggests that the chosen range will provide a more meaningful

Proportioning Fly Ash as Cementitious Material in Airfield Pavement Concrete Mixtures
Applied Research Associates, Inc. 35
grouping from the standpoint of ASR mitigation (see Table 1 and Table 2). This was verified during the case studies validation and laboratory validations. These ranges also are consistent with recommendations for resistance to sulfate attack (Tikalsky and Carrasquillo, 1993). Fineness The ASTM C 618 requirements limit the fines passing the 45μm sieve (#325 sieve) to 34 percent, which is met consistently by commercial current fly ash producers. In most cases, this parameter is not above 20 percent in current fly ash supplies in North America. The impact of fineness is pronounced for particles finer than 10μm, and the literature review suggests this parameter needs to be evaluated in combination with other parameters, such as the LOI. While this is theoretically the right approach, it was not possible to account for this effect fully in the development of the catalog. Standard reports do not provide the particle size distribution or the percent retained on smaller sieve sizes. This category was therefore classified into three groups, and this information can be obtained from a fly ash vendor:
• Coarse. • Fine. • Fine ground.
Loss on Ignition LOI is an important consideration in characterizing fly ash materials and in understanding the impact of fly ash on performance, especially in obtaining the air void characteristics required of concrete pavements in a freeze-thaw environment. LOI are classified as follows:
• Low – LOI less than 2 percent. • Moderate – LOI between 2 and 6 percent. • High – LOI greater than 6 percent.
Recommended Substitution Level This is one of the key recommendations in optimizing the concrete mix design with fly ash. Fly ash replacement levels are classified as:
• Low – replacement below 15 percent. • Moderate – replacement between 15 and 30 percent. • High – replacement between 30 and 50 percent. • Very high – replacement greater than 50 percent.
3.2.3 Recommendations for Admixtures and Curing Recommendations for appropriate use of admixtures and curing practices are provided in this section.

Proportioning Fly Ash as Cementitious Material in Airfield Pavement Concrete Mixtures
36
Admixtures The recommendations consider the need for the following admixtures:
• Air entraining agent. • Water reducer. • Set accelerating admixture.
These recommendations do not specify the admixture brands and dosages required to meet air content, workability, or strength requirements. Trial batching and laboratory testing are used to further verify the effectiveness and compatibility of the admixtures selected for specific projects. The catalog merely intends to lead the user to the mix design issues to consider for specific project conditions. Curing Practices The recommendations consider the need for the following curing regimes:
• Wet normal curing. • Wet extended curing. • Curing blankets/autogeneous curing.
The intent of these recommendations is to remind the user that extra attention to curing may be required, depending on the combination of fly ash replacement recommendation, paving weather, and opening time requirements for the project. 3.2.4 Recommendations for Standard Tests A major aspect of the mix optimization catalog is the battery if recommended tests. It is to be recognized that the catalog does not provide a final answer as to what replacement should be used in the project. Instead, for a given combination of project conditions, the catalog recommends the most feasible replacement level—low, moderate, high, or very high. Each level is associated with a specific range of replacement rates. Within the range of replacement recommended, the user is expected to select three replacement rates for trial batches and laboratory testing to select the optimum replacement rate. The catalog directs the user to the most appropriate set of tests depending on the project conditions and the other fly ash recommendations provided for the trial batches. The standard tests are grouped into four broad categories:
• Fresh concrete tests. • Hardened concrete tests. • Mortar bar tests. • Materials review.

Proportioning Fly Ash as Cementitious Material in Airfield Pavement Concrete Mixtures
Applied Research Associates, Inc. 37
Fresh Concrete Tests The following fresh concrete tests and criteria are recommended:
• ASTM C 143 for measuring the slump of concrete to meet the P-501 specification requirements of 1 to 2 inches for side-form concrete and 0.5 to 1.5 inches for slip-form paving concrete
• ASTM C 138, ASTM C 173, or ASTM C 231 to determine the air content by gravimetric, volumetric, or pressure methods, respectively, to meet the air content requirements of the P-501 specification. Note that the air content requirements are presented in the P-501 specification as a function of exposure level and maximum aggregate size ranging from 2 percent for mild exposure and 2-inch aggregate size to 7 percent for severe exposure level and ½-inch aggregate size
• ASTM C 138 for determining the unit weight of concrete • ASTM C 403 to determine the initial and final set times of the paste. This test is not a
requirement in the P-501 specification, but it has been added to the list of recommended tests for fresh concrete because the effect on set time with varying fly ash replacements can be evaluated while selecting optimum replacement rate. Some fly ashes have a less significant impact on set time than others do and can be an important consideration in determining the exact saw time.
• ASTM C 232 to determine the bleeding in concrete. This test is not a requirement under the current P-501 specification, but it has been recommended to evaluate the effect of fly ash replacement rate on bleeding of concrete. This is critical to plan the curing regime and the time of curing after placement.
Hardened Concrete Tests The following tests and performance criteria recommended for hardened concrete:
• ASTM C 78 for measuring the flexural strength of concrete if the flexural strength criterion is used for the project consistent with the P-501 specifications. The samples for the flexural strength will be cast in accordance with ASTM C 192. The age at testing is as per project requirements. However, a 28-day strength requirement is determined for most projects.
• ASTM C 39 for compressive strength of concrete when the design strength in Item 501-3.1 is based on compressive strength. The compressive strength tests shall be performed at the same ages as the flexural strength tests, typically the 28-day strength.
• ASTM C 78 and C 39 tests are recommended to measure the strength gain rate of a concrete mix. Strength gain rates are specific to projects with early opening requirements and are recommended at 3, 7, 14, 28, and 56 days.
• ASTM C 457 to determine the air void parameters in hardened concrete. This test is not specified in the current P-501 specification, but it is recommended to ensure that the air content and air void distribution required for freeze-thaw resistance are achieved. The total air content specified in section 501-3.3 should be verified. Additionally, the entrained air content should be no less than 3 percent, and the spacing factor determined from ASTM C 457 tests should be less than 0.01 inches.

Proportioning Fly Ash as Cementitious Material in Airfield Pavement Concrete Mixtures
38
• ASTM C 666 to determine the resistance of concrete to rapid freeze-thaw. The current P-501 specification requirements of minimum durability factor of 95 percent will apply to the trial batch samples.
• ASTM C 672 to determine the scaling resistance of concrete surfaces exposed to deicing chemicals. This test is not a requirement in the current P-501 specification but is recommended to ensure that mixes recommended with higher levels of fly ash replacement do not increase the scaling potential of the concrete.
The test for elastic modulus, ASTM C 469, may also be included in the hardened concrete tests. Mortar Bar Tests The following mortar tests are recommended for the trial batches:
• Standard ASTM C 1567 using 1N NaOH as the soak solution to determine the ASR potential for the combined cementitious materials and aggregate. Mortar bars, one with coarse aggregate and one with fine aggregate, are to be tested independently. This is not a required test in the current specifications but is recommended in the mix optimization catalog to assess the collective impact of the cement, fly ash at the recommended replacement rate, and the aggregate in mitigating ASR when the project is not exposed to deicer chemicals.
• Refer to FAA’s most current policy on mitigation testing. At the time of the publication of this report, the Modified ASTM C 1567 was considered an interim test to screen aggregates for ASR potential and mitigating deicer distress potential simultaneously (ACPA, 2011). This involves performing the ASTM C 1567 test using 3M KAc + 1N NaOH as the soak solution and measuring mortar bar expansions at the end of 14 days. It is assumed that each aggregate either has been screened already or will be screened concurrently for freeze-thaw durability.
NOTE: As of April 2011, the Modified ASTM C 1567 (ACPA, 2011) is preferred over the discontinued EB-70 test. Note that the EB-70 was the current document at the time the testing was accomplished under the current IPRF 06-2 project. Therefore, the validations from the laboratory test plan and the case studies used results from the EB-70 test protocol. Materials Review The following tests are used to review the materials being used:
• ASTM C 150 for cement. • ASTM C 311 and C 618 for fly ash. • ASTM C 1260, C 1293, C 295, C 227, and C 289 for aggregates.
3.2.5 Sulfate Check This section provides a check to the final recommendations from the mix optimization catalog to ensure they can provide the necessary resistance to sulfate attack if the project is exposed to a

Proportioning Fly Ash as Cementitious Material in Airfield Pavement Concrete Mixtures
Applied Research Associates, Inc. 39
sulfate environment. Table 9 provides a summary of the specific recommendations for three different sulfate exposure levels.
Table 9. Fly ash recommendations for sulfate exposure
SULFATE EXPOSURE
RECOMMENDATIONS
Cement type and fly ash
Fly ash calcium oxide Fineness Additional test
required
No Follow recommendations from catalog for project conditions None
Moderate Type I cement with Class F ash or Type II cement
Low oxide only Fine or fine ground ASTM C 1012
Severe Type II cement with Class F fly ash
Low oxide only Fine or fine ground ASTM C 1012
3.3 USING THE MIX DESIGN OPTIMIZATION CATALOG 3.3.1 Using the Catalog The mix optimization catalog includes 48 different sheets, each representing a unique combination of the 5 categories of project conditions. Sample catalog sheets are shown in Figure 7 through Figure 10. The primary recommendations in the catalog are highlighted in green, and the secondary recommendations are highlighted in yellow. Figure 7 shows the recommendations for a project in a deicer exposure environment with reactive aggregates, high alkali cement, non-critical opening time, and paved in moderate temperature conditions. These conditions generally would represent fairly tight control both from the standpoint of ASR mitigation and strength gain. For these specific conditions, the mix optimization catalog suggests:
• The fly ash should: o Have a calcium oxide in the low range. o Be fine or fine ground. o Have an LOI in the low range. o Be incorporated at a replacement level most likely in the high range and possibly
in the moderate range. • The admixtures for the mix include air entraining agent, water reducer, and set
accelerator. • Wet extended curing should be provided for the high replacement rate and a wet-normal
curing may be adequate for the moderate replacement rate.

Proportioning Fly Ash as Cementitious Material in Airfield Pavement Concrete Mixtures
40
• Fresh concrete tests should be performed for slump, air content, unit weight, set time, and bleeding.
• Hardened concrete tests should be performed for routine strength determination, air void content, rapid freeze-thaw resistance and scaling resistance.
• Mortar bar testing should be performed to examine the concrete’s resistance to ASR in a deicer environment.
As discussed in several sections of the report thus far, the recommended oxide, fineness, and LOI levels are set to address ASR mitigation and air void characteristics required for a freeze-thaw environment. Additionally, the high replacement rate is selected for ASR resistance. The user is expected to test trial batches at three replacement rates between 30 to 50 percent—say, 30, 40, and 50 percent. Air entraining agent is recommended as an admixture to ensure the air content requirements are met, especially in a mix that uses the high fly ash replacement level. This will in turn require the use of a water reducer as well as a set accelerator to ensure reasonable set times. Note that, among the tests listed in Figure 7, the standard tests to verify resistance to rapid freeze-thaw and resistance to deicer scaling are recommended because of the high fly ash replacement rates. Although this is considered the most appropriate range of fly ash replacement for these conditions, the trial batches might reveal that the catalog recommendation does not meet performance requirements. For example, the high replacement rate might successfully mitigate ASR but pose issues with air content or strength gain considerations. In such cases, the user might explore the moderate replacement level of 15 to 30 percent. Also, in the event the high replacement level is not the favored alternative, the project might benefit from using the moderate replacement level. In trial batches using the moderate fly ash replacement level, higher rates of replacement in the moderate range, say 25 to 30 percent, might be more appropriate for the project to derive the full benefits associated with ASR mitigation. Note that the catalog also suggests that wet-normal curing may be used with the lower replacement level. Likewise, the option of using moderate level LOI in the fly ash can be a possibility if it is more economical for the project, as 2 to 6 percent LOI might be able to provide the air content requirements for the project.
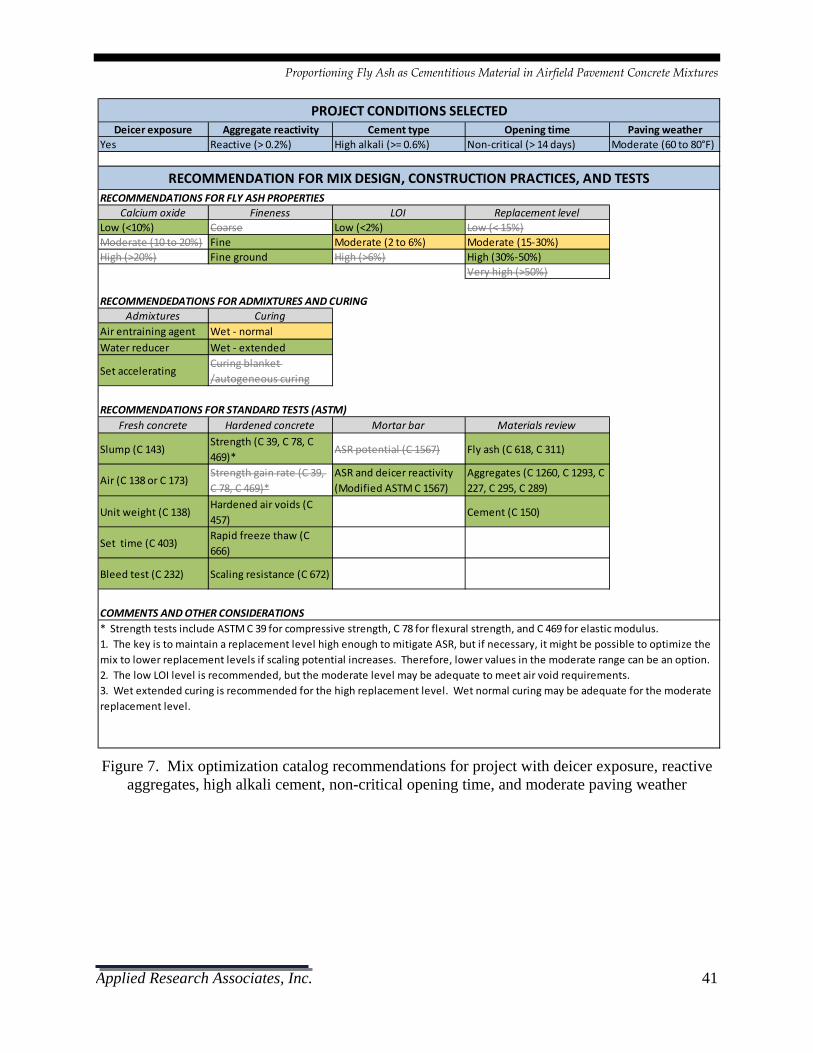
Proportioning Fly Ash as Cementitious Material in Airfield Pavement Concrete Mixtures
Applied Research Associates, Inc. 41
Figure 7. Mix optimization catalog recommendations for project with deicer exposure, reactive
aggregates, high alkali cement, non-critical opening time, and moderate paving weather
Deicer exposure Aggregate reactivity Cement type Opening time Paving weatherYes Reactive (> 0.2%) High alkali (>= 0.6%) Non‐critical (> 14 days) Moderate (60 to 80°F)
RECOMMENDATIONS FOR FLY ASH PROPERTIESCalcium oxide Fineness LOI Replacement level
Low (<10%) Coarse Low (<2%) Low (< 15%)Moderate (10 to 20%) Fine Moderate (2 to 6%) Moderate (15‐30%)High (>20%) Fine ground High (>6%) High (30%‐50%)
Very high (>50%)
RECOMMENDEDATIONS FOR ADMIXTURES AND CURINGAdmixtures Curing
Air entraining agent Wet ‐ normalWater reducer Wet ‐ extended
Set acceleratingCuring blanket /autogeneous curing
RECOMMENDATIONS FOR STANDARD TESTS (ASTM)Fresh concrete Hardened concrete Mortar bar Materials review
Slump (C 143)Strength (C 39, C 78, C 469)*
ASR potential (C 1567) Fly ash (C 618, C 311)
Air (C 138 or C 173)Strength gain rate (C 39, C 78, C 469)*
ASR and deicer reactivity (Modified ASTM C 1567)
Aggregates (C 1260, C 1293, C 227, C 295, C 289)
Unit weight (C 138)Hardened air voids (C 457)
Cement (C 150)
Set time (C 403)Rapid freeze thaw (C 666)
Bleed test (C 232) Scaling resistance (C 672)
COMMENTS AND OTHER CONSIDERATIONS
RECOMMENDATION FOR MIX DESIGN, CONSTRUCTION PRACTICES, AND TESTS
PROJECT CONDITIONS SELECTED
* Strength tests include ASTM C 39 for compressive strength, C 78 for flexural strength, and C 469 for elastic modulus.1. The key is to maintain a replacement level high enough to mitigate ASR, but if necessary, it might be possible to optimize the mix to lower replacement levels if scaling potential increases. Therefore, lower values in the moderate range can be an option.2. The low LOI level is recommended, but the moderate level may be adequate to meet air void requirements.3. Wet extended curing is recommended for the high replacement level. Wet normal curing may be adequate for the moderate replacement level.

Proportioning Fly Ash as Cementitious Material in Airfield Pavement Concrete Mixtures
42
Figure 8. Mix optimization catalog recommendations for project with deicer exposure, reactive
aggregates, high alkali cement, quick opening time, and moderate paving weather
Deicer exposure Aggregate reactivity Cement type Opening time Paving weatherYes Reactive (> 0.2%) High alkali (>= 0.6%) Quick (< 14 days) Moderate (60 to 80°F)
RECOMMENDATIONS FOR FLY ASH PROPERTIESCalcium oxide Fineness LOI Replacement level
Low (<10%) Coarse Low (<2%) Low (< 15%)Moderate (10 to 20%) Fine Moderate (2 to 6%) Moderate (15‐30%)High (>20%) Fine ground High (>6%) High (30%‐50%)
Very high (>50%)
RECOMMENDEDATIONS FOR ADMIXTURES AND CURINGAdmixtures Curing
Air entraining agent Wet ‐ normalWater reducer Wet ‐ extended
Set acceleratingCuring blanket /autogeneous curing
RECOMMENDATIONS FOR STANDARD TESTS (ASTM)Fresh concrete Hardened concrete Mortar bar Materials review
Slump (C 143)Strength (C 39, C 78, C 469)*
ASR potential (C 1567) Fly ash (C 618, C 311)
Air (C 138 or C 173)Strength gain rate (C 39, C 78, C 469)*
ASR and deicer reactivity (Modified ASTM C 1567)
Aggregates (C 1260, C 1293, C 227, C 295, C 289)
Unit weight (C 138)Hardened air voids (C 457)
Cement (C 150)
Set time (C 403)Rapid freeze thaw (C 666)
Bleed test (C 232) Scaling resistance (C 672)
COMMENTS AND OTHER CONSIDERATIONS
RECOMMENDATION FOR MIX DESIGN, CONSTRUCTION PRACTICES, AND TESTS
PROJECT CONDITIONS SELECTED
* Strength tests include ASTM C 39 for compressive strength, C 78 for flexural strength, and C 469 for elastic modulus.1. The key is to maintain a replacement level high enough to mitigate ASR but low enough to meet opening strength requirements. Therefore, lower values in the high replacement range or higher values in the moderate range can be optimal. If early strength gain is a concern, increasing the total cementitious content may also be considered. 2. Wet extended curing is recommended for the high replacement level. 3. The high replacement level might increase scaling potential. ASTM C 672 and C 666 are recommended for this level.4. The low LOI level is recommended, but the moderate level may be adequate to meet air void requirements.

Proportioning Fly Ash as Cementitious Material in Airfield Pavement Concrete Mixtures
Applied Research Associates, Inc. 43
Figure 9. Mix optimization catalog recommendations for project with deicer exposure, reactive
aggregates, low alkali cement, quick opening time, and moderate paving weather
Deicer exposure Aggregate reactivity Cement type Opening time Paving weatherYes Reactive (> 0.2%) Low alkali (< 0.6%) Quick (< 14 days) Moderate (60 to 80°F)
RECOMMENDATIONS FOR FLY ASH PROPERTIESCalcium oxide Fineness LOI Replacement level
Low (<10%) Coarse Low (<2%) Low (< 15%)Moderate (10 to 20%) Fine Moderate (2 to 6%) Moderate (15‐30%)High (>20%) Fine ground High (>6%) High (30%‐50%)
Very high (>50%)
RECOMMENDEDATIONS FOR ADMIXTURES AND CURINGAdmixtures Curing
Air entraining agent Wet ‐ normalWater reducer Wet ‐ extended
Set acceleratingCuring blanket /autogeneous curing
RECOMMENDATIONS FOR STANDARD TESTS (ASTM)Fresh concrete Hardened concrete Mortar bar Materials review
Slump (C 143)Strength (C 39, C 78, C 469)*
ASR potential (C 1567) Fly ash (C 618, C 311)
Air (C 138 or C 173)Strength gain rate (C 39, C 78, C 469)*
ASR and deicer reactivity (Modified ASTM C 1567)
Aggregates (C 1260, C 1293, C 227, C 295, C 289)
Unit weight (C 138)Hardened air voids (C 457)
Cement (C 150)
Set time (C 403)Rapid freeze thaw (C 666)
Bleed test (C 232) Scaling resistance (C 672)
COMMENTS AND OTHER CONSIDERATIONS
RECOMMENDATION FOR MIX DESIGN, CONSTRUCTION PRACTICES, AND TESTS
PROJECT CONDITIONS SELECTED
* Strength tests include ASTM C 39 for compressive strength, C 78 for flexural strength, and C 469 for elastic modulus.1. The high replacement level might increase scaling potential. ASTM C 672 and C 666 are recommended for this level of replacement, but strength gain may be a concern to meet opening strength requirements at this level.2. The low LOI level is recommended, but the moderate level may be adequate to meet air void requirements.3. If early strength gain is a concern, increasing the total cementitious content may also be considered.4. Wet extended curing is recommended for the high replacement level. Wet normal curing may be adequate for the moderate replacement level.

Proportioning Fly Ash as Cementitious Material in Airfield Pavement Concrete Mixtures
44
Figure 10. Mix optimization catalog recommendations for project with no deicer exposure, non-reactive aggregates, low alkali cement, non-critical opening time, and moderate paving weather
Deicer exposure Aggregate reactivity Cement type Opening time Paving weatherNo Non‐reactive (<0.1%) Low alkali (< 0.6%) Non‐critical (> 14 days) Moderate (60 to 80°F)
RECOMMENDATIONS FOR FLY ASH PROPERTIESCalcium oxide Fineness LOI Replacement level
Low (<10%) Coarse Low (<2%) Low (< 15%)Moderate (10 to 20%) Fine Moderate (2 to 6%) Moderate (15‐30%)High (>20%) Fine ground High (>6%) High (30%‐50%)
Very high (>50%)
RECOMMENDEDATIONS FOR ADMIXTURES AND CURINGAdmixtures Curing
Air entraining agent Wet ‐ normalWater reducer Wet ‐ extended
Set acceleratingCuring blanket /autogeneous curing
RECOMMENDATIONS FOR STANDARD TESTS (ASTM)Fresh concrete Hardened concrete Mortar bar Materials review
Slump (C 143)Strength (C 39, C 78, C 469)*
ASR potential (C 1567) Fly ash (C 618, C 311)
Air (C 138 or C 173)Strength gain rate (C 39, C 78, C 469)*
ASR and deicer reactivity (Modified ASTM C 1567)
Aggregates (C 1260, C 1293, C 227, C 295, C 289)
Unit weight (C 138)Hardened air voids (C 457)
Cement (C 150)
Set time (C 403)Rapid freeze thaw (C 666)
Bleed test (C 232) Scaling resistance (C 672)
COMMENTS AND OTHER CONSIDERATIONS
RECOMMENDATION FOR MIX DESIGN, CONSTRUCTION PRACTICES, AND TESTS
PROJECT CONDITIONS SELECTED
* Strength tests include ASTM C 39 for compressive strength, C 78 for flexural strength, and C 469 for elastic modulus.1. A wide range of replacement levels is feasible for these project conditions. While high and very high replacement levels are recommended, other project‐specific considerations can make the moderate replacement level an option.2. Wet extended curing is recommended for high and very high replacement levels.3. Preferably use the low or moderate calcium oxide levels. For the high level examine tendency for rapid set, which may be retarded with the addition of gypsum to the mix. Mix optimization may be more involved in this case.

Proportioning Fly Ash as Cementitious Material in Airfield Pavement Concrete Mixtures
Applied Research Associates, Inc. 45
Figure 8 shows the mix optimization catalog’s recommendation for the same project conditions except for an early opening requirement. The recommendations are more or less the same except that the primary recommendation for fly ash replacement level is moderate to accommodate early opening requirements (i.e., higher rate of strength gain). Also note that a laboratory test to track the strength gain rate is an additional requirement for these project conditions. Higher strength gain rates are promoted on field with the recommendation of curing blankets for elevated temperatures to accelerate hydration. The catalog recommendation shown in Figure 8 also suggests a secondary replacement level of high in case the moderate level of replacement is not sufficient to mitigate ASR. With the increased replacement level, the tests to ensure resistance to freeze-thaw and deicer scaling are part of the laboratory test recommendations. Also, note the recommendation for extended wet curing with the high replacement level. As shown in these figures, changing one project parameter at a time can help evaluate the effect of the change on mix design recommendations. It also can help the user understand the impact of changing fly ash properties and replacement rates on mix workability, durability, or strength. For example, if the project conditions selected in Figure 8 are modified and the use of low alkali cement is an option, the recommendations, as shown in Figure 9, will not focus as much on the ASR potential of the mix. As indicated in Figure 9, the catalog will permit the use of moderate CaO fly ash and coarse fly ash. Figure 10 represents the recommendations for a much less stringent set of project conditions—no deicer exposure, low alkali cement, non-reactive aggregates, non-critical opening time, and moderate paving weather. The catalog allows a wide range of substitution levels and fly ash properties. A minimal set of tests is recommended, as the project does not pose a threat for ASR issues and strength gain rate is not critical for the opening time requirements. 3.3.2 Mix Optimization Using the Catalog The catalog provides multiple combinations of materials and fly ash properties feasible for a given project location. The mix optimization process is iterative, requiring the user to make judicious choices in selecting the optimum combination of materials, most likely based on cost-effectiveness or the contractor’s familiarity in working with a certain set of materials. The optimization process cannot be generalized, as it depends on the outcome of the materials used and the test results obtained. The process broadly involves the following steps (also illustrated in Figure 11): Step 1 – Assess Project Conditions: Understand the project conditions that can impact the selection of materials and the fly ash replacement level. This includes, within the scope of the catalog:
• Whether the pavement will be exposed to deicer chemicals and freeze-thaw cycles. • Whether the project has early opening requirements. • Paving weather.

Proportioning Fly Ash as Cementitious Material in Airfield Pavement Concrete Mixtures
46
Figure 11. Steps involved in the mix optimization procedure
6. REVIEW DATA AND SELECT OPTIMUM
STEP 4. MIX DESIGN FOR TRIAL BATCHES
START
YES
NO
STEP 1. ASSESS PROJECT CONDITIONSa. Deicer exposureb. Opening time requirementsc. Paving weather
STEP 2. SELECT MATERIALSa. Select preferred aggregates, cement, fly
ash (cost‐effective or local materials)b. Select alternatives/options
REFER MIX OPTIMIZATION CATALOG FOR
RECOMMENDED REPLACEMENT RANGE
STEP 3. REVIEW MATERIALSa. Determine coarse and fine aggregate reactivity individuallyb. Determine alkalinity of cementc. Determine fly ash class, oxide level, fineness category, LOI
5. SELECT REPLACEMENT RATES AND TESTa. Select three replacement rates b. Perform recommended tests
Does selected fly ash meet criteria? Is
curing regime feasible?
CHANGE MATERIALSSee details in report for suggested changes.
NO
Define boundary conditions from test data (See table 10)
Does feasible mix design exist?7. SELECT OPTIMUM
a. Select optimum fly ash replacementb. Retest at optimum to verify
DONE
YES NO
CHANGE MATERIALSSee details in report for suggested changes
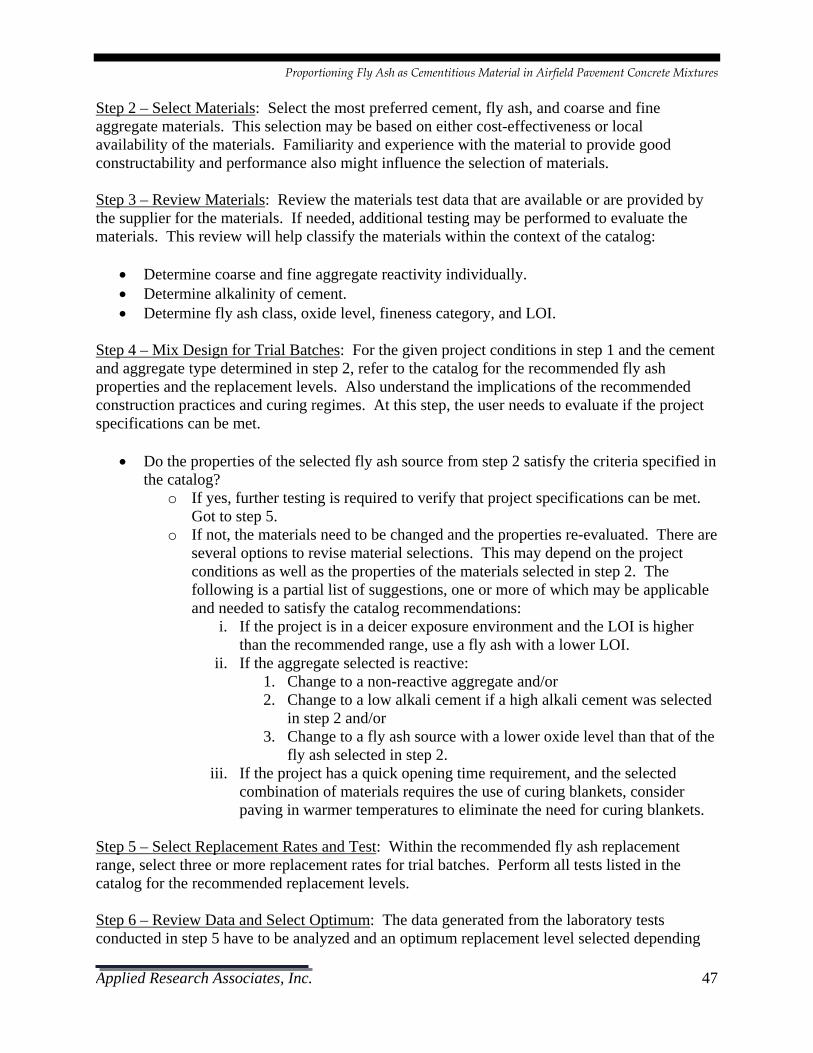
Proportioning Fly Ash as Cementitious Material in Airfield Pavement Concrete Mixtures
Applied Research Associates, Inc. 47
Step 2 – Select Materials: Select the most preferred cement, fly ash, and coarse and fine aggregate materials. This selection may be based on either cost-effectiveness or local availability of the materials. Familiarity and experience with the material to provide good constructability and performance also might influence the selection of materials. Step 3 – Review Materials: Review the materials test data that are available or are provided by the supplier for the materials. If needed, additional testing may be performed to evaluate the materials. This review will help classify the materials within the context of the catalog:
• Determine coarse and fine aggregate reactivity individually. • Determine alkalinity of cement. • Determine fly ash class, oxide level, fineness category, and LOI.
Step 4 – Mix Design for Trial Batches: For the given project conditions in step 1 and the cement and aggregate type determined in step 2, refer to the catalog for the recommended fly ash properties and the replacement levels. Also understand the implications of the recommended construction practices and curing regimes. At this step, the user needs to evaluate if the project specifications can be met.
• Do the properties of the selected fly ash source from step 2 satisfy the criteria specified in the catalog?
o If yes, further testing is required to verify that project specifications can be met. Got to step 5.
o If not, the materials need to be changed and the properties re-evaluated. There are several options to revise material selections. This may depend on the project conditions as well as the properties of the materials selected in step 2. The following is a partial list of suggestions, one or more of which may be applicable and needed to satisfy the catalog recommendations:
i. If the project is in a deicer exposure environment and the LOI is higher than the recommended range, use a fly ash with a lower LOI.
ii. If the aggregate selected is reactive: 1. Change to a non-reactive aggregate and/or 2. Change to a low alkali cement if a high alkali cement was selected
in step 2 and/or 3. Change to a fly ash source with a lower oxide level than that of the
fly ash selected in step 2. iii. If the project has a quick opening time requirement, and the selected
combination of materials requires the use of curing blankets, consider paving in warmer temperatures to eliminate the need for curing blankets.
Step 5 – Select Replacement Rates and Test: Within the recommended fly ash replacement range, select three or more replacement rates for trial batches. Perform all tests listed in the catalog for the recommended replacement levels. Step 6 – Review Data and Select Optimum: The data generated from the laboratory tests conducted in step 5 have to be analyzed and an optimum replacement level selected depending

Proportioning Fly Ash as Cementitious Material in Airfield Pavement Concrete Mixtures
48
on the performance criteria applicable for each project. As shown in Table 10, the data should be evaluated to determine the boundaries or the minimum and maximum replacement rates that are feasible for a given set of materials.
• The maximum fly ash content that exceeds the flexural strength at the specified age(s). • The maximum fly ash content that has acceptable set time characteristics for
constructability. • The minimum fly ash content that limits 14-day mortar bar expansion below 0.1 percent
when tested as appropriate for deicer and non-deicer environments. • The maximum fly ash content that still provides adequate freeze-thaw and scaling
durability. • The minimum/maximum fly ash content that yields an acceptable mix cost depending on
the unit cost of the selected fly ash and the hauling costs.
Table 10. Criteria to determine feasible range of fly ash replacement for a given set of materials
Percentage fly ash
replacement
Selection criteria for mix design optimization Flexural strength
(and other strength
parameters)1
Set time2
ASR mitigation3
Freeze-thaw resistance for deicer
environment4
Scaling resistance
5 Cost6
Setting feasible range
Minimum * * Minimum
for feasible range7
Maximum * * * * * Maximum for feasible
range7 NOTES 1. Based on ASTM C 78 strength tests and strength gain tests as recommended. 2. Based on ASTM C 403. 3. Based on ASTM C 1567 for non-deicer environment and Modified ASTM C 1567 for deicer environment. Applicable only for reactive aggregates. 4. Based on ASTM C 457 and ASTM C 666 as recommended. Applicable only for deicer exposure environments. 5. Based on ASTM C 672 and applicable only for deicer exposure environments. 6. Cost-effectiveness is project-specific 7. If MIN is greater than MAX, change materials and iterate. Go back to step 2.
Next, evaluate if a feasible replacement range can be determined based on the criteria listed in Table 10:
• For the feasible range determined here, if the minimum is below the maximum, an optimum value within the feasible range may be selected. Go to step 7.
• If the materials selected do not satisfy the test criteria, or if the minimum is higher than the maximum in the feasible range, this set of materials cannot be combined in the proportions used in the trial batches. The user may change the materials selected for the project to meet test criteria and return to step 2. Again, there exist multiple options for

Proportioning Fly Ash as Cementitious Material in Airfield Pavement Concrete Mixtures
Applied Research Associates, Inc. 49
changing mix design materials, and this depends on the project conditions and the specific tests that did not meet requirements. The following is a partial list of suggestions, one or more of which may be applicable:
o If set time is not acceptable, try incorporating a set accelerator. o If strength at 28 days or strength gain is not satisfactory, try using a combination
of materials or a paving weather which allows a lower fly ash replacement rate or increase the total cementitious content. If reactive aggregates are used necessitating higher replacement rates of low oxide fly ash for ASR mitigation, consider using non-reactive aggregates. Or, if high alkali cement is used in combination with reactive aggregates, then use low alkali cement that might allow lower fly ash replacement rates to meet strength criteria.
o If ASR mitigation is not achieved with the maximum fly ash replacement rate (often controlled by strength requirements), consider changing to a non-reactive aggregate source and/or reducing the alkalinity of the cement. Similar considerations apply if the material does not meet scaling resistance requirements.
o If freeze-thaw resistance is not achieved, then consider increasing the air entraining agent dosage and/or use a fly ash with lower LOI. Additionally, if freeze-thaw resistance is not achieved due to the use of a high replacement rate of low oxide fly ash for ASR mitigation, then consider using non-reactive aggregates or reduce the alkalinity of the cement as explained above.
o If resistance to rapid freeze-thaw is not achieved, consider changing to better quality aggregates.
Step 7 – Select Optimum: Select an optimum level of fly ash replacement for the given set of materials based on the results from Table 10. Rebatch at the optimum level and verify results from all laboratory tests recommended in the catalog.

Proportioning Fly Ash as Cementitious Material in Airfield Pavement Concrete Mixtures
50
This page is intentionally left blank.

Proportioning Fly Ash as Cementitious Material in Airfield Pavement Concrete Mixtures
Applied Research Associates, Inc. 51
CHAPTER 4. AIRPORT PROJECT CASE STUDIES
4.1 SELECTION OF CASE STUDIES Six airfield projects were identified as case studies that could be used to evaluate and validate the guidelines developed under this study. The case studies provide a fairly wide range of parameters considered in the catalog—fly ash mineralogy, chemical composition and physical properties, cement alkalinity, aggregate reactivity, paving weather conditions, deicer exposure, opening time, and fly ash replacement levels. Additionally, in many instances, the projects selected were extended into the laboratory testing program designed to validate the catalog. Therefore, in the selection of case studies, every attempt was made to include the projects for which the materials (or very comparable materials) were available for use in the laboratory study. Hence, in many ways, the findings from the case studies were corroborated with laboratory test results and doubly verified for the accuracy of the catalog. 4.2 DETAILS OF CASE STUDIES The following projects were selected for the case studies:
• Project A: Airport in Colorado that used fly ash successfully and pavement shows good performance.
• Project B: Airport in Colorado that used fly ash and extensive early failures were observed.
• Project C: Airport in Washington that used high fly ash replacement level but had constructability problems.
• Project D: Airport project in California that used laboratory testing to determine fly ash replacements to achieve good durability.
• Project E: Airport project in Alaska that used laboratory testing to determine optimum fly ash content to meet specifications.
• Project F: Airport in Arizona that eliminated fly ash from the mix design and is experiencing durability problems.
As shown in Figure 12, these projects are located in both freeze-thaw and non freeze-thaw environments. They also utilized both Class C and Class F fly ashes. None of these projects had sulfate exposure issues to verify in the validation process. As stated earlier, 4 of these projects were included in the laboratory testing plan. Materials from projects identified as A, B, C, and F were procured for the laboratory tests.

Proportioning Fly Ash as Cementitious Material in Airfield Pavement Concrete Mixtures
52
Figure 12. States with airport projects selected for case studies
4.2.1 Airport A – Airport in Colorado with Good Performance This project was paved in 2006 and replaced a badly deteriorated pavement. The mix design information provided by the contractor is presented Table 11. This concrete is classified as Class P concrete by the Colorado Department of Transportation. Cores were extracted from this pavement for petrographic analysis. Results of the petrographic analysis are included in the appendix. The mix design was Type I-II cement and 30 percent Class F ash. The aggregates used were reactive aggregates. The cement used in the mix design had an alkali content of 0.55 percent and can be categorized as a low-alkali cement (below 0.6 percent) per ASTM C 150. Tests on the fly ash showed that it had moderate oxide levels (10 to 20 percent) with a low LOI. Chemical analysis was performed by the fly ash vendor as well as an independent laboratory, and they respectively determined oxide levels of 11.3 and 10.62 percent and LOIs of 0.46 and 0.23 percent. The coarse aggregate used in this project was categorized as reactive with ASR potential based on the conventional ASTM C 1260 mortar bar tests. The results from the ASTM C 1260 tests were not available for review under the current study. For the combined aggregate and cementitious materials blend (including the 30 percent fly ash), the expansion was found to be 0.07 percent at 30 days and 0.03 percent at 16 days when tested under the ASTM C 1567 test procedure. The EB-70 test was performed for mortar bars using 6M potassium acetate solution for soaking the samples. (Note that the EB-70 test procedure has since been discontinued but was current at the time of this project construction.) Under this test,
CO
WA
AZ
CA
AK
States from where airfield projects were case studies
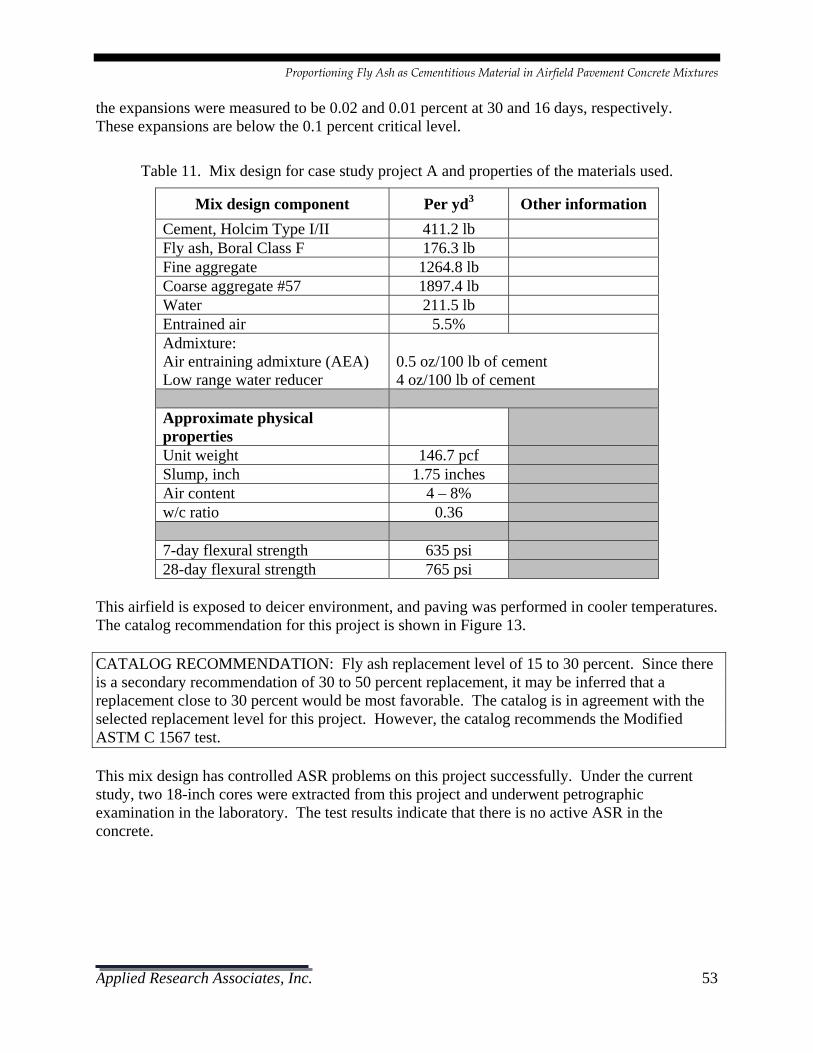
Proportioning Fly Ash as Cementitious Material in Airfield Pavement Concrete Mixtures
Applied Research Associates, Inc. 53
the expansions were measured to be 0.02 and 0.01 percent at 30 and 16 days, respectively. These expansions are below the 0.1 percent critical level.
Table 11. Mix design for case study project A and properties of the materials used.
Mix design component Per yd3 Other information Cement, Holcim Type I/II 411.2 lb Fly ash, Boral Class F 176.3 lb Fine aggregate 1264.8 lb Coarse aggregate #57 1897.4 lb Water 211.5 lb Entrained air 5.5% Admixture: Air entraining admixture (AEA) Low range water reducer
0.5 oz/100 lb of cement 4 oz/100 lb of cement
Approximate physical properties
Unit weight 146.7 pcf Slump, inch 1.75 inches Air content 4 – 8% w/c ratio 0.36 7-day flexural strength 635 psi 28-day flexural strength 765 psi
This airfield is exposed to deicer environment, and paving was performed in cooler temperatures. The catalog recommendation for this project is shown in Figure 13. CATALOG RECOMMENDATION: Fly ash replacement level of 15 to 30 percent. Since there is a secondary recommendation of 30 to 50 percent replacement, it may be inferred that a replacement close to 30 percent would be most favorable. The catalog is in agreement with the selected replacement level for this project. However, the catalog recommends the Modified ASTM C 1567 test. This mix design has controlled ASR problems on this project successfully. Under the current study, two 18-inch cores were extracted from this project and underwent petrographic examination in the laboratory. The test results indicate that there is no active ASR in the concrete.
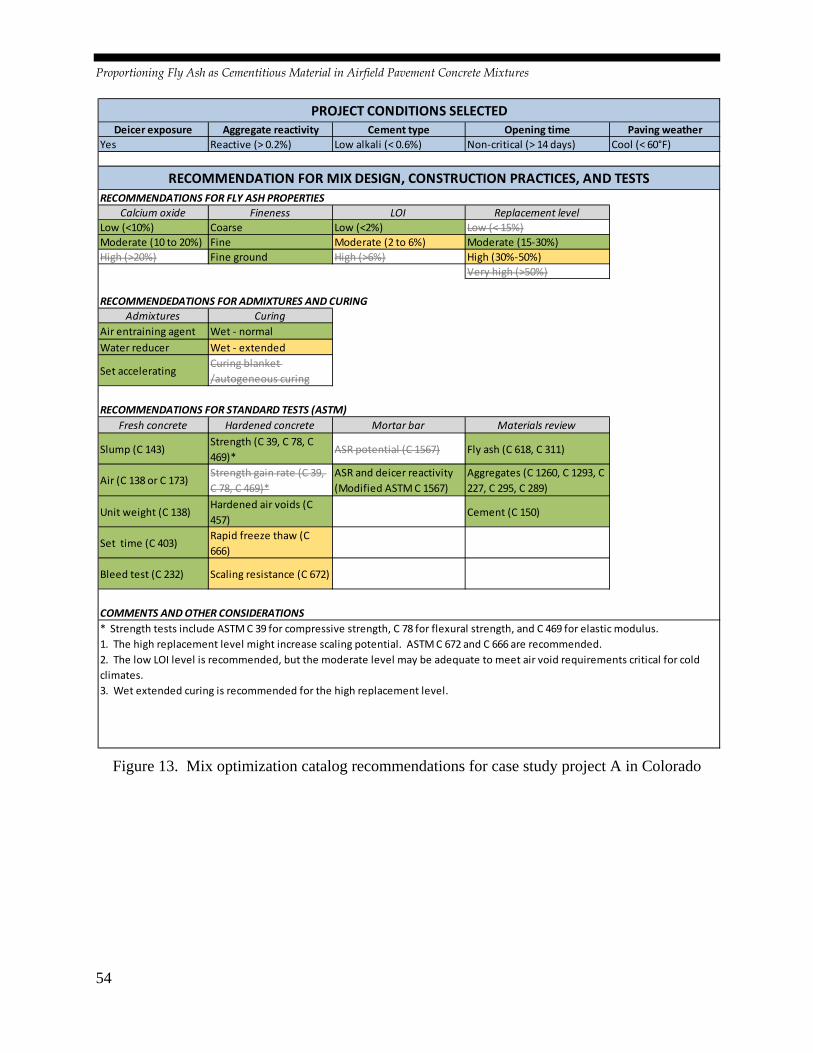
Proportioning Fly Ash as Cementitious Material in Airfield Pavement Concrete Mixtures
54
Figure 13. Mix optimization catalog recommendations for case study project A in Colorado
Deicer exposure Aggregate reactivity Cement type Opening time Paving weatherYes Reactive (> 0.2%) Low alkali (< 0.6%) Non‐critical (> 14 days) Cool (< 60°F)
RECOMMENDATIONS FOR FLY ASH PROPERTIESCalcium oxide Fineness LOI Replacement level
Low (<10%) Coarse Low (<2%) Low (< 15%)Moderate (10 to 20%) Fine Moderate (2 to 6%) Moderate (15‐30%)High (>20%) Fine ground High (>6%) High (30%‐50%)
Very high (>50%)
RECOMMENDEDATIONS FOR ADMIXTURES AND CURINGAdmixtures Curing
Air entraining agent Wet ‐ normalWater reducer Wet ‐ extended
Set acceleratingCuring blanket /autogeneous curing
RECOMMENDATIONS FOR STANDARD TESTS (ASTM)Fresh concrete Hardened concrete Mortar bar Materials review
Slump (C 143)Strength (C 39, C 78, C 469)*
ASR potential (C 1567) Fly ash (C 618, C 311)
Air (C 138 or C 173)Strength gain rate (C 39, C 78, C 469)*
ASR and deicer reactivity (Modified ASTM C 1567)
Aggregates (C 1260, C 1293, C 227, C 295, C 289)
Unit weight (C 138)Hardened air voids (C 457)
Cement (C 150)
Set time (C 403)Rapid freeze thaw (C 666)
Bleed test (C 232) Scaling resistance (C 672)
COMMENTS AND OTHER CONSIDERATIONS
RECOMMENDATION FOR MIX DESIGN, CONSTRUCTION PRACTICES, AND TESTS
PROJECT CONDITIONS SELECTED
* Strength tests include ASTM C 39 for compressive strength, C 78 for flexural strength, and C 469 for elastic modulus.1. The high replacement level might increase scaling potential. ASTM C 672 and C 666 are recommended.2. The low LOI level is recommended, but the moderate level may be adequate to meet air void requirements critical for cold climates.3. Wet extended curing is recommended for the high replacement level.

Proportioning Fly Ash as Cementitious Material in Airfield Pavement Concrete Mixtures
Applied Research Associates, Inc. 55
4.2.2 Airport B – Airport in Colorado with Poor Performance This project was paved in 1991. Based on the information collected under this study, it was clear the aggregates used were tested to meet specification requirements for gradation, specific gravity/absorption, abrasion resistance, lightweight pieces, sodium sulfate soundness, and clay lumps and friable particles. The mix design used Type I LA cement manufactured by Holcim with 8 percent Class C high oxide fly ash replacement. The cement conformed to ASTM C 150 and had an alkali content of 0.31 percent, which falls under the low alkali content category in the catalog. The aggregates were considered to be reactive. This airfield pavement has performed very poorly and has been the subject of investigation under several studies. The pavement showed early signs of distress that was attributed to ASR damage and D-cracking. This pavement was visually surveyed under the current study prior to its reconstruction in fall 2009. The surface condition of this pavement is shown in Figure 14. The presence of ASR and perhaps D-cracking was quite evident on this runway in 2009. Cores from this pavement were extracted for petrographic analysis. Results of the petrographic analysis (included in the appendix) indicate that there is no evidence of ASR. The coarse and fine aggregates appear to be non-reactive.
Figure 14. Surface condition of pavement in airport B
This project was suitable to verify if the catalog recommends a different fly ash type or replacement level that could have prevented some of the observed distresses in the pavement. The catalog recommendation for this project is shown in Figure 15. CATALOG RECOMMENDATION: Low or moderate oxide fly ash at replacement level of 15 to 30 percent, and possibly higher replacement rates to mitigate durability problems. Therefore, the mix design used in the project is not in agreement with the catalog. Indirectly, this confirms the validity of the catalog recommendations for low oxide levels and higher replacement rates for the fly ash to curb ASR damage.
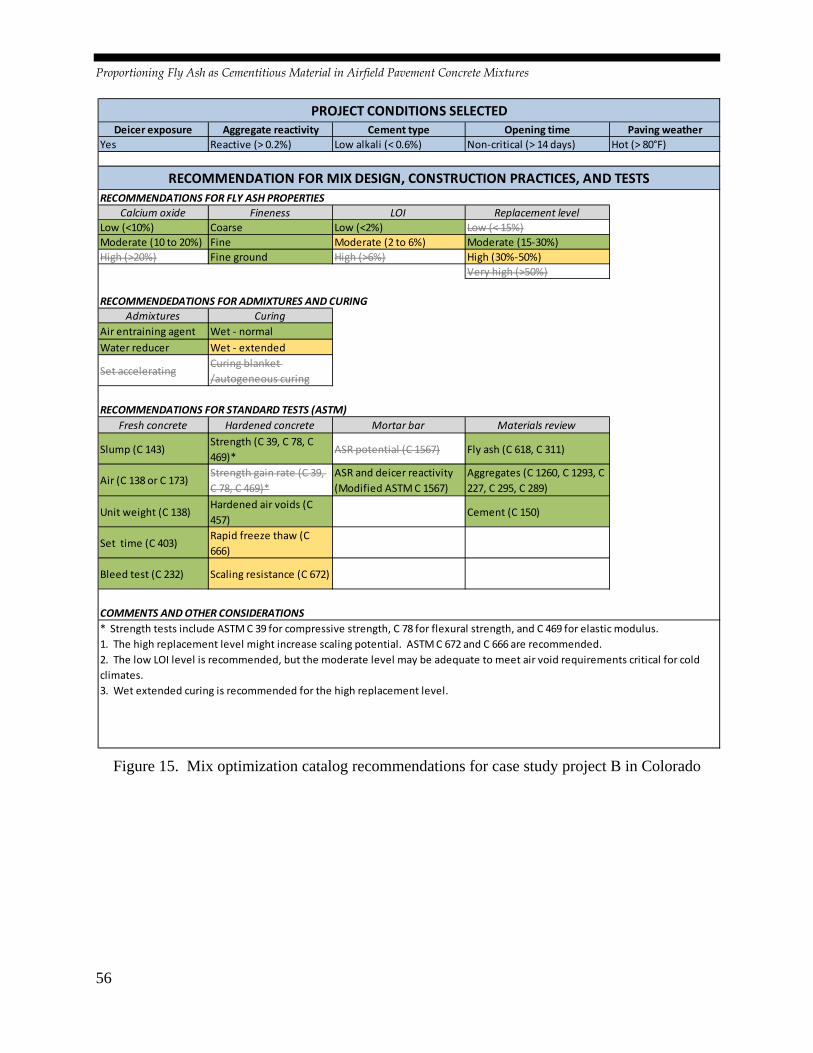
Proportioning Fly Ash as Cementitious Material in Airfield Pavement Concrete Mixtures
56
Figure 15. Mix optimization catalog recommendations for case study project B in Colorado
Deicer exposure Aggregate reactivity Cement type Opening time Paving weatherYes Reactive (> 0.2%) Low alkali (< 0.6%) Non‐critical (> 14 days) Hot (> 80°F)
RECOMMENDATIONS FOR FLY ASH PROPERTIESCalcium oxide Fineness LOI Replacement level
Low (<10%) Coarse Low (<2%) Low (< 15%)Moderate (10 to 20%) Fine Moderate (2 to 6%) Moderate (15‐30%)High (>20%) Fine ground High (>6%) High (30%‐50%)
Very high (>50%)
RECOMMENDEDATIONS FOR ADMIXTURES AND CURINGAdmixtures Curing
Air entraining agent Wet ‐ normalWater reducer Wet ‐ extended
Set acceleratingCuring blanket /autogeneous curing
RECOMMENDATIONS FOR STANDARD TESTS (ASTM)Fresh concrete Hardened concrete Mortar bar Materials review
Slump (C 143)Strength (C 39, C 78, C 469)*
ASR potential (C 1567) Fly ash (C 618, C 311)
Air (C 138 or C 173)Strength gain rate (C 39, C 78, C 469)*
ASR and deicer reactivity (Modified ASTM C 1567)
Aggregates (C 1260, C 1293, C 227, C 295, C 289)
Unit weight (C 138)Hardened air voids (C 457)
Cement (C 150)
Set time (C 403)Rapid freeze thaw (C 666)
Bleed test (C 232) Scaling resistance (C 672)
COMMENTS AND OTHER CONSIDERATIONS
RECOMMENDATION FOR MIX DESIGN, CONSTRUCTION PRACTICES, AND TESTS
PROJECT CONDITIONS SELECTED
* Strength tests include ASTM C 39 for compressive strength, C 78 for flexural strength, and C 469 for elastic modulus.1. The high replacement level might increase scaling potential. ASTM C 672 and C 666 are recommended.2. The low LOI level is recommended, but the moderate level may be adequate to meet air void requirements critical for cold climates.3. Wet extended curing is recommended for the high replacement level.

Proportioning Fly Ash as Cementitious Material in Airfield Pavement Concrete Mixtures
Applied Research Associates, Inc. 57
4.2.3 Airport C – Airport in Washington Several mix designs for this project were tested under a separate contract. The mix design referred to in this case study is one used for the apron construction in 2004. The aggregates at this site are from a volcanic source and were considered reactive when tested under ASTM C 1260. The cement was Type I-II cement with a low alkali content and produced by Lafarge in Richmond, Washington. The alkali content for the cement was determined as 0.50 percent in laboratory tests. The mill certification from Lafarge reported it as 0.46 percent. The fly ash was Class F from Edmonton, Alberta, with 9 percent calcium oxide and LOI of 0.5 percent. This qualifies as a low oxide ash with a low LOI. For the mix design using no fly ash, the mortar bar test expansion was at 0.4 percent. Using a 70/30 blend of cement and fly ash, the expansion was reduced to below 0.10 percent when tested using the ASTM C 1567 test procedure. For the purpose of validating the catalog, other project details selected included deicer exposure environment and cool paving weather. Project reports indicate that the paving was performed at 50 °F. A non-critical opening time was assumed. The catalog recommendation for this project is presented in Figure 16. CATALOG RECOMMENDATION: 15 to 30 percent replacement for non-critical opening time when a low oxide fly ash with a low LOI is used. The catalog is in agreement with this mix design. During the construction of this project, a few construction issues had to be addressed with the high fly ash replacement rate used. There were issues with edge slump and strength gain. The use of admixtures in the original paving mix is not clear. Therefore, it also is recommended that the samples be cured at a temperature representative of the paving conditions so that strength gain determinations can represent in-situ conditions.

Proportioning Fly Ash as Cementitious Material in Airfield Pavement Concrete Mixtures
58
Figure 16. Mix optimization catalog recommendations for case study project C in Washington
4.2.4 Airport D – Airport in California This project used a Type II-V LA cement manufactured by California Portland Cement Company and a Class F fly ash from Gallup Fly Ash. The cement was certified to have an alkali content of 0.57 percent. There was also the option of using a high alkali cement with an alkali content of 1 percent. The fly ash had a low oxide level with a calcium oxide content of 4.78 percent. The fly ash can be considered coarse grained, and it had a low LOI of 0.28. The aggregates were considered reactive.
Deicer exposure Aggregate reactivity Cement type Opening time Paving weatherYes Reactive (> 0.2%) Low alkali (< 0.6%) Non‐critical (> 14 days) Cool (< 60°F)
RECOMMENDATIONS FOR FLY ASH PROPERTIESCalcium oxide Fineness LOI Replacement level
Low (<10%) Coarse Low (<2%) Low (< 15%)Moderate (10 to 20%) Fine Moderate (2 to 6%) Moderate (15‐30%)High (>20%) Fine ground High (>6%) High (30%‐50%)
Very high (>50%)
RECOMMENDEDATIONS FOR ADMIXTURES AND CURINGAdmixtures Curing
Air entraining agent Wet ‐ normalWater reducer Wet ‐ extended
Set acceleratingCuring blanket /autogeneous curing
RECOMMENDATIONS FOR STANDARD TESTS (ASTM)Fresh concrete Hardened concrete Mortar bar Materials review
Slump (C 143)Strength (C 39, C 78, C 469)*
ASR potential (C 1567) Fly ash (C 618, C 311)
Air (C 138 or C 173)Strength gain rate (C 39, C 78, C 469)*
ASR and deicer reactivity (Modified ASTM C 1567)
Aggregates (C 1260, C 1293, C 227, C 295, C 289)
Unit weight (C 138)Hardened air voids (C 457)
Cement (C 150)
Set time (C 403)Rapid freeze thaw (C 666)
Bleed test (C 232) Scaling resistance (C 672)
COMMENTS AND OTHER CONSIDERATIONS
RECOMMENDATION FOR MIX DESIGN, CONSTRUCTION PRACTICES, AND TESTS
PROJECT CONDITIONS SELECTED
* Strength tests include ASTM C 39 for compressive strength, C 78 for flexural strength, and C 469 for elastic modulus.1. The high replacement level might increase scaling potential. ASTM C 672 and C 666 are recommended.2. The low LOI level is recommended, but the moderate level may be adequate to meet air void requirements critical for cold climates.3. Wet extended curing is recommended for the high replacement level.

Proportioning Fly Ash as Cementitious Material in Airfield Pavement Concrete Mixtures
Applied Research Associates, Inc. 59
The selection of cement type and fly ash replacement level was determined through a series of ASTM C 1567 mortar bar tests to verify expansion at 14 days. Both the low and high alkali cements, as well as replacement levels of 0 and 25 percent, were used in the tests. Expansion levels were brought down from 0.4 percent (high alkali cement without fly ash) to 0.024 percent (low alkali cement with 25 percent replacement). Also, the high alkali cement with 25 percent fly ash replacement reduced the expansion to 0.12 percent, and the low alkali cement with no fly ash had an expansion of 0.28 percent. The final mix design selected used a 15 percent replacement without the use of a water reducer. The catalog recommendation for this project is shown in Figure 17. CATALOG RECOMMENDATION: 15 to 50 percent fly ash replacement. The catalog offers other construction considerations depending on the time of paving. The recommendation of 15 to 30 percent replacement applies regardless of the opening time requirements. Higher replacements recommend a water reducer. The catalog is in agreement with this mix design. 4.2.5 Airport E – Airport in Alaska This project used Type I-II cement and 25 percent Class F ash. The project is in a deicer exposure environment. The aggregates were tested for reactivity under expansion tests at different fly ash replacement levels based on the ASTM C 1567 test. It was determined that the aggregates were reactive at 0 percent replacement and non-reactive at 25 percent replacement. The fly ash used was a Class F ash with a moderate oxide level of 11 percent, low LOI of 0.22, and can be considered fine. This project involved very detailed material tests and mix design evaluations, including strength gain tests to track the compressive strength and flexural strength at 7, 14, and 28 days. Strength gain at w/c ratios of 0.27, 0.33, and 0.37 were evaluated. The w/c ratio required to produce a 720 psi flexural strength was selected from the analyses of strength data. However, most importantly, ASR durability test results were the primary consideration in selecting the fly ash replacement level. The mix design used for paving did not use a set retarder or accelerator. An air entraining agent and a water reducer were used. The catalog recommendation for this project is shown in Figure 18. CATALOG RECOMMENDATION: 15 to 30 percent fly ash replacement regardless of opening time requirements. The catalog is in agreement with this mix design. However, note that the catalog recommends the Modified ASTM C 1567 test.

Proportioning Fly Ash as Cementitious Material in Airfield Pavement Concrete Mixtures
60
Figure 17. Mix optimization catalog recommendations for case study project D in California
Deicer exposure Aggregate reactivity Cement type Opening time Paving weatherNo Reactive (> 0.2%) Low alkali (< 0.6%) Non‐critical (> 14 days) Moderate (60 to 80°F)
RECOMMENDATIONS FOR FLY ASH PROPERTIESCalcium oxide Fineness LOI Replacement level
Low (<10%) Coarse Low (<2%) Low (< 15%)Moderate (10 to 20%) Fine Moderate (2 to 6%) Moderate (15‐30%)High (>20%) Fine ground High (>6%) High (30%‐50%)
Very high (>50%)
RECOMMENDEDATIONS FOR ADMIXTURES AND CURINGAdmixtures Curing
Air entraining agent Wet ‐ normalWater reducer Wet ‐ extended
Set acceleratingCuring blanket /autogeneous curing
RECOMMENDATIONS FOR STANDARD TESTS (ASTM)Fresh concrete Hardened concrete Mortar bar Materials review
Slump (C 143)Strength (C 39, C 78, C 469)*
ASR potential (C 1567) Fly ash (C 618, C 311)
Air (C 138 or C 173)Strength gain rate (C 39, C 78, C 469)*
ASR and deicer reactivity (Modified ASTM C 1567)
Aggregates (C 1260, C 1293, C 227, C 295, C 289)
Unit weight (C 138)Hardened air voids (C 457)
Cement (C 150)
Set time (C 403)Rapid freeze thaw (C 666)
Bleed test (C 232) Scaling resistance (C 672)
COMMENTS AND OTHER CONSIDERATIONS
RECOMMENDATION FOR MIX DESIGN, CONSTRUCTION PRACTICES, AND TESTS
PROJECT CONDITIONS SELECTED
* Strength tests include ASTM C 39 for compressive strength, C 78 for flexural strength, and C 469 for elastic modulus.1. Strength requirements will need to be evaluated for replacements in the very high range.2. Wet normal curing may be adequate for the moderate replacement level. However, wet extended curing is recommended for the high and very high replacement levels.

Proportioning Fly Ash as Cementitious Material in Airfield Pavement Concrete Mixtures
Applied Research Associates, Inc. 61
Figure 18. Mix optimization catalog recommendations for case study project E in Alaska
4.2.6 Airport F – Airport in Arizona Concrete produced in the desert southwest uses river gravels often as sources of sand and gravel. These sources frequently contain siliceous particles vulnerable to ASR. Although State Departments of Transportation in the region have not identified ASR in structures and bridges, the potential for material-related distress exists. Low alkali cements are used routinely in the
Deicer exposure Aggregate reactivity Cement type Opening time Paving weatherYes Reactive (> 0.2%) Low alkali (< 0.6%) Non‐critical (> 14 days) Cool (< 60°F)
RECOMMENDATIONS FOR FLY ASH PROPERTIESCalcium oxide Fineness LOI Replacement level
Low (<10%) Coarse Low (<2%) Low (< 15%)Moderate (10 to 20%) Fine Moderate (2 to 6%) Moderate (15‐30%)High (>20%) Fine ground High (>6%) High (30%‐50%)
Very high (>50%)
RECOMMENDEDATIONS FOR ADMIXTURES AND CURINGAdmixtures Curing
Air entraining agent Wet ‐ normalWater reducer Wet ‐ extended
Set acceleratingCuring blanket /autogeneous curing
RECOMMENDATIONS FOR STANDARD TESTS (ASTM)Fresh concrete Hardened concrete Mortar bar Materials review
Slump (C 143)Strength (C 39, C 78, C 469)*
ASR potential (C 1567) Fly ash (C 618, C 311)
Air (C 138 or C 173)Strength gain rate (C 39, C 78, C 469)*
ASR and deicer reactivity (Modified ASTM C 1567)
Aggregates (C 1260, C 1293, C 227, C 295, C 289)
Unit weight (C 138)Hardened air voids (C 457)
Cement (C 150)
Set time (C 403)Rapid freeze thaw (C 666)
Bleed test (C 232) Scaling resistance (C 672)
COMMENTS AND OTHER CONSIDERATIONS
RECOMMENDATION FOR MIX DESIGN, CONSTRUCTION PRACTICES, AND TESTS
PROJECT CONDITIONS SELECTED
* Strength tests include ASTM C 39 for compressive strength, C 78 for flexural strength, and C 469 for elastic modulus.1. The high replacement level might increase scaling potential. ASTM C 672 and C 666 are recommended.2. The low LOI level is recommended, but the moderate level may be adequate to meet air void requirements critical for cold climates.3. Wet extended curing is recommended for the high replacement level.

Proportioning Fly Ash as Cementitious Material in Airfield Pavement Concrete Mixtures
62
area, as is Class F fly ash. A recent study by the Arizona Department of Transportation (Van Dam & Peshkin, 2009) identified the need for more rigorous material testing and specifications to allow the use of performance-specified cements in concrete mix designs. A paving project at a major metropolitan airport built over 15 years ago is experiencing advanced ASR distress in a pavement. These distresses were observed when the pavement was a little over 14 years old. A value engineering proposal accepted during the project construction eliminated fly ash from the mix design, increasing the likelihood of ASR. It appears the primary reason for eliminating fly ash and boosting the cement factor was a concern for strength development, as the project had a critical opening time requirement. The observed distresses are considered extensive, and some sections have been scheduled for replacement. For the new mix design, extensive concrete tests have been performed, including verification for mortar bar expansions based on ASTM C 1260 as well as 1-year beam expansions from ASTM C 1293. The standard mix design incorporating fly ash that was planned originally but was not used on the project paving job is presented in Table 12. The mix design used for paving used no fly ash replacement. The catalog recommendation for this project is shown in Figure 19. CATALOG RECOMMENDATION: 15 to 30 percent fly ash replacement, and possibly a higher replacement along with the use of a water reducer in the mix design. Also note the requirement to verify strength gain rate and the recommendation for extended curing. The catalog is in agreement with this mix design and indirectly explains the material-related distresses observed on the field.
Table 12. Original mix design intended for airfield in Arizona Mix design component Batch weights per yd3 Other Mix Details
Cement, Type II Clarkdale 411 lb w/c ratio = 0.34 Slump = 1.25 inch Air content = 2.8% Unit weight = 147 pcf Initial set time = 3:41 hours Final set time = 5:53 hours Air temperature = 94 °F Mix temperature = 90 °F 7-day flexural strength = 615 psi 14- day flexural strength = 660 psi 21-day flexural strength = 690 psi 28-day flexural strength = 735 psi
Fly ash, Cholla Class F 176 lb (30% replacement)
Water 235
Fine aggregates 1213
Coarse aggregate #67 1092
Coarse aggregate #4 842
BASF PaveAir (AEA) 4.4 oz
BASF MasterPave (water reducer) 41.8 oz
Air content % 2.8 %
NOTE: Mix design used for paving eliminated the fly ash and used 587 lb of cement
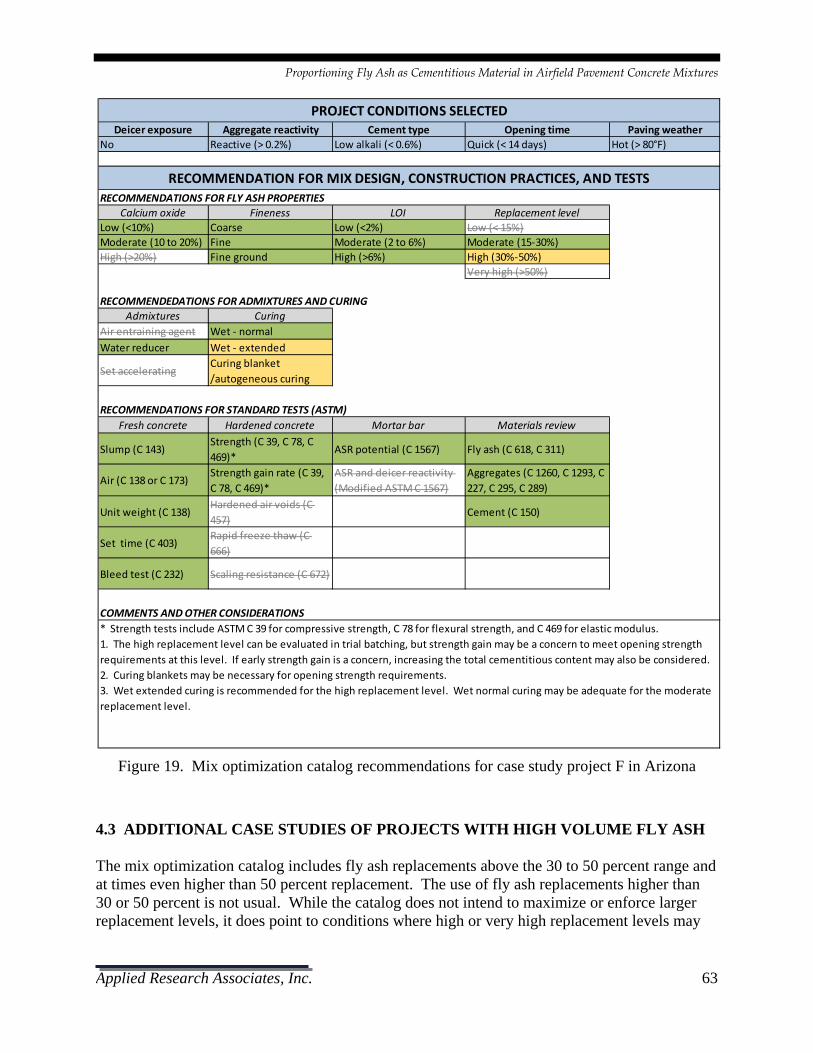
Proportioning Fly Ash as Cementitious Material in Airfield Pavement Concrete Mixtures
Applied Research Associates, Inc. 63
Figure 19. Mix optimization catalog recommendations for case study project F in Arizona
4.3 ADDITIONAL CASE STUDIES OF PROJECTS WITH HIGH VOLUME FLY ASH The mix optimization catalog includes fly ash replacements above the 30 to 50 percent range and at times even higher than 50 percent replacement. The use of fly ash replacements higher than 30 or 50 percent is not usual. While the catalog does not intend to maximize or enforce larger replacement levels, it does point to conditions where high or very high replacement levels may
Deicer exposure Aggregate reactivity Cement type Opening time Paving weatherNo Reactive (> 0.2%) Low alkali (< 0.6%) Quick (< 14 days) Hot (> 80°F)
RECOMMENDATIONS FOR FLY ASH PROPERTIESCalcium oxide Fineness LOI Replacement level
Low (<10%) Coarse Low (<2%) Low (< 15%)Moderate (10 to 20%) Fine Moderate (2 to 6%) Moderate (15‐30%)High (>20%) Fine ground High (>6%) High (30%‐50%)
Very high (>50%)
RECOMMENDEDATIONS FOR ADMIXTURES AND CURINGAdmixtures Curing
Air entraining agent Wet ‐ normalWater reducer Wet ‐ extended
Set acceleratingCuring blanket /autogeneous curing
RECOMMENDATIONS FOR STANDARD TESTS (ASTM)Fresh concrete Hardened concrete Mortar bar Materials review
Slump (C 143)Strength (C 39, C 78, C 469)*
ASR potential (C 1567) Fly ash (C 618, C 311)
Air (C 138 or C 173)Strength gain rate (C 39, C 78, C 469)*
ASR and deicer reactivity (Modified ASTM C 1567)
Aggregates (C 1260, C 1293, C 227, C 295, C 289)
Unit weight (C 138)Hardened air voids (C 457)
Cement (C 150)
Set time (C 403)Rapid freeze thaw (C 666)
Bleed test (C 232) Scaling resistance (C 672)
COMMENTS AND OTHER CONSIDERATIONS
RECOMMENDATION FOR MIX DESIGN, CONSTRUCTION PRACTICES, AND TESTS
PROJECT CONDITIONS SELECTED
* Strength tests include ASTM C 39 for compressive strength, C 78 for flexural strength, and C 469 for elastic modulus.1. The high replacement level can be evaluated in trial batching, but strength gain may be a concern to meet opening strength requirements at this level. If early strength gain is a concern, increasing the total cementitious content may also be considered.2. Curing blankets may be necessary for opening strength requirements.3. Wet extended curing is recommended for the high replacement level. Wet normal curing may be adequate for the moderate replacement level.
Proportioning Fly Ash as Cementitious Material in Airfield Pavement Concrete Mixtures
64
be feasible while also listing the necessary construction measures and test protocols that need to be followed. The detailed case studies do not include mix designs with fly ash replacements at such high levels. This section therefore presents three highway projects that have used 50 percent fly ash replacements. One project is located in North America and three are in Asia, where high volume fly ash replacement is more common. 4.3.1 Project G in North America A high volume fly ash mix design was used in a two-lift paving project in Minnesota on a test section in 2010. The lower lift had a 60 percent fly ash replacement, and the top lift had a 15 percent fly ash replacement. Also, the lower lift utilized low cost aggregates. However, aggregates in both the lifts were non-reactive and approved by the Minnesota Department of Transportation. The two mix designs are presented in Table 13 along with standard results for fresh concrete and strength tests. The fly ash was a Class F ash from Coal Creek with low calcium oxide content. The catalog recommendation for these conditions is shown in Figure 20. The primary recommendation is the 15 to 30 percent replacement, but higher replacements may be permissible if the mix design is adjusted with the recommended admixtures and the durability of the mix is verified. Also, considering the high volume mix is used in the lower lift, scaling resistance might be less critical. No performance data on this pavement were available at the time of preparing this report. 4.3.2 Projects H, I, and J in Asia In 2002, a cement manufacturing company in India constructed two high volume fly ash test sections in the vicinity of their cement plants in North India and Western India, referred to as projects H and I. Project H was a two-lane, 12-inch-thick jointed concrete pavement carrying fairly heavy truck traffic (33,000 to 55,000 lb) hauling raw materials for the cement plant. The cement used was equivalent to a Type I cement with a Class F fly ash. A water reducer was used in the mix. The slump was maintained at below 2 inches, and paving was performed in hot weather (104 °F). The ambient temperature and the high fly ash replacement rate called for extended curing, and the slabs were water cured for 3 weeks. Project I used a very similar fly ash, mix design, and construction/curing practices. The details of the fly ash properties, mix design, and strength tests are provided in Table 14.

Proportioning Fly Ash as Cementitious Material in Airfield Pavement Concrete Mixtures
Applied Research Associates, Inc. 65
Table 13. Mix design for high volume fly ash mix used in the lower lift and the conventional fly ash concrete mix used in the upper lift (Source SHRP Project R 21, Ongoing)
Mix design component High volume fly ash mix
Conventional fly ash mix
Type I Cement, lb 240 616 Fly Ash, lb 360 109 Sand, lb 1263 843 3/8” Washed Granite Chips, lb - 843 ½” Washed Granite Chips, lb - 1133 ¾” Rock, lb (Elk river gravel) 1102 - 1-1/2” Rock, lb (Elk river gravel) 787 - Water reducer-Type A, oz (Sika 686) 6.0 14.5 Accelerator-Type C, oz (Sika Set NC) 180 - Hydration stabilizer, oz (Delvo) - 18.1 Air entraining agent, oz (Sika Multi-Air 25) 6.5 10.5 Water, lb 173 283 w/c ratio 0.29 0.39 Fresh Concrete Tests Slump initial, (after 15 min & 30 min), in 2.0 (2.0, 1.75) 2.0 (2.0, 1.75) Air initial, (after 15 min & 30 min), in 6.8 (6.0, 5.8) 6.1 (6.0, 5.7) Unit weight, pcf 147.2 143.2 Initial set, final set, hr 5:08, 7:11 6:09, 7:55 Compressive strength, psi (average of two tests)
1 day 3 days 7 days 28 days 56 days
1520 2360 3110 4110 5150
3310 5000 5660 6590 7280
Flexural strength, psi (average of two tests)
1 day 3 days 7 days 28 days 56 days
250 350 600 640 810
505 760 855 1150 1175
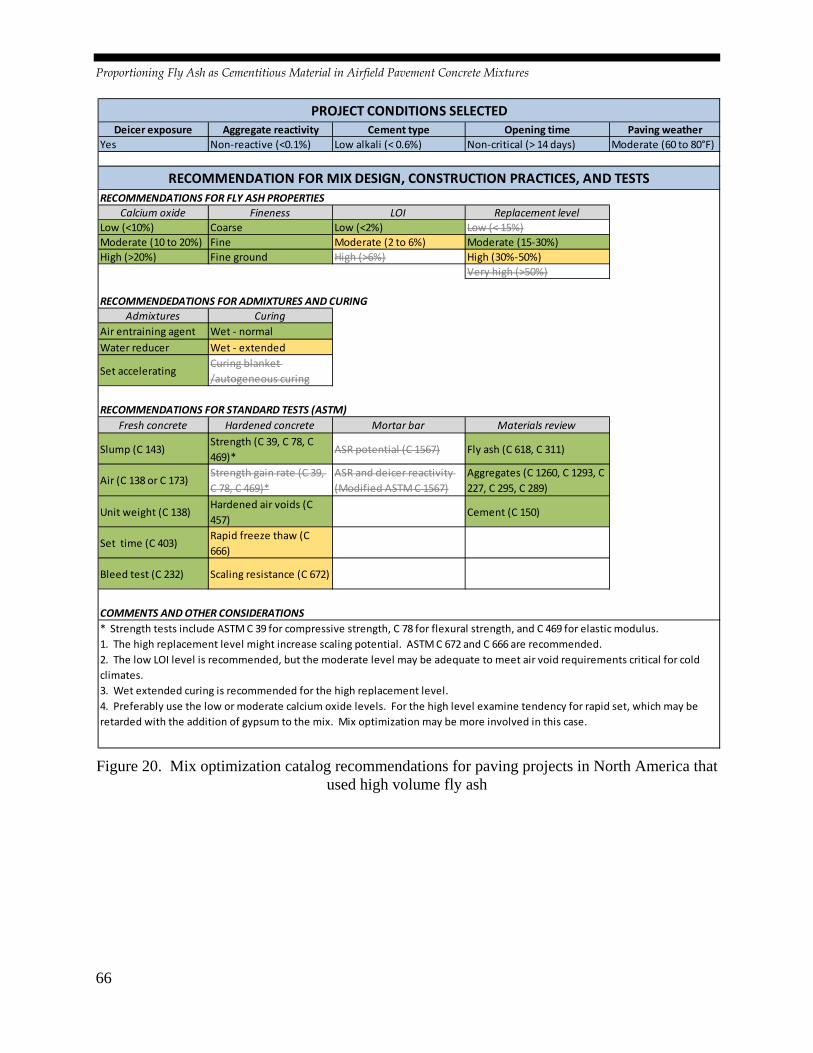
Proportioning Fly Ash as Cementitious Material in Airfield Pavement Concrete Mixtures
66
Figure 20. Mix optimization catalog recommendations for paving projects in North America that
used high volume fly ash
Deicer exposure Aggregate reactivity Cement type Opening time Paving weatherYes Non‐reactive (<0.1%) Low alkali (< 0.6%) Non‐critical (> 14 days) Moderate (60 to 80°F)
RECOMMENDATIONS FOR FLY ASH PROPERTIESCalcium oxide Fineness LOI Replacement level
Low (<10%) Coarse Low (<2%) Low (< 15%)Moderate (10 to 20%) Fine Moderate (2 to 6%) Moderate (15‐30%)High (>20%) Fine ground High (>6%) High (30%‐50%)
Very high (>50%)
RECOMMENDEDATIONS FOR ADMIXTURES AND CURINGAdmixtures Curing
Air entraining agent Wet ‐ normalWater reducer Wet ‐ extended
Set acceleratingCuring blanket /autogeneous curing
RECOMMENDATIONS FOR STANDARD TESTS (ASTM)Fresh concrete Hardened concrete Mortar bar Materials review
Slump (C 143)Strength (C 39, C 78, C 469)*
ASR potential (C 1567) Fly ash (C 618, C 311)
Air (C 138 or C 173)Strength gain rate (C 39, C 78, C 469)*
ASR and deicer reactivity (Modified ASTM C 1567)
Aggregates (C 1260, C 1293, C 227, C 295, C 289)
Unit weight (C 138)Hardened air voids (C 457)
Cement (C 150)
Set time (C 403)Rapid freeze thaw (C 666)
Bleed test (C 232) Scaling resistance (C 672)
COMMENTS AND OTHER CONSIDERATIONS
RECOMMENDATION FOR MIX DESIGN, CONSTRUCTION PRACTICES, AND TESTS
PROJECT CONDITIONS SELECTED
* Strength tests include ASTM C 39 for compressive strength, C 78 for flexural strength, and C 469 for elastic modulus.1. The high replacement level might increase scaling potential. ASTM C 672 and C 666 are recommended.2. The low LOI level is recommended, but the moderate level may be adequate to meet air void requirements critical for cold climates.3. Wet extended curing is recommended for the high replacement level.4. Preferably use the low or moderate calcium oxide levels. For the high level examine tendency for rapid set, which may be retarded with the addition of gypsum to the mix. Mix optimization may be more involved in this case.

Proportioning Fly Ash as Cementitious Material in Airfield Pavement Concrete Mixtures
Applied Research Associates, Inc. 67
Table 14. Details for projects H and I that used high volume fly ash (Malhotra & Mehta, 2008)
Project Details Project H Project I Relevant fly ash properties CaO, % 1.91 1 LOI, % 2 1.7 Lime reactivity (from Indian standard specifications for fly ash) 6.2 6.1
Mix Design Portland cement, lb/yd3 379 379 Fly ash, lb/yd3 379 379 Coarse aggregate, lb/yd3 2345 2162 Fine aggregate, lb/yd3 738 922 Normal plasticizer, oz/yd3 58 58 w/cm ratio 0.40 0.40
Compressive strength 1-day 1377.5 1334 2 days 2668 2827.5 7 days 3494.5 3697.5 28 days 6032 5800
Flexural strength 28-days 1102 986
Chloride ion penetration, coulombs 540 563 Project J is a two-lift paving project constructed in Western India in 2002. This was a two-lane street, about 1.5 miles long, through a university campus, with a total PCC thickness of 8 inches. The bottom 6-inch lift used a 50 percent fly ash mix, and the top 2-inch lift used a 30 percent fly ash concrete. Details of the mix design and strength gain test results are provided elsewhere (Desai, 2004). Comparable compressive and flexural strengths were achieved at 28 and 90 days, and the strengths achieved exceeded design strength requirements. The subject pavements in Asia are reported to show good performance overall. Project H shows signs of minor scaling in some areas. The catalog recommendations for projects H, I, and J are shown in Figure 21. For these project conditions, replacement levels in the high and very high levels are permitted by the catalog.
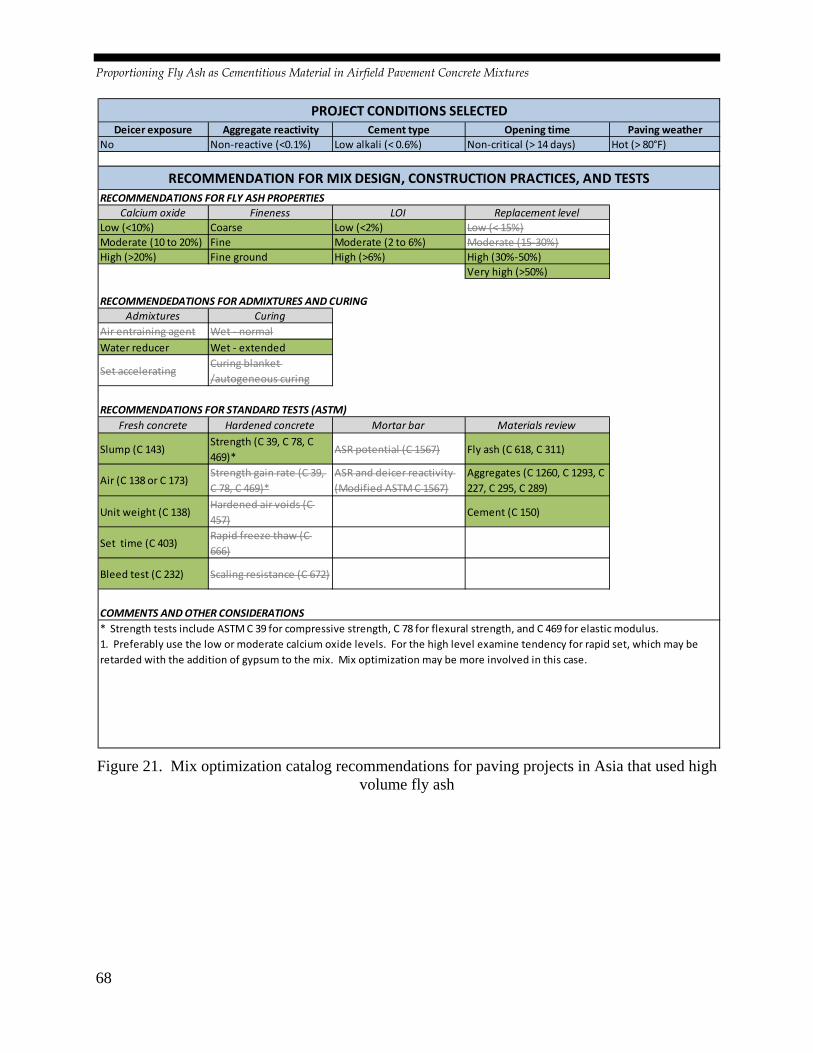
Proportioning Fly Ash as Cementitious Material in Airfield Pavement Concrete Mixtures
68
Figure 21. Mix optimization catalog recommendations for paving projects in Asia that used high
volume fly ash
Deicer exposure Aggregate reactivity Cement type Opening time Paving weatherNo Non‐reactive (<0.1%) Low alkali (< 0.6%) Non‐critical (> 14 days) Hot (> 80°F)
RECOMMENDATIONS FOR FLY ASH PROPERTIESCalcium oxide Fineness LOI Replacement level
Low (<10%) Coarse Low (<2%) Low (< 15%)Moderate (10 to 20%) Fine Moderate (2 to 6%) Moderate (15‐30%)High (>20%) Fine ground High (>6%) High (30%‐50%)
Very high (>50%)
RECOMMENDEDATIONS FOR ADMIXTURES AND CURINGAdmixtures Curing
Air entraining agent Wet ‐ normalWater reducer Wet ‐ extended
Set acceleratingCuring blanket /autogeneous curing
RECOMMENDATIONS FOR STANDARD TESTS (ASTM)Fresh concrete Hardened concrete Mortar bar Materials review
Slump (C 143)Strength (C 39, C 78, C 469)*
ASR potential (C 1567) Fly ash (C 618, C 311)
Air (C 138 or C 173)Strength gain rate (C 39, C 78, C 469)*
ASR and deicer reactivity (Modified ASTM C 1567)
Aggregates (C 1260, C 1293, C 227, C 295, C 289)
Unit weight (C 138)Hardened air voids (C 457)
Cement (C 150)
Set time (C 403)Rapid freeze thaw (C 666)
Bleed test (C 232) Scaling resistance (C 672)
COMMENTS AND OTHER CONSIDERATIONS
RECOMMENDATION FOR MIX DESIGN, CONSTRUCTION PRACTICES, AND TESTS
PROJECT CONDITIONS SELECTED
* Strength tests include ASTM C 39 for compressive strength, C 78 for flexural strength, and C 469 for elastic modulus.1. Preferably use the low or moderate calcium oxide levels. For the high level examine tendency for rapid set, which may be retarded with the addition of gypsum to the mix. Mix optimization may be more involved in this case.
Proportioning Fly Ash as Cementitious Material in Airfield Pavement Concrete Mixtures
Applied Research Associates, Inc. 69
4.4 CONCLUSIONS FROM PROJECT CASE STUDIES VALIDATION Based on the outcome of this validation effort, it is reasonable to say that the catalog recommendations are in agreement with the practices that resulted in good performance of pavements. Additionally, the catalog was validated indirectly with projects that did not provide the expected performance, largely due to the inappropriate use of fly ash. Several of these projects were extended to the laboratory testing phase of the project, as discussed in the next chapter.

Proportioning Fly Ash as Cementitious Material in Airfield Pavement Concrete Mixtures
70
This page is intentionally left blank.

Proportioning Fly Ash as Cementitious Material in Airfield Pavement Concrete Mixtures
Applied Research Associates, Inc. 71
CHAPTER 5. LABORATORY TESTING
5.1 INTRODUCTION A laboratory test plan was designed to demonstrate, using actual mix designs, the validity of the recommendations of the mix optimization catalog. In addition, the laboratory tests would also demonstrate the variability that can be expected when using different fly ash sources and substitution rates. Finally, the test results were also used to:
• Explain the observed performance of the projects considered for the case studies. • Revise the recommendations developed as needed.
5.2 LABORATORY TEST PLAN Nine mix designs were included in the laboratory tests representative of materials from various regions of the US, as shown in Figure 22. These mix designs represent mixes used in the case studies evaluated under this project or typical mixes in various regions of this country. The mix designs, identified by mix IDs 1 through 9, covered a broad range of parameters that are considered in the catalog, as listed in Table 15. The table also summarizes the cement type, aggregate reactivity, general fly ash classification (C or F), and the other project conditions the mix represents, such as deicer exposure, opening time, and paving weather.
Figure 22. States represented in the materials used in the laboratory test program; note that four
mixes tested represented materials from Colorado and two mixes were from Florida
CO
GA
FL
WA
AZ
States laboratory from where materials were tested
in the laboratory tests

Proportioning Fly Ash as Cementitious Material in Airfield Pavement Concrete Mixtures
72
Table 15. Summary of mixes included in the revised test plan
Mix ID
Case study project/ Regional materials
Exposure Aggregate type
Cement type
Opening time
Paving weather
Fly ash type
1* Project A, variant Deicer Reactive High
alkali Quick Cool F
2^ Project A Colorado Deicer Reactive Low
alkali Quick Cool F
3* Project B, Colorado Deicer Reactive Low
alkali Quick Hot C
4^ Project B variant Deicer Reactive Low
alkali Quick Hot F
5# Florida materials No deicer Non
reactive Low alkali
Non critical Moderate C
6# Florida materials variant
No deicer Non reactive
Low alkali
Non critical Moderate F
7# Georgia simulating materials
Deicer Non reactive
Low alkali
Non critical Moderate F
8^ Project C, Washington, variants
Deicer Reactive High alkali N/A N/A F
9 Project F, Arizona No deicer Reactive High
alkali N/A N/A F (moderate)
* Mix IDs refer to mixes that use original mix design of the project. ^ Mix IDs refer to mixes that have some parameters varied from the original mix design. # Mix IDs refer to mixes that are not parts of a case study but simulate materials from a specific
region where the exposure conditions are material types are valid. Shaded cells show the parameter that has been varied relative to the original mix design.
Mixes 2, 3, and 8 are mix designs from case study projects A, B, and C, respectively. Specific materials (or representative materials) used in these projects were batched for laboratory tests. Mixes 1 and 4 are variants of mixes 2 and 3, respectively. Mix 2 uses low alkali cement instead of the high alkali cement in mix 1, while mix 4 uses Class F fly ash instead of the Class C fly ash in mix 3. In addition, materials and project conditions typical of two other locations in the country have been included in the study. Mixes 5 and 7 mimic projects in Florida and Georgia, respectively. Mix 6 is a variant of mix 5 and uses Class F fly ash instead of Class C fly ash. Finally, mix 9 represents the materials specific to the case study project F in Arizona. In summary, the broad parameters relevant to freeze-thaw and ASR durability covered in the proposed test plan through the selected 9 mixes are illustrated in Figure 23. Clearly, a majority of the mixes are subject to decider exposure and reactive aggregates, which is the most critical combination of project conditions to evaluate durability-related problems.
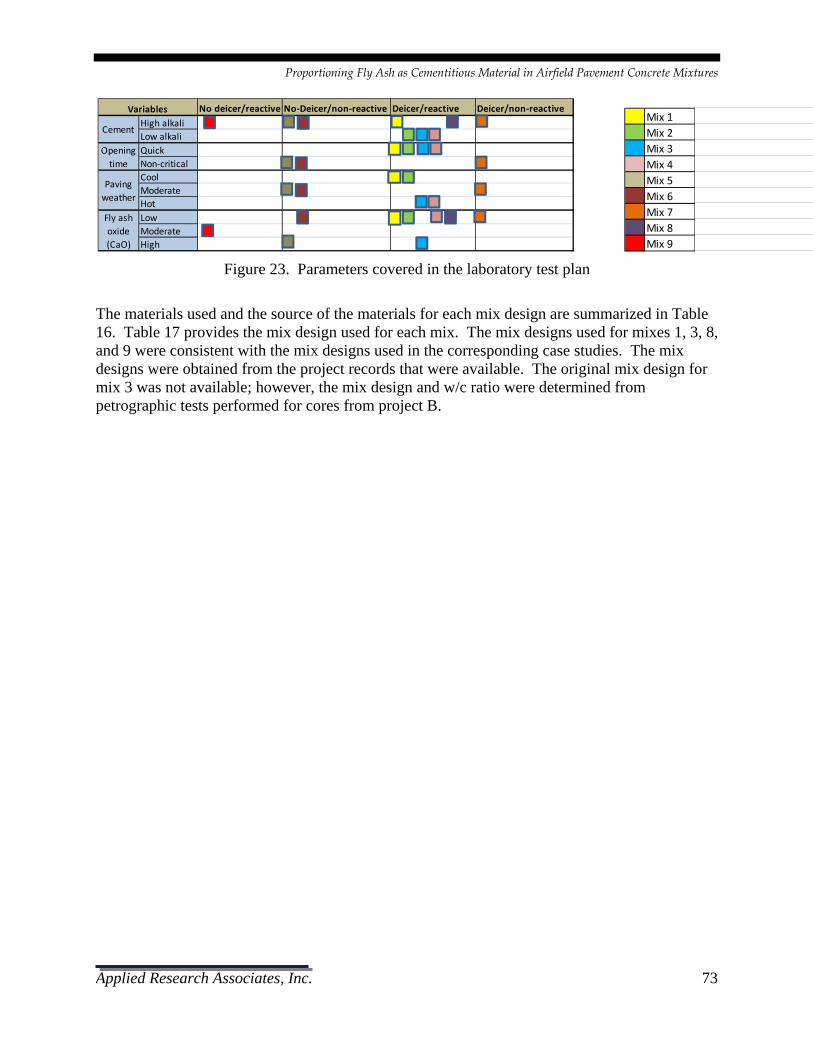
Proportioning Fly Ash as Cementitious Material in Airfield Pavement Concrete Mixtures
Applied Research Associates, Inc. 73
Figure 23. Parameters covered in the laboratory test plan
The materials used and the source of the materials for each mix design are summarized in Table 16. Table 17 provides the mix design used for each mix. The mix designs used for mixes 1, 3, 8, and 9 were consistent with the mix designs used in the corresponding case studies. The mix designs were obtained from the project records that were available. The original mix design for mix 3 was not available; however, the mix design and w/c ratio were determined from petrographic tests performed for cores from project B.
No deicer/reactive No‐Deicer/non‐reactive Deicer/reactive Deicer/non‐reactive
High alkaliLow alkaliQuickNon‐criticalCoolModerateHotLowModerateHigh
Variables
Cement
Opening time
Paving weather
Fly ash oxide (CaO)
Mix 1Mix 2Mix 3Mix 4Mix 5Mix 6Mix 7Mix 8Mix 9

Proportioning Fly Ash as Cementitious Material in Airfield Pavement Concrete Mixtures
74
Table 16. Description of materials used in the laboratory test plan
Mix
ID
Cem
ent
Fly
ash
Coa
rse
aggr
egat
e
Fine
ag
greg
ate
Adm
ixtu
re
1
Adm
ixtu
re
2
Mix 1 Holcim Type
I/II High Alkali Boral Class F
Front Range Aggregates,
Gravel
Front Range Aggregates,
Sand
GRT's Paver Plus
(water reducer)
GRT's Vinsol Resin (AEA) Mix 2
Holcim Type I/II Low Alkali
Mix 3 Holcim Type
I/II Low Alkali
Boral Class C
Parkdale Quarry
Crushed Limestone
Castle Creek, Sand
GRT's Vinsol Resin
Mix 4 Holcim Type
I/II Low Alkali
Boral Class F
Mix 5 Holcim Type
I/II Low Alkali
Portage Class C
Aggregate Industries Crushed
Limestone
Aggregate Industries,
Sand
Mix 6 Lehigh Type
I/II Low Alkali
Cumberland Class F
Aggregate Industries Crushed
Limestone
Aggregate Industries,
Sand
Mix 6 Lehigh Type
I/II Low Alkali
Beneficiated Ash
Aggregate Industries Crushed
Limestone
Aggregate Industries,
Sand
Mix 7 Holcim Type
I/II Low Alkali
Coal Creek Class F
Martin Marietta's Crushed Granite
Aggregate Industries,
Sand
GRT's Vinsol Resin
Mix 8
Lafarge's Type I/II
Low Alkali & Holcim Type I/II
High Alkali
Edmonton Low Oxide Class F &
Coal Creek Moderate
Oxide Class F
Inland Perry's Basaltic Traprock
Inland Perry's sand
Mix 9 Phoenix
Cement Type I/II
Cholla Class F
SRMG Rock% SRMG Sand
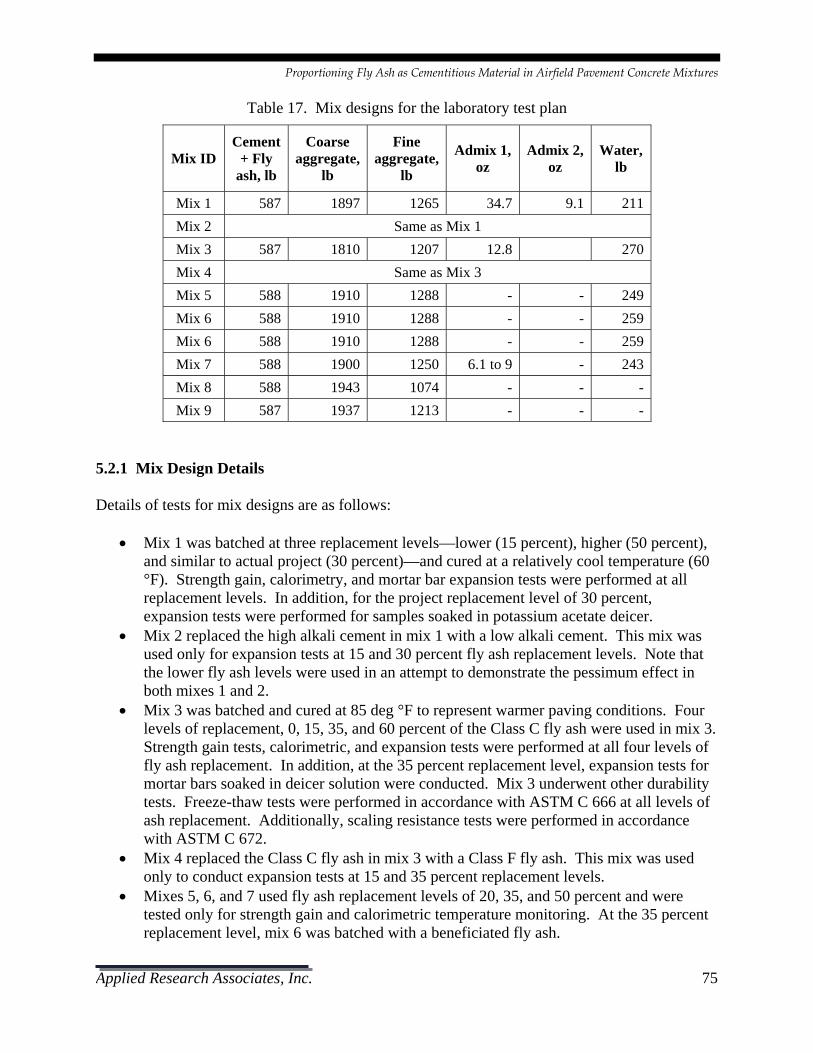
Proportioning Fly Ash as Cementitious Material in Airfield Pavement Concrete Mixtures
Applied Research Associates, Inc. 75
Table 17. Mix designs for the laboratory test plan
Mix ID Cement
+ Fly ash, lb
Coarse aggregate,
lb
Fine aggregate,
lb
Admix 1, oz
Admix 2, oz
Water, lb
Mix 1 587 1897 1265 34.7 9.1 211 Mix 2 Same as Mix 1 Mix 3 587 1810 1207 12.8 270 Mix 4 Same as Mix 3 Mix 5 588 1910 1288 - - 249 Mix 6 588 1910 1288 - - 259 Mix 6 588 1910 1288 - - 259 Mix 7 588 1900 1250 6.1 to 9 - 243 Mix 8 588 1943 1074 - - - Mix 9 587 1937 1213 - - -
5.2.1 Mix Design Details Details of tests for mix designs are as follows:
• Mix 1 was batched at three replacement levels—lower (15 percent), higher (50 percent), and similar to actual project (30 percent)—and cured at a relatively cool temperature (60 °F). Strength gain, calorimetry, and mortar bar expansion tests were performed at all replacement levels. In addition, for the project replacement level of 30 percent, expansion tests were performed for samples soaked in potassium acetate deicer.
• Mix 2 replaced the high alkali cement in mix 1 with a low alkali cement. This mix was used only for expansion tests at 15 and 30 percent fly ash replacement levels. Note that the lower fly ash levels were used in an attempt to demonstrate the pessimum effect in both mixes 1 and 2.
• Mix 3 was batched and cured at 85 deg °F to represent warmer paving conditions. Four levels of replacement, 0, 15, 35, and 60 percent of the Class C fly ash were used in mix 3. Strength gain tests, calorimetric, and expansion tests were performed at all four levels of fly ash replacement. In addition, at the 35 percent replacement level, expansion tests for mortar bars soaked in deicer solution were conducted. Mix 3 underwent other durability tests. Freeze-thaw tests were performed in accordance with ASTM C 666 at all levels of ash replacement. Additionally, scaling resistance tests were performed in accordance with ASTM C 672.
• Mix 4 replaced the Class C fly ash in mix 3 with a Class F fly ash. This mix was used only to conduct expansion tests at 15 and 35 percent replacement levels.
• Mixes 5, 6, and 7 used fly ash replacement levels of 20, 35, and 50 percent and were tested only for strength gain and calorimetric temperature monitoring. At the 35 percent replacement level, mix 6 was batched with a beneficiated fly ash.
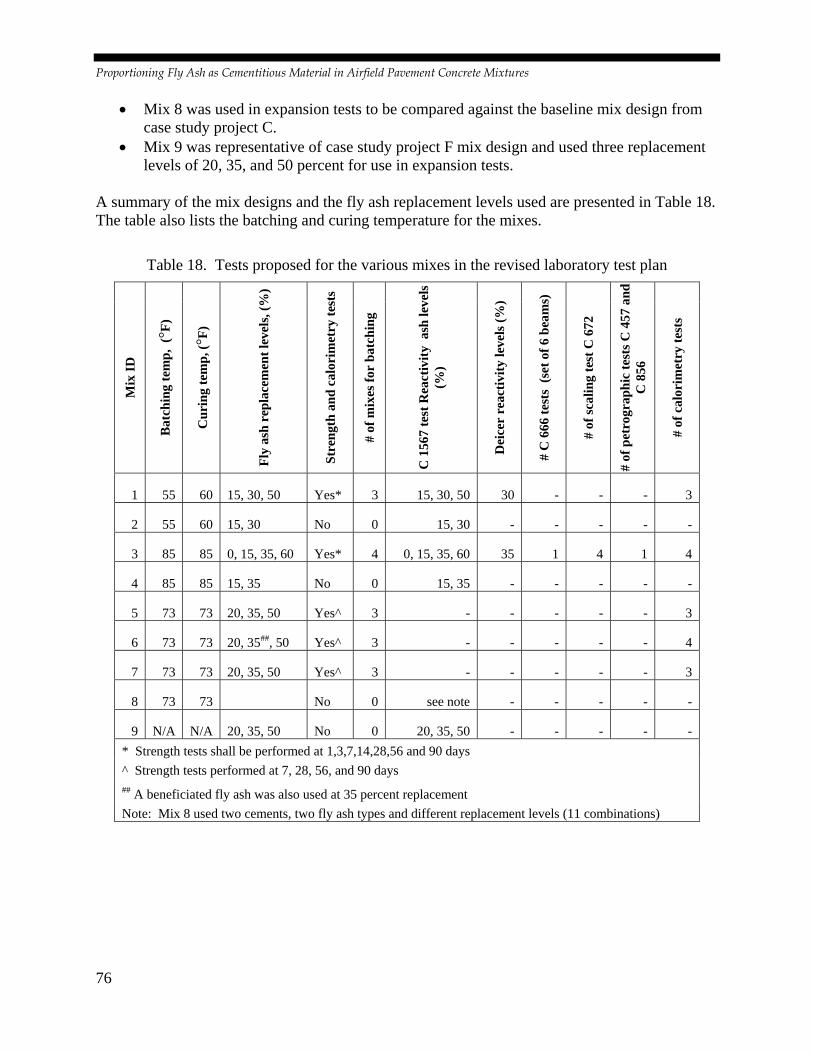
Proportioning Fly Ash as Cementitious Material in Airfield Pavement Concrete Mixtures
76
• Mix 8 was used in expansion tests to be compared against the baseline mix design from case study project C.
• Mix 9 was representative of case study project F mix design and used three replacement levels of 20, 35, and 50 percent for use in expansion tests.
A summary of the mix designs and the fly ash replacement levels used are presented in Table 18. The table also lists the batching and curing temperature for the mixes.
Table 18. Tests proposed for the various mixes in the revised laboratory test plan
Mix
ID
Bat
chin
g te
mp,
(°F
)
Cur
ing
tem
p, (°
F)
Fly
ash
repl
acem
ent l
evel
s, (%
)
Stre
ngth
and
cal
orim
etry
test
s
# of
mix
es fo
r ba
tchi
ng
C 1
567
test
Rea
ctiv
ity a
sh le
vels
(%
)
Dei
cer
reac
tivity
leve
ls (%
)
# C
666
test
s (s
et o
f 6 b
eam
s)
# of
scal
ing
test
C 6
72
# of
pet
rogr
aphi
c te
sts C
457
and
C
856
# of
cal
orim
etry
test
s
1 55 60 15, 30, 50 Yes* 3 15, 30, 50 30 - - - 3
2 55 60 15, 30 No 0 15, 30 - - - - -
3 85 85 0, 15, 35, 60 Yes* 4 0, 15, 35, 60 35 1 4 1 4
4 85 85 15, 35 No 0 15, 35 - - - - -
5 73 73 20, 35, 50 Yes^ 3 - - - - - 3
6 73 73 20, 35##, 50 Yes^ 3 - - - - - 4
7 73 73 20, 35, 50 Yes^ 3 - - - - - 3
8 73 73 No 0 see note - - - - -
9 N/A N/A 20, 35, 50 No 0 20, 35, 50 - - - - - * Strength tests shall be performed at 1,3,7,14,28,56 and 90 days ^ Strength tests performed at 7, 28, 56, and 90 days ## A beneficiated fly ash was also used at 35 percent replacement Note: Mix 8 used two cements, two fly ash types and different replacement levels (11 combinations)

Proportioning Fly Ash as Cementitious Material in Airfield Pavement Concrete Mixtures
Applied Research Associates, Inc. 77
5.2.2 Standard Tests Included in Test Plan The laboratory test program consisted of standard tests that are recommended by the mix optimization catalog. The following standard tests were included in the test plan:
• Slump test in accordance with ASTM C 143. • Unit weight in accordance with ASTM C 138. • Air content in accordance with ASTM C 231. • Time of setting (both initial and final set times) in accordance with ASTM C 403. • Flexural strength test in accordance with ASTM C 78 with test samples prepared and
cured as per ASTM C 192. • Semi-adiabatic calorimetry test in accordance with the standard procedure developed by
the device manufacturer. Note that the samples were not prepared in accordance with ASTM C 305, which is typical for semi-adiabatic calorimetry tests for cement pastes and mortars. The concrete mix (and not the mortar) was used in the calorimetry test measurements.
• Accelerated mortar bar expansion tests in accordance with ASTM C 1567 to determine the potential alkali-silica reactivity of combinations of cementitious materials and aggregate (mortar bars soaked in sodium hydroxide solution).
• EB-70 test to determine reactivity of the aggregate in a deicer environment. Note that the EB-70 test was current at the time the testing was accomplished. The catalog, however, recommends the Modified ASTM C 1567 test (ACPA, 2011).
• Test for resistance to rapid freezing and thawing in accordance with ASTM C 666. • Test for scaling resistance of concrete in accordance with ASTM C 672.
The tests performed for each mix design—or, in other words, the specific tests performed at each fly ash replacement level for each of the mix designs—are listed in Table 18. It is clear that selected tests were conducted for each mix design depending on the relevance of the test procedure for that specific mix design and the reason for the inclusion of the mix in the test plan. The semi-adiabatic calorimetry tests, although not recommended in the catalog, were included in the test plan to demonstrate the ability to use a simple process to determine the optimum fly ash replacement level with the use of data collected from the trial batches. Specifically, the heat signature of the mix and the strength and set time data can be used as quick means to determine if a specific replacement level can achieve the strength and set times necessary for a project. This is discussed in detail in a separate section of this chapter. Note that the calorimetry tests were not used to validate the catalog under this project. 5.3 TEST RESULTS 5.3.1 Fresh Concrete Tests At the time of batching, the mixes were tested for slump, air content, temperature, unit weight, and set time. A summary of the fresh concrete test results is provided in Table 19. The results suggest:

Proportioning Fly Ash as Cementitious Material in Airfield Pavement Concrete Mixtures
78
• The general magnitude of slump, air content and unit weight remain the same for all replacement levels.
• There is a tendency for the air content to drop when fly ash replacement is increased at higher ranges, such as from the moderate to the high or the very high replacement levels.
• The set times are delayed with increasing levels of fly ash replacement. However, this delay is more pronounced in some mix designs than with others. For example, the delay in set time is negligible in mix 7 but is more significant with mix 1 or mix 5. This indicates the effect of fly ash on set time can be different for varying mix designs and fly ash types.
Table 19. Summary of fresh concrete tests for all mixes
Mix ID Fly ash
replacement percent
w/c ratio
Slump, in Air, % Temp,
°F
Unit weight,
pcf
Initial set
time, hr:min
Final set
time, hr:min
Mix 1 15 0.36 1.25 4.6 55 147.6 6:50 10:22Mix 1 30 0.36 1.5 5.5 58 146 10:00 12:57Mix 1 50 0.36 1 4.5 60 147.6 10:10 13:50Mix 2 15
Information not collected as focus was on mortar bar expansion testsMix 2 30 Mix 3 0 0.46 1.25 5 83 144 4:36 6:00Mix 3 15 0.43 1.5 5 83 143.6 6:25 8:30Mix 3 35 0.46 2.5 7.5 84 143.6 7:00 9:00Mix 3 60 0.43 2.75 6 83 142.8 8:45 11:00Mix 4 15
Information not collected as focus was on mortar bar expansion testsMix 4 35 Mix 5 20 0.44 2.25 2.2 65 149.3 5:45 8:18Mix 5 35 0.45 2.5 2.1 65 149.6 8:30 11:22Mix 5 50 0.42 3 2.3 65 149.4 10:08 13:19Mix 6 20 0.45 3 2.1 66 150.4 4:57 7:06Mix 6 35 0.44 2.25 2.2 70 149.6 4:45 7:05Mix 6 35 0.44 1.5 2.2 67 149.4 4:55 7:30Mix 6 50 0.44 2.75 2 66 149.6 6:20 10:00Mix 7 20 0.45 2.75 7.1 73 147.8 7:10 9:06Mix 7 35 0.44 2.75 7.8 71 147 7:15 10:00Mix 7 50 0.41 2.75 7.2 72 146.4 7:20 9:20Mix 8 All
Information not collected as focus was on mortar bar expansion testsMix 9 All

Proportioning Fly Ash as Cementitious Material in Airfield Pavement Concrete Mixtures
Applied Research Associates, Inc. 79
5.3.2 Strength Tests The strength gain for mixes 1, 3, 5, 6, and 7 are shown in Figure 24 through Figure 28.
Figure 24. Strength gain for mix 1 – cool weather paving for quick opening
Figure 25. Strength gain for mix 3 – hot weather paving for quick opening
0
200
400
600
800
1000
1200
0 20 40 60 80 100
Flexural stren
gth, psi
Age, days
Mix 1
Mix 1‐15% ash
Mix 1‐30% ash
Mix 1‐50% ash
01002003004005006007008009001000
0 20 40 60 80 100
Flexural stren
gth, psi
Age, days
Mix 3
Mix 3‐0% ash
Mix 3‐15% ash
Mix 3‐35% ash
Mix 3‐60% ash

Proportioning Fly Ash as Cementitious Material in Airfield Pavement Concrete Mixtures
80
Figure 26. Strength gain for mix 5 – moderate weather paving for non-critical opening
Figure 27. Strength gain for mix 6 - moderate weather paving for non-critical opening
0
200
400
600
800
1000
1200
1400
0 20 40 60 80 100
Flexural stren
gth, psi
Age, days
Mix 5
Mix 5‐20% ash
Mix 5‐35% ash
Mix 5‐50% ash
0
200
400
600
800
1000
1200
0 20 40 60 80 100
Flexural stren
gth, psi
Age, days
Mix 6
Mix 6‐20% ash
Mix 6‐35% ash
Mix 6‐35% benef. ash
Mix 6‐50% ash

Proportioning Fly Ash as Cementitious Material in Airfield Pavement Concrete Mixtures
Applied Research Associates, Inc. 81
Figure 28. Strength gain for mix 7 – moderate weather paving for non-critical opening
The strength gain trends are as expected for all mixes. For all cases, higher replacement levels reduce strength gain in the initial periods. It is also clear that the strength gain over a 90-day period is reasonable for all mixes, and mixes with higher fly ash replacements could take longer to reach strengths comparable to mixes with lower replacement levels, especially mixes 1, 5, and 6. Note that the mixes with higher fly ash replacements achieve a fairly high 90-day strength even if it is significantly below the of the 80/20 mix. Most striking, however, are the strength gain limitations in mixes 1 and 3 with replacement levels in the range of 30 to 60 percent. The strength gain is inadequate during the 14-day hydration period. These mix designs were evaluated for quick opening time conditions. Note that mix 1 and mix 3 were cured at 60 °F and 85 °F to simulate cool and hot paving weather conditions, respectively. Additionally, these mixes used Class F and Class C fly ashes, respectively. Conservatively, higher fly ash contents in the range of 30 to 60 percent should be avoided for early opening strength requirements. The catalog therefore recommends moderate substitution levels (15 to 30 percent) and cautions the user to verify strength gain for higher replacement levels. 5.3.3 Durability Tests Mortar Bar Expansion Test The generally accepted threshold for expansion measured under this standard test procedure is 0.2 percent. Mixes with values greater than 0.2 percent are considered susceptible to ASR damage, while those with values between 0.1 and 0.2 percent are considered marginal. The test results for the reactivity tests are shown in Table 20 for all mixes except mix 8. Mixes 1 through 4 show that they can perform well under all replacement levels considered in the
01002003004005006007008009001000
0 20 40 60 80 100
Flexural stren
gth, psi
Age, days
Mix 7
Mix 7‐20% ash
Mix 7‐35% ash
Mix 7‐50% ash

Proportioning Fly Ash as Cementitious Material in Airfield Pavement Concrete Mixtures
82
experimental program. Mix 1 at 15 percent replacement shows potential for ASR reactivity, as do mixes 2 and 9 at 15 percent replacement.
Table 20. ASTM C 1567 test results for all mix designs
Mix ID Fly ash % ASR, % ASR in potassium acetate, %
Mix 1 15 0.194 Mix 1 30 0.022 -0.004 Mix 1 50 0.005 Mix 2 15 0.116 Mix 2 30 0.012 Mix 3 0 0.033 Mix 3 8 0.044 Mix 3 15 0.041 Mix 3 35 0.052 0.057 Mix 3 60 0.039 Mix 4 15 0.02 Mix 4 35 0.014 Mix 9 15 0.145 Mix 9 30 0.019 Mix 9 50 0.013
Mix 8 from case study project C in Washington was tested with varying fly ash sources, fly ash replacements, and cement alkali levels. For this project C, material tests were performed under a different contract, during which many sources of aggregate were checked and found to be reactive. Ultimately, the aggregate source selected was from a quarry that mines basaltic traprock, and this formed the source for the 1 ½-inch coarse aggregate, ¾-inch coarse aggregate, and sand used in the current testing. The coarse aggregate was crushed as required by the test. An aggregate blend of 25.2percent 1 ½ inch size, 39.2 percent ¾ inch size, and 35.6% sand was used to mimic the mix design. Two sources of cements with different levels of alkalinity and two sources of fly ash with varying oxide levels were evaluated. The results for mix 8 are shown in Table 21. The results indicate that, for moderate calcium oxide level fly ash from Edmonton, a minimum of 15 percent fly ash replacement is required regardless of the cement type used. With the low oxide fly ash from Coal Creek, the 15 percent replacement produces lower expansion potential.

Proportioning Fly Ash as Cementitious Material in Airfield Pavement Concrete Mixtures
Applied Research Associates, Inc. 83
Table 21. Reactivity tests for mix 8 at 14 days
Cement alkalinity Fly ash from Edmonton with moderate CaO of 9.2%
Fly ash from Coal Creek with low CaO
Lafarge cement with alkalinity of 0.5
0% FA – 0.368 to 0.425 10% FA – 0.154 20% FA – 0.029 20% FA – 0.006 in KAc 30% FA – 0.016
Moderately high alkali cement from Colorado
15%- 0.06 15% - 0.013 30% - 0.024 30% - 0.013 50% - 0.022 50% - 0.006
Freeze-Thaw Test Mix 3 was tested under rapid freeze-thaw cycles in accordance with ASTM C 666 tests. The results are summarized in Table 22. The recommended threshold for the durability factor is a value of 60. Additionally, a length change below 0.0375 percent ensures that the aggregate is not susceptible to D-cracking. The mix with fly ash replacement level of 60 percent does not indicate good durability. Also, the length change is higher than the threshold for all the fly ash replacement levels.
Table 22. Freeze-thaw results for mix 3
Fly ash replacement level
Weight loss, %
Length change, %
Durability factor
0 0.35 0.04 85.5 15 0.525 0.045 70.5 35 0.99 0.065 70.5 60 3.3 0.13 60
A visual examination of the freeze-thaw samples corroborates findings from the freeze-thaw tests. The aggregates in mix 3 were not of good quality. The aggregates did not hold up well, as shown in Figure 29. The pictures show a variety of problems with the aggregates used in this mix. The first two pictures on the top show aggregate sockets indicating the aggregates disintegrated through the freeze-thaw cycles. The two pictures at the bottom of the figure are magnified 10X and show a crack passing through the aggregate particles. The problems with mix 3 and case study project B appear to be associated with a poor quality of aggregates.

Proportioning Fly Ash as Cementitious Material in Airfield Pavement Concrete Mixtures
84
Figure 29. Visual examination of the freeze thaw samples used for mix 3
Scaling Test Scaling tests were performed on mix 3 at all replacement levels. Typically, mixes with ratings above 2 are considered susceptible for scaling problems. All mixes with fly ash have the potential for scaling as per these test results.
Table 23. Scaling test results for mix 3
Fly ash replacement,
%
Rating, 0=good
& 5=poor
Weight loss@ 50 cycles, gm Area
Scaling rate,
gm/sec
0 1 2.4 60 0.04 15 3 9.85 60 0.165 35 4 25.35 60 0.42 60 5 81.6 60 1.36
5.3.4 Validation of the Mix Optimization Catalog from Laboratory Tests Mix 1 and Mix 2 Mix 2 represents case study project A, and mix 1 is a variant of mix 2. The catalog validation for this mix was shown in Figure 13. For mix 1, note that the flexural strength for the mix with 50 percent replacement failed to gain strength comparable to the 15 and 30 percent replacement

Proportioning Fly Ash as Cementitious Material in Airfield Pavement Concrete Mixtures
Applied Research Associates, Inc. 85
levels. While the ASR durability is questionable for the 15 percent replacement, the 30 percent replacement will adequately provide the needed ASR mitigation. For mix 1, as shown in Figure 30, the catalog recommendation of 30 to 50 percent will lead the user to verify through tests that the 30 percent replacement is optimum. The catalog may be considered validated with mixes 1 and 2.
Figure 30. Mix optimization catalog recommendations for Mix 1
Deicer exposure Aggregate reactivity Cement type Opening time Paving weatherYes Reactive (> 0.2%) High alkali (>= 0.6%) Non‐critical (> 14 days) Cool (< 60°F)
RECOMMENDATIONS FOR FLY ASH PROPERTIESCalcium oxide Fineness LOI Replacement level
Low (<10%) Coarse Low (<2%) Low (< 15%)Moderate (10 to 20%) Fine Moderate (2 to 6%) Moderate (15‐30%)High (>20%) Fine ground High (>6%) High (30%‐50%)
Very high (>50%)
RECOMMENDEDATIONS FOR ADMIXTURES AND CURINGAdmixtures Curing
Air entraining agent Wet ‐ normalWater reducer Wet ‐ extended
Set acceleratingCuring blanket /autogeneous curing
RECOMMENDATIONS FOR STANDARD TESTS (ASTM)Fresh concrete Hardened concrete Mortar bar Materials review
Slump (C 143)Strength (C 39, C 78, C 469)*
ASR potential (C 1567) Fly ash (C 618, C 311)
Air (C 138 or C 173)Strength gain rate (C 39, C 78, C 469)*
ASR and deicer reactivity (Modified ASTM C 1567)
Aggregates (C 1260, C 1293, C 227, C 295, C 289)
Unit weight (C 138)Hardened air voids (C 457)
Cement (C 150)
Set time (C 403)Rapid freeze thaw (C 666)
Bleed test (C 232) Scaling resistance (C 672)
COMMENTS AND OTHER CONSIDERATIONS
RECOMMENDATION FOR MIX DESIGN, CONSTRUCTION PRACTICES, AND TESTS
PROJECT CONDITIONS SELECTED
* Strength tests include ASTM C 39 for compressive strength, C 78 for flexural strength, and C 469 for elastic modulus.1. The key is to maintain a replacement level high enough to mitigate ASR, but if necessary, it might be possible to optimize the mix to lower replacement levels if scaling potential increases. Therefore, lower values in the moderate range can be an option.2. The low LOI level is recommended, but the moderate level may be adequate to meet air void requirements.3. Wet extended curing is recommended for the high replacement level. Wet normal curing may be adequate for the moderate replacement level.

Proportioning Fly Ash as Cementitious Material in Airfield Pavement Concrete Mixtures
86
Mix 3 and Mix 4 Mix 3 represents the materials and conditions of case study project B, and the catalog was validated for this project as shown in Figure 15. This recommendation essentially recommends that mix 4, which uses a low oxide fly ash, when used with replacement levels of 15-30 percent or possibly higher will provide the necessary performance. This is validated by the mortar bar expansion test results shown in Table 20. Mix 4 therefore validates the catalog. The catalog would not recommend mix 3 with the smaller replacement level for the given project conditions (as in case study project B). It is clear from the laboratory tests, however, that the material is likely to fail due to the aggregate quality in the mix design, but not through ASR problems especially when higher replacement levels are used. It is worthwhile noting that the recommendations in the catalog to perform scaling and rapid freeze-thaw tests will help identify the potential for scaling and freeze-thaw damage in the aggregates through these recommendations. Mix 5 and Mix 6 Mixes 5 and 6 represent Florida materials with Class C and Class F fly ashes, respectively. Mix 6 also used a beneficiated ash at 35 percent replacement. Only strength tests were performed; no reactivity tests were performed, as these mixes use nonreactive aggregates and are intended for non-deicer exposure. Figure 26 and Figure 27 show that mix 5 reaches a 90-day flexural strength level typical of airfield paving mixes at all replacement levels. However, the strength gain in the mixes with high and very high replacement levels (35 and 50 percent) for mix 5 closely matches that of the mix with moderate replacement level (20 percent) during the initial period. This is because of the pozzolanic nature of the Class C fly ash. In mix 6, the beneficiated ash at a 35 percent replacement level shows comparable, or even higher, strength than the Class F fly ash. The very high replacement level does not provide adequate strength until about 56 days. The catalog recommendation for the project conditions relevant to these mixes is presented in Figure 31. For these project conditions, a wide range of fly ash calcium oxide level, LOI, and substitution levels is permissible. No durability test requirements are specified, and both mix 5 and mix 6 will satisfy these project condition requirements. For a quick opening criterion, the catalog does not recommend the very high replacement levels. Moderate replacement is recommended, with the high replacement level presented as a possibility, as shown in Figure 32. The catalog can be considered validated by mixes 5 and 6.
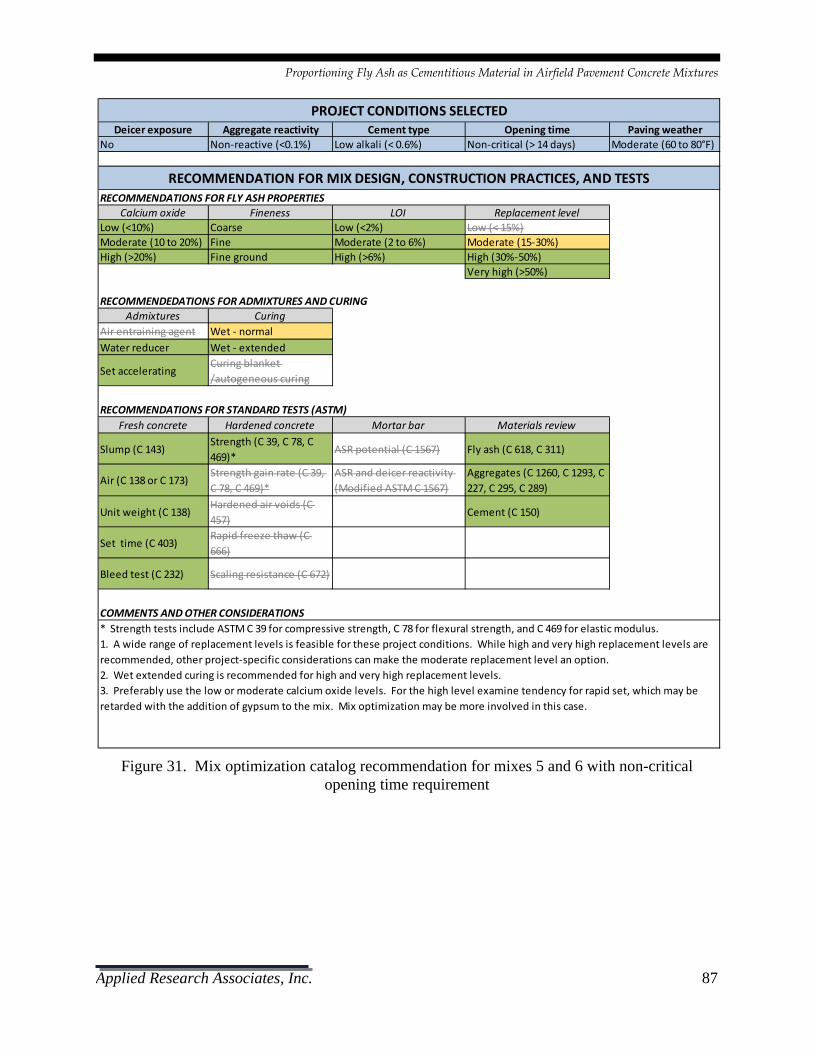
Proportioning Fly Ash as Cementitious Material in Airfield Pavement Concrete Mixtures
Applied Research Associates, Inc. 87
Figure 31. Mix optimization catalog recommendation for mixes 5 and 6 with non-critical
opening time requirement
Deicer exposure Aggregate reactivity Cement type Opening time Paving weatherNo Non‐reactive (<0.1%) Low alkali (< 0.6%) Non‐critical (> 14 days) Moderate (60 to 80°F)
RECOMMENDATIONS FOR FLY ASH PROPERTIESCalcium oxide Fineness LOI Replacement level
Low (<10%) Coarse Low (<2%) Low (< 15%)Moderate (10 to 20%) Fine Moderate (2 to 6%) Moderate (15‐30%)High (>20%) Fine ground High (>6%) High (30%‐50%)
Very high (>50%)
RECOMMENDEDATIONS FOR ADMIXTURES AND CURINGAdmixtures Curing
Air entraining agent Wet ‐ normalWater reducer Wet ‐ extended
Set acceleratingCuring blanket /autogeneous curing
RECOMMENDATIONS FOR STANDARD TESTS (ASTM)Fresh concrete Hardened concrete Mortar bar Materials review
Slump (C 143)Strength (C 39, C 78, C 469)*
ASR potential (C 1567) Fly ash (C 618, C 311)
Air (C 138 or C 173)Strength gain rate (C 39, C 78, C 469)*
ASR and deicer reactivity (Modified ASTM C 1567)
Aggregates (C 1260, C 1293, C 227, C 295, C 289)
Unit weight (C 138)Hardened air voids (C 457)
Cement (C 150)
Set time (C 403)Rapid freeze thaw (C 666)
Bleed test (C 232) Scaling resistance (C 672)
COMMENTS AND OTHER CONSIDERATIONS
RECOMMENDATION FOR MIX DESIGN, CONSTRUCTION PRACTICES, AND TESTS
PROJECT CONDITIONS SELECTED
* Strength tests include ASTM C 39 for compressive strength, C 78 for flexural strength, and C 469 for elastic modulus.1. A wide range of replacement levels is feasible for these project conditions. While high and very high replacement levels are recommended, other project‐specific considerations can make the moderate replacement level an option.2. Wet extended curing is recommended for high and very high replacement levels.3. Preferably use the low or moderate calcium oxide levels. For the high level examine tendency for rapid set, which may be retarded with the addition of gypsum to the mix. Mix optimization may be more involved in this case.

Proportioning Fly Ash as Cementitious Material in Airfield Pavement Concrete Mixtures
88
Figure 32. Mix optimization catalog recommendation for mixes 5 and 6 with early opening time
requirement
Mix 7 Strength results for mix 7 were the basis for evaluating the suitability of this mix for use in project conditions representative of Georgia—deicer exposure with non-reactive aggregates. The catalog recommendations are shown in Figure 33. Mix 7 is in agreement with the catalog.
Deicer exposure Aggregate reactivity Cement type Opening time Paving weatherNo Non‐reactive (<0.1%) Low alkali (< 0.6%) Quick (< 14 days) Moderate (60 to 80°F)
RECOMMENDATIONS FOR FLY ASH PROPERTIESCalcium oxide Fineness LOI Replacement level
Low (<10%) Coarse Low (<2%) Low (< 15%)Moderate (10 to 20%) Fine Moderate (2 to 6%) Moderate (15‐30%)High (>20%) Fine ground High (>6%) High (30%‐50%)
Very high (>50%)
RECOMMENDEDATIONS FOR ADMIXTURES AND CURINGAdmixtures Curing
Air entraining agent Wet ‐ normalWater reducer Wet ‐ extended
Set acceleratingCuring blanket /autogeneous curing
RECOMMENDATIONS FOR STANDARD TESTS (ASTM)Fresh concrete Hardened concrete Mortar bar Materials review
Slump (C 143)Strength (C 39, C 78, C 469)*
ASR potential (C 1567) Fly ash (C 618, C 311)
Air (C 138 or C 173)Strength gain rate (C 39, C 78, C 469)*
ASR and deicer reactivity (Modified ASTM C 1567)
Aggregates (C 1260, C 1293, C 227, C 295, C 289)
Unit weight (C 138)Hardened air voids (C 457)
Cement (C 150)
Set time (C 403)Rapid freeze thaw (C 666)
Bleed test (C 232) Scaling resistance (C 672)
COMMENTS AND OTHER CONSIDERATIONS
RECOMMENDATION FOR MIX DESIGN, CONSTRUCTION PRACTICES, AND TESTS
PROJECT CONDITIONS SELECTED
* Strength tests include ASTM C 39 for compressive strength, C 78 for flexural strength, and C 469 for elastic modulus.1. Lower values in the high replacement level range might be feasible if strength gain requirements can be met.2. Wet extended curing is recommended for the high replacement level.3. Preferably use the low or moderate calcium oxide levels. For the high level examine tendency for rapid set, which may be retarded with the addition of gypsum to the mix. Mix optimization may be more involved in this case.

Proportioning Fly Ash as Cementitious Material in Airfield Pavement Concrete Mixtures
Applied Research Associates, Inc. 89
Figure 33. Mix optimization catalog recommendation for mix 7
Mix 8 The ASR tests performed with two sources of cement, two sources of fly ash, and different replacement rates were essentially variants to the mix used in case study project C. The expansion results are shown in Table 21 and the catalog recommendations are shown in Figure 16. The catalog recommends that either a low oxide or a moderate oxide fly ash may be used and the replacement levels are 15 percent and higher.
Deicer exposure Aggregate reactivity Cement type Opening time Paving weatherYes Non‐reactive (<0.1%) Low alkali (< 0.6%) Non‐critical (> 14 days) Moderate (60 to 80°F)
RECOMMENDATIONS FOR FLY ASH PROPERTIESCalcium oxide Fineness LOI Replacement level
Low (<10%) Coarse Low (<2%) Low (< 15%)Moderate (10 to 20%) Fine Moderate (2 to 6%) Moderate (15‐30%)High (>20%) Fine ground High (>6%) High (30%‐50%)
Very high (>50%)
RECOMMENDEDATIONS FOR ADMIXTURES AND CURINGAdmixtures Curing
Air entraining agent Wet ‐ normalWater reducer Wet ‐ extended
Set acceleratingCuring blanket /autogeneous curing
RECOMMENDATIONS FOR STANDARD TESTS (ASTM)Fresh concrete Hardened concrete Mortar bar Materials review
Slump (C 143)Strength (C 39, C 78, C 469)*
ASR potential (C 1567) Fly ash (C 618, C 311)
Air (C 138 or C 173)Strength gain rate (C 39, C 78, C 469)*
ASR and deicer reactivity (Modified ASTM C 1567)
Aggregates (C 1260, C 1293, C 227, C 295, C 289)
Unit weight (C 138)Hardened air voids (C 457)
Cement (C 150)
Set time (C 403)Rapid freeze thaw (C 666)
Bleed test (C 232) Scaling resistance (C 672)
COMMENTS AND OTHER CONSIDERATIONS
RECOMMENDATION FOR MIX DESIGN, CONSTRUCTION PRACTICES, AND TESTS
PROJECT CONDITIONS SELECTED
* Strength tests include ASTM C 39 for compressive strength, C 78 for flexural strength, and C 469 for elastic modulus.1. The high replacement level might increase scaling potential. ASTM C 672 and C 666 are recommended.2. The low LOI level is recommended, but the moderate level may be adequate to meet air void requirements critical for cold climates.3. Wet extended curing is recommended for the high replacement level.4. Preferably use the low or moderate calcium oxide levels. For the high level examine tendency for rapid set, which may be retarded with the addition of gypsum to the mix. Mix optimization may be more involved in this case.
Proportioning Fly Ash as Cementitious Material in Airfield Pavement Concrete Mixtures
90
Results in Table 21 indicate that with the use of a moderately high alkali cement, a moderate calcium oxide fly ash or preferably a low oxide fly ash may be necessary for 15 percent or higher replacement level. For a low alkali cement, a higher oxide level may be adequate to achieve the ASR mitigation required. The catalog is in agreement with mix 8. Mix 9 This mix is representative of the case study project F. The mortar bar expansion test results for mix 9 in Table 20 indicate that 30 percent fly ash replacement provides the ASR durability needed for the project, and the catalog recommendation for 15 to 30 percent or higher is in agreement with the test results. Hence, the catalog has been validated by mix 9. 5.4 SEMI-ADIABATIC CALORIMETRY – A TOOL IN OPTIMIZING FLY ASH CONTENT 5.4.1 Introduction The guidelines developed under this study encourage laboratory tests to select the optimum fly ash replacement level. In the best case scenario, the user batches three mix designs at three contents and performs the tests recommended to determine the optimum fly ash replacement level for the given project conditions. In other cases, depending on the results of the tests performed, it may be necessary to batch and test additional fly ash replacement rates before the optimum level can be determined. The current study explored the feasibility of using semi-adiabatic calorimetry in such cases where the number of laboratory tests for the trial batches may be minimized. This does not imply that the catalog-recommended tests need not be verified for the final selected mix design. It is imperative that the final mix design be fully evaluated under all recommended laboratory tests. Calorimetry is being suggested as a rapid tool to “estimate” key properties such as strength and set times without elaborate testing for each trial batch. Additionally, calorimetry may be used as a QC tool to alert engineers about unexpected changes to the mix design for concrete delivered to the site, such as changes in admixture type or dosage, cement source, etc. During paving, calorimetry may be a rapid and effective method to provide confidence (or lack thereof) about a mix with minor deviations from the approved mix design. 5.4.2 Semi-adiabatic Calorimetry and its Applications Calorimetry involves the measurement of heat evolved from a chemical reaction or change of physical state of a material, and adiabatic conditions signify measurements made without loss or gain of heat (<0.02 k/h temperature loss) with the use of some form of insulation. Adiabatic calorimetry does not account for the effect of curing temperature on the thermal measurements. Isothermal calorimetry, on the other hand, is conducted under a constant temperature environment and is more suitable for cement pastes. However, isothermal tests do not take into account the cement reactivity change due to the change of temperature. Semi-adiabatic

Proportioning Fly Ash as Cementitious Material in Airfield Pavement Concrete Mixtures
Applied Research Associates, Inc. 91
calorimetry is indicative of the heat evolved from a hydrating cementitious material in an environment with marginal insulation (maximum heat loss < 100 J/h.K), and it is suitable for pastes, mortars, and concrete samples. It simply measures a concrete mixture’s temperature history over time, typically over the first 24-48 hours. The data generated is generally repeatable and the test process is also amenable for use in field or laboratory. Standard sample sizes and testing procedures are followed. The system used in the current study is AdiaCal™ Calorimeter manufactured by Grace, and standard procedures recommended by the manufacturer were followed. However, detailed data were retrieved from the tests and used in the analyses to demonstrate the ability to use this tool in routine practice. Figure 34 shows a sample of semi-adiabatic calorimetric temperature monitoring, henceforth referred to as calorimetry or temperature monitoring as relevant. The sample chosen is for mix 1 at 30 percent fly ash replacement. The initial peak in temperature occurs due to the hydration of C3A, followed by a short dormant period in the hydration reactions. The significant peak seen subsequent to the dormant period represents the heat generated from the C3S hydration. As the rate of hydration decreases (even while hydration progresses), the temperature falls gradually until the mixture attains a stable temperature corresponding to the ambient conditions or the curing temperature conditions. The amount of heat and the temperature history are influenced by cement and fly ash chemistry, mix temperature, fly ash replacement level, admixture dosages, admixture incompatibility, and reactivity. An evaluation of these data can help troubleshoot concrete on field or identify other set time or early hydration issues, including flash set (Cost, 2006; Cost & Gardiner, 2009).
Figure 34. Sample semi-adiabatic temperature monitoring data plot
Figure 35 shows the occurrence of the initial set and final set for the sample mix, as measured by the ASTM C 403 laboratory test. The time temperature history recorded in the calorimetry test also can be used to calculate the maturity (area under the curve), as shown in Figure 36. The

Proportioning Fly Ash as Cementitious Material in Airfield Pavement Concrete Mixtures
92
effect of changing a mix parameter can be identified through changes in these temperature profiles. In the example below, with fly ash replacement level being the mix parameter being changed, Figure 37 shows the temperature profiles for mix 1.
Figure 35. Temperature history and set time for mix 1 at 30 percent fly ash replacement
Figure 36. Maturity in mix 1 with 30 percent fly ash replacement

Proportioning Fly Ash as Cementitious Material in Airfield Pavement Concrete Mixtures
Applied Research Associates, Inc. 93
Figure 37. Effect of fly ash replacement for mix 1
Applications of Calorimetry Several mathematical parameters defining the shape of the curve have been used as indicators of the degree of hydration. A few simple parameters, for example, would be the approximate linear slope of the curve that tracks primarily the C3S hydration, the time of occurrence of the maximum temperature, and the maximum temperature itself, as indicated in Figure 34. In Figure 37, the increase in fly ash content reduces the peak temperature and delays the time at maximum temperature peak (associated with delayed hydration of the fly ash). The shift in set times is more significant with the increase in fly ash replacement from 15 to 30 than from 30 to 50 percent. The analyses undertaken in this section attempted to mathematically capture these trends for each mix with the objective of demonstrating the ability of using this tool to predict set times or strengths at other intermediate replacement levels (for example, at 40 percent). A review of literature on using semi-adiabatic calorimetry results suggests that the set times have been correlated to the change in slope of the heat evolution curve (Cost & Gardiner, 2009; Wang et al., 2007; Schindler, 2004). The time at which the first derivative of the curve peaks has been correlated to the final set time, and the time at which the second derivative of the curve is at a maximum has been correlated to the initial set time. This is being considered as a basis by ASTM for the development of procedures to determine set times based on temperature monitoring data. Another method of estimating set times has been a fixed percentage of the time

Proportioning Fly Ash as Cementitious Material in Airfield Pavement Concrete Mixtures
94
taken to reach the maximum temperature. Initial set times have been in the range of 19 to 30 percent, and final set times have been in the range of 40 to 60 percent of the time taken to reach maximum temperature. However, the accurate prediction of set times has been found to be through the prediction of the maturity that corresponds to the set time. Time temperature data also have been used to predict strength. However, it is more a prediction of strength gain under a given set of mix proportions and curing conditions. The models are more or less equivalent to the use of maturity concepts to predict strength. Note that for maturity concepts to be valid, adequate curing needs to be provided for the hydration to progress. 5.4.3 Prediction of Set Times and Flexural Strength for Mixes 1 through 7 Temperature rises under adiabatic conditions were monitored for mixes 1, 3, 5, 6, and 7, as shown in Figure 37 through Figure 41. These figures also indicate the initial and final set times for the mixes and show the maturity along the secondary vertical axis. Also, note in Figure 39 that the temperature data coincide for replacement levels of 35 and 50 percent. This was examined in further detail and the observed anomaly could not be explained. Clearly, this could have been a result of an error in data collection or data transfer. Mix 5 was therefore excluded from all further analysis to predict set times and flexural strength.
Figure 38. Effect of fly ash replacement for mix 3

Proportioning Fly Ash as Cementitious Material in Airfield Pavement Concrete Mixtures
Applied Research Associates, Inc. 95
Figure 39. Effect of fly ash replacement for mix 5
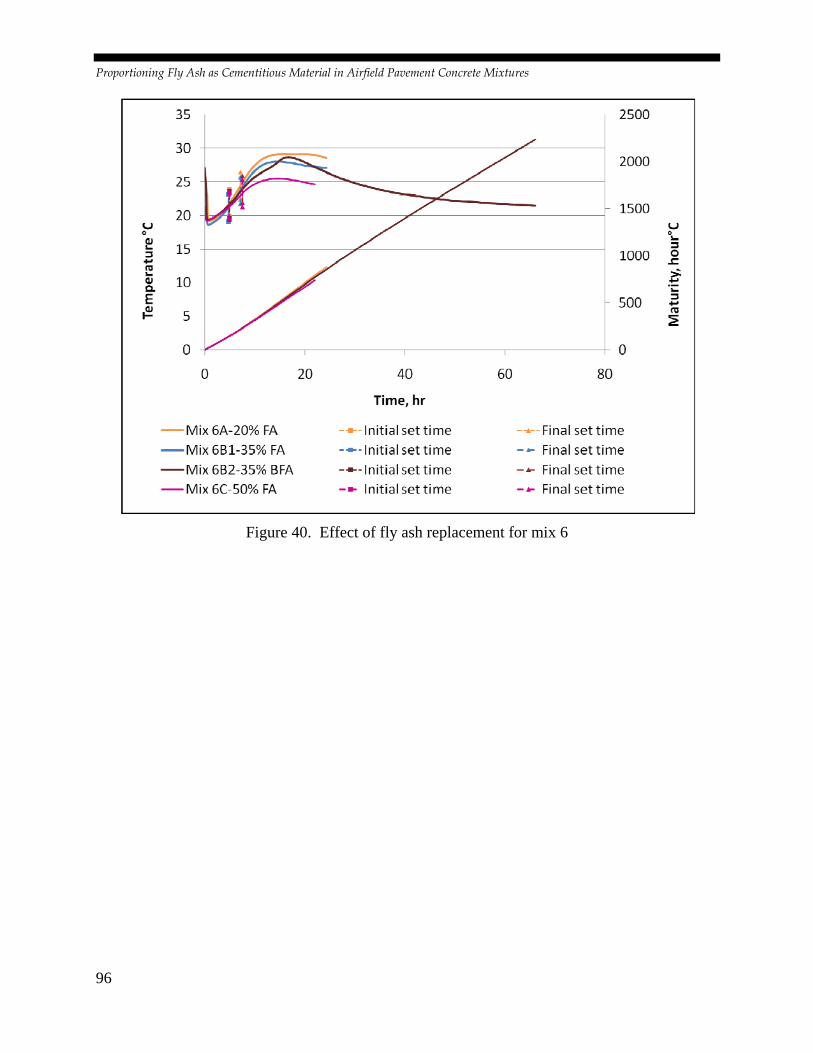
Proportioning Fly Ash as Cementitious Material in Airfield Pavement Concrete Mixtures
96
Figure 40. Effect of fly ash replacement for mix 6

Proportioning Fly Ash as Cementitious Material in Airfield Pavement Concrete Mixtures
Applied Research Associates, Inc. 97
Figure 41. Effect of fly ash replacement for mix 7
Peak temperatures as well as the time at which the peak temperature occurred were examined for each mix design. The trends in the plots above were in general agreement with the fly ash replacement levels. As shown in Figure 42 through Figure 45, for increasing levels of fly ash, the maximum temperature decreases and there is a delay in reaching the maximum temperature. This holds true for all mixes except mix 3, for which a 15 percent replacement causes the longest hydration time. Note that the scales are uniform across all charts in Figure 42 through Figure 45.

Proportioning Fly Ash as Cementitious Material in Airfield Pavement Concrete Mixtures
98
Figure 42. Adiabatic temperature rise vs. fly ash replacement level for mix 1
Figure 43. Adiabatic temperature rise vs. fly ash replacement level for mix 3
10.00
15.00
20.00
25.00
75
80
85
90
95
100
0 10 20 30 40 50 60
Time at m
axim
um tem
perature,
hours
Max tem
perature from
calorim
etry
test, deg
F
Fly ash content
Mix 1
Max temp Time at max temp
10.00
15.00
20.00
25.00
75
80
85
90
95
100
0 20 40 60 80
Time at m
axim
um tem
perature,
hours
Max tem
perature from
calorim
etry
test, deg
F
Fly ash content
Max temp Time at max temp
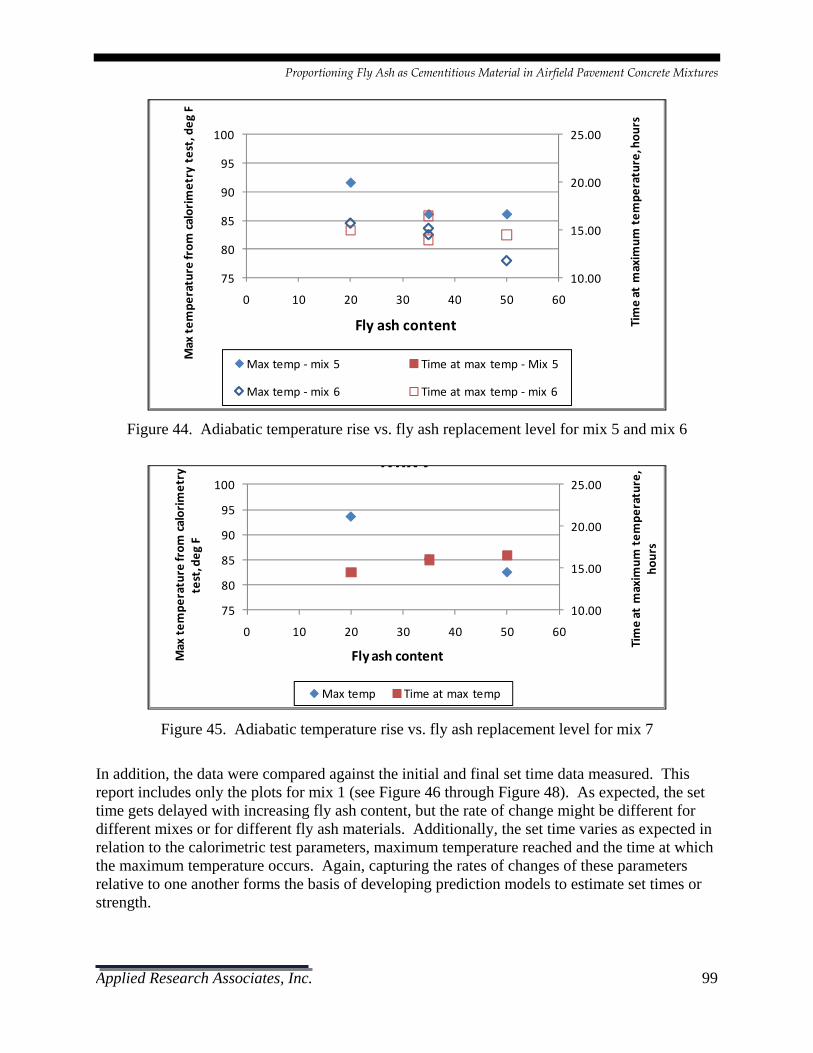
Proportioning Fly Ash as Cementitious Material in Airfield Pavement Concrete Mixtures
Applied Research Associates, Inc. 99
Figure 44. Adiabatic temperature rise vs. fly ash replacement level for mix 5 and mix 6
Figure 45. Adiabatic temperature rise vs. fly ash replacement level for mix 7
In addition, the data were compared against the initial and final set time data measured. This report includes only the plots for mix 1 (see Figure 46 through Figure 48). As expected, the set time gets delayed with increasing fly ash content, but the rate of change might be different for different mixes or for different fly ash materials. Additionally, the set time varies as expected in relation to the calorimetric test parameters, maximum temperature reached and the time at which the maximum temperature occurs. Again, capturing the rates of changes of these parameters relative to one another forms the basis of developing prediction models to estimate set times or strength.
10.00
15.00
20.00
25.00
75
80
85
90
95
100
0 10 20 30 40 50 60
Time at m
axim
um tem
perature, hou
rs
Max tem
perature from
calorim
etry test, deg
F
Fly ash content
Max temp ‐mix 5 Time at max temp ‐Mix 5
Max temp ‐mix 6 Time at max temp ‐mix 6
10.00
15.00
20.00
25.00
75
80
85
90
95
100
0 10 20 30 40 50 60Time at m
axim
um tem
perature,
hours
Max tem
perature from
calorim
etry
test, deg
F
Fly ash content
Mix 7
Max temp Time at max temp

Proportioning Fly Ash as Cementitious Material in Airfield Pavement Concrete Mixtures
100
Figure 46. Set time vs. fly ash content in mix 1
Figure 47. Maximum temperature from calorimetry vs. set time in mix 1
0
2
4
6
8
10
12
14
16
0 10 20 30 40 50 60
Set tim
e, hou
rs
Fly ash content
Initial set time
Final set time
0
2
4
6
8
10
12
14
16
82 84 86 88 90 92 94 96
Set tim
e, hou
rs
Maximum temperature from calorimetry, deg F
Initial set time
Final set time

Proportioning Fly Ash as Cementitious Material in Airfield Pavement Concrete Mixtures
Applied Research Associates, Inc. 101
Figure 48. Time at maximum temperature from calorimetry vs. set time in mix 1
Prediction of Strength and Set Times Using Thermal History Several parameters defining the temperature profiles were calculated for each mix. The objective of this analysis was to identify those parameters that would best correlate with the set times as well as identify the combination of parameters that would most accurately determine the set times and strengths for all mixes. From a practical standpoint, the prediction of the set times is critical to plan saw cutting activities appropriately. The final set time is of more significance that the initial set times. The 7-day and 28-day strength predictions also were considered critical under this study, as these test ages best represent the majority of project strength criteria used for early opening and non-critical opening times. Therefore the study evaluated the prediction of 4 parameters—initial set time, final set time, 7-day flexural strength, and 28-day flexural strength. As an initial check, the final set time determined from the ASTM C 403 laboratory test was correlated to the maturity measured at the final set time. As shown in Figure 49, a good correlation exists between these parameters.
0
2
4
6
8
10
12
14
16
0.00 5.00 10.00 15.00 20.00 25.00
Set tim
e, hou
rs
Time at max temperature from calorimetry, hours
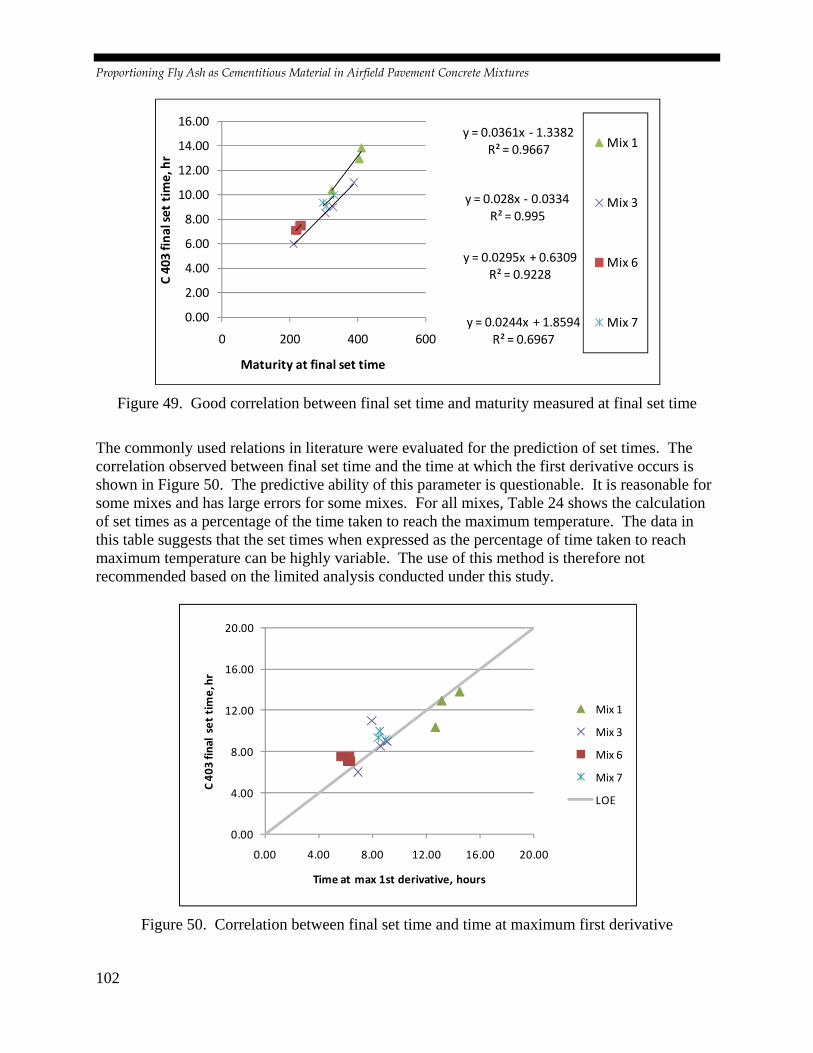
Proportioning Fly Ash as Cementitious Material in Airfield Pavement Concrete Mixtures
102
Figure 49. Good correlation between final set time and maturity measured at final set time
The commonly used relations in literature were evaluated for the prediction of set times. The correlation observed between final set time and the time at which the first derivative occurs is shown in Figure 50. The predictive ability of this parameter is questionable. It is reasonable for some mixes and has large errors for some mixes. For all mixes, Table 24 shows the calculation of set times as a percentage of the time taken to reach the maximum temperature. The data in this table suggests that the set times when expressed as the percentage of time taken to reach maximum temperature can be highly variable. The use of this method is therefore not recommended based on the limited analysis conducted under this study.
Figure 50. Correlation between final set time and time at maximum first derivative
y = 0.0361x ‐ 1.3382R² = 0.9667
y = 0.028x ‐ 0.0334R² = 0.995
y = 0.0295x + 0.6309R² = 0.9228
y = 0.0244x + 1.8594R² = 0.6967
0.00
2.00
4.00
6.00
8.00
10.00
12.00
14.00
16.00
0 200 400 600
C 403 fin
al se
t time, hr
Maturity at final set time
Mix 1
Mix 3
Mix 6
Mix 7
0.00
4.00
8.00
12.00
16.00
20.00
0.00 4.00 8.00 12.00 16.00 20.00
C 40
3 fin
al set tim
e, hr
Time at max 1st derivative, hours
Mix 1
Mix 3
Mix 6
Mix 7
LOE

Proportioning Fly Ash as Cementitious Material in Airfield Pavement Concrete Mixtures
Applied Research Associates, Inc. 103
Table 24. Set times expressed as percentage of time taken to reach maximum temperature
Mix # in test plan
Fly ash content
C 403 initial set time, hr
C 403 final set time, hr
% of peak temperature at initial set
% of peak temperature at final set
Mix 1 15 6.83 10.37 12.25 37.24 Mix 1 30 10.00 12.95 35.44 61.29 Mix 1 50 10.17 13.83 35.25 59.52 Mix 3 0 4.60 6.00 22.43 42.46 Mix 3 15 6.42 8.50 25.67 55.68 Mix 3 35 7.00 9.00 23.25 56.75 Mix 3 60 8.75 11.00 88.44 88.44 Mix 6 20 4.95 7.10 26.53 52.29 Mix 6 35 4.75 7.08 26.85 54.64 Mix 6 35 4.92 7.50 23.82 48.30 Mix 6 50 4.92 7.50 33.42 64.63 Mix 7 20 7.17 9.10 37.89 62.33 Mix 7 35 7.25 10.00 38.93 70.36 Mix 7 50 7.33 9.33 38.42 61.01
In the analyses conducted to develop prediction models to estimate set times and strength several independent variables were examined for correlation with the dependent variable (strength or set times). The independent variables considered were:
maximum temperature, time at maximum temperature, minimum temperature, time at minimum temperature, time between minimum and maximum temperature, temperature rise (i.e. maximum – minimum temperatures), linear slope of the hydration curve, time at which the first derivative is the maximum, time at which the second derivative is the maximum, time at which the first derivative is minimum, ratio between times when the first derivative is minimum and maximum, maturity at the time when the first derivative is maximum, maturity at the time when the first derivative is minimum, and maturity when the maximum temperature occurs.
The various independent parameters listed above are simply different indices that mathematically or quantitatively describe the characteristics of the temperature history. In developing these correlations, it is important to recognize the following:
• For each mix design, the laboratory test data offers on an average three data points. This makes it necessary to determine the correlation coefficient between the dependent variable and each individual independent variable rather than consider multiple variable at a time. No more than 2 variables can be considered simultaneously.

Proportioning Fly Ash as Cementitious Material in Airfield Pavement Concrete Mixtures
104
• There might exist a random correlation between a dependent variable and an independent variable in a specific mix design. Therefore, a good correlation coefficient for all mixes was necessary to establish the correlation between two selected parameters.
Various correlations between the listed independent variable and the dependent variables were evaluated. Figure 51 and Figure 52 show an attempt to correlate the final set time to the maturity at the time when the first derivative is maximum, and the maturity at the time when the temperature is maximum. Figure 53 is a correlation between the 28-day flexural strength and the maturity at final set time. These plots show that, as such, the two variables considered in each relationship are weakly correlated. It is also obvious that certain random correlations may exist. For example, in Figure 51 and Figure 52, mix 1 shows a better correlation than the other mixes, and in Figure 53 mix 1 and mix 3 show better correlation than the other mixes. The two variables that were found to correlate well with the dependent variables were the temperature rise and the linear slope of the hydration curve. Temperature rise is the difference between the maximum and the minimum temperature that the mix attains in the time temperature history recorded and the linear slope is simply the slope of the linear approximation between the times at which the minimum and maximum temperatures occur. Figure 56 and Figure 57 show the relationship between the temperature rise parameter and the 7-day and 28-day flexural strengths respectively. Likewise, Figure 54 and Figure 55 show the linear slope vs. 7-day and 28-day strengths respectively.
Figure 51. Poor correlation between final set time vs. maturity at time of maximum first
derivative
y = 0.1063x ‐ 32.239R² = 0.6113
y = 0.023x + 1.8695R² = 0.1656
y = ‐0.0103x + 9.2321R² = 0.2336
y = ‐0.0121x + 12.898R² = 0.24440.00
2.00
4.00
6.00
8.00
10.00
12.00
14.00
16.00
0 200 400 600
C 403 fin
al se
t time, hr
Maturity at maximum 1st derivative
Mix 1
Mix 3
Mix 6
Mix 7

Proportioning Fly Ash as Cementitious Material in Airfield Pavement Concrete Mixtures
Applied Research Associates, Inc. 105
Figure 52. Poor correlation between final set time vs. maturity measured at the time of peak
temperature for all mixes
Figure 53. Poor correlation between 28-day flexural strength vs. maturity at time of final set
y = 0.0722x ‐ 34.3R² = 0.8562
y = ‐0.0218x + 18.145R² = 0.4695
y = 0.0012x + 6.6957R² = 0.0638
y = 0.0046x + 7.0239R² = 0.0405
0.00
2.00
4.00
6.00
8.00
10.00
12.00
14.00
16.00
0 500 1000
C 403 fin
al se
t time, hr
Maturity at peak temperature, hr‐°C
Mix 1
Mix 3
Mix 6
Mix 7
y = ‐2.1398x + 1496.8R² = 0.7638
y = ‐0.733x + 937.91R² = 0.8592
y = ‐4.8138x + 1797.6R² = 0.216
y = 1.4538x + 254.04R² = 0.0843
0
100
200
300
400
500
600
700
800
900
0 200 400 600
28 day
flexural streng
th, psi
Maturity at final set time
Mix 1
Mix 3
Mix 6
Mix 7

Proportioning Fly Ash as Cementitious Material in Airfield Pavement Concrete Mixtures
106
Figure 54. Good correlation between temperature rise and 7-day flexural strength
Figure 55. Good correlation between temperature rise and 28-day flexural strength
y = 54.527x ‐ 192.11R² = 0.9989
y = 20.954x + 372.49R² = 0.9833
y = 58.03x ‐ 44.54R² = 0.9583
y = 33.573x + 241.2R² = 0.8477
0
200
400
600
800
0 10 20
7 da
y fle
xural stren
gth, psi
Temp rise, °C
Mix 1
Mix 3
Mix 6
Mix 7
y = 54.389x ‐ 81.84R² = 0.9967
y = 9.566x + 636.49R² = 0.8481
y = 45.841x + 307.72R² = 0.9144
y = 27.285x + 443.02R² = 0.8568
0
200
400
600
800
1000
0 10 20
28 day
flexural streng
th, psi
Temp rise, °C
Mix 1
Mix 3
Mix 6
Mix 7

Proportioning Fly Ash as Cementitious Material in Airfield Pavement Concrete Mixtures
Applied Research Associates, Inc. 107
Figure 56. Good correlation between linear slope and 7-day flexural strength
Figure 57. Good correlation between linear slope and 28-day flexural strength
After the identification of these two parameters as being significant for the prediction of strength and set times, a model using both the variables was developed for each mix. The model is of the form:
y = 487.37x + 177.18R² = 0.9901
y = 258.16x + 336.04R² = 0.9983
y = 682.24x + 45.316R² = 0.7118
y = 410.36x + 291.43R² = 0.8584
0
100
200
300
400
500
600
700
800
0.00 0.50 1.00 1.50
7 da
y fle
xural stren
gth, psi
Linear slope, degC/hr
Mix 1
Mix 3
Mix 6
Mix 7
y = 487.7x + 285.25R² = 0.9943
y = 111.26x + 624.96R² = 0.7674
y = 579.55x + 353.86R² = 0.7854
y = 333.42x + 483.89R² = 0.8672
0
200
400
600
800
1000
0.00 0.50 1.00 1.50
28 day
flexural streng
th, psi
Linear slope, degC/hr
Mix 1
Mix 3
Mix 6
Mix 7

Proportioning Fly Ash as Cementitious Material in Airfield Pavement Concrete Mixtures
108
y = A + B*x1 + C*x2
where
y = dependent variable—initial set time, final set time, 7-day flexural strength or 28-day flexural strength
A, B, C = constants (regressed) x1 = temperature rise monitored in the calorimetry measurements, °C x2 = linear slope of the heat of hydration curve, °C/hour
The values of the constants A, B, C are tabulated in Table 25 for the prediction of the 7-day flexural strength, the 28-day flexural strength, the initial set time, and the final set time for all mixes. Table 26 and Table 27 summarize the predicted and the laboratory test values along with the prediction errors and sum of squared errors for the models. The model constants and coefficients were derived statistically for the best fit by minimizing the sum of squared errors. Figure 58, through Figure 61 show the predicted vs. measured values for the four variables respectively. Note that the model needs to be revised for each mix design and the model form has been verified for mixes that vary only the fly ash replacement level. The impact of varying other mix design parameters or multiple parameters has been evaluated within this analysis.
Table 25. Model coefficients for the prediction of flexural strength and set time Model &
Coefficient Parameter Mix 1 Mix 3 Mix 6 Mix 7
7-day flexural strength A Constant -101.18 336.95 -38.61 1709.27 B Temp rise 40.91 0.57 70.14 -915.52 C Slope 123.37 251.22 -182.74 11529.32 28-day flexural strength A Constant 73.95 679.04 305.19 1590.70 B Temp rise 31.05 33.97 40.67 -714.83 C Slope 211.39 -300.79 77.97 9015.35 Initial set time A Constant -4.45 9.58 5.00 6.23 B Temp rise 2.80 0.02 0.07 0.81 C Slope -31.82 -3.89 -1.22 -10.14 Final set time A Constant 7.88 12.09 8.21 24.39 B Temp rise 1.51 0.05 0.13 -9.07 C Slope -20.58 -4.94 -3.28 108.87

Proportioning Fly Ash as Cementitious Material in Airfield Pavement Concrete Mixtures
Applied Research Associates, Inc. 109
Table 26. Summary of predicted and measured flexural strengths
Mix Fly ash, %
Measured flexural strength, psi
Predicted flexural strength, psi
Error in prediction
Sum of squared error
7-day 28-day 7-day 28-day 7-day 28-day 7-day 28-day
1 15 690 800 690 800 0.0 0.0 0.0 0.01 30 585 690 585 690 0.0 0.0 1 50 450 560 450 560 0.0 0.0
3 0 655 785 660 770 5.1 -15.2 71.2 633.23 15 590 730 584 748 -6.2 18.4 3 35 520 665 519 669 -1.3 3.9 3 60 380 665 382 658 2.4 -7.0
6 20 510 735 533 765 23.1 29.9 942.9 1581.26 35 505 763 490 743 -15.4 -19.9 6 35 520 745 508 729 -12.3 -15.9 6 50 315 590 320 596 4.6 6.0
7 20 668 790 668 790 0.0 0.1 0.3 0.17 35 565 705 565 705 0.5 0.3 7 50 470 630 470 630 -0.2 -0.1

Proportioning Fly Ash as Cementitious Material in Airfield Pavement Concrete Mixtures
110
Table 27. Summary of predicted and measured set times
Mix Fly ash, %
Measured set time, hours
Predicted set times, hours
Error in prediction
Sum of squared error
Initial Final Initial Final Initial Final Initial Final
1 15 6.83 10.37 6.83 10.37 0.00 0.00 1E-06 2E-071 30 10.00 12.95 10.00 12.95 0.00 0.00 1 50 10.17 13.83 10.17 13.83 0.00 0.00
3 0 4.60 6.00 4.93 6.54 0.33 0.54 3E-01 8E-013 15 6.42 8.50 6.02 7.85 -0.39 -0.65 3 35 7.00 9.00 6.92 8.86 -0.08 -0.14 3 60 8.75 11.00 8.90 11.25 0.15 0.25
6 20 4.95 7.10 4.87 7.17 -0.08 0.07 1E-02 8E-036 35 4.75 7.08 4.80 7.04 0.05 -0.05 6 35 4.92 7.50 4.96 7.46 0.04 -0.04 6 50 4.92 7.50 4.90 7.51 -0.02 0.01
7 20 7.17 9.10 7.17 9.10 0.00 0.00 1E-09 3E-057 35 7.25 10.00 7.25 10.00 0.00 0.00 7 50 7.33 9.33 7.33 9.33 0.00 0.00

Proportioning Fly Ash as Cementitious Material in Airfield Pavement Concrete Mixtures
Applied Research Associates, Inc. 111
Figure 58. Predicted vs. measured 7-day flexural strength for all mixes
Figure 59. Predicted vs. measured 28-day flexural strength for all mixes
y = 1x + 0.0098R² = 1
y = 0.9983x + 0.9161R² = 0.9983
y = 0.9676x + 14.976R² = 0.9676
y = 1.0011x ‐ 0.5675R² = 1
0
200
400
600
800
0 200 400 600 800
Pred
icted 7‐da
y strength, psi
7 day flexural strength, psi
Mix 1
Mix 3
Mix 6
Mix 7
y = 1x + 0.0068R² = 1
y = 0.9371x + 44.732R² = 0.9371
y = 0.917x + 58.796R² = 0.917
y = 1.0017x ‐ 1.0863R² = 1
0
200
400
600
800
1000
0 500 1000
Pred
icted 28
‐day
strength, psi
28 day flexural strength, psi
Mix 1
Mix 3
Mix 6
Mix 7

Proportioning Fly Ash as Cementitious Material in Airfield Pavement Concrete Mixtures
112
Figure 60. Predicted vs. measured initial set time for all mixes
Figure 61. Predicted vs. measured final set time for all mixes
y = 0.9998x + 0.0021R² = 1
y = 0.967x + 0.2209R² = 0.967
y = 0.5171x + 2.3581R² = 0.5172
y = 0.9998x + 0.0014R² = 1
0.00
2.00
4.00
6.00
8.00
10.00
12.00
0 5 10 15
Pred
icted initial set time, hr
C 403 initial set time, hr
Mix 1
Mix 3
Mix 6
Mix 7
y = 1x + 0.0003R² = 1
y = 0.9372x + 0.5415R² = 0.9372
y = 0.9493x + 0.3699R² = 0.9493
y = 1.007x ‐ 0.0667R² = 1
0.00
2.00
4.00
6.00
8.00
10.00
12.00
14.00
16.00
0 5 10 15
Pred
icted fin
al se
t tim
e, hr
C 403 final set time, hr
Mix 1
Mix 3
Mix 6
Mix 7

Proportioning Fly Ash as Cementitious Material in Airfield Pavement Concrete Mixtures
Applied Research Associates, Inc. 113
5.4.4 Conclusions from Calorimetry Data Evaluations The semi-adiabatic calorimetry data collection allowed a preliminary evaluation of the application of this test process in optimizing a fly ash concrete mix design. This test process provides a reliable and simple method to estimate set times and strength at key ages for multiple fly ash replacement levels based on time temperature history using prediction models that are developed using comprehensive laboratory test results. The data collected in this study was used to demonstrate that initial and final set times as well as 7-day and 28-day flexural strength values may be predicted based on two parameters associated with the heat of hydration curve, the temperature rise during the hydration and the linear slope of the temperature rise curve. The predictive ability of the final set time model and the strength models were found to be very good. 5.5 CONCLUSIONS FROM LABORATORY TEST VALIDATIONS Based on the outcome of the laboratory testing and validation efforts, it is reasonable to say that the catalog recommendations are in agreement with test results. The mix design recommendations are in general indicative of well performing pavements. Several mix designs that were validates were from field projects that were reviewed in detail to corroborate field performance with the mix optimization catalog recommendations.

Proportioning Fly Ash as Cementitious Material in Airfield Pavement Concrete Mixtures
114
This page is intentionally left blank.
Proportioning Fly Ash as Cementitious Material in Airfield Pavement Concrete Mixtures
Applied Research Associates, Inc. 115
CHAPTER 6. SUMMARY, RECOMMENDATIONS, AND
CONCLUSIONS 6.1 SUMMARY Fly ash is the finely divided spherical residue resulting from the combustion of ground or pulverized coal. Fly ashes are generally heterogeneous and consist of a mixture of glassy particles with various crystalline phases such as quartz, mullite, and oxides of iron. The chemical composition of fly ash chiefly includes CaO, SiO2, Al2O3, and Fe2O3. There are traces of several other chemicals. The chemical properties depend mostly on the source of the coal burnt to form the fly ash. ASTM C 618 uses two main classes to define fly ashes, Class C and Class F, based on the total amount of SiO2, Al2O3, and Fe2O3. There is also a requirement on the amount of unburnt carbon or the LOI. An additional class of fly ash, defined by ASTM C 618 as Class N, represents raw or calcined natural pozzolans. Fly ash is used as a partial replacement to cement in concrete for the following main reasons:
• Fly ash generally can make concrete more workable and can improve finishing. • Fly ash can reduce the heat of hydration and delay set times, reducing thermal stresses in
early age concrete. • Fly ash can increase the ultimate strength of concrete. • Fly ash can make concrete more durable, particularly to mitigate ASR and sulfate attack. • Fly ash reduces the CO2 footprint of concrete and reduces the embodied energy. • Using fly ash in concrete reduces disposal in landfills and address the issue of high
potential hazard to groundwater contamination. • Fly ash can reduce the cost of concrete depending on the hauling distance from the source
of production. The reduction in carbon footprint of concrete and the reduced unit cost of concrete have been the primary reasons for the FAA and State highway agencies to allow or require fly ash in the concrete mix. Additionally, the control of durability-related problems, particularly related to ASR and sulfate attack, as well as the ability to produce water-tight concrete, have increased its use in concrete. The current FAA specifications for portland cement concrete under Item P-501 permit partial replacement of cement with fly ash. A replacement rate between 15 and 30 percent by weight of the total cementitious content is specified. Fly ash is expected to meet the requirements of ASTM C 618 Class C, F, or N, and the LOI is limited to 6 percent for Classes F and N. Additionally, Class C fly ash materials are disallowed for projects with ASR potential. The benefits derived from using fly ash depend greatly on its mineralogical and chemical properties and the quantity of fly ash replacement used in the concrete mix (Malhotra & Mehta, 2008; Thomas, 2007). The performance of a concrete mix design with fly ash depends on the other constituents of the mix as well as the environmental conditions that the pavement is

Proportioning Fly Ash as Cementitious Material in Airfield Pavement Concrete Mixtures
116
subjected to. The following are a few examples of the influence of fly ash properties and composition on the performance and durability of concrete:
• The calcium oxide content, usually referred to as the oxide level or calcium content, is an indicator of the type of reaction the fly ash undergoes in a concrete mixture—pozzolanic or hydraulic. It is also an indicator of how it can enhance concrete durability.
o Fly ashes with low calcium content (<8-10 percent) are mostly a byproduct when bituminous or anthracite coals are used and are composed of alumino-silicate glasses and inert crystalline phases. They require an alkali medium found in the cement hydration process to form cementitious materials. These fly ashes are pozzolanic and are less reactive.
o Fly ashes with high calcium content (>20 percent) are produced from sub-bituminous or lignite coals. They are composed of calcium-alumino-silicate glass (a more reactive glass) and a range of crystalline phases that react with water. This combination makes this type of fly ash react rapidly, and these fly ashes are considered both pozzolanic and hydraulic.
o The calcium content influences the heat generated during the hydration process and could have an impact on concrete paved in extreme weather conditions. It also determines the ability of fly ash to control ASR-related expansion and its ability to resist sulfate attack.
• The alkali content of the fly ash and that of the cement are critical when used in combination with reactive aggregates. High alkali contents increase ASR potential.
• Fly ashes with higher carbon content, mostly typical of ASTM Class F materials, tend to absorb air entraining mixtures and result in lower air contents. Higher dosages of the admixture are required to achieve the same level of air content as an equivalent mix without fly ash replacement. While this can be an important consideration for paving in projects located in freeze-thaw climates, this would have no impact in warmer climates without freeze-thaw cycles.
• Pozzolanic activity of a fly ash is proportional to the amount of finer particles (i.e., particles less than 10μm). In general, particles coarser than 45 μm, usually forming about 25 percent or less of the fly ash, have little contribution to the pozzolanic reaction.
While the current specifications have served the needs of engineers for many years, they pose certain drawbacks for wider usage, especially in light of the documented findings on the effect of fly ash composition on mix characteristics. In addition, these specifications provide little guidance on how fly ash composition affects mix durability and performance when specific types of materials are used to make up the remaining components of the concrete mixture proportioning process. These parameters need to be evaluated not individually, but in combination. For example, a fly ash resulting in acceptable levels of air content with a particular gradation for sand might produce different levels of air content when the sand gradation is changed. A percentage replacement of cement with fly ash, when used successfully in combination with one aggregate type, might not be suitable with another aggregate type, or it might be suitable for one climatic condition but not another. Likewise, a fineness level resulting in good performance at a certain LOI might not be as effective when the carbon content changes.

Proportioning Fly Ash as Cementitious Material in Airfield Pavement Concrete Mixtures
Applied Research Associates, Inc. 117
The current study sought to close this gap between the available knowledge on effects of fly ash on concrete and the current practice. The goal was to provide guidance on how a fly ash can be incorporated in a mix to realize its benefits and to overcome some limitations it might pose for use under current specifications. The project considers the effect of fly ash mineralogical, chemical, and physical parameters rather than its ASTM classification. It allows the best use of locally available materials including fly ash, cement, and aggregates to achieve the constructability, strength, and performance requirements. The project also considered the effect of temperature and curing conditions on concrete strength gain and other properties. The guidelines developed under this study were based largely on empirical data available from laboratory tests and literature review. In addition, the recommended practices were verified through case studies and laboratory test data. 6.2 RECOMMENDATIONS The guidelines developed under this study are presented in the form of a mix optimization catalog. This catalog synthesizes the knowledge and understanding of fly ash properties and its effects on concrete and is laid out for practical use in a mix optimization process. The guidelines are presented in a separate document. The inputs required for using the catalog include information on the project conditions as well as the materials considered for use. The parameters required for using the recommendations are described in Table 28.
Table 28. Project-specific conditions required for using the mix optimization catalog
Parameter Options Basis or criterion Deicer exposure Yes or No Local climate based information Aggregate reactivity
Reactive or Non-reactive
16-day expansion from ASTM C 1260 test • >0.2% – Reactive • <0.1% – Non-reactive • 0.1-0.2% – Either confirm with ASTM C 1293 or
conservatively assume the aggregate is reactive Cement alkalinity
High alkali or Low alkali
Alkali content from ASTM C 150 • >=0.6% – High alkali • <0.6% – Low alkali
Time to opening to traffic
Critical or Non-critical
Time between paving and opening to traffic • Less than 14 days – Critical • More than 14 days – Non-critical
Paving weather Cool, Moderate, or Hot
Expected paving temeature • <60°F – Cool • 60 to 80°F – Moderate • >80°F – Hot
Proportioning Fly Ash as Cementitious Material in Airfield Pavement Concrete Mixtures
118
The selection of project-specific conditions results in 48 unique combinations of the 5 parameters. For each combination, the mix optimization catalog guides the user to a range of fly ash contents for the project and gives ranges of permissible calcium oxide levels, fineness, and LOI. Next, it alerts the user to additional requirements needed to use fly ash successfully in a project. This includes information on the admixtures that may be necessary to achieve the workability and finishing, rate of strength gain, and curing practices ensuring moisture availability throughout the hydration of the cementitious materials. Finally, the catalog outlines the tests that need to be run to select the optimum fly ash content for the specific project conditions. The recommended tests include fresh concrete tests, one or many of the hardened concrete tests for strength and durability, and mortar bar tests for durability. The list of materials review tests is also identified in the catalog. The tests included in the recommendations are as follows: Fresh Concrete Tests
• ASTM C 143 for measuring the slump of concrete to meet the P-501 specification requirements of 1 to 2 inches for side-form concrete and 0.5 to 1.5 inches for slip-form paving concrete
• ASTM C 138, ASTM C 173, or ASTM C 231 to determine the air content by gravimetric, volumetric, or pressure methods, respectively, to meet the air content requirements of the P-501 specification. Note that the air content requirements are presented in the P-501 specification as a function of exposure level and maximum aggregate size ranging from 2 percent for mild exposure and 2-inch aggregate size to 7 percent for severe exposure level and ½-inch aggregate size
• ASTM C 138 for determining the unit weight of concrete • ASTM C 403 to determine the initial and final set times of the paste. This test is not a
requirement in the P-501 specification, but it has been added to the list of recommended tests for fresh concrete because the effect on set time with varying fly ash replacements can be evaluated while selecting optimum replacement rate. Some fly ashes have a less significant impact on set time than others do and can be an important consideration in determining the exact saw time.
• ASTM C 232 to determine the bleeding in concrete. This test is not a requirement under the current P-501 specification, but it has been recommended to evaluate the effect of fly ash replacement rate on bleeding of concrete. This is critical to plan the curing regime and the time of curing after placement.
Hardened Concrete Tests
• ASTM C 78 for measuring the flexural strength of concrete if the flexural strength criterion is used for the project consistent with the P-501 specifications. The samples for the flexural strength will be cast in accordance with ASTM C 192. The age at testing is as per project requirements. However, a 28-day strength requirement is determined for most projects.
• ASTM C 39 for compressive strength of concrete when the design strength in paragraph 501-3.1 is based on compressive strength. The compressive strength tests shall be performed at the same ages as the flexural strength tests, typically the 28-day strength.

Proportioning Fly Ash as Cementitious Material in Airfield Pavement Concrete Mixtures
Applied Research Associates, Inc. 119
• ASTM C 78 and C 39 tests are recommended to measure the strength gain rate of a concrete mix. Strength gain rates are specific to projects with early opening requirements and are recommended at 3, 7, 14, 28, and 56 days.
• ASTM C 457 to determine the air void parameters in hardened concrete. This test is not specified in the current P-501 specification, but it is recommended to ensure that the air content and air void distribution required for freeze-thaw resistance are achieved. The total air content specified in section 501-3.3 should be verified. Additionally, the entrained air content should be no less than 3 percent, and the spacing factor determined from ASTM C 457 tests should be less than 0.01 inches.
• ASTM C 666 to determine the resistance of concrete to rapid freeze-thaw. The current P-501 specification requirements of minimum durability factor of 95 percent will apply to the trial batch samples.
• ASTM C 672 to determine the scaling resistance of concrete surfaces exposed to deicing chemicals. This test is not a requirement in the current P-501 specification but is recommended to ensure that mixes recommended with higher levels of fly ash replacement do not increase the scaling potential of the concrete.
The test for elastic modulus, ASTM C 469, may also be included in the hardened concrete tests. Mortar Tests
• Standard ASTM C 1567 using 1N NaOH as the soak solution to determine the ASR potential for the combined cementitious materials and aggregate. Mortar bars, one with coarse aggregate and one with fine aggregate, are to be tested independently. This is not a required test in the current specifications but is recommended in the mix optimization catalog to assess the collective impact of the cement, fly ash at the recommended replacement rate, and the aggregate in mitigating ASR when the project is not exposed to deicer chemicals.
• Refer to FAA’s most current policy on mitigation testing. At the time of the publication of this report, the Modified ASTM C 1567 was considered an interim test to screen aggregates for ASR potential and mitigating deicer distress potential simultaneously (ACPA, 2011). This involves performing the ASTM C 1567 test using 3M KAc + 1N NaOH as the soak solution and measuring mortar bar expansions at the end of 14 days. It is assumed that each aggregate either has been screened already or will be screened concurrently for freeze-thaw durability.
Materials Review
• ASTM C 150 for cement. • ASTM C 311 and C 618 for fly ash. • ASTM C 1260, C 1293, C 295, C 227, and C 289 for aggregates.
Based on the recommendations, the user is expected to select three fly ash contents in the range provided and batch in a laboratory according to the guidelines. The results from the recommended tests are to be reviewed, and the data plotted and analyzed, to determine the

Proportioning Fly Ash as Cementitious Material in Airfield Pavement Concrete Mixtures
120
optimum fly ash content. The user is expected to rebatch at the optimum level and perform all recommended tests to verify that the approved mix meets all performance requirements. Verification and Validation Six airfield project case studies were used to validate the catalog. The projects selected included cases where a careful selection of fly ash replacement level was made based on laboratory tests and resulted in successful use of fly ash from the standpoint of constructability and mitigation of ASR. The case studies also included projects where either an incorrect dosage of fly ash or the elimination of fly ash from a mix design resulted in poor field performance. In addition to the case studies, the recommendations were validated using nine laboratory mix designs. The laboratory tests covered a wide range of parameters allowed by the catalog, although a majority of the tests covered mixes for deicer exposure using reactive aggregates. A series of strength tests and durability tests were performed and used in fine-tuning the catalog recommendations. 6.3 CONCLUSIONS The research conducted under this study finds that the current specifications do not permit the best combination of fly ash cement in proportioning concrete mixtures for performance. For a certain set of materials to be used in a project, the optimum combination of fly ash and cement depends on the properties of the fly ash, the properties of the other mix constituents, and the paving conditions. Achieving optimum results requires:
• The use of the right combination of materials including fly ash, cement type, and admixtures
• A thorough consideration of the interaction of fly ash with other materials and construction conditions
• Appropriate mix proportioning • Adequate curing • Verification through testing
The recommendations developed under this study provide systematic guidelines and have been significantly validated through project case studies and a comprehensive laboratory test program.

Proportioning Fly Ash as Cementitious Material in Airfield Pavement Concrete Mixtures
Applied Research Associates, Inc. 121
REFERENCES
RELEVANT ASTM TESTS Fly Ash Tests ASTM Standard C 311 - 07, “Standard Test Methods for Sampling and Testing Fly Ash or Natural Pozzolans for Use in Portland-Cement Concrete,” ASTM International, West Conshohocken, PA, 2007. ASTM Standard C 618 - 08a, “Standard Specification for Coal Fly Ash and Raw or Calcined Natural Pozzolan for Use in Concrete,” ASTM International, West Conshohocken, PA, 2008. CSA, “A3001-08 Cementitious materials for use in concrete,” 2008 Tests for Fresh Concrete ASTM Standard C 138 / C 138M - 08, “Standard Test Method for Density (Unit Weight), Yield, and Air Content (Gravimetric) of Concrete,” ASTM International, West Conshohocken, PA, 2008. ASTM Standard C 143 / C 143M - 08, “Standard Test Method for Slump of Hydraulic-Cement Concrete,” ASTM International, West Conshohocken, PA, 2008. ASTM Standard C 173 / C 173M - 08, “Standard Test Method for Air Content of Freshly Mixed Concrete by the Volumetric Method,” ASTM International, West Conshohocken, PA, 2008. ASTM Standard C 231 - 08c, “Standard Test Method for Air Content of Freshly Mixed Concrete by the Pressure Method,” ASTM International, West Conshohocken, PA, 2008. ASTM Standard C 232 - 07, “Standard Test Methods for Bleeding of Concrete,” ASTM International, West Conshohocken, PA, 2007. ASTM Standard C 305 - 06, “Standard Practice for Mechanical Mixing of Hydraulic Cement Pastes and Mortars of Plastic Consistency,” ASTM International, West Conshohocken, PA, 2006. ASTM Standard C 403 / C 403M - 08, “Standard Test Method for Time of Setting of Concrete Mixtures by Penetration Resistance” ASTM International, West Conshohocken, PA, 2008. Tests of Strength ASTM Standard C 39 / C 39M - 05e2, “Standard Test Method for Compressive Strength of Cylindrical Concrete Specimens,” ASTM International, West Conshohocken, PA, 2010.
Proportioning Fly Ash as Cementitious Material in Airfield Pavement Concrete Mixtures
122
ASTM Standard C 78 - 08, “Standard Test Method for Flexural Strength of Concrete (Using Simple Beam with Third-Point Loading),” ASTM International, West Conshohocken, PA, 2008. ASTM Standard C 469 - 10, “Standard Test Method for Static Modulus of Elasticity and Poisson's Ratio of Concrete in Compression,” ASTM International, West Conshohocken, PA, 2010. Tests for Concrete Durability ASTM Standard C 227 - 03, “Standard Test Method for Potential Alkali Reactivity of Cement-Aggregate Combinations (Mortar-Bar Method),” ASTM International, West Conshohocken, PA, 2003. ASTM Standard C 289 - 07, “Standard Test Method for Potential Alkali-Silica Reactivity of Aggregates (Chemical Method),” ASTM International, West Conshohocken, PA, 2007. ASTM Standard C 295 - 08, “Standard Guide for Petrographic Examination of Aggregates for Concrete,” ASTM International, West Conshohocken, PA, 2008. ASTM Standard C 457 - 08c, “Standard Test Method for Microscopical Determination of Parameters of the Air-Void System in Hardened Concrete,” ASTM International, West Conshohocken, PA, 2008. ASTM Standard C 666 / C 666M - 03(2008), “Standard Test Method for Resistance of Concrete to Rapid Freezing and Thawing,” ASTM International, West Conshohocken, PA, 2008. ASTM Standard C 672 / C 672M - 03, “Standard Test Method for Scaling Resistance of Concrete Surfaces Exposed to Deicing Chemicals,” ASTM International, West Conshohocken, PA, 2003. ASTM Standard C 1012 - 04, “Standard Test Method for Length Change of Hydraulic-Cement Mortars Exposed to a Sulfate Solution,” ASTM International, West Conshohocken, PA, 2004. ASTM Standard C 1260 - 07, “Standard Test Method for Potential Alkali Reactivity of Aggregates (Mortar-Bar Method),” ASTM International, West Conshohocken, PA, 2007. ASTM Standard C 1293 - 08b, “Standard Test Method for Determination of Length Change of Concrete Due to Alkali-Silica Reaction,” ASTM International, West Conshohocken, PA, 2008. ASTM Standard C 1567 - 08, “Standard Test Method for Determining the Potential Alkali-Silica Reactivity of Combinations of Cementitious Materials and Aggregate (Accelerated Mortar-Bar Method),” ASTM International, West Conshohocken, PA, 2008. FAA, Engineering Brief No. 70, “Accelerated Alkali-Silica Reactivity in Portland Cement Concrete Pavements Exposed to Runway Deicing Chemicals,” FAA EB-70, 2005.

Proportioning Fly Ash as Cementitious Material in Airfield Pavement Concrete Mixtures
Applied Research Associates, Inc. 123
ACPA, “Mitigating Deicer Induced Distress Potential A Revision of an Interim Procedure:” Appendix A – Preparation of 3M Potassium Acetate + 1N Sodium Hydroxide Soak Solution for Use in the Modified ASTM C 1260 and ASTM C 1567 Procedures, and Appendix B - 2011 Interim Procedure for Screening Aggregates and Mitigating Deicer Distress Potential, R&T Update, 2011. REFERENCES IN REPORT American Coal Ash Association, “Coal Combustion Products Production & Use Statistics – 2009 CCP Report” http://acaa.affiniscape.com/displaycommon.cfm?an=1&subarticlenbr=3, (accessed in February 2011). ACI 232.2R-03, “Use of Fly Ash in Concrete,” Reported by ACI Committee 232, American Concrete Institute, 2004. Aïtcin, Pierre-Claude, “Modern Concrete Technology,” Taylor & Francis, 270 Madison Avenue, New York, 2008. Alonso, J.L. and Wesche, K., “Characterization of Fly Ash, Chapter 1, Fly Ash in Concrete: Properties and Performance,” edited by Wesche, K. Rilem Report 7, 1991. Boudreau, R.L., Millard, M., Kurtis, K. and Dokka, V., “Lithium Admixtures and Early Age Concrete Properties,” Report IPRF-01-G-002-04-6, Innovative Pavement Research Foundation, Skokie, 2006. Bouzoubaa, N., Tamtsia, B., Zhang, M.H., Chevrier, R.L., Bilodeau, A. and Malhotra, V.M., “Carbonation of Concrete Incorporating High Volumes of Fly Ash¸” ACI Special Publication SP234-19, Volume 234, 2006. Brooks,J. J., “Prediction of Setting Time of Fly Ash Concrete,” ACI Materials Journal, American Concrete Institute, Volume 99, Issue 6, 2002. Bureau of Land Reclamation, “Fly ash Increases Resistance of Concrete of Sulfate Attack,” Concrete and Structural Branch, Research Division, Bureau of Land Reclamation, 1967. Cain, C. J., “Mineral Admixtures, Chapter 46, Significance of Tests and Properties of Concrete and Concrete-Making Materials,” edited by Klieger, P and Lamond J.F. ASTM STP-169C, American Society for Testing and Materials, 1994. Carette, G.G. and Malhotra, V.M., “Characterization of Canadian Fly Ashes and Their Relative Performance in Concrete,” Report 86-6E. Canada Center for Mineral and Energy Technology (CANMET), Ottawa, 1986. Chindaprasirta,P., Jaturapitakkulb, C. and Sinsiric, T., “Effect of Fly Ash Fineness on Compressive Strength and Pore Size,” Cement and Concrete Composites, Volume 27, Issue 4, April 2005.

Proportioning Fly Ash as Cementitious Material in Airfield Pavement Concrete Mixtures
124
Chindaprasirta,P., Jaturapitakkulb, C. and Sinsiric, T., “Effect of Fly Ash Fineness on Microstructure of Blended Cement Paste,” Construction and Building Materials, Volume 21, Issue 7, July 2007. Cost, T., “Incompatibility of Common Concrete Materials: Influential Factors, Effects, and Prevention,” Proceedings of the 2006 Concrete Bridge Conference, Reno, Nevada, 2006. Cost, T., Gardiner, A., “Practical Concrete Mixture Evaluation via Semi-Adiabatic Calorimetry,” NRMCA Technology Forum, 2009. Davis, R.E., Carlson, R.W., Kelly, J.W. and Davis, H.E., “Properties of Cements and Concretes Containing Fly Ash,” ACI Journal Proceedings, American Concrete Institute, Volume 33, Issue, 5, 1937. Desai, J.P., “Construction and Performance of High Volume Fly Ash Roads in India,” ACI SP-221, V.M. Malhotra, ed. 2004. Dhir, R.K. McCarthy, M.J. and Magee, B.J., “Impact of BS EN 450 PFA on concrete construction in the UK,” Construction and Building Materials, Volume 12, No. 1, 1998. Dockter, B.A., Jagiella, D.M. Engineering and Environmental Specifications of State Agencies for Utilization and Disposal of Local Combustion Products: Vol. 1 – DOT Specifications. Final Report, CBRC Project Number: 02-CBRC-W12, 2005-EERC-07-04, 2005. Dodson, V. H. “Effects of Fly Ash on the Times of Setting of Concrete-Chemical or Physical,” Proceedings of the Symposium on Fly Ash Incorporation in Hydrated Cement Systems, Materials Research Society, Boston, 1981. Dikeou, J.T., “Fly Ash Increases Resistance of Concrete to Sulfate Attack,” In: Research Report, A Water Resources Technical Publication, Number 23, Bureau of Reclamation, 1970. Dunstan, E.R. “A Possible Method for Identifying Fly Ashes that will Improve the Sulfate Resistance of Concretes,” ASTM Journal of Cement, Concrete and Aggregates, Volume 2, Issue 1, 1980. Dunstan, E.R., “The Effect of Fly Ash on Concrete Alkali-Aggregate Reaction,” ASTM Journal of Cement, Concrete and Aggregates, Volume 3, Issue 2, 1981. Dunstan, E.R. “A Spec Odyssey—Sulfate Resistant Concrete for the1980s,” ACI Special Publication SP-77, American Concrete Institute, 1982. Folliard, K. and Drimalas, T., “Evaluation of Class C Fly Ash in Sulfate Environments,” Report No. FHWA/TX-08/0-4889-2, Texas Department of Transportation, Austin, 2007.

Proportioning Fly Ash as Cementitious Material in Airfield Pavement Concrete Mixtures
Applied Research Associates, Inc. 125
Frohnsdorff, G. and Clifton, J.R., “Fly Ashes in Cements and Concrete: Technical Needs and Opportunities,” Washington: U.S. Department Of Commerce, National Bureau of Standards, 1981. Gava, G.P. and Prudêncio, L.R., “Pozzolanic Activity Tests as a Measure of Pozzolans’ Performance. Parts 1 and 2,” Magazine of Concrete Research, Volume 59, Issue 10, 2007. Gebler, S. and Klieger, P. Effect of fly ash on the air-void stability of concrete. In Fly Ash, SilicaFume, Slag, and Other Mineral Byproducts in Concrete, SP-79, Malhotra, V.M., Ed., pp. 103–142. American Concrete Institute, 1983. Gebler, S. and Klieger, P. “Effect of fly ash on physical properties of concrete,” In Proceedings of the 2nd International Conference on the Use of Fly Ash, Silica Fume, Slag, and Natural Pozzolans in Concrete, Volume 2, SP-91, Malhotra, V.M., Ed., pp. 1–50. American Concrete Institute, 1986. Gopalan, M. K. and Haque, M. N., “Effect of Curing Regime on the Properties of Fly-Ash Concrete,” ACI Materials Journal, American Concrete Institute, Volume 84, Issue 1, 1987. Harrison, T. “Standards for Fresh Concrete,” BSI Standards, Revised Edition, British Standards Institution, 2004. Ishikawa, Y. “Research on the Quality Distribution of JIS Type-II Fly Ash in Japan,” World of Coal Ash conference, Covington, Kentucky, 2007. Kalousek, G.L. and Benton, E.J., “Mechanisms of Sea Water Attack on Cement Pastes,” ACI Proceedings, American Concrete Institute, Volume 67, No. 2, 1970. Klieger, P. and Gebler, S. “Fly ash and Concrete Durability,” In Concrete Durability: Katharine and Bryant Mather International Conference, Volume 1, SP-100, edited by Scanlon, J.M., American Concrete Institute, 1987. Klieger, P. and Lamond, J.F., “Significance of Tests and Properties of Concrete and Concrete-making Materials,” STP169D, American Society for Testing and Materials, 1994. Lammertijn, S. and De Belie, N., “Porosity, Gas Permeability, Carbonation and their Interaction in High Volume Fly Ash Concrete,” Magazine of Concrete Research, Volume 60, No. 7, 2008. Lane, R.O. “Effects of Fly Ash on Freshly Mixed Concrete,” Concrete International, Volume 5, Issue 10, 1983. Langan, B.W. and Ward, M.A., “Significance of Interrupted Testing on the Freeze-Thaw Resistance of Fly Ash Concrete by ASTM C 666 (Method A),” ASTM Journal of Cement, Concrete and Aggregates, Volume 9, Issue 2, January 1987.
Proportioning Fly Ash as Cementitious Material in Airfield Pavement Concrete Mixtures
126
Larson, T.D., “Air Entrainment and Durability Aspects of Fly Ash Concrete,” ASTM Proceedings, American Society for Testing and Materials, Volume 64, 1994. Lee, S.H., Kin, H.J., Sakai, E. and Daimon.M., “Effect of Particle Size Distribution of Fly Ash–Cement System on the Fluidity of Cement Pastes,” Cement and Concrete Research, Volume 33, Issue 5, May 2003. Malhotra, V.M., “Mineral Admixtures, Chapter 2, Concrete Construction Engineering Handbook,” Edited by E. G. Nawy, Second Edition, C.R.C. Press, 2008. Malhotra, V.M., and Mehta, P.K., “Pozzolanic and Cementitious Materials,” Gordon and Breech Publishers, 1996. Malhotra, V.M., and Mehta, P.K., “High Performance, High-Volume Fly Ash Concrete for Building Sustainable and Durable Structures,” 3rd Edition, Supplementary Cementitious Materials for Sustainable Development, Inc., Ottawa, Canada, 2008. Malvar, L. J., Cline, G. D., Burke, D. F., Rollings, R., Sherman, T. W. and Greene, J., “Alkali Silica Reaction Mitigation: State-of-the-Art and Recommendations,” ACI Materials Journal, American Concrete Institute, Volume 99, No. 5, 2002. Malver, J.L. and Lenke, L.R., “Efficiency of Fly Ash in Mitigating Alkali-Silica Reaction Based on Chemical Composition,” ACI Materials Journal, American Concrete Institute, Volume 103, No. 5, 2006. Manz, O.E. “Coal Fly Ash: A Retrospective and Future Look,” Energeia, Volume 9, No. 2, 1998. http://www.caer.uky.edu/energeia/PDF/vol9-2.pdf Manz, O.E. et al., In Proceedings of the 3rd International Conference on the Use of Fly Ash, Silica Fume, Slag, and Natural Pozzolans in Concrete (supplementary papers), 1989, pp. 16–32. Mather, K., “Factors affecting Sulfate Resistance of Mortars,” 7th International Congress on the Chemistry of Cement, Volume IV, 1980. Mehta, P.K., “Effect of Lime on Hydration of Pastes Containing Gypsum and Calcium Aluminates or Calcium Sulfoaluminates,” Journal of Ceramic Society, Volume 56, 1973. Mehta, P.K. “Pozzolanic and Cementitious by-products in concrete—Another look,” Proceedings of the 3rd Intl. Conference, Ed; V.M. Malhotra, 1714 pp., 1987. Mehta, P.K., “Testing and Correlation of Fly Ash Properties with Respect to Pozzolanic Behaviour,” Report CS3314. Electric Power Research Institute, 1994. Nagataki, S., Tomosawa, F., Kanazu, T. and Yamamoto, T., “Classification of Fly Ash According to Japan Industrial Standard, JIS A 62014999,” ACI Special Publication, American Concrete Institute, Volume 199, pp 29-42, 2001.
Proportioning Fly Ash as Cementitious Material in Airfield Pavement Concrete Mixtures
Applied Research Associates, Inc. 127
Naik,T.R. and Ramme, B.W., “Effects of High-Lime Fly Ash Content on Water Demand, Time of Set, and Compressive Strength of Concrete,” ACI Materials Journal, American Concrete Institute, Volume 87, Issue 6, 1990. Naik, T. R., and Singh, S. S., “Influence of Fly Ash on Setting and Hardening Characteristics of Concrete Systems,” ACI Materials Journal, American Concrete Institute, Volume 94, Issue 5, 1997. Owen, P.L., “Fly Ash and its Usage in Concrete,” Journal of Concrete Society, U.K., Vol. 13, No. 7, 1979. Patoary, M. K. H. and Nimityongskul,P., “Effects of Ground and Classified Fly Ash on Properties of High-Performance Concrete,” ACI Special Publication SP200-16 , American Concrete Institute, 2001. Popovics, S., “Concrete Materials: Properties, Specifications and Testing,” Second Edition, Noyes Publication, 1992. Portland Cement Association, “Portland Cement, Concrete, and Heat of Hydration,” Concrete Technology Today 18, no. 2, 1997. Portland Cement Association (S. Kosmatka, B. Kerkhoff, W. Panarese), “Design and Control of Concrete Mixtures,” 14th Edition, PCA, Chicago, IL, 2008. (15th Edition published in 2011) Rangaraju, P.R., “Mitigation of ASR in Presence of Pavement Deicing Chemicals,” Report IPRF-01-G-002-04-8, Innovative Pavement Research Foundation, Skokie, 2007. Rangaraju, P.R., Olek, J., “Potential for Acceleration of ASR in the Presence of Pavement Deicing Chemicals,” Report IPRF-01-G-002-03-9, Innovative Pavement Research Foundation, Skokie, 2007. Rao, C., Stehly, R., Ardani, A., “Proportioning Fly Ash as Cementitious Material in Airfield Pavement Concrete Mixtures,” Mix Optimization Catalog for Project IPRF-01-G-002-06-2, April 2011. Ravina, D., “Slump Loss of Fly Ash Concrete,” Concrete International, Vol. 6, Issue 4, 1984. Sear, L.K.A., “The Properties and Use of Coal Fly Ash,” Thomas Telford Ltd, 2001. Sear, L.K.A., “The Equivalent Concrete Performance Concept to EN206 –the UK Approach,” Fly ash in concrete Seminar, Poland, 2005. http://www.ukqaa.org.uk/Papers/TheEquivalentConcretePerformanceConcept_Poland_March_2005.pdf
Proportioning Fly Ash as Cementitious Material in Airfield Pavement Concrete Mixtures
128
Shehata, M.H., Adhikari, G. and Radomski, S., “Long-Term Durability of Blended Cement Against Sulfate Attack,” ACI Materials Journal, American Concrete Institute, Vol. 105, No. 6, 2008. Shi, C. and Qian, J., “Activated Blended Cement Containing High Volume Coal Fly Ash,” Advances in Cement Research, Volume 13, Issue 4, 2001. Schindler, A. K., “Prediction of Concrete Setting,” International RILEM Symposium on Concrete Science and Engineering: A Tribute to Arnon Bentur, Evanston, 2004. Swamy, R.N., Sami,A.R. and Theodorakopoulos, D.D., “Early Strength Fly Ash Concrete for Structural Applications,” ACI Journal Proceedings, American Concrete Institute, 1983. Tangtermsirikul, S., “Class C Fly Ash as a Shrinkage Reducer for Cement Paste,” ASTM Special Publication, American Society for Testing and Materials, Volume 153, 1995. Tangtermsirikul, S., “Effect of Chemical Composition and Particle Size of Flyash on Autogeneous Shrinkage of Paste, Autogenous Shrinkage of Concrete,” Edited by EI-Ichi Tazawa, Taylor & Francis, 1999. Thomas, M.D.A. and Matthews, J.D., “The Permeability of Fly Ash Concrete,” Materials and Structures, Volume 25, Number 7, 1992. Thomas M.D.A., Shehata M.H. and Shashiprakash S.G., “The use of Fly Ash in Concrete: Classification by Composition,” ASTM Journal of Cement, Concrete & Aggregates, Volume 21, Issue 2, 1999. Thomas, M. D. A., “Optimizing the Use of Fly Ash in Concrete,” IS548, Portland Cement Association, Skokie, IL, 2007. Thomas, M. D. A., Fournier, B., Folliard K.J., “Report on Determining the Reactivity of Concrete Aggregates and Selecting Appropriate Measures for Preventing Deleterious Expansion in New concrete Construction,” Report No. FHWA-HIF-09-001, Office of Pavement Technology Federal Highway Administration, April 2008. Tikalsky,P.J. and Carrasquillo, R.L. “Influence of Fly Ash on the Sulfate Resistance of Concrete, ACI Materials Journal,” American Concrete Institute, Volume 89, No. 1, 1992. Tikalsky,P.J. and Carrasquillo, R.L. “Fly Ash Evaluation and Selection for Use in Sulfate-Resistant Concrete,” ACI Materials Journal, American Concrete Institute, Volume 90, No. 6, 1993. USDOT Federal Aviation Administration, “Standards for Specifying Construction of Airports,” Advisory Circular NO. 150/5370-10E, September 2009.
Proportioning Fly Ash as Cementitious Material in Airfield Pavement Concrete Mixtures
Applied Research Associates, Inc. 129
USACE UNIFIED FACILITIES GUIDE SPECIFICATIONS, “Concrete Pavement for Airfields and Other Heavy-duty Pavements more than 10,000 cubic yards,” UFGS-32-13-11, April 2008. Van Dam, T., Peshkin, D., “Concrete Aggregate Durability Study,” Report No. FHWA-AZ-09-575, Arizona Department of Transportation, June 2009. Virtanen, J., “Freeze-thaw resistance of concrete containing blast-furnace slag, fly ash or condensed silica fume,” ACI special publication SP-79: The Use of Fly Ash, Silica Fume, Slag and Other Mineral By-products in Concrete, ed. V. M. Malhotra, ACI,1983. Wang, K., Ge, Z., Grove, J., Ruiz, M., Rasmussen, R., and Ferragut,T., “Developing a Simple and Rapid Test for Monitoring the Heat Evolution of Concrete Mixtures for Both Laboratory and Field Applications,” Report No. FHWA DTF61-01-00042, January 2007.


Proportioning Fly Ash as Cementitious Material in Airfield Pavement Concrete Mixtures
Applied Research Associates, Inc. A-1
APPENDIX – PETROGRAPHIC ANALYSIS OF CORES EXTRACTED FROM AIRFIELD PAVEMENTS UNDER CASE STUDIES A AND B
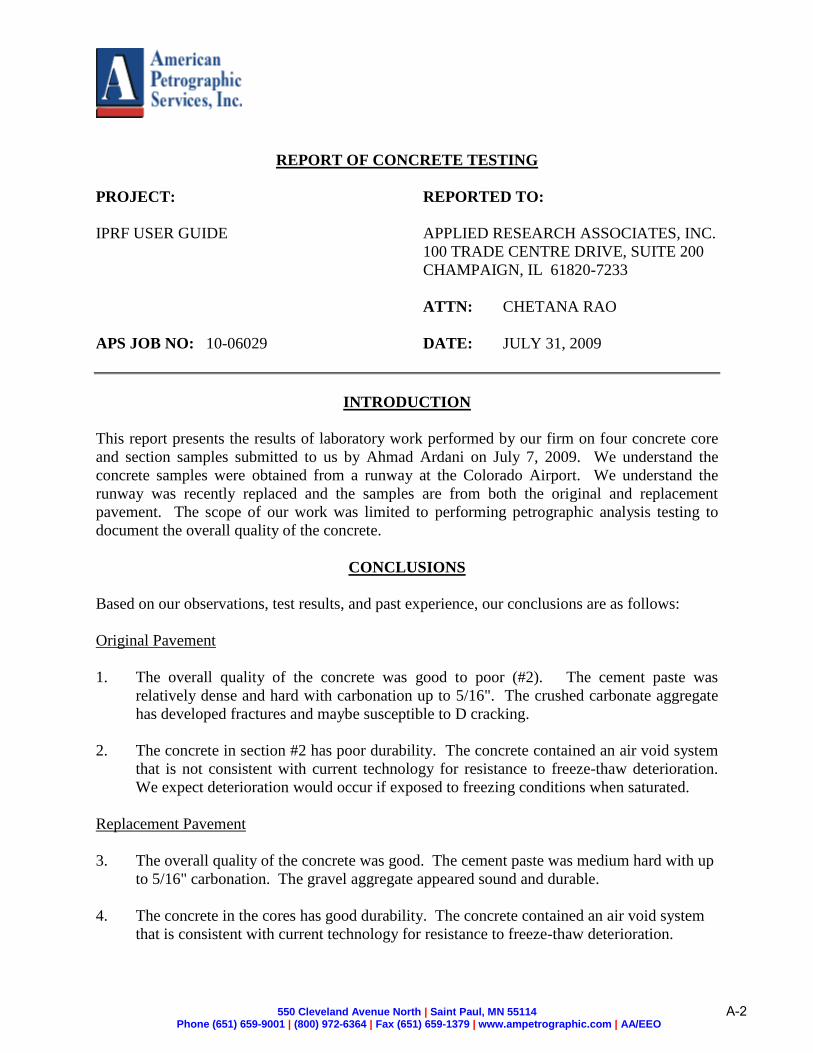
550 Cleveland Avenue North | Saint Paul, MN 55114 Phone (651) 659-9001 | (800) 972-6364 | Fax (651) 659-1379 | www.ampetrographic.com | AA/EEO
REPORT OF CONCRETE TESTING
PROJECT: REPORTED TO:
IPRF USER GUIDE APPLIED RESEARCH ASSOCIATES, INC.
100 TRADE CENTRE DRIVE, SUITE 200
CHAMPAIGN, IL 61820-7233
ATTN: CHETANA RAO
APS JOB NO: 10-06029 DATE: JULY 31, 2009
INTRODUCTION
This report presents the results of laboratory work performed by our firm on four concrete core
and section samples submitted to us by Ahmad Ardani on July 7, 2009. We understand the
concrete samples were obtained from a runway at the Colorado Airport. We understand the
runway was recently replaced and the samples are from both the original and replacement
pavement. The scope of our work was limited to performing petrographic analysis testing to
document the overall quality of the concrete.
CONCLUSIONS
Based on our observations, test results, and past experience, our conclusions are as follows:
Original Pavement
1. The overall quality of the concrete was good to poor (#2). The cement paste was
relatively dense and hard with carbonation up to 5/16". The crushed carbonate aggregate
has developed fractures and maybe susceptible to D cracking.
2. The concrete in section #2 has poor durability. The concrete contained an air void system
that is not consistent with current technology for resistance to freeze-thaw deterioration.
We expect deterioration would occur if exposed to freezing conditions when saturated.
Replacement Pavement
3. The overall quality of the concrete was good. The cement paste was medium hard with up
to 5/16" carbonation. The gravel aggregate appeared sound and durable.
4. The concrete in the cores has good durability. The concrete contained an air void system
that is consistent with current technology for resistance to freeze-thaw deterioration.
A-2

APS #10-06029 - Page 2 of 3
SAMPLE IDENTIFICATION
Sample Number: 1 2 16.376 16.333
Sample Type: Concrete Section – Original Pavement Concrete Core – Replacement Pavement
Original Sample
Dimensions, in:
292 mm (11-1/2") x
184 mm (7-1/4") x
159 mm (6-1/4")
250 mm (9-13/16") x
187 mm (7-3/8") x
122 mm (4-13/16")
102 mm (4")
diameter x
413 mm (16-1/4")
long
102 mm (4")
diameter x
413 mm (16-1/4")
long
TEST RESULTS
Our complete petrographic analysis test results appear on the attached sheets entitled 00 LAB
001 "Petrographic Examination of Hardened Concrete, ASTM:C856." A brief summary of the
general concrete properties is as follows:
1. The coarse aggregate in the original concrete sections was comprised of 1" maximum sized
crushed carbonate that was fairly well graded with good overall uniform distribution. The
concrete in the replacement concrete cores was comprised of 1" maximum sized gravel that
was fairly well graded with good distribution.
2. A purposeful addition of fly ash pozzolanic admixture was observed in all four concrete
samples.
3. The paste color in the cores was light to dark gray with.
4. The paste hardness of the cores was judged to be medium hardness with the paste/aggregate
bond considered fair to good.
5. The depth of carbonation was up to 5/16".
6. The water/cementitious ratio of the cores was estimated at between 0.40 to 0.49 with
approximately 3 to 11% unhydrated cement particles.
Air Content Testing
Sample Identification: 1 2 16.376 16.333
Total Air Analysis -
Air Void Content, %
Spacing Factor, in
5.7
0.007
2.3
0.010
4.4
0.006
5.0
0.006
Entrapped Air (%) 1.1 0.5 1.2 0.9
Entrained Air (%) 4.6 1.8 3.2 4.1
A-3

APS #10-06029 - Page 3 of 3
TEST PROCEDURES
Laboratory testing was performed on July 7, 2009, and subsequent dates. Our procedures were
as follows:
Petrographic Analysis A petrographic analysis was performed in accordance with APS Standard Operating Procedure
00 LAB 001, “Petrographic Examination of Hardened Concrete,” ASTM:C856-latest revision.
The petrographic analysis consisted of reviewing cement paste and aggregate qualities on a
whole basis as well as on a cut/polished section. The depth of carbonation was documented
using a phenolphthalein indicator solution applied on a freshly cut and polished surface of the
concrete sample. The water/cement ratio of the concrete was estimated by viewing a thin section
of the concrete under an Olympus BH-2 polarizing microscope at magnification up to 1000x.
Thin section analysis was performed in accordance with APS Standard Operating Procedure 00
LAB 013, “Determining the Water/Cement of Portland Cement Concrete, APS Method.” The
samples are first highly polished, then epoxied to a glass slide. The excess sample is cut from
the glass and the slide is polished until the concrete reaches 25 microns or less in thickness.
Air Content Testing Air content testing was performed using APS Standard Operating Procedure 00 LAB 003,
“Microscopical Determination of Air Void Content and Parameters of the Air Void System in
Hardened Concrete, ASTM:C457-latest revision.” The linear traverse method was used. The
concrete samples were cut perpendicular with respect to the horizontal plane of the concrete as
placed and then polished prior to testing.
REMARKS
The test samples will be retained for a period of at least thirty days from the date of this report.
Unless further instructions are received by that time, the samples may be discarded. Test results
relate only to the items tested. No warranty, express or implied, is made.
Report Prepared By:
American Petrographic Services, Inc.
_______________________________ _________________________________
Scott F. Wolter, P.G. Richard D. Stehly, P.E., FACI
President MN License No. 12856
MN License No. 30024
A-4

00 LAB 001 Petrographic Examination of Hardened Concrete
ASTM: C-856
Job No. 10-06029 Date: 7-23-2009 / 8-4-2009
Sample Identification: 1 Performed by: S. Malecha / D. Hunt
I. General Observations
1. Sample Dimensions: Our analysis was performed on a 171 mm (6-3/4") x 133 mm (5-1/4") x 30 mm (1-3/16") thick
polished section that was cut from the original 292 mm (11-1/2") x 184 mm (7-1/4") x 159 mm (6-1/4") thick hardened
concrete section.
2. Surface Conditions:
Top: Fairly rough surface covered with thin layer of bitumen and yellow paint
Bottom: Rough, irregular, fractured surface
3. Reinforcement: None observed
4. General Physical Conditions: The top surface of the concrete was covered with a thin layer of bitumen (???), up to
approximately 1 mm (1/32") thick with approximately 70% covered by yellow paint. A few microcracks were present.
Carbonation proceeds up to 8 mm (5/16") depth. The concrete contains purposeful air entrainment with a fairly well
distributed air void system. Ettringite was observed. No evidence of active alkali silica reaction observed. Good
overall condition.
II. Aggregate
1. Coarse: 25 mm (1") maximum sized crushed carbonate. The coarse aggregate was mostly sub-angular with many
angular and a few sub-rounded particles. Fairly well graded with good overall uniform distribution.
2. Fine: Quartz, feldspar, and lithic sand with several carbonate particles that was fairly well graded. The grains
were mostly sub-angular with many sub-rounded particles. Good overall uniform distribution.
III. Paste
1. Air Content: 5.7% total
2. Paste proportions: 23% to 25%
3. Depth of carbonation: Ranged from approximately 1 mm (1/32") up to 8 mm (5/16") depth from the top surface and
occurs intermittently proximate to a several coarse aggregate particles scattered throughout the
sample. Carbonation was observed up to approximately 10 mm (3/8") depth a saw cut side.
4. Pozzolan/Slag presence: A purposeful addition of fly ash was observed
5. Paste/aggregate bond: Good
6. Paste color: Mottled light tannish gray to gray
7. Paste hardness: Medium
8. Microcracking: A few subvertical microcracks proceed up to approximately 2 mm (1/16") depth from the top
surface.
9. Secondary deposits: White to clear ettringite was observed thinly lining many entrained voids scattered throughout
the sample. Ettringite was observed filling to partially filling many entrained sized air voids in
thin section.
10. Water/cementitious ratio: Estimated at between 0.45 to 0.50 with approximately 3-5% unhydrated or residual portland
cement clinker particles and a purposeful addition of fly ash was observed.
11. Cement hydration: Alites-mostly fully; Belites-moderate to well
IV. Conclusions
The general overall quality of the concrete was good.
A-5

00 LAB 001 Petrographic Examination of Hardened Concrete
ASTM: C-856
Job No. 10-06029 Date: 7-23-2009 / 8-4-2009
Sample Identification: 2 Performed by: S. Malecha / D. Hunt
I. General Observations
1. Sample Dimensions: Our analysis was performed on a 171 mm (6-3/4") x 113 mm (4-7/16") x 38 mm (1-1/2") thick
polished section that was cut from the original 250 mm (9-7/8") x 187 mm (7-3/8") x 122 mm (4-13/16") thick
hardened concrete section.
2. Surface Conditions:
Top: Rough, broomed surface
Bottom: Rough, irregular, fractured surface
3. Reinforcement: None observed
4. General Physical Conditions: The sample consists of a hardened concrete section with a fractured bottom surface, a
formed side surface, and a broomed top surface. A concrete overlay, approximately 1 mm (1/32") up to 3 mm (1/8")
thick, and a possible thin, white bonding agent was observed covering approximately 40% of the top surface of the
sample. The overlay appears fairly well bonded to the top surface of the sample. A few microcracks were present.
Carbonation proceeds up to 14 mm (9/16") depth. The concrete contains a small amount of purposeful air entrainment.
Several, irregular shaped, entrapped sized void spaces were observed scattered throughout the sample. Ettringite was
observed. No evidence of active alkali silica reaction observed. Good overall condition.
II. Aggregate
1. Coarse: 25 mm (1") maximum sized crushed carbonate. The coarse aggregate was mostly sub-angular with many
angular and a few sub-rounded particles. Fairly well graded with good overall uniform distribution.
2. Fine: Quartz, feldspar, and lithic sand and several carbonate particles that was fairly well graded. The grains were
mostly sub-angular with many sub-rounded particles. Good overall uniform distribution.
III. Paste
1. Air Content: 2.3% total
2. Paste proportions: 25% to 27%
3. Depth of carbonation: Ranged from negligible up to 8 mm (5/16") depth from the top surface along a subvertical
microcrack and occurs intermittently along a few subvertical microcracks up to approximately
14 mm (9/16") depth from the top surface. Also, intermittent carbonation was observed
proximate to a few coarse aggregate particles scattered throughout the sample.
4. Pozzolan/Slag presence: A purposeful addition of fly ash was observed
5. Paste/aggregate bond: Good
6. Paste color: Tannish gray
7. Paste hardness: Medium
8. Microcracking: A few subvertical drying shrinkage microcracks proceed up to 14 mm (9/16") depth from the
top surface.
9. Secondary deposits: White to clear ettringite was observed lining many entrained void spaces scattered throughout
the sample. Ettringite was observed filling to partially filling many entrained sized air voids in
thin section.
10. Water/cementitious ratio: Estimated at between 0.44 to 0.49 with approximately 5-7% unhydrated or residual portland
cement clinker particles and a purposeful addition of fly ash was observed.
11. Cement hydration: Alites-mostly fully; Belites-moderate to well
IV. Conclusions
The general overall quality of the concrete was good.
A-6

00 LAB 001 Petrographic Examination of Hardened Concrete
ASTM: C-856
Job No. 10-06029 Date: 7-23-2009 / 8-4-2009
Sample Identification: 16.333 Performed by: S. Malecha / D. Hunt
I. General Observations
1. Sample Dimensions: Our analysis was performed on a 413 mm (16-1/4") x 102 mm (4") x 48 mm (1-7/8") thick
polished section that was cut from the original 102 mm (4") diameter x 413 mm (16-1/4") long core.
2. Surface Conditions:
Top: Rough, screeded and broomed surface
Bottom: Rough, formed surface; placed on form
3. Reinforcement: None observed
4. General Physical Conditions: Grayish white curing compound appears to be covering much of the top surface. The
top surface was partially covered with green marker paint. Carbonation proceeds up to 6 mm (1/4") depth. The
concrete contains purposeful air entrainment with a fairly distributed air void system. The concrete core sample was
fractured, in an orientation subparallel to the top surface, between approximately 203 mm (8") and 209 mm (8-3/8")
depth from the top surface. No evidence of active alkali silica reaction observed. Good overall condition.
II. Aggregate
1. Coarse: 25 mm (1") maximum sized gravel. Rock types include granite, gneiss, felsite, gabbro, basalt, carbonate,
quartzite and sandstone with some chert. The coarse aggregate was mostly sub-rounded with several sub-
angular particles. Fairly well graded with good overall uniform distribution.
2. Fine: Quartz, feldspar and lithic particles with a few chert particles and mica particles that was fairly well graded.
The grains were mostly sub-angular with many sub-rounded particles. Good overall uniform distribution.
III. Paste
1. Air Content: 5.0% total
2. Paste proportions: 18% to 20%
3. Depth of carbonation: Ranged from negligible up to approximately 6 mm (1/4") depth from the top surface and
ranged from approximately 5 mm (3/16") up to 10 mm (3/8") depth from the cored edge
4. Pozzolan/Slag presence: A purposeful addition of fly ash was observed
5. Paste/aggregate bond: Fair
6. Paste color: Dark gray
7. Paste hardness: Medium
8. Microcracking: None observed
9. Secondary deposits: None observed
10. Water/cementitious ratio: Estimated at between 0.40 to 0.45 with approximately 9-11% unhydrated or residual portland
cement clinker particles and a purposeful addition of fly ash.
11. Cement hydration: Alites-moderate to mostly well; Belites-negligible
IV. Conclusions
The general overall quality of the concrete was good.
A-7
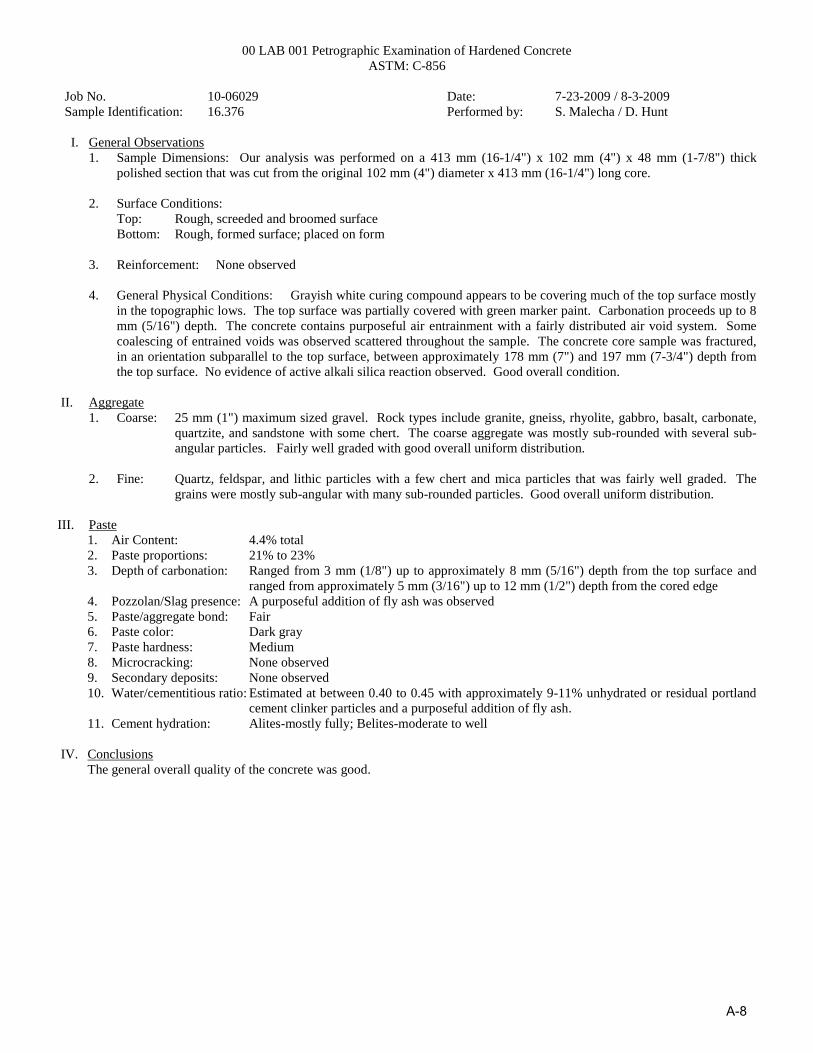
00 LAB 001 Petrographic Examination of Hardened Concrete
ASTM: C-856
Job No. 10-06029 Date: 7-23-2009 / 8-3-2009
Sample Identification: 16.376 Performed by: S. Malecha / D. Hunt
I. General Observations
1. Sample Dimensions: Our analysis was performed on a 413 mm (16-1/4") x 102 mm (4") x 48 mm (1-7/8") thick
polished section that was cut from the original 102 mm (4") diameter x 413 mm (16-1/4") long core.
2. Surface Conditions:
Top: Rough, screeded and broomed surface
Bottom: Rough, formed surface; placed on form
3. Reinforcement: None observed
4. General Physical Conditions: Grayish white curing compound appears to be covering much of the top surface mostly
in the topographic lows. The top surface was partially covered with green marker paint. Carbonation proceeds up to 8
mm (5/16") depth. The concrete contains purposeful air entrainment with a fairly distributed air void system. Some
coalescing of entrained voids was observed scattered throughout the sample. The concrete core sample was fractured,
in an orientation subparallel to the top surface, between approximately 178 mm (7") and 197 mm (7-3/4") depth from
the top surface. No evidence of active alkali silica reaction observed. Good overall condition.
II. Aggregate
1. Coarse: 25 mm (1") maximum sized gravel. Rock types include granite, gneiss, rhyolite, gabbro, basalt, carbonate,
quartzite, and sandstone with some chert. The coarse aggregate was mostly sub-rounded with several sub-
angular particles. Fairly well graded with good overall uniform distribution.
2. Fine: Quartz, feldspar, and lithic particles with a few chert and mica particles that was fairly well graded. The
grains were mostly sub-angular with many sub-rounded particles. Good overall uniform distribution.
III. Paste
1. Air Content: 4.4% total
2. Paste proportions: 21% to 23%
3. Depth of carbonation: Ranged from 3 mm (1/8") up to approximately 8 mm (5/16") depth from the top surface and
ranged from approximately 5 mm (3/16") up to 12 mm (1/2") depth from the cored edge
4. Pozzolan/Slag presence: A purposeful addition of fly ash was observed
5. Paste/aggregate bond: Fair
6. Paste color: Dark gray
7. Paste hardness: Medium
8. Microcracking: None observed
9. Secondary deposits: None observed
10. Water/cementitious ratio: Estimated at between 0.40 to 0.45 with approximately 9-11% unhydrated or residual portland
cement clinker particles and a purposeful addition of fly ash.
11. Cement hydration: Alites-mostly fully; Belites-moderate to well
IV. Conclusions
The general overall quality of the concrete was good.
A-8

AIR VOID ANALYSIS
This document shall not be reproduced, except in full, without written approval of American Petrographic Services, Inc.
550 Cleveland Avenue North $ St. Paul, MN 55114 $651-659-9001 $Fax 651-647-2744 $ www.ampetrographic.com AN AFFIRMATIVE ACTION AND EQUAL OPPORTUNITY EMPLOYER
PROJECT: REPORTED TO:
IPRF USER GUIDE AMERICAN ENGINEERING TESTING, INC.
550 CLEVELAND AVENUE NORTH
ST. PAUL, MN 55114
ATTN: DICK STEHLY
APS JOB NO:10-06029 DATE: JULY 28, 2009
Sample ID: 1
1 6
11
16
21
26
31
36
>4
0
0
50
100
150
200
250
# Voids
Cord Length
( in 0.001 inches)
Histogram
Conformance: The sample contains an air void
system which is consistent with
current technology for freeze-thaw
resistance.
Sample Data:
Description: Section of Hardened Concrete
Dimensions: 11-1/2" x 7-1/4" x 6-1/4" thick
Test Data: ASTM:C457 Linear Traverse
Method, APS SOP 00LAB003 and
ACI 116R
Air Void Content % 5.7
Entrained, % < 0.040” 4.6
Entrapped, %> 0.040” 1.1
Air Voids/inch 9.65
Specific Surface, in2/in3 680
Spacing Factor, inches 0.007
Paste Content, % estimated 25.0
Magnification 50x
Traverse Length, inches 100
Test Date 07/23/2009
Magnification: 30x Description: Overall hardened air content, 5.7% total
A-9

AIR VOID ANALYSIS
This document shall not be reproduced, except in full, without written approval of American Petrographic Services, Inc.
550 Cleveland Avenue North $ St. Paul, MN 55114 $651-659-9001 $Fax 651-647-2744 $ www.ampetrographic.com AN AFFIRMATIVE ACTION AND EQUAL OPPORTUNITY EMPLOYER
PROJECT: REPORTED TO:
IPRF USER GUIDE AMERICAN ENGINEERING TESTING, INC.
550 CLEVELAND AVENUE NORTH
ST. PAUL, MN 55114
ATTN: DICK STEHLY
APS JOB NO:10-06029 DATE: JULY 28, 2009
Sample ID: 2
1 6
11
16
21
26
31
36
>4
0
0
20
40
60
80
100
120
# Voids
Cord Length
( in 0.001 inches)
Histogram
Conformance: The sample contains an air void
system which is not consistent with
current technology for freeze-thaw
resistance.
Sample Data:
Description: Section of Hardened Concrete
Dimensions: 9-7/8" x 7-3/8" x 4-13/16" thick
Test Data: ASTM:C457 Linear Traverse
Method, APS SOP 00LAB003 and
ACI 116R
Air Void Content % 2.3
Entrained, % < 0.040” 1.8
Entrapped, %> 0.040” 0.5
Air Voids/inch 3.94
Specific Surface, in2/in3 690
Spacing Factor, inches 0.010
Paste Content, % estimated 26.0
Magnification 50x
Traverse Length, inches 100
Test Date 07/23/2009
Magnification: 30x Description: Overall hardened air content, 2.3% total
A-10

AIR VOID ANALYSIS
This document shall not be reproduced, except in full, without written approval of American Petrographic Services, Inc.
550 Cleveland Avenue North $ St. Paul, MN 55114 $651-659-9001 $Fax 651-647-2744 $ www.ampetrographic.com AN AFFIRMATIVE ACTION AND EQUAL OPPORTUNITY EMPLOYER
PROJECT: REPORTED TO:
IPRF USER GUIDE AMERICAN ENGINEERING TESTING, INC.
550 CLEVELAND AVENUE NORTH
ST. PAUL, MN 55114
ATTN: DICK STEHLY
APS JOB NO:10-06029 DATE: JULY 28, 2009
Sample ID: 16.333
1 6
11
16
21
26
31
36
>4
0
0
50
100
150
200
250
# Voids
Cord Length
( in 0.001 inches)
Histogram
Conformance: The sample contains an air void
system which is consistent with
current technology for freeze-thaw
resistance.
Sample Data:
Description: Hardened Concrete Core
Dimensions: 102 mm (4") diameter x 413 mm
(16-1/4") long
Test Data: ASTM:C457 Linear Traverse
Method, APS SOP 00LAB003 and
ACI 116R
Air Void Content % 5.0
Entrained, % < 0.040” 4.1
Entrapped, %> 0.040” 0.9
Air Voids/inch 8.62
Specific Surface, in2/in3 690
Spacing Factor, inches 0.006
Paste Content, % estimated 20.0
Magnification 50x
Traverse Length, inches 100
Test Date 07/28/2009
Magnification: 30x Description: Overall hardened air content, 5.0% total
A-11

AIR VOID ANALYSIS
This document shall not be reproduced, except in full, without written approval of American Petrographic Services, Inc.
550 Cleveland Avenue North $ St. Paul, MN 55114 $651-659-9001 $Fax 651-647-2744 $ www.ampetrographic.com AN AFFIRMATIVE ACTION AND EQUAL OPPORTUNITY EMPLOYER
PROJECT: REPORTED TO:
IPRF USER GUIDE AMERICAN ENGINEERING TESTING, INC.
550 CLEVELAND AVENUE NORTH
ST. PAUL, MN 55114
ATTN: DICK STEHLY
APS JOB NO:10-06029 DATE: JULY 28, 2009
Sample ID: 16.376
1 6
11
16
21
26
31
36
>4
0
0
50
100
150
200
250
300
# Voids
Cord Length
( in 0.001 inches)
Histogram
Conformance: The sample contains an air void
system which is consistent with
current technology for freeze-thaw
resistance.
Sample Data:
Description: Hardened Concrete Core
Dimensions: 102 mm (4") diameter x 413 mm
(16-1/4") long
Test Data: ASTM:C457 Linear Traverse
Method, APS SOP 00LAB003 and
ACI 116R
Air Void Content % 4.4
Entrained, % < 0.040” 3.2
Entrapped, %> 0.040” 1.2
Air Voids/inch 8.58
Specific Surface, in2/in3 770
Spacing Factor, inches 0.006
Paste Content, % estimated 23.0
Magnification 50x
Traverse Length, inches 100
Test Date 07/28/2009
Magnification: 30x Description: Overall hardened air content, 4.4% total
A-12
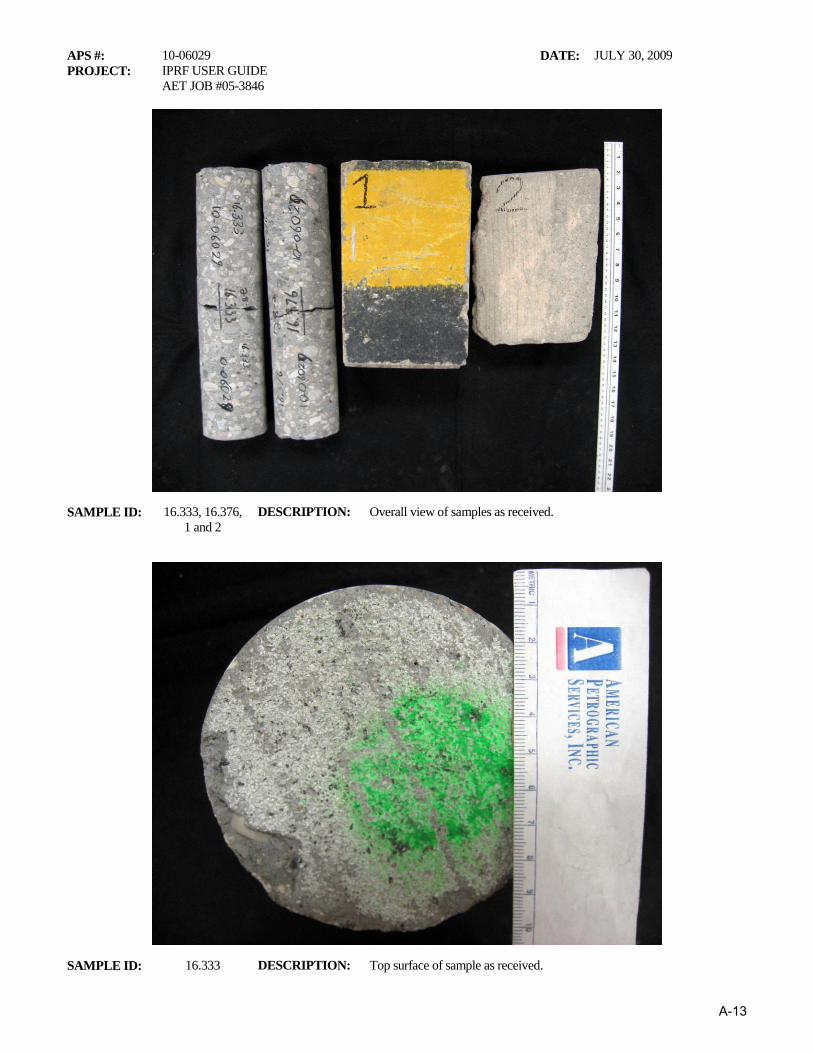
APS #: 10-06029 DATE: JULY 30, 2009
PROJECT: IPRF USER GUIDE
AET JOB #05-3846
SAMPLE ID: 16.333, 16.376,
1 and 2
DESCRIPTION: Overall view of samples as received.
SAMPLE ID: 16.333 DESCRIPTION: Top surface of sample as received.
A-13
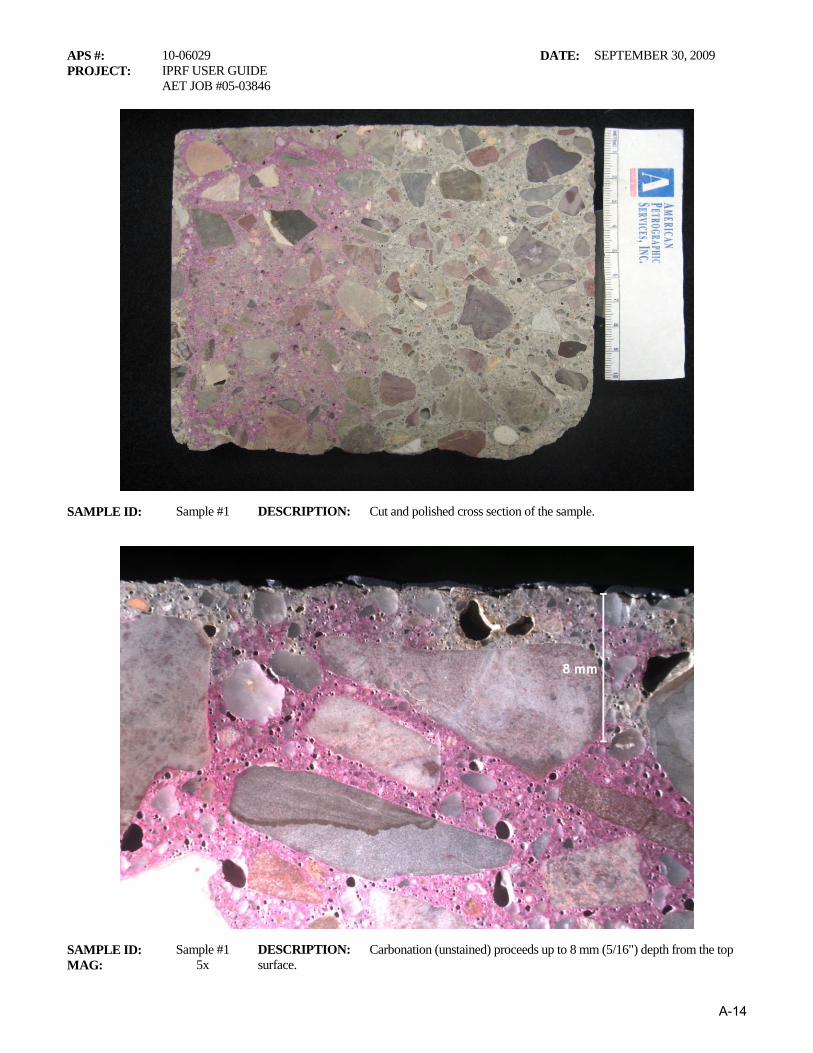
APS #: 10-06029 DATE: SEPTEMBER 30, 2009
PROJECT: IPRF USER GUIDE
AET JOB #05-03846
SAMPLE ID: Sample #1 DESCRIPTION: Cut and polished cross section of the sample.
SAMPLE ID: Sample #1 DESCRIPTION: Carbonation (unstained) proceeds up to 8 mm (5/16") depth from the top
surface. MAG: 5x
A-14
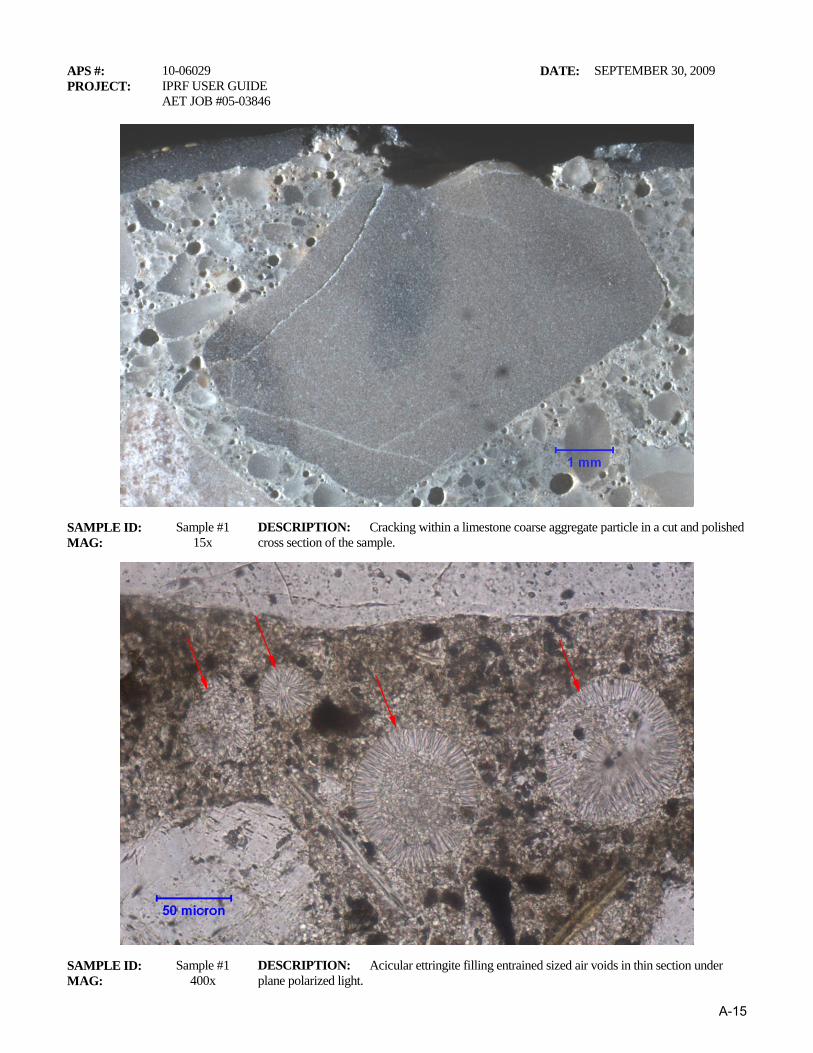
APS #: 10-06029 DATE: SEPTEMBER 30, 2009
PROJECT: IPRF USER GUIDE
AET JOB #05-03846
SAMPLE ID: Sample #1 DESCRIPTION: Cracking within a limestone coarse aggregate particle in a cut and polished
cross section of the sample. MAG: 15x
SAMPLE ID: Sample #1 DESCRIPTION: Acicular ettringite filling entrained sized air voids in thin section under
plane polarized light. MAG: 400x
A-15

APS #: 10-06029 DATE: SEPTEMBER 30, 2009
PROJECT: IPRF USER GUIDE
AET JOB #05-03846
SAMPLE ID: Sample #1 DESCRIPTION: Spherical fly ash pozzolan particles in thin section under plane polarized
light. MAG: 400x
SAMPLE ID: Sample #2 DESCRIPTION: Cut and polished section of the sample.
A-16
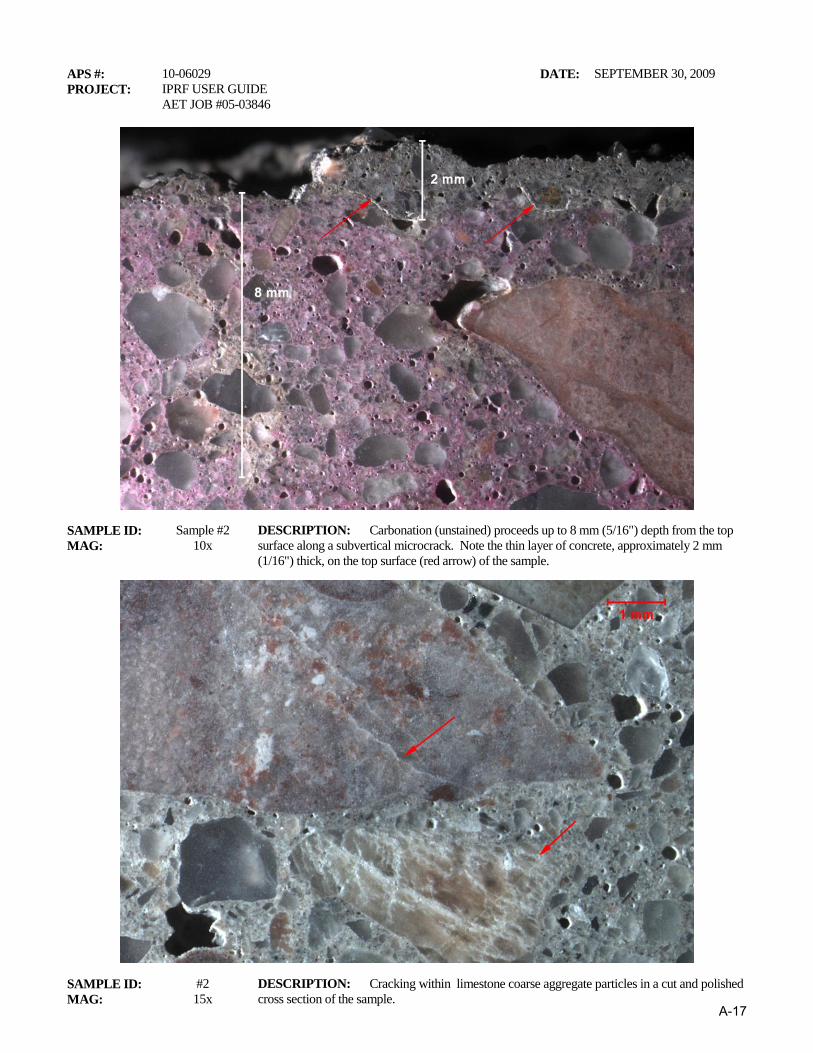
APS #: 10-06029 DATE: SEPTEMBER 30, 2009
PROJECT: IPRF USER GUIDE
AET JOB #05-03846
SAMPLE ID: Sample #2 DESCRIPTION: Carbonation (unstained) proceeds up to 8 mm (5/16") depth from the top
surface along a subvertical microcrack. Note the thin layer of concrete, approximately 2 mm
(1/16") thick, on the top surface (red arrow) of the sample. MAG: 10x
SAMPLE ID: #2 DESCRIPTION: Cracking within limestone coarse aggregate particles in a cut and polished
cross section of the sample. MAG: 15x
A-17
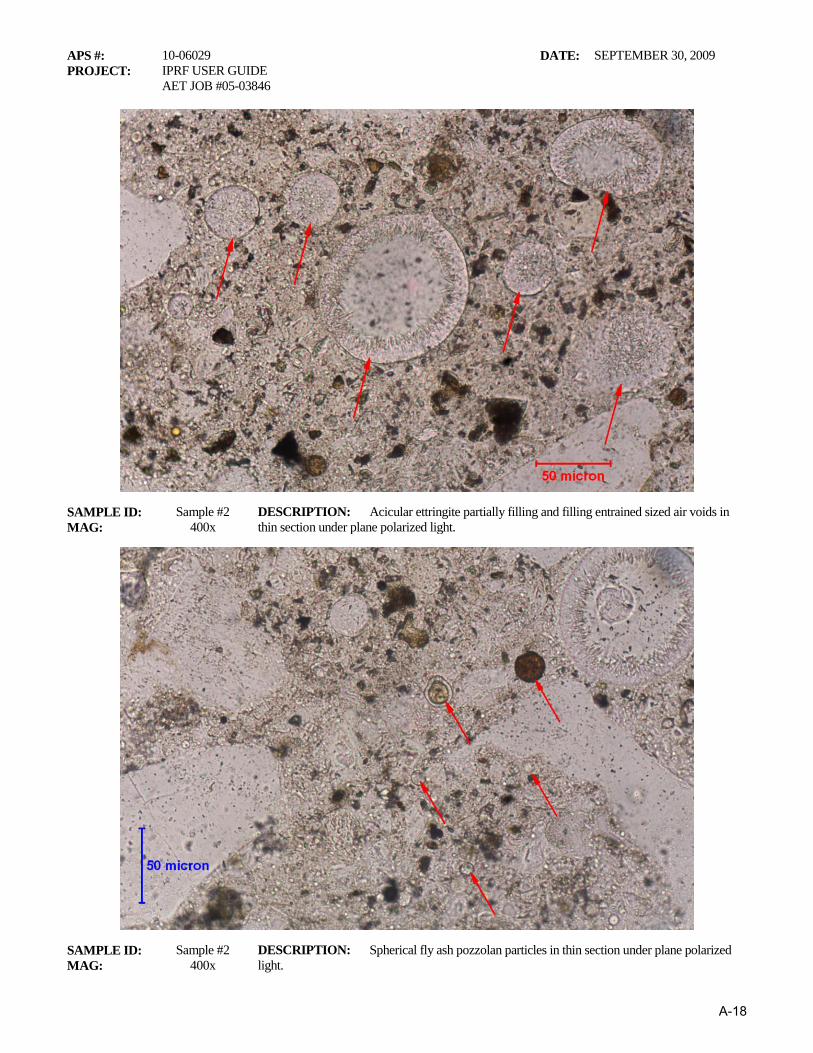
APS #: 10-06029 DATE: SEPTEMBER 30, 2009
PROJECT: IPRF USER GUIDE
AET JOB #05-03846
SAMPLE ID: Sample #2 DESCRIPTION: Acicular ettringite partially filling and filling entrained sized air voids in
thin section under plane polarized light. MAG: 400x
SAMPLE ID: Sample #2 DESCRIPTION: Spherical fly ash pozzolan particles in thin section under plane polarized
light. MAG: 400x
A-18
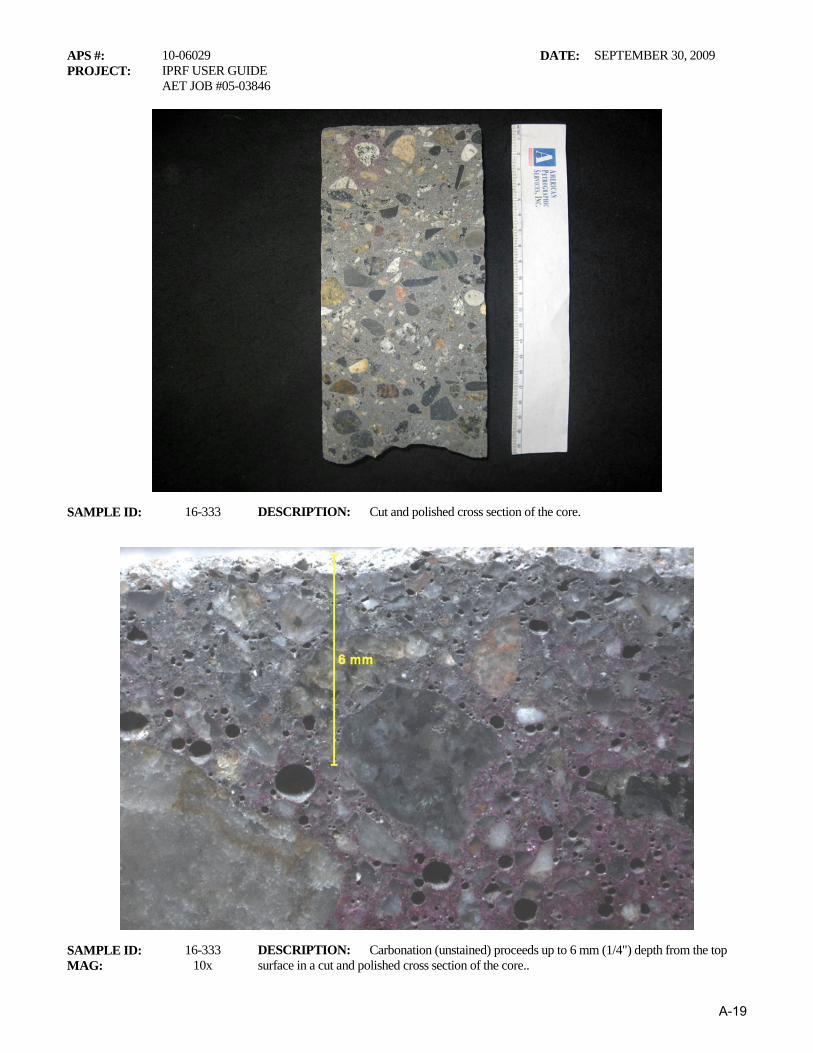
APS #: 10-06029 DATE: SEPTEMBER 30, 2009
PROJECT: IPRF USER GUIDE
AET JOB #05-03846
SAMPLE ID: 16-333 DESCRIPTION: Cut and polished cross section of the core.
SAMPLE ID: 16-333 DESCRIPTION: Carbonation (unstained) proceeds up to 6 mm (1/4") depth from the top
surface in a cut and polished cross section of the core.. MAG: 10x
A-19
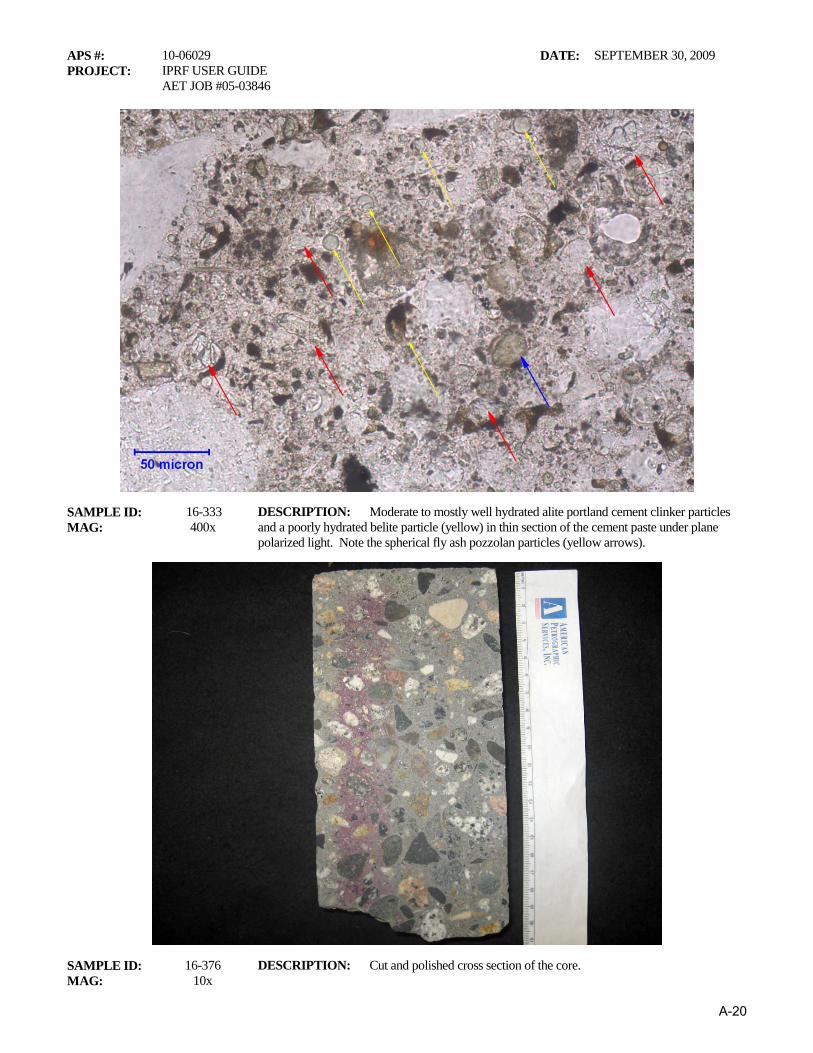
APS #: 10-06029 DATE: SEPTEMBER 30, 2009
PROJECT: IPRF USER GUIDE
AET JOB #05-03846
SAMPLE ID: 16-333 DESCRIPTION: Moderate to mostly well hydrated alite portland cement clinker particles
and a poorly hydrated belite particle (yellow) in thin section of the cement paste under plane
polarized light. Note the spherical fly ash pozzolan particles (yellow arrows). MAG: 400x
SAMPLE ID: 16-376 DESCRIPTION: Cut and polished cross section of the core.
MAG: 10x
A-20

APS #: 10-06029 DATE: SEPTEMBER 30, 2009
PROJECT: IPRF USER GUIDE
AET JOB #05-03846
SAMPLE ID: 16-376 DESCRIPTION: Carbonation (unstained) proceeds up to 9 mm (3/8") depth from the top
surface in a cut and polished cross section of the core. MAG: 5x
SAMPLE ID: 16-376 DESCRIPTION: Moderate to mostly well hydrated alite portland cement clinker particles
(red arrows) in thin section of the cement paste under plane polarized light. Note the fly ash
pozzolan particles (yellow arrows). MAG: 400xx
A-21