IPO Analysis: China Pacific Insurance (2601): The second ... - IPO Analysis Sa… · IPO Analysis:...
7
SAMPLE ARTICLE 14 Dec, 2009 IPO Analysis: China Pacific Insurance (2601): The second largest IPO this year Author(s): Ho Tin Shing (SFC CE NO:AQW224) China Pacific Insurance (CPIC), the third largest insurer in the PRC in terms of market shares in the life insurance and in property and casualty insurance, has begun its IPO activities today. Currently, the bank has 7,700M outstanding A shares. It is expected that the insurer could issue 861M H shares at HK$26.8 to HK$30.1 each. CPIC is seeking to raise up HK$23,075M to HK$25,916M to replenish capital and fund expansion. According to official announcement, CPIC expects 2009 net profit of no less than RMB6.51B, representing a whooping 65.3% YOY increase, the fully diluted EPS could be RMB$0.76. The maximum offer price for the H share IPO is HK$30.1, implying a 09 diluted P/E of 35.7x. As at 30 June 2009, the solvency ratio was still very sufficient at 224%. (Regulatory requirement: 100%) (Dec-08: 234%). IPO Information Total offer: 861M H shares Offer Price: HK$26.8 to HK$30.1 per share O/S Shares after IPO: 8,483M shares 2009 estimated net profit: no less than RMB6.51B Prospective 09E PE: 35.7x (assuming HK$30.1 per share) Sponsors: UBS Application Close: December 10, 2009 Listing date: December 15, 2009 QuamResearchPro contains 5-7 daily commentaries on Hong Kong equity market outlook and specific stock analysis by Quam Research team. This is only one of the articles dated on 14 Dec, 2009 for reference. For details, please refer to http://subscription.quamnet.com Subscription Hotline : (852) 2217 2705 / email [email protected]
Transcript of IPO Analysis: China Pacific Insurance (2601): The second ... - IPO Analysis Sa… · IPO Analysis:...
SAMPLE ARTICLE 14 Dec, 2009
IPO Analysis: China Pacific Insurance (2601): The second largest
IPO this year
Author(s): Ho Tin Shing (SFC CE NO:AQW224)
China Pacific Insurance (CPIC), the third largest insurer in the PRC in terms of market shares in the life insurance
and in property and casualty insurance, has begun its IPO activities today. Currently, the bank has 7,700M
outstanding A shares. It is expected that the insurer could issue 861M H shares at HK$26.8 to HK$30.1 each. CPIC
is seeking to raise up HK$23,075M to HK$25,916M to replenish capital and fund expansion.
According to official announcement, CPIC expects 2009 net profit of no less than RMB6.51B, representing a
whooping 65.3% YOY increase, the fully diluted EPS could be RMB$0.76. The maximum offer price for the H share
IPO is HK$30.1, implying a 09 diluted P/E of 35.7x. As at 30 June 2009, the solvency ratio was still very sufficient at
224%. (Regulatory requirement: 100%) (Dec-08: 234%).
IPO Information
Total offer: 861M H shares
Offer Price: HK$26.8 to HK$30.1 per share
O/S Shares after IPO: 8,483M shares
2009 estimated net profit: no less than RMB6.51B
Prospective 09E PE: 35.7x (assuming HK$30.1 per share)
Sponsors: UBS
Application Close: December 10, 2009
Listing date: December 15, 2009
QuamResearchPro contains 5-7 daily commentaries on Hong Kong equity market outlook and specific stock analysis by Quam Research team. This is only one of the articles dated on 14 Dec, 2009 for reference. For details, please refer to http://subscription.quamnet.com Subscription Hotline : (852) 2217 2705 / email [email protected]
QuamResearchPro – SAMPLE ARTICLE
SAMPLE ARTICLE 14 Dec, 2009
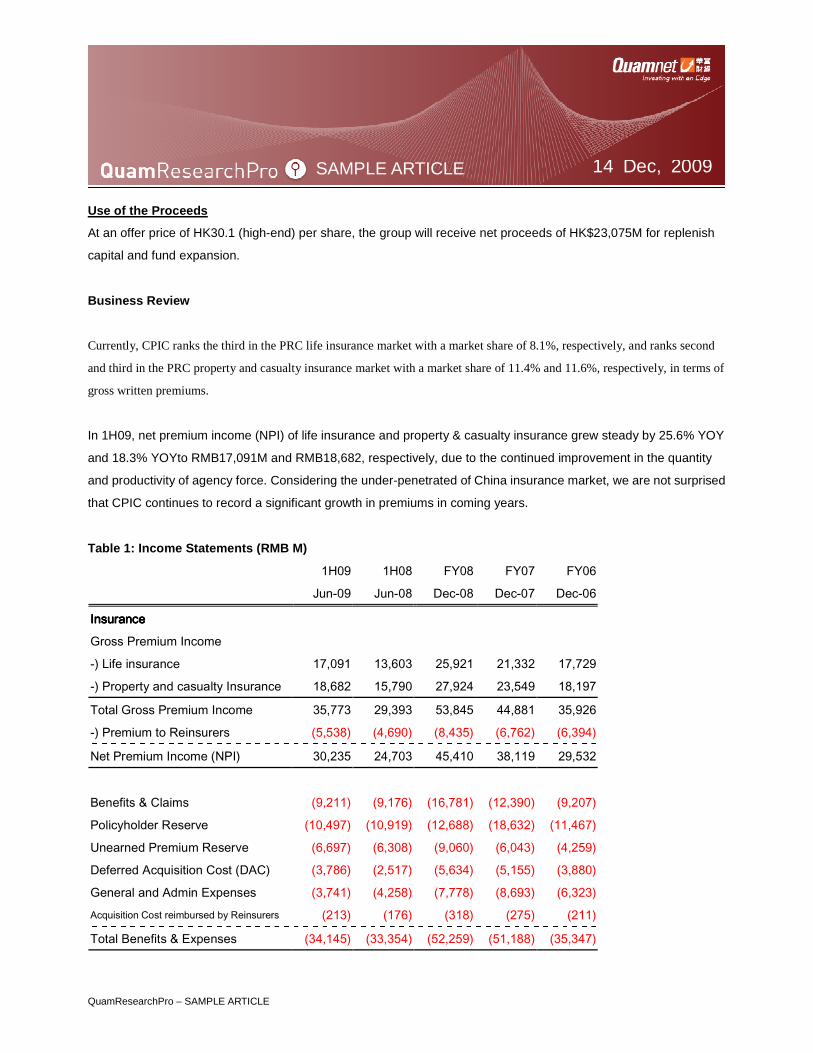
Use of the Proceeds
At an offer price of HK30.1 (high-end) per share, the group will receive net proceeds of HK$23,075M for replenish
capital and fund expansion.
Business Review
Currently, CPIC ranks the third in the PRC life insurance market with a market share of 8.1%, respectively, and ranks second
and third in the PRC property and casualty insurance market with a market share of 11.4% and 11.6%, respectively, in terms of
gross written premiums.
In 1H09, net premium income (NPI) of life insurance and property & casualty insurance grew steady by 25.6% YOY
and 18.3% YOYto RMB17,091M and RMB18,682, respectively, due to the continued improvement in the quantity
and productivity of agency force. Considering the under-penetrated of China insurance market, we are not surprised
that CPIC continues to record a significant growth in premiums in coming years.
Table 1: Income Statements (RMB M)
1H09 1H08 FY08 FY07 FY06
Jun-09 Jun-08 Dec-08 Dec-07 Dec-06
InsuranceInsuranceInsuranceInsurance
Gross Premium Income
-) Life insurance 17,091 13,603 25,921 21,332 17,729
-) Property and casualty Insurance 18,682 15,790 27,924 23,549 18,197
Total Gross Premium Income 35,773 29,393 53,845 44,881 35,926
-) Premium to Reinsurers (5,538) (4,690) (8,435) (6,762) (6,394)
Net Premium Income (NPI) 30,235 24,703 45,410 38,119 29,532
Benefits & Claims (9,211) (9,176) (16,781) (12,390) (9,207)
Policyholder Reserve (10,497) (10,919) (12,688) (18,632) (11,467)
Unearned Premium Reserve (6,697) (6,308) (9,060) (6,043) (4,259)
Deferred Acquisition Cost (DAC) (3,786) (2,517) (5,634) (5,155) (3,880)
General and Admin Expenses (3,741) (4,258) (7,778) (8,693) (6,323) Acquisition Cost reimbursed by Reinsurers (213) (176) (318) (275) (211)
Total Benefits & Expenses (34,145) (33,354) (52,259) (51,188) (35,347)
QuamResearchPro – SAMPLE ARTICLE
SAMPLE ARTICLE 14 Dec, 2009
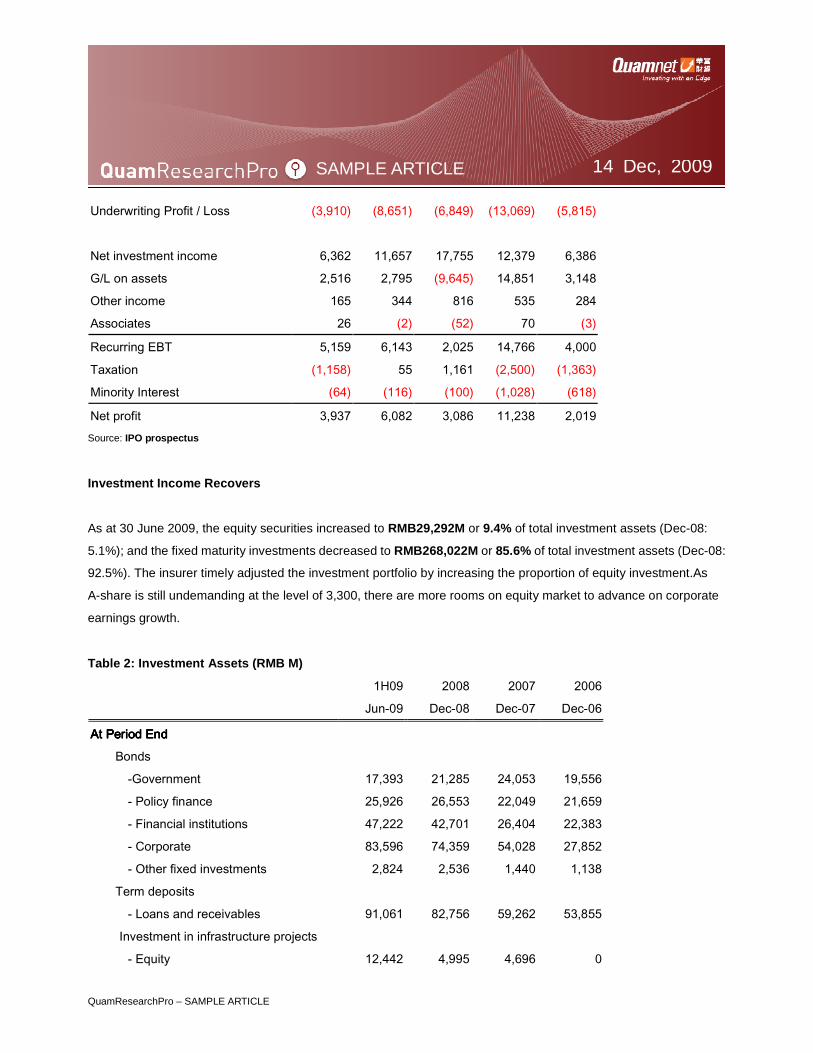
Underwriting Profit / Loss (3,910) (8,651) (6,849) (13,069) (5,815)
Net investment income 6,362 11,657 17,755 12,379 6,386
G/L on assets 2,516 2,795 (9,645) 14,851 3,148
Other income 165 344 816 535 284
Associates 26 (2) (52) 70 (3)
Recurring EBT 5,159 6,143 2,025 14,766 4,000
Taxation (1,158) 55 1,161 (2,500) (1,363)
Minority Interest (64) (116) (100) (1,028) (618)
Net profit 3,937 6,082 3,086 11,238 2,019 Source: IPO prospectus
Investment Income Recovers
As at 30 June 2009, the equity securities increased to RMB29,292M or 9.4% of total investment assets (Dec-08:
5.1%); and the fixed maturity investments decreased to RMB268,022M or 85.6% of total investment assets (Dec-08:
92.5%). The insurer timely adjusted the investment portfolio by increasing the proportion of equity investment.As
A-share is still undemanding at the level of 3,300, there are more rooms on equity market to advance on corporate
earnings growth.
Table 2: Investment Assets (RMB M)
1H09 2008 2007 2006
Jun-09 Dec-08 Dec-07 Dec-06
At Period EndAt Period EndAt Period EndAt Period End
Bonds
-Government 17,393 21,285 24,053 19,556
- Policy finance 25,926 26,553 22,049 21,659
- Financial institutions 47,222 42,701 26,404 22,383
- Corporate 83,596 74,359 54,028 27,852
- Other fixed investments 2,824 2,536 1,440 1,138
Term deposits
- Loans and receivables 91,061 82,756 59,262 53,855
Investment in infrastructure projects
- Equity 12,442 4,995 4,696 0
QuamResearchPro – SAMPLE ARTICLE
SAMPLE ARTICLE 14 Dec, 2009
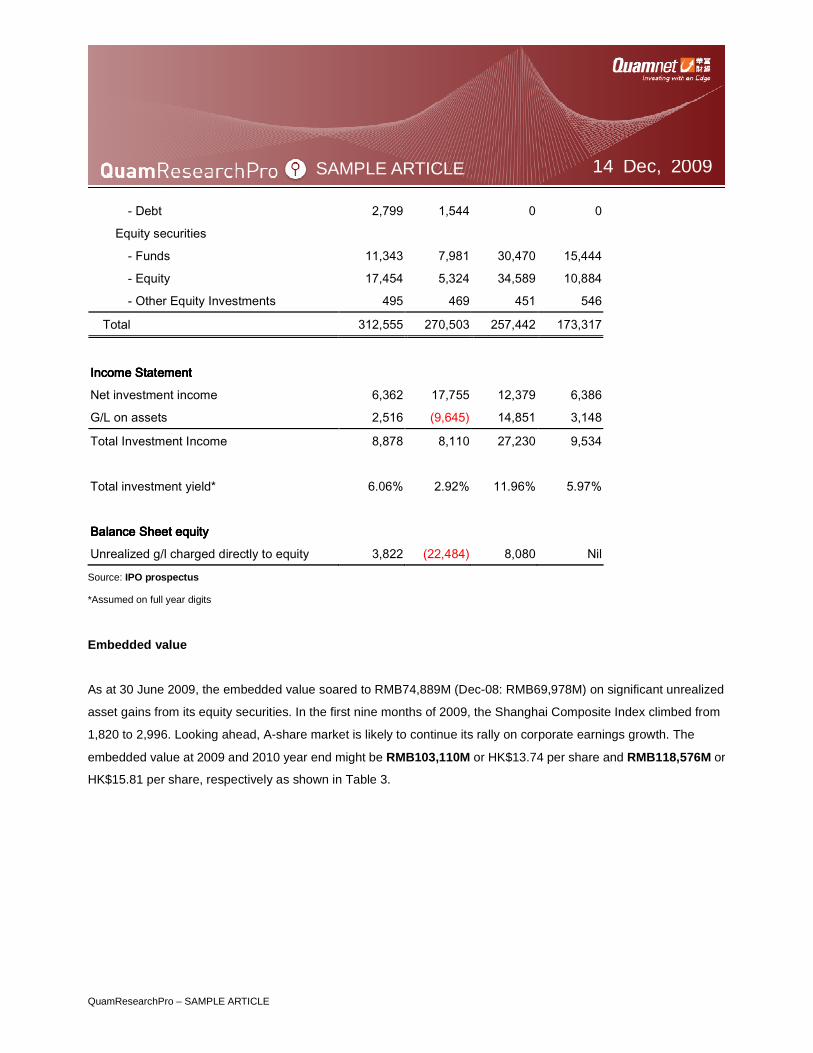
- Debt 2,799 1,544 0 0
Equity securities
- Funds 11,343 7,981 30,470 15,444
- Equity 17,454 5,324 34,589 10,884
- Other Equity Investments 495 469 451 546
Total 312,555 270,503 257,442 173,317
Income StatementIncome StatementIncome StatementIncome Statement
Net investment income 6,362 17,755 12,379 6,386
G/L on assets 2,516 (9,645) 14,851 3,148
Total Investment Income 8,878 8,110 27,230 9,534
Total investment yield* 6.06% 2.92% 11.96% 5.97%
Balance Sheet equityBalance Sheet equityBalance Sheet equityBalance Sheet equity
Unrealized g/l charged directly to equity 3,822 (22,484) 8,080 Nil
Source: IPO prospectus
*Assumed on full year digits
Embedded value
As at 30 June 2009, the embedded value soared to RMB74,889M (Dec-08: RMB69,978M) on significant unrealized
asset gains from its equity securities. In the first nine months of 2009, the Shanghai Composite Index climbed from
1,820 to 2,996. Looking ahead, A-share market is likely to continue its rally on corporate earnings growth. The
embedded value at 2009 and 2010 year end might be RMB103,110M or HK$13.74 per share and RMB118,576M or
HK$15.81 per share, respectively as shown in Table 3.
QuamResearchPro – SAMPLE ARTICLE
SAMPLE ARTICLE 14 Dec, 2009
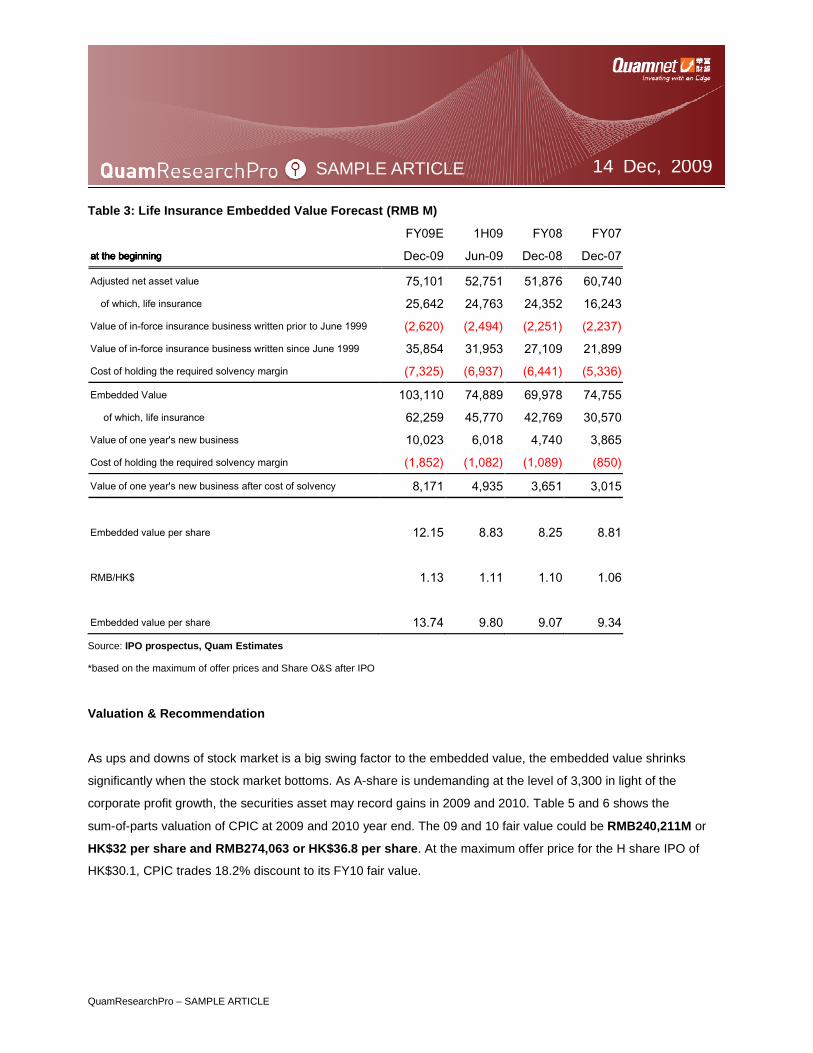
Table 3: Life Insurance Embedded Value Forecast (RMB M)
FY09E 1H09 FY08 FY07
at the beginningat the beginningat the beginningat the beginning Dec-09 Jun-09 Dec-08 Dec-07
Adjusted net asset value 75,101 52,751 51,876 60,740 of which, life insurance 25,642 24,763 24,352 16,243 Value of in-force insurance business written prior to June 1999 (2,620) (2,494) (2,251) (2,237) Value of in-force insurance business written since June 1999 35,854 31,953 27,109 21,899 Cost of holding the required solvency margin (7,325) (6,937) (6,441) (5,336)
Embedded Value 103,110 74,889 69,978 74,755 of which, life insurance 62,259 45,770 42,769 30,570 Value of one year's new business 10,023 6,018 4,740 3,865 Cost of holding the required solvency margin (1,852) (1,082) (1,089) (850)
Value of one year's new business after cost of solvency 8,171 4,935 3,651 3,015
Embedded value per share 12.15 8.83 8.25 8.81
RMB/HK$ 1.13 1.11 1.10 1.06
Embedded value per share 13.74 9.80 9.07 9.34
Source: IPO prospectus, Quam Estimates
*based on the maximum of offer prices and Share O&S after IPO
Valuation & Recommendation
As ups and downs of stock market is a big swing factor to the embedded value, the embedded value shrinks
significantly when the stock market bottoms. As A-share is undemanding at the level of 3,300 in light of the
corporate profit growth, the securities asset may record gains in 2009 and 2010. Table 5 and 6 shows the
sum-of-parts valuation of CPIC at 2009 and 2010 year end. The 09 and 10 fair value could be RMB240,211M or
HK$32 per share and RMB274,063 or HK$36.8 per share. At the maximum offer price for the H share IPO of
HK$30.1, CPIC trades 18.2% discount to its FY10 fair value.
QuamResearchPro – SAMPLE ARTICLE
SAMPLE ARTICLE 14 Dec, 2009
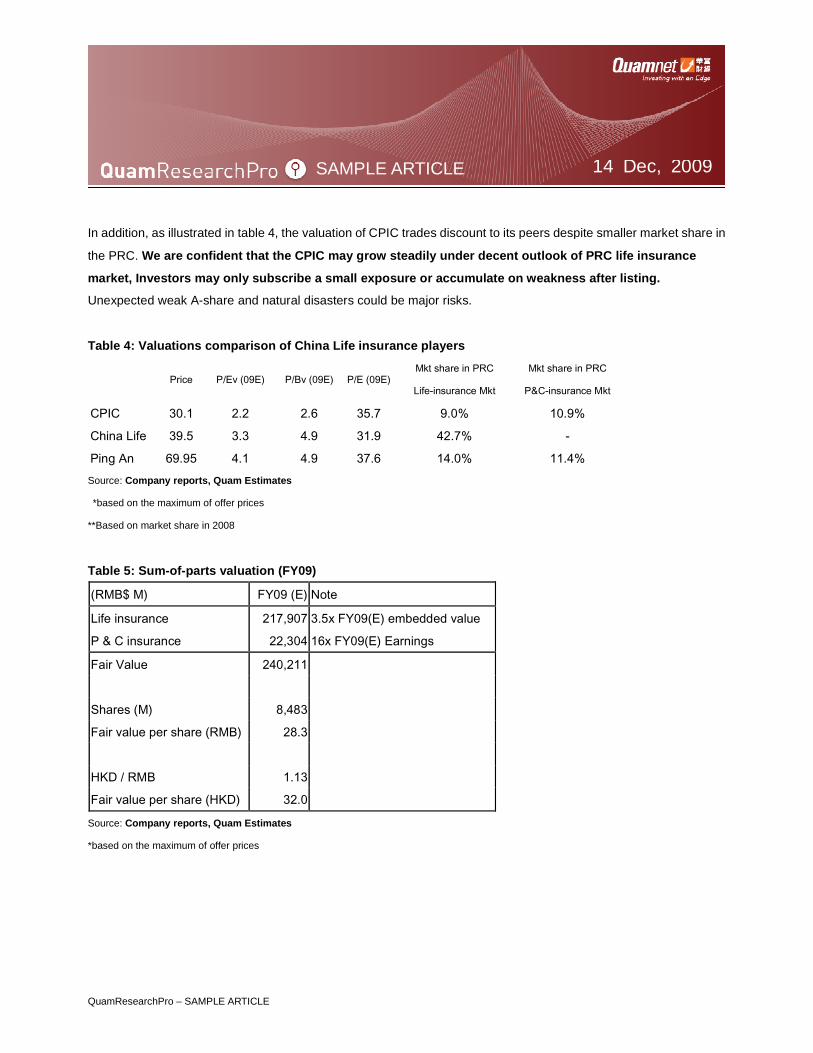
In addition, as illustrated in table 4, the valuation of CPIC trades discount to its peers despite smaller market share in
the PRC. We are confident that the CPIC may grow steadily under decent outlook of PRC life insurance
market, Investors may only subscribe a small exposure or accumulate on weakness after listing.
Unexpected weak A-share and natural disasters could be major risks.
Table 4: Valuations comparison of China Life insurance players
Price P/Ev (09E) P/Bv (09E) P/E (09E) Mkt share in PRC
Life-insurance Mkt
Mkt share in PRC
P&C-insurance Mkt
CPIC 30.1 2.2 2.6 35.7 9.0% 10.9%
China Life 39.5 3.3 4.9 31.9 42.7% -
Ping An 69.95 4.1 4.9 37.6 14.0% 11.4%
Source: Company reports, Quam Estimates
*based on the maximum of offer prices
**Based on market share in 2008
Table 5: Sum-of-parts valuation (FY09)
(RMB$ M) FY09 (E) Note
Life insurance 217,907 3.5x FY09(E) embedded value
P & C insurance 22,304 16x FY09(E) Earnings
Fair Value 240,211
Shares (M) 8,483
Fair value per share (RMB) 28.3
HKD / RMB 1.13
Fair value per share (HKD) 32.0
Source: Company reports, Quam Estimates
*based on the maximum of offer prices
QuamResearchPro – SAMPLE ARTICLE
SAMPLE ARTICLE 14 Dec, 2009
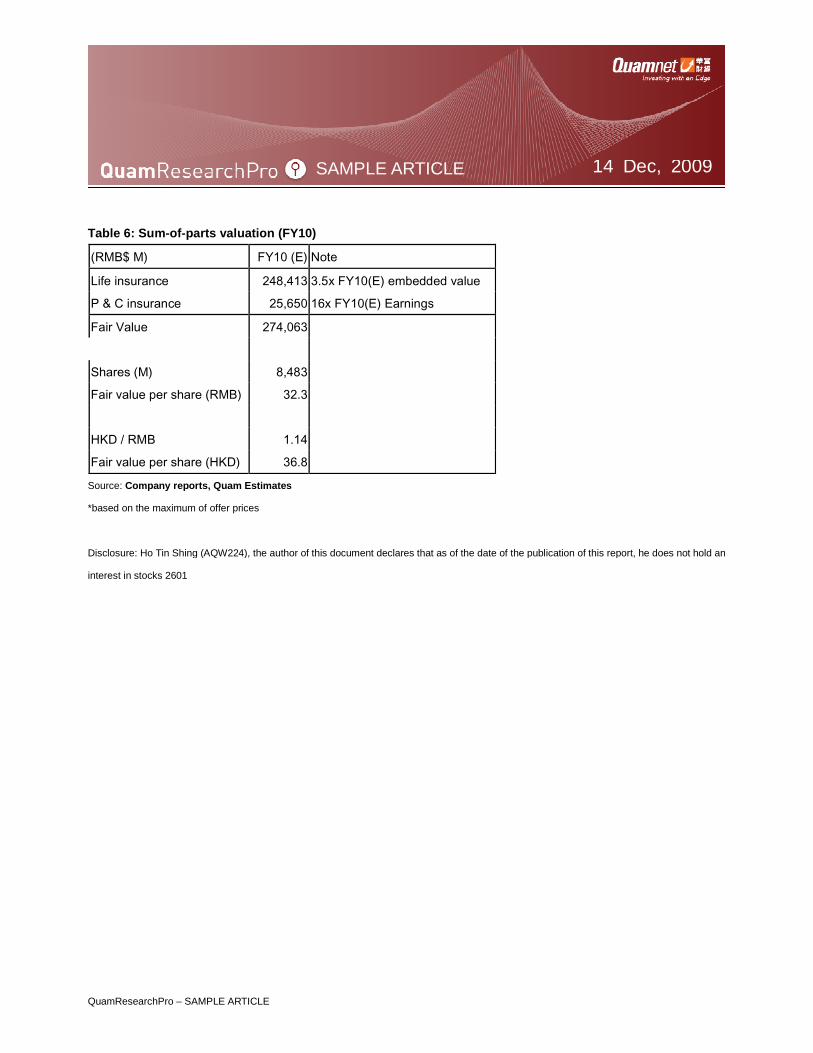
Table 6: Sum-of-parts valuation (FY10)
(RMB$ M) FY10 (E) Note
Life insurance 248,413 3.5x FY10(E) embedded value
P & C insurance 25,650 16x FY10(E) Earnings
Fair Value 274,063
Shares (M) 8,483
Fair value per share (RMB) 32.3
HKD / RMB 1.14
Fair value per share (HKD) 36.8
Source: Company reports, Quam Estimates
*based on the maximum of offer prices
Disclosure: Ho Tin Shing (AQW224), the author of this document declares that as of the date of the publication of this report, he does not hold an
interest in stocks 2601