IPENZ TRANSPORTATION GROUP CONFERENCE 2016 RESEARCH PAPER ... · RESEARCH PAPER: EVALUATING THE...
16
Tertiary Students Cycling in Auckland Rowan De Costa & Athul Harris Page 0 IPENZ Transportation Group Conference, Auckland 7 - 9 March 2016 IPENZ TRANSPORTATION GROUP CONFERENCE 2016 RESEARCH PAPER: EVALUATING THE FACTORS WHICH ENCOURAGE CYCLING FACILITY USE BY TERTIARY STUDENTS IN AUCKLAND CITY Authors: Bevan Clement BCA, MBA IPENZ Transportation Group, Professional Teaching Fellow, Faculty of Engineering, University of Auckland [email protected] Rowan De Costa Graduate Civil & Environmental Engineering BE(Hons) The University of Auckland [email protected] Athul Harris Graduate Transportation Engineer Civil & Environmental Engineering BE(Hons) The University of Auckland [email protected] ABSTRACT Cycling is a growing phenomenon as people recognise the need for sustainable forms of transport. It is becoming a popular mode of transport in many developed cities around the globe. This research project seeks to identify the key attributes, which influence tertiary students cycling to university and prioritise them. The top five most influential factors affecting non- cyclists were found to be weather, distance to destination, travel time, secure bike parking and availability of dedicated cycle ways (most to least influential). The ‘Availability of Dedicated Cycle Ways’ factor was ranked within the top five by non-cyclists unlike the cyclists (the remaining four factors were common for both groups), demonstrating a critical difference in perception. Changing perception to cycling being seen as a viable form of transport, improving infrastructure and educating the general public about use of cycling facilities will have an immense impact on the number of students choosing to cycle to university. The universities could focus on making bike parking more secure, strategic placement of parking facilities to reduce chances of theft and improved surveillance of bike parking facilities. Auckland Transport could focus on educating the public and improving the city’s cycle network.
-
Upload
hoangthien -
Category
Documents
-
view
213 -
download
0
Transcript of IPENZ TRANSPORTATION GROUP CONFERENCE 2016 RESEARCH PAPER ... · RESEARCH PAPER: EVALUATING THE...

Tertiary Students Cycling in Auckland Rowan De Costa & Athul Harris Page 0
IPENZ Transportation Group Conference, Auckland 7 - 9 March 2016
IPENZ TRANSPORTATION GROUP CONFERENCE 2016
RESEARCH PAPER: EVALUATING THE FACTORS WHICH ENCOURAGE CYCLING FACILITY USE BY TERTIARY STUDENTS IN AUCKLAND CITY
Authors:
Bevan Clement BCA, MBA IPENZ Transportation Group, Professional Teaching Fellow, Faculty of Engineering, University of Auckland [email protected]
Rowan De Costa Graduate Civil & Environmental Engineering BE(Hons) The University of Auckland [email protected]
Athul Harris Graduate Transportation Engineer Civil & Environmental Engineering BE(Hons) The University of Auckland [email protected]
ABSTRACT Cycling is a growing phenomenon as people recognise the need for sustainable forms of transport. It is becoming a popular mode of transport in many developed cities around the globe. This research project seeks to identify the key attributes, which influence tertiary students cycling to university and prioritise them. The top five most influential factors affecting non- cyclists were found to be weather, distance to destination, travel time, secure bike parking and availability of dedicated cycle ways (most to least influential). The ‘Availability of Dedicated Cycle Ways’ factor was ranked within the top five by non-cyclists unlike the cyclists (the remaining four factors were common for both groups), demonstrating a critical difference in perception. Changing perception to cycling being seen as a viable form of transport, improving infrastructure and educating the general public about use of cycling facilities will have an immense impact on the number of students choosing to cycle to university. The universities could focus on making bike parking more secure, strategic placement of parking facilities to reduce chances of theft and improved surveillance of bike parking facilities. Auckland Transport could focus on educating the public and improving the city’s cycle network.
Tertiary Students Cycling in Auckland Rowan De Costa & Athul Harris Page 1
IPENZ Transportation Group Conference, Auckland 7 - 9 March 2016
INTRODUCTION
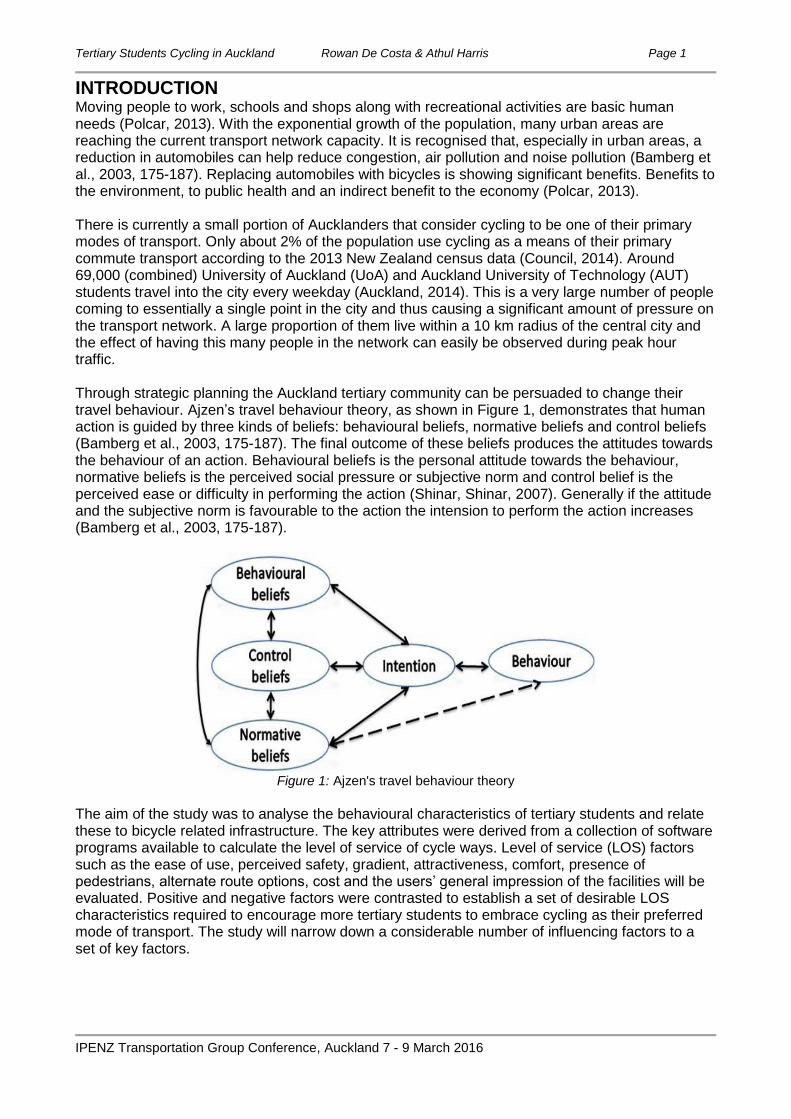
Moving people to work, schools and shops along with recreational activities are basic human needs (Polcar, 2013). With the exponential growth of the population, many urban areas are reaching the current transport network capacity. It is recognised that, especially in urban areas, a reduction in automobiles can help reduce congestion, air pollution and noise pollution (Bamberg et al., 2003, 175-187). Replacing automobiles with bicycles is showing significant benefits. Benefits to the environment, to public health and an indirect benefit to the economy (Polcar, 2013). There is currently a small portion of Aucklanders that consider cycling to be one of their primary modes of transport. Only about 2% of the population use cycling as a means of their primary commute transport according to the 2013 New Zealand census data (Council, 2014). Around 69,000 (combined) University of Auckland (UoA) and Auckland University of Technology (AUT) students travel into the city every weekday (Auckland, 2014). This is a very large number of people coming to essentially a single point in the city and thus causing a significant amount of pressure on the transport network. A large proportion of them live within a 10 km radius of the central city and the effect of having this many people in the network can easily be observed during peak hour traffic. Through strategic planning the Auckland tertiary community can be persuaded to change their travel behaviour. Ajzen’s travel behaviour theory, as shown in Figure 1, demonstrates that human action is guided by three kinds of beliefs: behavioural beliefs, normative beliefs and control beliefs (Bamberg et al., 2003, 175-187). The final outcome of these beliefs produces the attitudes towards the behaviour of an action. Behavioural beliefs is the personal attitude towards the behaviour, normative beliefs is the perceived social pressure or subjective norm and control belief is the perceived ease or difficulty in performing the action (Shinar, Shinar, 2007). Generally if the attitude and the subjective norm is favourable to the action the intension to perform the action increases (Bamberg et al., 2003, 175-187).
Figure 1: Ajzen's travel behaviour theory
The aim of the study was to analyse the behavioural characteristics of tertiary students and relate these to bicycle related infrastructure. The key attributes were derived from a collection of software programs available to calculate the level of service of cycle ways. Level of service (LOS) factors such as the ease of use, perceived safety, gradient, attractiveness, comfort, presence of pedestrians, alternate route options, cost and the users’ general impression of the facilities will be evaluated. Positive and negative factors were contrasted to establish a set of desirable LOS characteristics required to encourage more tertiary students to embrace cycling as their preferred mode of transport. The study will narrow down a considerable number of influencing factors to a set of key factors.

Tertiary Students Cycling in Auckland Rowan De Costa & Athul Harris Page 2
IPENZ Transportation Group Conference, Auckland 7 - 9 March 2016
OBJECTIVE The study sought to determine specific behavioural and physical factors required to increase the number of tertiary students cycling to university in Auckland City.
LITERATURE REVIEW General Overview Motorised vehicles are known to produce social, economic and environmental challenges, which is why transportation engineers and designers are promoting green infrastructure in order to replace a portion of the mode share with sustainable forms of transport such as walking and cycling (Asadi-Shekari et al., 2013, 166-194). Switching to sustainable transportation modes can have immense benefits in the health sector, especially in reducing problems such as obesity and an overall improvement in the quality of life (Ewing et al., 2008). It is incredibly important that behavioural aspects of cyclists or any other mode of transport is seriously considered in all transport projects as they add a considerable amount of value to the overall predicted outcome of the project (Doorley et al., 2015). Careful consideration of these major aspects involved in a project will have an immense positive impact on the outcome and these will be explored further to recognise their impact according to students’ perception. Sustainable Transport It is clear to see why sustainability is prevalent in urban transport planning with regard to the negative social, economic and environmental effects of motorised transportation systems (Stone, 2008). Due to the enormous consumption of energy by transportation, mobility affects sustainable development considerably, as people in general are simply concerned about getting to their destination in the shortest time possible with the least energy spent (Kwok and Yeh, 2004). As a result, for some, this completely eliminates cycling as a possible mode of transport since it is not the most convenient of the options available. People cycle for different reasons which include, preserving the earth’s resources, for exercise and for enjoyment. In comparison to motorised vehicles, sustainable transportation modes produce fewer externalities (Asadi-Shekari et al., 2013, 166-194). This in other words means that motorised forms of transportation are considerably more likely to have unforeseen or unintended harmful impacts than cycling will. Sustainable transport is about maintaining mobility while minimising the harm it brings to society and this is exactly what cycling can offer to New Zealanders. Health and Cycling The role of health in transportation has a considerable impact on society, however, it is often overlooked. The incorporation of health benefits into all transportation engineering projects will add a considerable amount of value as well as enhancing the overall predicted outcome of a project and also shift it onto a broader more realistic scale (Doorley et al., 2015). In the past the cost-benefit analysis process of transportation projects has disregarded health as unrelated or unimportant in the outcome of a project. However in recent years the implication of health in transportation is beginning to take a larger role as its importance is being recognised and is being incorporated into policy making in all sectors (Doorley et al., 2015). This ultimately will lead to a better outcome for all projects, as it will enable a better understanding of a project and its consequences, rather than solely thinking about revenue or efficiency. Level of Service Motorised vehicle facilities have been evaluated by many researchers using the level of service method. However in contrast fewer studies have been conducted on vulnerable road users such as cyclists (Asadi-Shekari et al., 2013, 166-194). The level of service (LOS) is an idea that has been developed over the last twenty years with each method taking a different approach to the process depending on the application of the LOS. Although it is a rough process with a lot of attributes not being taken into account, it still provides a good basis on which several different routes can be compared in order to approximate the performance of the routes. Analysis of the outcomes of the various options or of the impacts when changing individual variables or a combination of variables
Tertiary Students Cycling in Auckland Rowan De Costa & Athul Harris Page 3
IPENZ Transportation Group Conference, Auckland 7 - 9 March 2016
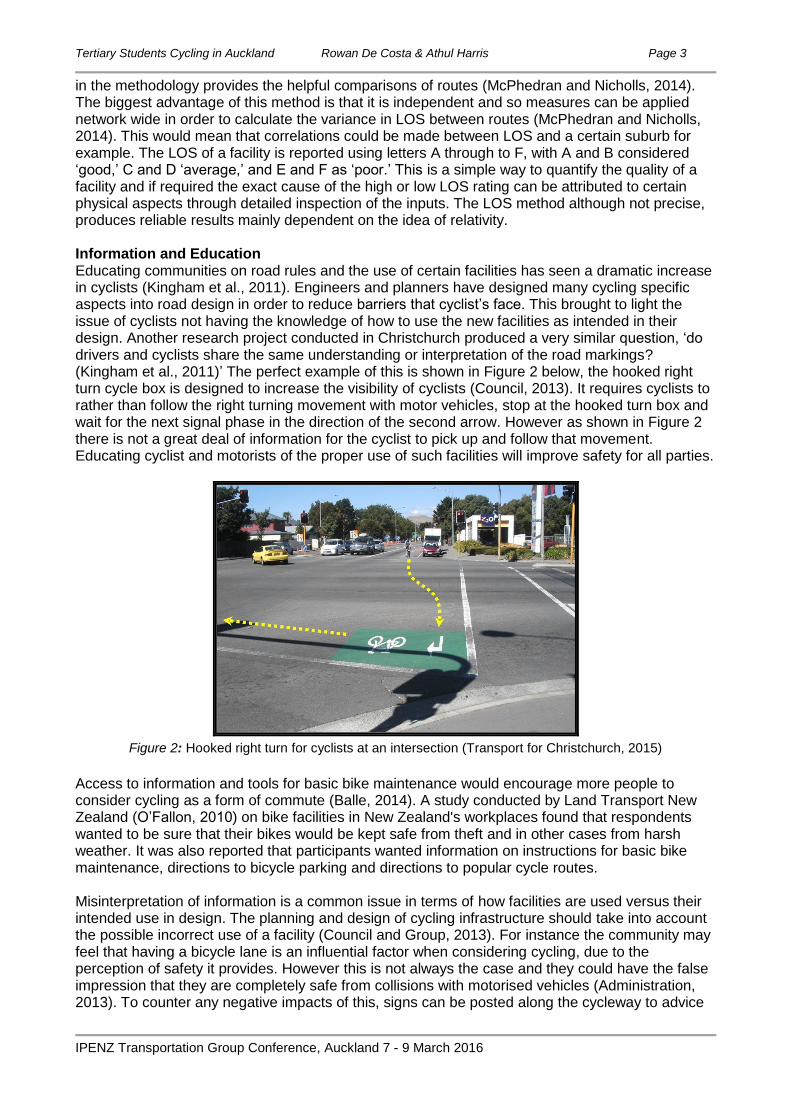
in the methodology provides the helpful comparisons of routes (McPhedran and Nicholls, 2014). The biggest advantage of this method is that it is independent and so measures can be applied network wide in order to calculate the variance in LOS between routes (McPhedran and Nicholls, 2014). This would mean that correlations could be made between LOS and a certain suburb for example. The LOS of a facility is reported using letters A through to F, with A and B considered ‘good,’ C and D ‘average,’ and E and F as ‘poor.’ This is a simple way to quantify the quality of a facility and if required the exact cause of the high or low LOS rating can be attributed to certain physical aspects through detailed inspection of the inputs. The LOS method although not precise, produces reliable results mainly dependent on the idea of relativity. Information and Education Educating communities on road rules and the use of certain facilities has seen a dramatic increase in cyclists (Kingham et al., 2011). Engineers and planners have designed many cycling specific aspects into road design in order to reduce barriers that cyclist’s face. This brought to light the issue of cyclists not having the knowledge of how to use the new facilities as intended in their design. Another research project conducted in Christchurch produced a very similar question, ‘do drivers and cyclists share the same understanding or interpretation of the road markings? (Kingham et al., 2011)’ The perfect example of this is shown in Figure 2 below, the hooked right turn cycle box is designed to increase the visibility of cyclists (Council, 2013). It requires cyclists to rather than follow the right turning movement with motor vehicles, stop at the hooked turn box and wait for the next signal phase in the direction of the second arrow. However as shown in Figure 2 there is not a great deal of information for the cyclist to pick up and follow that movement. Educating cyclist and motorists of the proper use of such facilities will improve safety for all parties.
Figure 2: Hooked right turn for cyclists at an intersection (Transport for Christchurch, 2015)
Access to information and tools for basic bike maintenance would encourage more people to consider cycling as a form of commute (Balle, 2014). A study conducted by Land Transport New Zealand (O’Fallon, 2010) on bike facilities in New Zealand's workplaces found that respondents wanted to be sure that their bikes would be kept safe from theft and in other cases from harsh weather. It was also reported that participants wanted information on instructions for basic bike maintenance, directions to bicycle parking and directions to popular cycle routes. Misinterpretation of information is a common issue in terms of how facilities are used versus their intended use in design. The planning and design of cycling infrastructure should take into account the possible incorrect use of a facility (Council and Group, 2013). For instance the community may feel that having a bicycle lane is an influential factor when considering cycling, due to the perception of safety it provides. However this is not always the case and they could have the false impression that they are completely safe from collisions with motorised vehicles (Administration, 2013). To counter any negative impacts of this, signs can be posted along the cycleway to advice
Tertiary Students Cycling in Auckland Rowan De Costa & Athul Harris Page 4
IPENZ Transportation Group Conference, Auckland 7 - 9 March 2016
users to be aware of motorised vehicle movements. With the use of correct information and education, the chances of such misinterpretation can be reduced. Engineers will have to slightly modify the user’s needs in the design by judging the potential risks. The design should not only take into account the user's needs but it should also have the six design outcomes; safety, direct, comfortable, coherent, attractiveness and adaptability (London, 2014). Conflict at Intersections One of the largest conflicts that cyclists face is at intersections where they could potentially cross paths with other motor vehicles. Intersections are unavoidable even with the implementation of dedicated/separated cycle ways. The problem is that intersections are difficult to navigate on a bicycle, more so than any other straight section of road and so care needs to be taken when designing an intersection to accommodate cyclist movements (Kingham et al., 2011). Suggestions have been made to provide bridges, underpasses or signalised intersections for cyclists at busy intersections. These measures will ensure a safer facility for both cyclists as well as motorists and also provide a good level of service for both modes of transport (Council, 2013). The proportion and number of accidents involving cyclists at various intersection types were studied in research report 289, published by NZTA. At priority cross roads and uncontrolled T-junctions, the proportion of accidents was generally lower than that of signalised intersections and roundabouts (Turner et al., 2006). Based on this, more focus should be placed on signalised intersection and roundabout design. Travel Behaviour and Infrastructure In order to increase the number of people cycling, it may not necessarily be helpful to simply produce high quality facilities, as there are other psychological factors contributing to how much a facility will be used. This is why it is crucial to gain an in depth understanding of people’s travel behaviour. In Lorraine Stone’s (2008) thesis , she states that current socio-economic, institutional and cultural frameworks support increased motorised travel, which the transport-planning realm reflects and even reinforces. Then she goes on to argue that this places the onus of rationalistic discourse of sustainable travel on individuals to rationalise and modify their behaviour in a sustainable direction. Cycling infrastructure is an important modifiable facilitator of participation (Dill and Carr, 2003, 116-123) , but understanding the impact of other factors also is important (Flynn et al., 2012). As stated by Andersen et al. (2012, p. 22) “there is no point directing cyclists to unsafe roads or combatting irritating but safe traffic habits.” People strive to optimise the outcome of their resource use based on a set of preferences and perfect knowledge about those resources (Stone, 2008). Each person possesses a utility function, which incorporates their tastes and preferences and dictates how they perceive the value of a product, the product being infrastructure (Stone, 2008). Each individual is aiming to maximise utility in order to meet certain goals, such as wealth and happiness, within economic constraints (Stone, 2008). So it is not as simple as improving safety, although an overall improvement of facilities may increase the number of people cycling there will be a portion of individuals who remain unchanged in their perception of cycling because the specific reason for that individual not cycling was not considered closely enough. These influential factors may be physical barriers or psychological barriers to cycling, the psychological barriers will be harder to address than the physical barriers. Understanding the reasoning behind people’s choices will define to some degree whether the overall numbers of people cycling increases or stays at a stagnant percentage of the population. Changing Perception As discussed in the ‘Danish Collection of Cycle Concepts,’ a set of steps has been devised to modify the behaviour and perception of non-cyclists with the use of advertising campaigns. The correct approach taken to a campaign can effectively move users away from other forms of transport to cycling and this can be used to the advantage of local authorities, planners/designers and businesses to change the attitudes of a selected target group. It is crucial to clearly understand the target group in order to guarantee the campaign is successful.

Tertiary Students Cycling in Auckland Rowan De Costa & Athul Harris Page 5
IPENZ Transportation Group Conference, Auckland 7 - 9 March 2016
An unsuccessful campaign is a waste of resources and will draw negative publicity from the media (Andersen et al., 2012).
Figure 3: Stages of changing perception (Andersen et al., 2012)
Figure 3 demonstrates the basic process needed to effectively change and consolidate the perception that cycling is a very desirable form of transport. Conclusions All the elements discussed above are crucial to the outcome and so each of them must be carefully considered in the planning process. The behavioural and health elements are often left out of the planning and design stages of many engineering projects mainly due to the fact that they are profit driven. Transferring motorised vehicle trips to cycle trips will show significant benefits in the health sector as it will improve health of the population and help Auckland grow as a sustainable city and also increase the overall quality of life. Education is a critical tool that can be utilised more to change perceptions of the public, this will also significantly increase safety for cyclists as well as motorists. Careful consideration of each of the factors considered in this study will ensure a more reliable and well-rounded end result is obtained.
METHODOLOGY The process began with the literature review, which gave a clear understanding of the major elements affecting people who cycle. These were then incorporated into the basic structure of the survey that was later distributed to students. This version of the survey was then discussed with Auckland Transport’s Senior Travel Demand Planner, who gave constructive feedback on the questionnaire and made some changes so that information collected overlapped as little as possible and only relevant information was collected. This stage took time as the questions were amended and reviewed several times. Google Forms was used as the primary platform for the survey. Contact was then made with a diverse array of university students (through flyers/pamphlets and posters) in order to gain a fully random set of individuals partaking in the survey. The survey was distributed with the help of the University of Auckland Cycling Club, Auckland Transport, Auckland University Students’ Association, Auckland Student Movement and social media. The survey was promoted by pinning up posters around the universities so people willing to undertake the survey did so. Approximately 650 slip with the survey link on them were distributed by hand to students in an effort to maximize the number of responses received. At the start of the survey the target participants were split into two groups, cyclist and non-cyclists. This meant the two groups could be differentiated on the basis of the variation in perceptions of the factors collected from the two groups. Cyclists are likely to have different opinions and perceptions of the existing facilities in comparison to non-cyclists. Being able to pinpoint the weaknesses of the current network recognised by non-cyclists enabled recommendations to be made as to what needs to be done in order to increase the overall number of people cycling. The data collected was mainly concerning the physical attributes for use as inputs into the LOS calculation software. The information collected was broadened to include aspects of cycle facilities that are not already included in the LOS calculation. Behavioural attributes of cyclists and non-cyclists were also included in the survey and finally participants were given the chance to explain exactly what the deciding factor was for them. Having an open-ended question meant there was potential to reveal other discouraging factors that may not been incorporated into the
Tertiary Students Cycling in Auckland Rowan De Costa & Athul Harris Page 6
IPENZ Transportation Group Conference, Auckland 7 - 9 March 2016
questionnaire. Adding these to the analysis added considerable value to the overall end result of this research project. Once data was collected, an analysis was conducted to clarify which factors were perceived to be the most important. This exercise involved reading through all the survey responses and finding recurring patterns. The raw data obtained from the survey was compared, contrasted and correlated between each other.
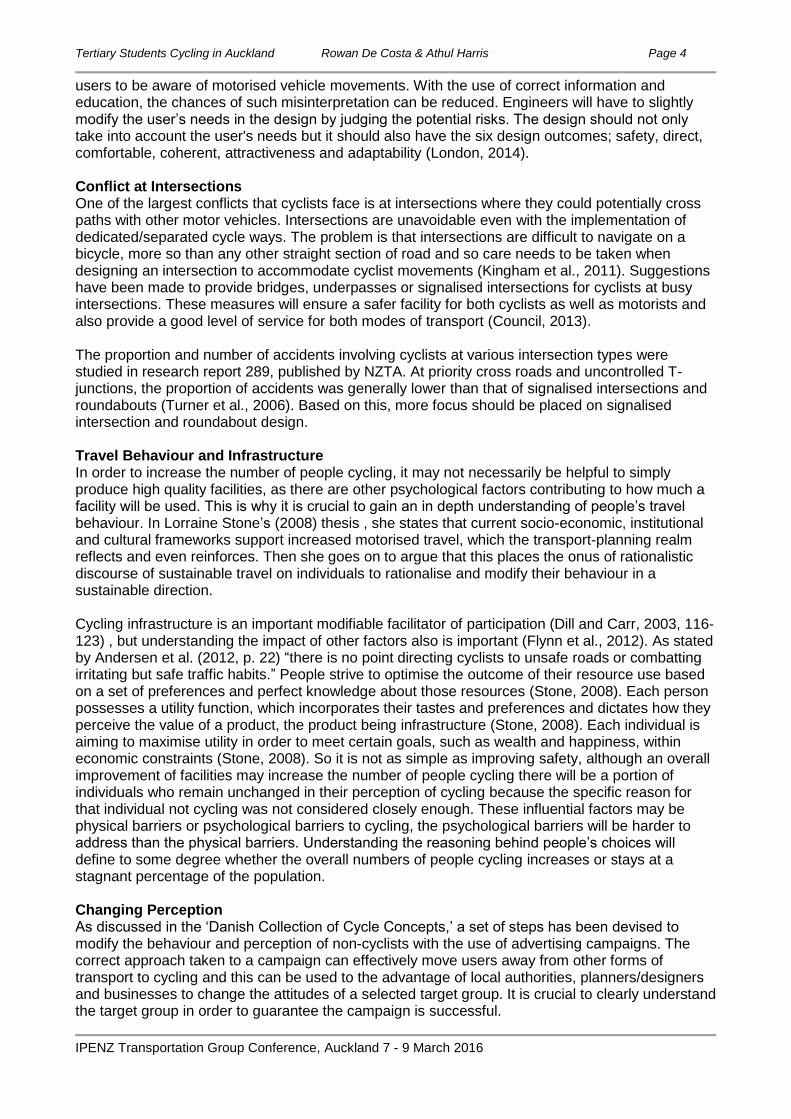
RESULTS & DISCUSSION The results are derived from the information gathered from the 292 individuals who took part in the survey. Participants were separated into cyclists and non-cyclists, based on whether the participants cycled to university three or more times a week. The data entered can then be compared to see if there were any significant differences in perception between cyclists and non-cyclists. Tests of significance were not undertaken. Assuming this sample population represent the tertiary population in Auckland City the following conclusions were derived. General findings Of all the responses received, there was a 30 to 70 split of cyclists to non-cyclists respectively. This is ideal as the data from cyclists was only required as a reference to compare against the perceptions of the non-cyclists. Since the main goal is to analyse what needs to be done in order to change the thinking of non-cyclists. In summary 14.4% of the data is from AUT students and the remaining 85.3% is from UoA students. This is a considerable split and it cannot be justified by stating that UoA has a larger number of students that AUT because UoA has approximately 42000 students and AUT has around 27000 students. The large difference may have been the result of increased promotion within UoA. It is unclear as to how this may have come about since an active effort was made to distribute equal amounts of pamphlets to each university. There was a considerably higher number of men who responded to the survey than women. 59.9% of respondents were men and 39.4% were women. As shown in Table 1 there is a small difference in the proportion of men cycling (18%) versus the proportion of women cycling (10%). Therefore it is safe to assume there is no definite correlation between gender and the likelihood of men versus women cycling.
Criteria Percentage of cyclists Percentage of non-cyclists Total
Male 18% 42% 60%
Female 10% 29% 39%
Total 28% 72% 99%
Table 1: Correlation of gender and likelihood of cycling
Tertiary Students Cycling in Auckland Rowan De Costa & Athul Harris Page 7
IPENZ Transportation Group Conference, Auckland 7 - 9 March 2016
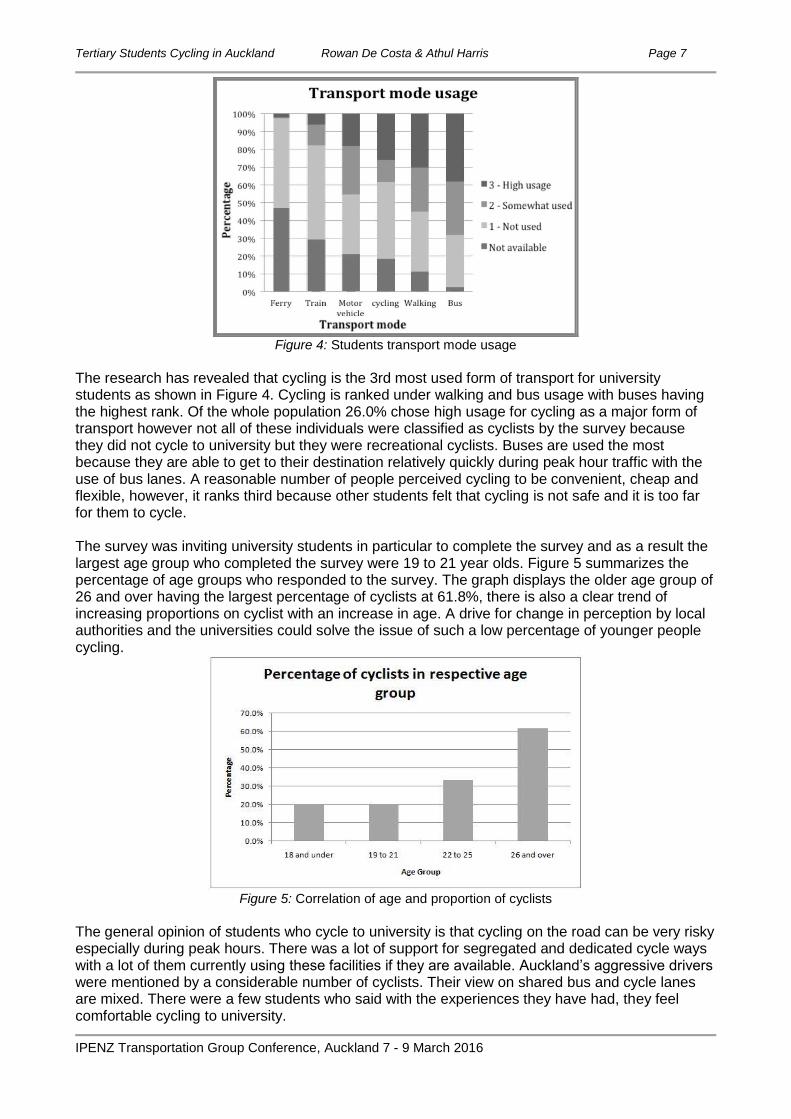
Figure 4: Students transport mode usage
The research has revealed that cycling is the 3rd most used form of transport for university students as shown in Figure 4. Cycling is ranked under walking and bus usage with buses having the highest rank. Of the whole population 26.0% chose high usage for cycling as a major form of transport however not all of these individuals were classified as cyclists by the survey because they did not cycle to university but they were recreational cyclists. Buses are used the most because they are able to get to their destination relatively quickly during peak hour traffic with the use of bus lanes. A reasonable number of people perceived cycling to be convenient, cheap and flexible, however, it ranks third because other students felt that cycling is not safe and it is too far for them to cycle. The survey was inviting university students in particular to complete the survey and as a result the largest age group who completed the survey were 19 to 21 year olds. Figure 5 summarizes the percentage of age groups who responded to the survey. The graph displays the older age group of 26 and over having the largest percentage of cyclists at 61.8%, there is also a clear trend of increasing proportions on cyclist with an increase in age. A drive for change in perception by local authorities and the universities could solve the issue of such a low percentage of younger people cycling.
Figure 5: Correlation of age and proportion of cyclists
The general opinion of students who cycle to university is that cycling on the road can be very risky especially during peak hours. There was a lot of support for segregated and dedicated cycle ways with a lot of them currently using these facilities if they are available. Auckland’s aggressive drivers were mentioned by a considerable number of cyclists. Their view on shared bus and cycle lanes are mixed. There were a few students who said with the experiences they have had, they feel comfortable cycling to university.

Tertiary Students Cycling in Auckland Rowan De Costa & Athul Harris Page 8
IPENZ Transportation Group Conference, Auckland 7 - 9 March 2016
The perception of many non-cyclists was that cycling is a good option to stay healthy, is an environmentally friendly option and a cheap form of commute. Cyclists and non- cyclists share the opinion that Auckland’s road network is very dangerous to use as a cyclist. The key point of difference is that despite the safety concerns by both parties, cyclists have the confidence to cycle on the current road facilities. The lack of confidence and experience of the non-cyclists are what stops them from cycling. Prioritised Influential Factors Tables 2 and 3 lists the prioritised influential factors which were rated by the survey participants in an effort to narrow down which of them has the highest impact on people when choosing to cycle. Each participant was asked to rate each influential factor from one to five, one being the least influential and five being the most influential. The final score was determined by taking the average of the ratings for each factor from each participant.
Cyclists Influential Factors
Non-cyclists Influential Factors
Rank Influential factors Score
Rank Influential factors Score
1 Travel time 4.15
1 Weather 4.16
2 Distance to destination 3.99
2 Distance to destination 3.95
3 Secure bike parking 3.94
3 Travel time 3.91
4 Weather 3.82
4 Secure bike parking 3.90
5 Presence of large vehicles (e.g. Buses, Trucks) 3.41
5
Availability of dedicated cycleway (e.g. Grafton Gully) 3.83
6 Steepness of route 3.41
6 Presence of large vehicles (e.g. Buses, Trucks) 3.77
7 Speed of vehicles 3.40
7
Availability of segregated facility (separation from traffic e.g. Beach Road) 3.76
8 Availability of on road cycle lane 3.39
8 Amount of traffic 3.72
9 Width of traffic lane 3.38
9 Speed of vehicles 3.65
10 Even road surface 3.34
10 Availability of on road cycle lane 3.63
11 Width of shoulder (e.g. for passing) 3.28
11 Steepness of route 3.61
12
Availability of segregated facility (separation from traffic e.g. Beach Road) 3.23
12 Width of traffic lane 3.59
13 Amount of traffic 3.23
13 Lighting at night 3.50
14 Availability of dedicated cycleway (e.g. Grafton Gully) 3.17
14 Width of shoulder (e.g. for passing) 3.31
15 Maintaining a good average cycling speed 3.17
15 Even road surface 3.20
16 Static obstructions (e.g. intersections, bus stop, parked cars, driveways) 3.05
16
Static obstructions (e.g. intersections, bus stop, parked cars, driveways) 3.18
17 Lighting at night 2.89
17 Shower facilities 3.17
18 Shower facilities 2.68
18 Maintaining a good average cycling speed 2.94
19 Bike repair facilities at the University 2.57
19 Signs (e.g. to parking facilities, directions) 2.64
20 Visual appeal of facilities 2.33
20 Presence of pedestrians 2.59
21 Presence of pedestrians 2.29
21 Bike repair facilities at the University 2.50
22 Friends to cycle with 1.99
22 Visual appeal of facilities 2.45
23 Signs (e.g. to parking facilities, directions) 1.93
23 Friends to cycle with 2.44
Table 2: Prioritised Cyclists and Non-cyclists Influential Factors

Tertiary Students Cycling in Auckland Rowan De Costa & Athul Harris Page 9
IPENZ Transportation Group Conference, Auckland 7 - 9 March 2016
The perception of both groups can be clearly seen when the average of each of the attributes are prioritised from highest to lowest. Using the average gives an effective method of prioritising the factors since it takes each response into account. The common factors present in the top five of both groups were distance to destination, travel time, secure bike parking and weather. These must all be considered first when designing a new facility in order to satisfy the wants of both cyclists and non-cyclists. Non-cyclists deviated in preference to cyclist on the high level of influence placed on the ‘Availability of Dedicated Cycle Ways’ (placed 5th). This is most likely due to the lack of confidence and perceived high level of danger, which non-cyclists have about cycling on the road. Cyclists rated the influence of the ‘Availability of Dedicated Cycle Ways’ in 14th place. This difference in preference shows how comfortable cyclists are with cycling on current facilities as opposed to non-cyclists. It is a clear indication that there is a need for the development of a dedicated cycle way network with smaller catchment areas around Auckland in order to convert non-cyclists into cyclists. The other option is to change the perception of non-cyclists to that of the cyclists who believe current facilities are sufficient for regular use. Analysis of Top Five Influential Factors ‘Availability of On-Road Cycle Lanes’ did not seem to be as large an issue for cyclists as it was for non-cyclists as shown in Figure 6. The graphic representation of this shows cyclists with a bell curve, peaking at 4 (somewhat influential) while the non-cyclists had a linear trend increasing towards 5 indicating this is a very influential factor for non-cyclists. This general trend of being very influential was consistent with the ‘Presence of Segregated Facilities’ (Figure 7) as well as dedicated facilities (Figure 8) in the case of non-cyclists. However for cyclists there was no obvious pattern for what the majority preferred as a group.
Figure 6: Comparison of cyclists and non-cyclists responses for Availability of on road cycle lanes
Figure 7: Comparison of cyclists and non-cyclists responses for Availability of segregated cycle way

Tertiary Students Cycling in Auckland Rowan De Costa & Athul Harris Page 10
IPENZ Transportation Group Conference, Auckland 7 - 9 March 2016
Figure 8: Comparison of cyclists and non-cyclists responses for Availability of dedicated cycle ways
Figure 9: Comparison of cyclists and non-cyclists responses for travel time
Travel time is equally important for non-cyclists and cyclists as shown in Figure 9. This is understandable as time is a major factor people consider when selecting their mode of travel.
Figure 10: Comparison of cyclists and non-cyclists responses for distance to destination
The ‘Distance to Destination’ factor showed a consistent result and spread of the graphs for cyclists and non-cyclists as shown in Figure 10. Both groups recognised this as very influential on their journey, cyclists to a lesser extent than non-cyclists. This can be attributed to the better level of fitness of the cyclists.
Figure 11: Comparison of cyclists and non-cyclists responses for weather
Figure 11 shows weather is a crucial factor for everyone and it heavily affects people’s decision on which transport mode to use when commuting. It is the highest scored influential factor for non-cyclists.

Tertiary Students Cycling in Auckland Rowan De Costa & Athul Harris Page 11
IPENZ Transportation Group Conference, Auckland 7 - 9 March 2016
Figure 12: Comparison of cyclists and non-cyclists responses for secure bike parking
Secure bike parking was also ranked in the top five influential factors for both groups and there is a consistent trend of high level of influence as shown in Figure 12. Bikes can be expensive and so it is essential to have secure bike parking facilities placed in high foot traffic areas in the public eye, in order to minimise the chance of theft. Surveillance could also be put in place so that the university security service has the ability to monitor the bike parking facilities and so people trust the system in place. Least Influential Factors There are similarities in the least influential factors as rated by cyclists and non-cyclists. The bottom five factors are common between the two groups with slight variations in score. These include; friends to cycle with, presence of pedestrians, aesthetic appeal, bike repair facilities at university and signage. The bottom five factors can be considered to have the least impact on cyclists and non-cyclists so they can be given the lowest level of priority when designing new facilities. Location and Perception Logical reasoning would suggest that people living closer to university are more likely to cycle however this is not always the case. Figure 13 plots the non- cyclists who specified that it is too far for them to consider cycling as a viable form of transport. The two radii 3km and 6km roughly correspond to travel times of 15 minutes and 25 minutes respectively. The size of the plots represents the proportion of people from each of the general areas within the central suburbs. There is a large proportion of these people situated in the central suburbs who think it is too far to cycle to university and this is a clear indication that perception needs to be changed. People living within the two radii could cycle to university with relative ease with a travel time that is often quicker than public transport. This may also be due to the fact that people think they live too close to cycle to university.
Figure 13: Non-cyclists versus perception

Tertiary Students Cycling in Auckland Rowan De Costa & Athul Harris Page 12
IPENZ Transportation Group Conference, Auckland 7 - 9 March 2016
Motivational and De-motivational Factors The pie chart in Figure 14 displays an approximately even split between the various options which includes cycling being a cheaper, healthier option, faster than other options, more enjoyable than other options and very few people training for competitions. The participants had the option of selecting as many of the motivational factors that applied to them. Therefore each of the factors had an approximately equal amount of influence on cyclists with the exception of training for competitions.
Figure 14: Cyclists motivational factors
Non-cyclists were asked to select from a list, the most demotivating factors as shown in Figure 15. The governing factor was that the distance from their origin to university was too far. This is a matter of perception as discussed previously. Many of the other concerns raised by the non-cyclists were similar to those of the cyclists such as the on road facilities being too dangerous to use.
Figure 15: Non-cyclists de-motivational factors
Location and Availability of Cycle ways
Figure 16: Cyclists location versus availability of separated cycle way facilities

Tertiary Students Cycling in Auckland Rowan De Costa & Athul Harris Page 13
IPENZ Transportation Group Conference, Auckland 7 - 9 March 2016
Figure 16 displays the proportion of cyclists in each area and the location of existing dedicated and segregated cycle facilities. The sizes of the circles represent the proportion of cyclists in each area. There is a clear correlation between the number of cyclists in an area and the availability of facilities. The areas with dedicated facilities have higher numbers of cyclists in their vicinity. The North-western cycle way is good example of this phenomenon as it is used by a considerable amount of people. The Need for Education Educating people about the proper use of cycling facilities will definitely improve how well they work when used by cyclists. Other road users having knowledge of the facilities, will also benefit as well as making cyclists feel safer on the road. 37% of cyclists and 62% of non-cyclists said they do not know how to use cycling facilities properly. This included things such as cycle boxes and hooked right turns. A well- orchestrated advertising campaign could solve this issue as well as raise awareness of cyclists on the road.
Figure 17: Cyclists perception and non-cyclists perception
The majority of cyclists and non-cyclists perceive current facilities to be dangerous. This not only includes the cyclists and non-cyclists themselves but also their relatives and loved ones. Safety was mentioned by a significant amount of people who took part in the survey. Safety goes hand in hand with the perception that the current facilities are dangerous. If safety is improved with the implementation of effective cycling facilities the perception that cycling is dangerous can be changed. If these perceptions can be changed or catered for, then the number of students cycling will significantly increase.
CONCLUSIONS In conclusion three main factors need to be considered in order to increase the overall numbers of people cycling. These are changes in perception, improving infrastructure and educating the public. A change in perception is needed for cycling to be seen as a viable form of transport around Auckland. Increasing awareness of existing cycling facilities will provoke thought and people will come to the conclusion that cycling is a reliable, enjoyable and effective mode of transport. Improving infrastructure will help drive this change in perception. As the level of safety increases more people will begin to give cycling a go and adopt it as their primary mode of travel. This means improving the overall experience of cyclists during and at the end of their journey. Implementing additional cycle way facilities as well as end of journey facilities such as secure bike parking will encourage more students to cycle. Education is a key tool, which could be utilised by local authorities to improve the safety of not only cyclists but all road users. When people know of the intended use of a facility, the level of safety will be improved and this will also mean that such rules can be enforced.

Tertiary Students Cycling in Auckland Rowan De Costa & Athul Harris Page 14
IPENZ Transportation Group Conference, Auckland 7 - 9 March 2016
Finally the most influential factors affecting non- cyclists were found to be weather, distance to destination, travel time, secure bike parking and availability of dedicated cycle ways (most to least influential). The current number of students cycling to university could be increased with the joint effort of the universities and Auckland Transport. Universities could focus on facilities available at the campus:
Secure bike parking so that individuals are not worried about the possibility of having their bikes stolen. This could mean installing more caged facilities as well as having more robust bike stands.
Placing bike stands in appropriate places. Ideally having bike racks in the public eye or in areas of high foot traffic so that the chance of theft is further reduced. People often spend a large sum of money on their bikes so security is a very important issue and needs to be addressed.
Improved surveillance by the university security staff of bike parking facilities will reduce the chance of theft.
The universities could invest in implementation of signage directing people to facilities and bike parking so that people are well informed. The signage could also include travel times to give students an idea of how long it would take to other common destination via a bike.
The universities could invest in a rental bike service so that students wanting to travel between campuses within the city have cycling as an option. The feasibility of this could be studied further.
Auckland transport authorities could do the following:
Educating the public on the proper use of cycling facilities so that all road users benefit from the additional knowledge.
Implement more dedicated cycle ways and on road routes for cyclists throughout Auckland’s central suburbs.
REFERENCES ADMINISTRATION, M. S. H. 2013. Bicycle policy & design guidelines. America. ANDERSEN, T., BREDAL, F., WEINREICH, M., JENSEN, N., RIISGAARD-DAM, M. & NIELSEN,
M. K. 2012. Collection of Cycle Concepts 2012, Denmark, Cycling Embassy of Denmark. ASADI-SHEKARI, Z., MOEINADDINI, M. & SHAH, M. Z. 2013. Non-motorised Level of Service:
Addressing Challenges in Pedestrian and Bicycle Level of Service. Transport Reviews, 33, 166-194.
AUCKLAND, U. O. 2014. Key Statistics 2010-2014. Auckland: The Univeristy of Auckland. BALLE, P. 2014. Bike to Uni Survey: Report and recommendations. 2014 ed. BAMBERG, S., AJZEN, I. & SCHMIDT, P. 2003. Choice of travel mode in the theory of planned
behavior: The roles of past behavior, habit, and reasoned action. Basic and Applied Social Psychology, 25, 175-187.
COUNCIL, A. 2014. Census Auckland. [Online]. Auckland Council. Available: http://www.censusauckland.co.nz/census-area-unit-view/ 2015].
COUNCIL, C. C. 2013. Christchurch cycle design guidelines. COUNCIL, O. T. & GROUP, M. 2013. Cycling facilities. Ontario: Ministry of Transportation of
Ontario. DILL, J. & CARR, T. 2003. Bicycle Commuting and Facilities in Major U.S. Cities: If You Build
Them, Commuters Will Use Them. Transportation Research Record 1828, 116-123. DOORLEY, R., PAKRASHI, V. & GHOSH, B. 2015. Quantifying the Health Impacts of Active
Travel: Assessment of Methodologies. Transport Reviews. EWING, R., SCHMID, T., KILLINGSWORTH, R., ZLOT, A. & RAUDENBUSH, S. 2008.
Relationship between urban spwral and physical activily, obesity, and morbidity, Springer US.

Tertiary Students Cycling in Auckland Rowan De Costa & Athul Harris Page 15
IPENZ Transportation Group Conference, Auckland 7 - 9 March 2016
FLYNN, B. S., DANA, G. S., SEARS, J. & AULTMAN-HALL, L. 2012. Weather factor impacts on commuting to work by bicycle. Preventive medicine, 54.
KINGHAM, S., TAYLOR, K. & KOOREY, G. 2011. Assessment of the type of cycling infrastructure required to attract new cyclists. NZ Transport Agency research. New Zealand: Department of Civil and Natural Resources Engineering University of Canterbury.
KWOK, R. & YEH, A. 2004. The use of modal accessibility gap as an indicator for sustainable transport development. Environment and Planning A, 36.
LONDON, T. F. 2014. London cycling design standards. London: Transport for London. MCPHEDRAN, B. & NICHOLLS, A. 2014. Measuring the cycling levels of service in Wellington –
How bad is it? New Zealand: Opus International. O’FALLON, C. 2010. Bike Now: Encouraging cycle commuting in New Zealand. NZ Transport
Agency research. New Zealand. POLCAR, A. 2013. Reducing car Trips by promoting alternative modes of transportation. SHINAR, D. 3.3.2 Ajzen's Theory of Planned Behavior. Traffic Safety and Human Behavior.
Emerald, Inc. SHINAR, D. 2007. Traffic Safety and Human Behavior, Elsevier, 2007. STONE, L. 2008. The rationality of sustainable travel behaviour. Masters of Environmental
Management, The University of Auckland. TURNER, S. A., ROOZENBURG, A. P. & FRANCIS, T. 2006. Predicting accident rates for cyclists
and pedestrians New Zealand.
ACKNOWLEDGEMENTS Thanks to Roger Dunn for all the support and organisation of the prize draw for the survey. Auckland Transport provided many resources and sponsored the prizes for the survey. The author would like to specially thank Katheryn King and Hannah Jemmett for their support.


![[Urban transportation policy program]city paper presentation guangzhou](https://static.fdocuments.in/doc/165x107/58776db91a28ab5b568b5265/urban-transportation-policy-programcity-paper-presentation-guangzhou.jpg)