IPCC WGII AR5 Chapter 26 SECOND-ORDER DRAFT · IPCC WGII AR5 Chapter 26 SECOND-ORDER DRAFT ... the...
68
IPCC WGII AR5 Chapter 26 SECOND-ORDER DRAFT Government and Expert Review Page 1 of 68 28 March - 24 May 2013 # ID Ch From Page From Line To Page To Line Comment Response 1 57686 26 0 0 0 0 Greater indigenous and other participant observations of local scale changes should be brought into the information gathering and assessment process in a robust manner. Adaptation decision-making could be greatly enhanced through coordinated communication (Elizabeth Burleson, Pace University School of Law) It is not clear how this comment is relevant to the chapter 2 57931 26 0 0 0 0 My FOD comments have been mostly addressed in the SOD. Overall, I am happy with the revised draft. Specific comments provided below are mostly minor or clarification type. These comments may be helpful in preparing the final draft. (Sanjiv Kumar, Center for Ocean-Land-Atmosphere Studies) We are glad to read this 3 64353 26 0 0 0 0 The writing team is to be commended by the continuous improvement of the chapter from the ZOD and FOD to the current draft. While parts of the chapter are quite strong, other sections are more a listing of study findings with no obvious assessment (value added). It is particularly difficult to link these weaker sections with the Executive Summary and associated confidence statements. Figure 26-6 provides a strong opportunity for value-added analysis that is not really exploited. There are several subsections that could be shortened or deleted, freeing up space for additional analysis. In final revision the writing team is encouraged to pay particular attention to the Executive Summary and ensure that these statements are clear, substantive, and accurately reflect the supporting literature. Be clear whether statements apply equally to the whole of North America, or if they only apply to one of the three countries comprising the region. (Don Lemmen, Canada National Study) The Executive Summary was redrafted and we have added several figures which help synthesize the chapter 4 75122 26 0 0 0 0 A glaring omission from this Chapter is the lack of presentation of any results from studies using the RCP2.6 scenario. Policymakers would benefit from seeing impacts from an array of scenarios. (UNITED STATES OF AMERICA) Unfortunately, the published literature does not include studies on impacts of climate change on North America using the RCP 2.6 scenario. We hope such studies will be published and cited in the AR6. 5 75123 26 0 0 0 0 Add reference to Glossary somewhere in chapter. (UNITED STATES OF AMERICA) We do not believe it is necessary to reference the doucment. If the TSU wishes to add a reference, we will not object. 6 75124 26 0 0 0 0 At several points in the Chapter, it is unclear whether claims refer to local areas or to the entire continent of North America. It is suggested that this distinction be made more clear; otherwise some statements may be misleading. Specific examples include: Box 26-1 regarding ozone and PM10 emissions; section 26.3.1 where most flood studies are of local regions; section 26.6.1.6 regarding vector borne diseases, and section 26.4 regarding beetles that are specific to the US and Canada. (UNITED STATES OF AMERICA) We have clarified this. In general, we cover all of North America except for the Arctic region. That is covered in the Polar chapter. 7 75125 26 0 0 0 0 Attribution of impacts to climate change needs to be made clear in both the "Current Trends" and the "Projected Impacts" sections. An explicit non-climate change counterfactual is most preferable, however it understood that this counterfactual may not be available or may be inconsistent in the existing literature. Specific examples on this ambiguity are found in sections 26.3.1 regarding the impacts of floods; 26.3.3.1 regarding the water scarcity; 26.5 where the connection between climate change and crop prices is vague; 26.7.3.2 where it is unclear how much of a driver climate change is for electricity demand; and 26.7.5.2.1 where most of the cited costs to the transportaion system are not attributable to climate change. (UNITED STATES OF AMERICA) We have addressed attribution of climate change impacts in sections 26.3, 26.4, 26.5, 26.6, and 26.8. We have also tried to more clearly distinguish between observed and projected impacts 8 75126 26 0 0 0 0 Avoid language like ‘sensitive wetlands’, ‘fragile ecosystems’ , or 'climate-sensitive urban areas,' unless these are describing a subset of wetlands that are fragile, a subset of urban areas that are climate-sensitive and so on. (UNITED STATES OF AMERICA) The terms "sensitive wetlands" and "fragile ecosystems" have been removed. The term "climate sensitive urban systems" is from a cited article
Transcript of IPCC WGII AR5 Chapter 26 SECOND-ORDER DRAFT · IPCC WGII AR5 Chapter 26 SECOND-ORDER DRAFT ... the...

IPCC WGII AR5 Chapter 26 SECOND-ORDER DRAFT
Government and Expert Review Page 1 of 68 28 March - 24 May 2013
# ID ChFrom Page
From Line
To Page
To Line Comment Response
1 57686 26 0 0 0 0 Greater indigenous and other participant observations of local scale changes should be brought into the information gathering and assessment process in a robust manner. Adaptation decision-making could be greatly enhanced through coordinated communication (Elizabeth Burleson, Pace University School of Law)
It is not clear how this comment is relevant to the chapter
2 57931 26 0 0 0 0 My FOD comments have been mostly addressed in the SOD. Overall, I am happy with the revised draft. Specific comments provided below are mostly minor or clarification type. These comments may be helpful in preparing the final draft. (Sanjiv Kumar, Center for Ocean-Land-Atmosphere Studies)
We are glad to read this
3 64353 26 0 0 0 0 The writing team is to be commended by the continuous improvement of the chapter from the ZOD and FOD to the current draft. While parts of the chapter are quite strong, other sections are more a listing of study findings with no obvious assessment (value added). It is particularly difficult to link these weaker sections with the Executive Summary and associated confidence statements. Figure 26-6 provides a strong opportunity for value-added analysis that is not really exploited. There are several subsections that could be shortened or deleted, freeing up space for additional analysis. In final revision the writing team is encouraged to pay particular attention to the Executive Summary and ensure that these statements are clear, substantive, and accurately reflect the supporting literature. Be clear whether statements apply equally to the whole of North America, or if they only apply to one of the three countries comprising the region. (Don Lemmen, Canada National Study)
The Executive Summary was redrafted and we have added several figures which help synthesize the chapter
4 75122 26 0 0 0 0 A glaring omission from this Chapter is the lack of presentation of any results from studies using the RCP2.6 scenario. Policymakers would benefit from seeing impacts from an array of scenarios. (UNITED STATES OF AMERICA)
Unfortunately, the published literature does not include studies on impacts of climate change on North America using the RCP 2.6 scenario. We hope such studies will be published and cited in the AR6.
5 75123 26 0 0 0 0 Add reference to Glossary somewhere in chapter. (UNITED STATES OF AMERICA) We do not believe it is necessary to reference the doucment. If the TSU wishes to add a reference, we will not object.
6 75124 26 0 0 0 0 At several points in the Chapter, it is unclear whether claims refer to local areas or to the entire continent of North America. It is suggested that this distinction be made more clear; otherwise some statements may be misleading. Specific examples include: Box 26-1 regarding ozone and PM10 emissions; section 26.3.1 where most flood studies are of local regions; section 26.6.1.6 regarding vector borne diseases, and section 26.4 regarding beetles that are specific to the US and Canada. (UNITED STATES OF AMERICA)
We have clarified this. In general, we cover all of North America except for the Arctic region. That is covered in the Polar chapter.
7 75125 26 0 0 0 0 Attribution of impacts to climate change needs to be made clear in both the "Current Trends" and the "Projected Impacts" sections. An explicit non-climate change counterfactual is most preferable, however it understood that this counterfactual may not be available or may be inconsistent in the existing literature. Specific examples on this ambiguity are found in sections 26.3.1 regarding the impacts of floods; 26.3.3.1 regarding the water scarcity; 26.5 where the connection between climate change and crop prices is vague; 26.7.3.2 where it is unclear how much of a driver climate change is for electricity demand; and 26.7.5.2.1 where most of the cited costs to the transportaion system are not attributable to climate change. (UNITED STATES OF AMERICA)
We have addressed attribution of climate change impacts in sections 26.3, 26.4, 26.5, 26.6, and 26.8. We have also tried to more clearly distinguish between observed and projected impacts
8 75126 26 0 0 0 0 Avoid language like ‘sensitive wetlands’, ‘fragile ecosystems’ , or 'climate-sensitive urban areas,' unless these are describing a subset of wetlands that are fragile, a subset of urban areas that are climate-sensitive and so on. (UNITED STATES OF AMERICA)
The terms "sensitive wetlands" and "fragile ecosystems" have been removed. The term "climate sensitive urban systems" is from a cited article

IPCC WGII AR5 Chapter 26 SECOND-ORDER DRAFT
Government and Expert Review Page 2 of 68 28 March - 24 May 2013
# ID ChFrom Page
From Line
To Page
To Line Comment Response
9 75127 26 0 0 0 0 Because this chapter is trying to provide a North America-specific discussion of vulnerabilities and adaptation, without duplicating material in other WGII chapters, it is understood that the authors chose to highlight a small number of topics within each sector. However, there is insufficient information provided as to why the topics that are covered were chosen, and why other topics were left out. This could be partially addressed by providing more links to other WGII chapters, although those sector-specific chapters do not always indicate which studies come from North America so it is not always a simple process to pull out the North America-specific information in those sector-specific chapters. It could also be better addressed by providing a slightly more expanded explanation of why the highlighted topics were chosen (and the expense of other potential topics). We suggest that the authors reviewing WGII Chapter 4 p. 34 Lines 20-26 for an example of a more thorough way to justify a narrowed focus for the remainder of a section/chapter. Examples of specific places to provide this type of explanation, and increased references to other WGII chapters, within Chapter 26 are included in other comments provided with this review. (UNITED STATES OF AMERICA)
We have included more references to corresponding sector chapters. This comment seems most relevant to ecosystems, 26.4, and there we have explained why we focus on certain types of ecosystems.
10 75128 26 0 0 0 0 Headers are too brief. For example: "26.3.1 Observed impacts on water resources”. Observed impacts of what ? Does not say climate change and many of the observed changes described in the section are not attributed to climate change. Similarly, "26.4.2.1 Observed Impacts" does not say impacts of what. (UNITED STATES OF AMERICA)
Comment has been addressed particularly in section 26.8 and clarified in Section 26.3
11 75129 26 0 0 0 0 In adaptation sections, more consistent discussion of trade-offs is required for each adaptation strategy. Some strategies exacerbate climate change, some are very expensive, others will have non-climate environmental impacts. Specific examples where discussion of trade-offs is needed are 26.3.4 where the distinction between "hard" and "soft" strategies, as cited in the executive summary, is ambiguous and does not specifically address possible negative effects of adaptation; 26.4 where there may be significant detriments to ecosystems from adaptation strategies;26.5.3.1 where organic practices are not necessarily greenhouse gas reducing; and 26.7.1.3 where air condition is cited as an adaptation though it may also exacerbate greenhouse gas emissions. Individual comments are included for each of these examples. (UNITED STATES OF AMERICA)
Unfortunately, there is insufficient space to discuss adaptations in the level of detail the reviewer suggests
12 75130 26 0 0 0 0 It does not appear that there are significant inconsistencies in the conclusions provided in Chapters 26 and 11 with regard to impacts on human health (globally in Chapter 11 and for North America in Chapter 26). Nevertheless, there are overlaps in the discussions of Chapter 26 and Chapter 11 as well as more specific discussions of health issues in Chapter 11 and it would be useful to cross reference issues raised in Chapter 11 that support findings in Chapter 26. In particular for issues such as water and air quality changes as well as the exacerbation of disease vectors, it would be useful to identify the extent to which the overall findings about human health laid out in Chapter 11 are relevant and play out in North America. (UNITED STATES OF AMERICA)
We have now extensively cross-referenced more detailed discussions of specific topics appearing in Chapter 11 that are briefly covered in Chapter 26. The Chapter 11 section references were based on the SOD.
13 75131 26 0 0 0 0 It is often unclear whether impacts are the result of mean effects or variability effects. This is particularly salient in the current physical trends section 26.7.2.2, however attribution of impacts to mean effects or extreme events could be better throughout the document. (UNITED STATES OF AMERICA)
In revising the chapter we have used examples of current extremes and variability to identify vulnerabilites and have used projections of changes in mean climate to identify future impacts of climate change. However, in many cases the projected future impacts are the result of changes in climate extremes that would happen as a result of changes in mean conditions.
14 75132 26 0 0 0 0 It would be helpful for the reader if there were some indication, using either maps or verbal descriptions, of what areas of North America are being referred to when, for example, one says northern North America or Eastern Canada. It can become particularly confusing referring to more northern parts of North America, and it is not quite clear whether North Alaska and Arctic Canada are included here, or covered primarily in Chapter 28 on Polar Regions. (UNITED STATES OF AMERICA)
We clarify that for the most part polar areas in North America are not included in Chapter 26 and are covered in the polar regions chapter. Space does not permit us to include a map with all the locations mentioned in the text.
15 75133 26 0 0 0 0 It would be preferable if maps could show the entire North American continent. (UNITED STATES OF AMERICA) Figure 26-2 focuses on the parts of North America affected by extreme events which caused large losses. We think not showing the entire continent makes the figure easier to read. Figures 26-3 and 26-4 display all of North America.

IPCC WGII AR5 Chapter 26 SECOND-ORDER DRAFT
Government and Expert Review Page 3 of 68 28 March - 24 May 2013
# ID ChFrom Page
From Line
To Page
To Line Comment Response
16 75134 26 0 0 0 0 Recommended citiations for literature on non-modern adaptation.Recommended citiations: Constanza, Robert, Lisa J. Graumlich, and Will Steffen, eds. 2007 Sustainability or Collapse? An Integrated History and Future of People on Earth.MIT Press, Cambridge, MA. Cooper, Jago, and Payson Sheets, eds. 2012 Surviving Sudden Environmental Change: Answers from Archaeology. University Press of Colorado, Boulder. Crumley, Carole, ed. 1994 Historical Ecology.School of American Research Press, Santa Fe, NM. Dugmore, et al. 2007 The Role of Climate in Settlement and Landscape Change in the North Atlantic Islands: An Assessment of Cumulative Deviations in High-Resolution Proxy Climate Records. Human Ecology 35: 169 - 178. Fisher, C T., J. Brett Hill, and G M. Feinman. 2009. The Archaeology of Environmental Change: Socionatural Legacies of Degradation and Resilience. University of Arizona Press, Tucson. Hornberg, A. J. R. McNeill, and J Martinez-Alier, eds. 2007. Rethinking Environmental History: World System History and Global Environmental Change. Altamira, Lanham, MD. Kirch, Patrick V. 1997. Microcosmic Histories: Island Perspectives on "Global Change. American Anthropologist99(1): 30-42. 2007 Hawaii as a Model System for Human Ecodynamics.American Anthropologist 109(1): 8 - 26. Kohler, Timothy A., and Sander van der Leeuw, eds. 2007. The Model-Based Archaeology of Socionatural Systems. School of American Research Press, Santa Fe, NM. Marks, Robert B. 2007. The Origins of the Modern World: A Global and Ecological Narrative from the Fifteenth to the TwentyFirst Century,2nd ed. Rowman and Littlefield, Toronto. McGovern, T H., et al. 2007. Landscapes of Settlement in Northern Iceland: Historical Ecology of Human Impact and Climate Fluctuation on the Millennial Scale. American Anthropologist 109(1): 27 - 51. Norberg, J, J Wilson, B Walker, and E Ostrom. 2008. Diversity and Resilience of Social-Ecological Systems. In Complexity Theory for a Sustainable Future, ed. Jon Norberg and Graeme S. Cumming. Columbia University Press, New York, pp. 46 - 81. Redman, C L., S. R. James, P. R. Fish, and J. Daniel Rogers, eds. 2004. The Archaeology of Global Change. Smithsonian Institution Press, Washington, DC. Rick, Torben C., and Jon M. Erlandson, eds. 2008. Human Impacts on Ancient Marine Ecosystems: A Global Perspective. University of California Press, Berkeley. (UNITED STATES OF AMERICA)
We think these citations could be made in the chapters on adaptation. With the limited space we have in this chapter, we have focused the adaptation chapter on recent adaptation in response to recent changes in climate.
17 75135 26 0 0 0 0 Suggest that references be inserted immediately after the relevant comment is made, for clarity. For example, p. 15, line 43-45 cites a Mexican source and a Canadian source, but the INA source should be brought forward in the sentence. (UNITED STATES OF AMERICA)
We have done so.
18 75136 26 0 0 0 0 Terms “early” and “late” are used to modify 21st Century without definition. (UNITED STATES OF AMERICA) We think the terms "early" "mid" and "late" when preceding a century e.g., "early 21st century" are commonly understood to mean, respectively, the first third, middle-third, and latter-third of a century.
19 75137 26 0 0 0 0 The chapter should use either US or USA consistently (not switch back and forth between the two acronyms (UNITED STATES OF AMERICA)
We use "US"
20 75138 26 0 0 0 0 The coverage of adaptation as presented feels haphazard - it appears more a collection of randomly selected examples than as a methodologically representative sample of what is happening. Much action on adaptation is not represented in the peer review literature - due to both the nature of adaptation (often serendipitous/indirect and also too soon to evaluate) and because the academic literature prioritizes new and novel contributions to theory and many adaptations are simply more of the same in terms of improving environmental governance. The result is that drawing only from the peer-reviewed literature will overlook a large number of actions that are in progress and only represent those that academics have selected. (UNITED STATES OF AMERICA)
We have revised the sections on adaptation, particularly in the Urban/Rural seciton, 26.8, and the federal and state/provincial section, 26.9. We have cited a significant number of grey literature sources, particularly on urban, state/province, and federal adaptations.
21 75139 26 0 0 0 0 The Executive summary, water, ecosystems, and other sections report recently observed changes/trends, with the implication that those changes were due to climate change, but they do not state explicitly whether the changes/trends are attributed to climate change or what the trend has do with climate change. In addition, there is a lack of climate counterfactua: , in other words, how does reader know that the cited impacts or adaptation activities would not have occurred without climate change? There is language and protocol for this in the volume, but many sections of Chapter 26 do not address the counterfactual. (UNITED STATES OF AMERICA)
The water section on Observed Trends has been improved to clearly describe attribution where it exists. For ecosystems, the Executive Summary covers vulnerability to climate stressors. Detection and attribution of ecosystem impacts is covered in detail in the chapter text and D&A figure, and could not be incorporated into the ES due to space constraints.
22 75140 26 0 0 0 0 The phrase sustainability is used without definition. (UNITED STATES OF AMERICA) The term is defined in the Work Group II Glossary
23 75141 26 0 0 0 0 The references to adaptation-mitigation co-benefits are welcome, although the discussion is quite scant here (and in 26.8.4.3, which consists of only 4 sentences) (UNITED STATES OF AMERICA)
There is insufficient space in the chapter to fully address mitigation and adaptation, although it is addressed in some parts of the chapter

IPCC WGII AR5 Chapter 26 SECOND-ORDER DRAFT
Government and Expert Review Page 4 of 68 28 March - 24 May 2013
# ID ChFrom Page
From Line
To Page
To Line Comment Response
24 75142 26 0 0 0 0 The trans-boundary discussion is very welcome. Some treatment of the Canada-US dynamic would also be of value. Perhaps selecting the issue of electricity transfers (vulnerable to changes in hydroelectric power), or commerce in forest products would be a useful case study. (UNITED STATES OF AMERICA)
Unfortunately, we do not have sufficient space to add another box
25 75143 26 0 0 0 0 The two boxes in the chapter are a good idea, but they need to have a clear narrative structure and ideally should make points that could not be made without such a box (UNITED STATES OF AMERICA)
We have revised the boxes to improve the discussion
26 75144 26 0 0 0 0 There is extensive discussion of snow and snowpack, but no discussion of the loss of glacial mass. (UNITED STATES OF AMERICA)
We have carefully linked summary statements such as in the ES and in summary figures back to sections of the chapter
27 75145 26 0 0 0 0 There seem to be gaps in coverage between the Polar Chapter and the North America Chapter, where Native peoples are concerned, including fishing, sea ice impacts on coastal resources, hunting and gathering livelihoods, and other topics. (UNITED STATES OF AMERICA)
We are not covering polar areas within North America
28 75146 26 0 0 0 0 Throughout, the sections on adaptation focus on modern examples. These generally involve an attempt to respond to one problem, and lack sufficient time depth to determine if 1) the response was effective in solving the original problem, 2) if the response created additional problems in the near-term, 3) if the response was sustainable in the long term, and 4) if the response created path dependencies that created cascading problems worse than the original problem. There is a growing body of research on what might be called long-term human ecodynamics, primarily by archaeologists, environmental historians and paleoecologists, which is directed not only at understanding the past, but providing information which can be used to make choices that support a sustainable future and increase resilience in the face of environmental changes, fast or slow (Constanza, Graumlich, and Steffen 2007; Cooper and Sheets 2012; Crumley 1994; Dugmore et al. 2007; Fisher, Hill, and Feinman 2009; Hornberg, McNeill, and Martinez-Alier 2007; Kirch 1997, 2007; Kohler and van der Leeuw 2007; Marks 2007; McGovern et al 2007; Norberg et al. 2008; Redman et al. 2004; Rick and Erlandson 2008; Sabloff 1998). It would seem that this literature should be considered in the sections on adaptation, even if just to recommend that this approach be utilized in planning where at all possible. Recommended citiations are provided in a separate cell. (UNITED STATES OF AMERICA)
Unfortunately, there is insufficient space to address adaptation in such depth. This may be more appropriate for the chapters on adaptation.
29 75147 26 0 0 0 0 While Box 26.1 focuses on the US-Mexico border, there is a good story to be told about cross-border cooperation with respect to the US and Canada, as well - and perhaps this can be included as a new, separate box. While there are myriad concerns about hydropower, water quality and even water quantity (especially the Great Lakes Region), a treaty has been successfully negotiated between the two Parties to manage water rights and could serve as a model for other trans-boundary water (and other) resources. The Columbia River treaty (http://www.crt2014-2024review.gov) relates to trans-boundary water issues between the US and Canada and is a good example. (UNITED STATES OF AMERICA)
We added a section in the adaptation section of 26.3 on the Treaty, 26.3.4.
30 77322 26 0 0 0 0 The authors have answered and addressed my previous questions from the first round of review. (Maria Caffrey, National Park Service and University of Colorado, Boulder)
Thank you and we are glad to receive this comment

IPCC WGII AR5 Chapter 26 SECOND-ORDER DRAFT
Government and Expert Review Page 5 of 68 28 March - 24 May 2013
# ID ChFrom Page
From Line
To Page
To Line Comment Response
31 79780 26 0 0 0 0 I was surprized that chapter 18 had more thorough informatin than chapter 26 on risks to boreal and permafrost systems. It should especially be looked into whether warming of permafrost soils might lead to a major loss in carbon storage worldwide. There are warming experiments that have been performed in the arctic, this evidence is still shallow but it's something. At the very least it would be worth more elaboration on the lack of data available or potential risks. Allison S., and KK Treseder. (2008) Warming and drying suppress microbial activity and carbon cycling in boreal forest soils. Global Change Biology 14:2898-2909. DOI: 10.1111/j.1365-2486.2008.01716.x; http://www.eeescience.utoledo.edu/faculty/weintraub/csas.htm; Chapin, F. S. III, M. Sturm, M. C. Serreze, J. P. McFadden, J. R. Key, A. H. Lloyd, A. D. McGuire, T. S. Rupp, A. H. Lynch, J. P. Schimel, J. Beringer, W. L. Chapman, H. E. Epstein, E. S. Euskirchen, L. D. Hinzman, G. Jia, C. L. Ping, K. D. Tape, C. D. C. Thompson, D. A. Walker, and J. M. Welker. 2005. Role of Land-Surface Changes in Arctic Summer Warming. Science 310: 657-660. Schimel, J.P. and F.S. Chapin III. 2006. Microbial processes in the Alaskan boreal forest. In: Alaska's Changing Boreal Forest. Chapin, F.S. III, M.W. Oswood, K. van Cleve, L.A. Viereck, and D.L. Verbyla (Eds.) Oxford University Press. Pp. 227-240. Chapin, F.S. III, A.D. McGuire, R.W. Ruess, M.W. Walker, R. Boone, M. Edwards, B. Finney, L.D. Hinzman, J.B. Jones, G.P. Juday, E.S. Kasischke, K.Kielland, A.H. Lloyd, M.W. Oswood, C.-L. Ping, E. Rexstad, V. Romanovsky, J. Schimel, E. Sparrow, B. Sveinbjornsson, D.W. Valentine, K. Van Cleve, D.L. Verbyla, L.A. Viereck, R.A. Werner, T.L. Wurtz, and J. Yarie. 2006. Summary and synthesis: Past and future changes in the Alaskan boreal forest. In: Alaska's Changing Boreal Forest. Chapin, F.S. III, M.W. Oswood, K. van Cleve, L.A. Viereck, and D.L. Verbyla (Eds.) Oxford University Press. Pp. 332-338. Schimel, J.P., J. Fahnestock, G. Michaelson, C. Mikan, C.-L. Ping, V.E. Romanovsky, and J. Welker. 2006. Cold-season production of CO2 in Arctic soils: can laboratory and field estimates be reconciled through a simple modeling approach? Arctic, Antarctic, and Alpine Research. 38: 249-256. (Jessica Gutknecht, Helmholtz Centre for Environmental Research-UFZ)
The comment should be addressed by the ecosystems and Polar chapters. Due to space constraints, we are unable to address this topic in depth.
32 79781 26 0 0 0 0 Similar to my comment about permafrost systems, this chapter would be served very well by having a "soil quality" or "soil resources" section as was done for water resources- see Chapter 28 as a nice example for that. This could then combine ideas of ersosion, agricultural food productivity, changes in soil C stocks, and changes in boreal landscapes due to warming. As is stands now these issues are sort of scattered and never thoroughly addressed. (Jessica Gutknecht, Helmholtz Centre for Environmental Research-UFZ)
The agriculture section (26.5.4) has some discussion on soils
33 80951 26 0 0 0 0 Traceable account for ES findings need to be clear and easy to follow. At present sections provided with ES findings direct readers to a very broad section, it will be useful for readers if specific relevant sections are given here. Many ES findings do not have any traceable accounts. (Monalisa Chatterjee, IPCC WGII TSU)
We have addressed this.
34 83641 26 0 0 0 0 1) Overall -- The chapter team has developed a strong assessment in its 2nd-order draft. In the final draft, the chapter team is encouraged to continue its prioritization of compact and rigorous assessment, effective figures, and clear writing. (Katharine Mach, IPCC WGII TSU)
We focused much of our effort in the final draft on incorporated synthesizing figures.
35 83642 26 0 0 0 0 2) Coordination across Working Group II -- In developing the final draft of the chapter, the chapter team should continue to ensure coordinated assessment, both in the chapter text and at the level of key findings. As appropriate, cross-references to the sections of other chapters and/or their assessment findings should be used, reducing overlaps and harmonizing assessment. (Katharine Mach, IPCC WGII TSU)
We have increased cross-referencing to other chapters.
36 83643 26 0 0 0 0 3) Harmonization with the Working Group I contribution to the AR5 -- In developing the final draft, the chapter team should also ensure all cross references to the Working Group I contribution are updated, with discussion of climate, climate change, and climate extremes referencing the assessment findings in that volume. (Katharine Mach, IPCC WGII TSU)
We have referenced Work Group I as appropriate.
37 83644 26 0 0 0 0 4) Tightening the assessment and supporting a maximally rigorous executive summary -- In developing the final draft, the chapter team is encouraged to revise each section so that the core nuanced key findings emerge clearly from each section with full and traceable support. Revision geared towards highlighting the key findings will further support an executive summary that richly communicates the assessment. (Katharine Mach, IPCC WGII TSU)
We have improved the traceable links between the ES and the sections

IPCC WGII AR5 Chapter 26 SECOND-ORDER DRAFT
Government and Expert Review Page 6 of 68 28 March - 24 May 2013
# ID ChFrom Page
From Line
To Page
To Line Comment Response
38 83645 26 0 0 0 0 5) Characterization of future risks -- In characterizing future risks for North America, to the degree appropriate the chapter team should indicate the extent to which risks (or key risks) can be reduced through mitigation, adaptation, development, poverty reduction, etc. That is, is it possible to indicate how specific risks may increase as the level of climate change increases or, potentially, to indicate the relative importance of changes in mean conditions, as compared to changes in extreme events, as compared to potential non-linear changes associated with biome shifts or tipping points? And then, how much can risks be reduced through adaptation or development, in the near-term and long-term? How are factors or stressors that multiply risks relevant in this context? Complementing the summary provided already in 26.10.1, to what degree can the same type of information be provided for specific risks and specific adaptive responses? As supported by its assessment of the literature and as already framed in the sectoral assessment in 26.10.1, the author team should consider communicating specific risks for the era of climate responsibility (the next few decades, for which projected temperatures do not vary substantially across socioeconomic/climate scenarios) and for the era of climate options (the 2nd half of the 21st century and beyond). As might be helpful to the chapter, the framing of table SPM.4 could be considered in characterization of future risks, along with the key and emergent risk typology of chapter 19. The chapter 25 executive summary and table 25-8 may also be relevant. For example, the chapter team might consider presenting a table of specific risks for the region, as a further complement to 26.10.1, which provides great overall assessment summary for the region. (Katharine Mach, IPCC WGII TSU)
This is a difficult comment to address. Generally, the literature has limited assessments of the effectiveness of adaptations in reducing vulnerability. The exception to this is the agriculture literature and our assessment of future risks and these are addressed in Sections 26.5. and 26.10 respectively
39 83646 26 0 0 0 0 6) Informing the summary products -- To support robust and insightful summary products for the report, the chapter team is encouraged to maximize nuance and traceability in its key findings, continuing to use calibrated uncertainty language effectively. In addition to nuanced characterization of future risks (see the previous comment), the chapter team is encouraged to consider themes emerging across chapters, indicating for example how extreme events have demonstrated adaptation deficits and vulnerabilities to date and may relate to future risks, how limits to adaptation may be relevant in the context of this chapter, how multidimensional inequality is relevant in the context of climate change, how adaptation experience has been relevant to date, and how interactions among mitigation, adaptation, and sustainable development may occur. (Katharine Mach, IPCC WGII TSU)
We focused much of our effort in the final draft in revising the ES to better synthesize the chapter and develop figures 26-1 and 26-2 to better synthesize observations and vulnerabilities to extreme climate
40 83647 26 0 0 0 0 7) Report release -- The chapter team should be aware that the final drafts of the chapters will be posted publicly at the time of the SPM release, before final copyediting has occurred. Thus, the chapter team is encouraged to continue its careful attention to refined syntax and perfected referencing. (Katharine Mach, IPCC WGII TSU)
We have tried to do so, but time has been limited.
41 83648 26 0 0 0 0 8) "Observed impacts" in the chapter subheadings -- Where the chapter team refers to "observed impacts" within subheadings of the chapter, it often seems that the assessment is actually broader, looking at observed impacts and also trends, sensitivities, and vulnerabilities more broadly. The chapter team is encouraged to consider using a broader phrase within the chapter subheadings, such as "observed impacts and vulnerabilities." (Katharine Mach, IPCC WGII TSU)
Some sections such as 26.8 make this distinction explicit
42 83649 26 0 0 0 0 9) Specificity in characterization of observations and projections -- In most parts the chapter, the chapter team uses high specificity in characterizing examples. Continued attention to providing sufficient information to enable the reader to fully understand each example is encouraged. (Katharine Mach, IPCC WGII TSU)
We provided more examples and were as specif as the literature allowed us to be
43 84843 26 0 0 0 0 GENERAL COMMENTS: I congratulate the author team for all their work on an interesting and informative SOD. When considering the suite of review comments, please look for opportunities to continue to hone and focus the text in revision even further, reducing length where possible. Please see my detailed comments for suggestions related to specificity of ES findings and traceable accounts, refining figures and tables, and specific clarifications. In addition, where likelihood terms are used ("likely," "very likely," etc.), it is also not always clear whether they are intended as calibrated language or not--please carefully check this and avoid casual usage. (Michael Mastrandrea, IPCC WGII TSU)
We have tried to better synthesize the chapter, include more integrative figures and remove likelihood statements except where appropriate

IPCC WGII AR5 Chapter 26 SECOND-ORDER DRAFT
Government and Expert Review Page 7 of 68 28 March - 24 May 2013
# ID ChFrom Page
From Line
To Page
To Line Comment Response
44 84844 26 0 0 0 0 SUMMARY PRODUCTS: In preparing the final draft of your chapter and particularly your executive summary, please consider the ways in which your chapter material has been incorporated into the draft SPM and TS. For Chapter 26, this includes presentation of observed impacts and vulnerabilities in section A.i, adaptation experience in section A.ii, sectoral and regional risks in section C.i, and interactions between adaptation and mitigation in section D.ii, as well as related figures and tables. Are there opportunities for presenting chapter findings and material in a way that further supports broad themes highlighted in the summary products and that facilitates additional cross-chapter synthesis in specific findings or figures/tables? Do the existing summary product drafts suggest additional coordination that should occur between Chapter 26 and other chapters at LAM4? (Michael Mastrandrea, IPCC WGII TSU)
We have been providing line of sight and making sure our findings are incorporated in both TS and SPM
45 57000 26 1 1 1 1 The tile"North America" is hanging. Let the title capture the sprit of the underlying text in the entire document. In otherwords, the title always prepares the reader what he expects in the text of the document (KENYA)
The IPCC assigned the chapter title
46 80912 26 3 0 5 0 The ES is highly impactful. But it comes across very choppy as if one is reading a list of bullet points. One way to improve comprehension of the information would be to increase the structure and organization of the topics. The organization of topics in each paragraph appear arbitrary. (Rebecca R. Hernandez, Stanford University / Carnegie Institution for Science)
We have revised the ES to improve flow, and ensure more consistent treatment of each topic.
47 83650 26 3 24 0 0 Regional Key Risks in the Executive Summary -- The chapter team is strongly encouraged to present clearly the key regional risks for North America within the executive summary. For the key risks, how do they vary with level of climate change, and what is the potential for adaptation to reduce the risks? What are the risks in the near-term (which can be considered an era of climate responsibility) versus the long-term (which can be considered an era of climate options)? The framing of SPM table SPM.4 or the framing of chapter 25's executive summary and table 25-8 could be considered. Identifying key risks more specifically would enable the chapter team to maximize the nuance and traction of the executive summary. (Katharine Mach, IPCC WGII TSU)
We have added a key risks table to the ES to address this comment.
48 83651 26 3 24 0 0 Format of the Executive Summary -- For each paragraph, the chapter team should present 1st a key finding in bold font, followed by supporting non-bold sentences. (Katharine Mach, IPCC WGII TSU)
We have followed this format in the revised ES.
49 83652 26 3 24 0 0 Likelihood versus Confidence -- Wherever the chapter team presents likelihood terms with key findings, the authors should make sure that assignment of the likelihood term is supported by a probabilistic basis in the underlying evidence. Where assignment is not fully supported by assessment of probabilistic information, the chapter team should instead consider presenting a level of confidence. (Katharine Mach, IPCC WGII TSU)
We have edited out many of the likelihood comments and replaced them with confidence statements when not supported probabilistically.
50 83653 26 3 24 0 0 The Starting Point for each Conclusion -- The chapter team should carefully consider each finding in the executive summary, making sure that the starting point of each conclusion is clear. That is, is a given finding referring to sensitivity to weather (without asserting projections of future outcomes due to climate change), vulnerabilities to climate change, specific observed outcomes, specific projected outcomes, etc.? The executive summary will be much clearer if such nuance is fully communicated for each finding. (Katharine Mach, IPCC WGII TSU)
We have attempted to do so. Note we also revised the ES to make sure it captures the key points from each section.
51 83654 26 3 24 0 0 Conditionality of Conclusions -- In discussing future outcomes, the chapter team could be more explicit about what given conclusions are conditional on. That is, do expected outcomes hinge on potential evolutions of socio-economics, on trends in extreme events due to climate change, on changes in other stressors, etc.? How does the author team's degree of certainty about changes in drivers, impacts, and responses differ? (Katharine Mach, IPCC WGII TSU)
We tried to address this and introduce more nuanced statements
52 84845 26 3 24 0 0 Executive Summary: I would recommend further thought as to how the executive summary can most clearly communicate the findings of the chapter. The current draft contains good material, but I feel that the clarity and specificity of the presentation can be improved. For example, currently there is a mixture of statements about projected impacts and risks over specific timeframes and statements about impacts and risks associated with specific magnitudes of temperature increase. In section 26.2.2.2 (p. 11) there is discussion of how these framings relate (e.g., when North America is projected to reach specific magnitudes of climate change under different scenarios), but this is not clear in the context of the executive summary. Please consider ways to present projections consistently across the executive summary as a whole. And to the extent possible as supported by the literature, please emphasize what risks are projected to emerge over different time horizons (e.g., mid-century vs. end-of-century), as well as the potential or lack of potential for mitigation and adaptation to reduce them. In addition, there are a few cases where support in the chapter text is not clear. For example, please ensure clarity and support for the attribution statements that are presented here (see specific comments). (Michael Mastrandrea, IPCC WGII TSU)
We have revised the ES to make the findingss clearer. Where appropriate we have indicated when impacts may happen. Note the timing of impacts is partly a function of GHG emissions and climate sensitivity.
IPCC WGII AR5 Chapter 26 SECOND-ORDER DRAFT
Government and Expert Review Page 8 of 68 28 March - 24 May 2013
# ID ChFrom Page
From Line
To Page
To Line Comment Response
53 85236 26 3 24 3 36 No mention of the recent persitent cold winters. The tempoeratures are falling , not rising (Vincent Gray, Climate Consultant)
This finding is not supported by the literature, including the just publised Work Group I report
54 64354 26 3 24 5 23 While you are somewhat constrained by the fact that this a an Executive Summary rather than a statement of Key Findings, please consider the fact that these will be most used part of the chapter - many readers will never go deeper. It is very important to spend the time deciding what point is being made with each paragraph, and then assessing to see if that point is being made clearly. While individual statements need to be strong and clear, it would also be helpful for there to be an overarching narrative to the Executive that is evident to those who are not reading the chapter. Simply using the phrase (For example" would help demonstrate that you are not providing comprehensive summaries. There is no sense of flow to the current Executive Summary, and no hint as to the criteria used to decide what findings warrant elevating to this level. (Don Lemmen, Canada National Study)
We have re-organized and edited the ES to create a greater sense of narrative.
55 64355 26 3 26 0 0 First sentence would be more accurate if it referred to "changes in climate" rather than "changes in climate trends". (Don Lemmen, Canada National Study)
This has been fixed.
56 77070 26 3 26 3 26 "Changes in climate trends" is redundant here - it should either be "changes in climate" or "climate trends" (Sean Fleming, Meteorological Service of Canada)
This has been fixed.
57 75148 26 3 26 3 28 To be clearer, begin sentence with the word "Observed". (UNITED STATES OF AMERICA) Edited as suggested.
58 84846 26 3 26 3 28 Please clarify the these are observed changes, as this is not immediately clear from the framing here. (Michael Mastrandrea, IPCC WGII TSU)
This has been clarified.
59 71421 26 3 28 0 0 "highly likely" is not one of the accepted terms in the IPCC guidance note on uncertainty. Do the authors mean "very likely"? (CANADA)
This has been fixed.
60 75149 26 3 28 3 0 This is the first time the terms for uncertainty are used. Suggest the the authors refer the reader to the glossary or other souce of definition. (UNITED STATES OF AMERICA)
This has been noted.
61 83655 26 3 28 3 28 In place of "highly likely" the chapter team should choose one of the likelihood terms defined in the guidance for authors. Perhaps "very likely" is meant? (Katharine Mach, IPCC WGII TSU)
This has been edited.
62 84847 26 3 28 3 28 Please clarify what calibrated uncertainty term is meant here, instead of "highly likely." (Michael Mastrandrea, IPCC WGII TSU)
This has been edited.
63 57932 26 3 28 3 36 “… global average increase in temperature of at least 2 degree C ..”. Some rewording of this line is needed. Because, at present this line conveys that until 2 degree C increase in global temperature, things are fine in North America. During 20th century we have experienced 0.8 degree C warming, i.e., we can keep pumping more greenhouse gasses in the atmosphere until 2 degree C warming is reached. “ … global warming of approximately 4 degree C …”: same comments as given above. (Sanjiv Kumar, Center for Ocean-Land-Atmosphere Studies)
The paragraph on future projections has been extensively re-worked. It now discusses trends in the near-term and in the long-term (2 and 4 degree worlds).
64 75150 26 3 30 3 30 The word "frequent" is ambiguous. If the point is that the frequency will increase, then please clarify the statement accordingly. (UNITED STATES OF AMERICA)
This has been edited.
65 83658 26 3 30 3 38 In discussing attribution here and throughout the chapter, very careful attention should be paid to assignment of the cause. That is, attribution to anthropogenic climate change is asserted here, but in many cases within this chapter and across the working group 2 report, attribution is only made to climate change. (Katharine Mach, IPCC WGII TSU)
This is a good point, and we have tried to be clear about causal relationships.
66 83656 26 3 31 3 36 It may be clearest to merge this material into a single paragraph. (Katharine Mach, IPCC WGII TSU) This has been done.
67 64356 26 3 35 3 36 While factually correct you need to consider how these statements will be used. This is the only place in the Executive Summary where a warming of 4C is addressed and the conclusion is that "some places will get wetter and some get drier"??? Need to decide if this bullet is about precipitation patterns, in which case it should be expressed that way, or is it about a 4C scenario, in which case it needs to be much stronger and more nuanced. (Don Lemmen, Canada National Study)
This has been clarified and more extensive text has been added regarding the 4 C future.
68 75151 26 3 35 3 36 Can this statement be augmented to address the expected changes in extremes (rather than averages as currently formulated)? (UNITED STATES OF AMERICA)
The sentence has been edited to include extremes.
69 83657 26 3 35 3 36 Specific line-of-sight references to the supporting chapter section should be provided for this statement in order to indicate its traceable account. (Katharine Mach, IPCC WGII TSU)
This has been added
70 84848 26 3 35 3 36 Currently, this statement seems to imply that changes in annual precipitation will only occur for warming of 4C, and what happens for other levels of warming is unclear. Can more be said here (e.g., based on 26.2.2.2)? Also, are the changes mentioned in the previous paragraph associated with 2C warming also relevant for 4C? Right now this is also unclear. Please specify line of sight here as well. (Michael Mastrandrea, IPCC WGII TSU)
This has been addressed in the re-write.

IPCC WGII AR5 Chapter 26 SECOND-ORDER DRAFT
Government and Expert Review Page 9 of 68 28 March - 24 May 2013
# ID ChFrom Page
From Line
To Page
To Line Comment Response
71 84849 26 3 38 3 41 Please provide clear support and line of sight for this statement, ensuring that the chapter text explains the basis for attribution to anthropogenic climate change. The basis for attribution is not clear in all of these cases in the current draft. In addition, please ensure clear distinctions between climate change and anthropogenic climate change here and in relevant discussions in the chapter text. (Michael Mastrandrea, IPCC WGII TSU)
We have created a figure on detection and attribution which differentiates between impacts that can be attributed to climate change and those that cannot. In addition, we have revised the statement and are not attributing some of the impacts mentioned in the SOD to climate change. We also put in a line of site for each impact to relevant chapter sections.
72 83659 26 3 39 3 40 For these impacts named, the geographic and temporal extent of impacts that have been attributed to anthropogenic climate change or to climate change should be clarified. (Katharine Mach, IPCC WGII TSU)
There was only sufficient space in the Executive Summary to make general statements
73 62792 26 3 39 3 41 forest dieback and pest outbreaks have ben associated with warming that promoted drought stress and more directly insect population explosion but ALSO with forest condition (even age, high density, monospecific) so the very high confidence in the attribution of this category to anthropogenic climate change may be an overstatement. Many managers blame fire suppression more than changes in climate conditions. (Dominique Bachelet, Conservation Biology Institute)
We have incorporated in mention of these other effects into the Wildfires box, as well as general coverage in the Ecosystems Overview section.
74 64357 26 3 43 3 44 How is increased salinity of coastal water supplies an impact of climate variability? It is certainly strongly affected by other anthropogenic drivers (withdrawls), but its linkage to climate variability, if any, is far less obvious than for floods and drought. (Don Lemmen, Canada National Study)
This paragraph has been revised and we think have addressed the comment in the revision
75 83660 26 3 43 3 45 This finding could be clarified. Are the anthropogenic drivers referred to factors other than climate change? Is a role of climate change being asserted at all in this statement? If not, it is definitely fine to make an assertion about the impacts of climate variability and extremes, but clarity should be ensured. Also, over what time frame have the described impacts been observed? (Katharine Mach, IPCC WGII TSU)
References to increased salinity have been removed in new draft
76 84850 26 3 43 3 45 This statement is not clearly supported in the specified chapter text. Please provide clear line of sight. (Michael Mastrandrea, IPCC WGII TSU)
We have revised the statement
77 80952 26 3 43 3 47 It may be useful to mention some of the hard and soft approaches that seem to work for water supply deficits issues. (Monalisa Chatterjee, IPCC WGII TSU)
We have revised the statement
78 62793 26 3 44 3 45 if these are observed why is there a confidence level and there needs to be one, why isn't it the highest possible (Dominique Bachelet, Conservation Biology Institute)
Confidence levels are appropriate for observations
79 83661 26 3 45 3 46 It would be preferable to indicate more specifically what types of "hard and soft approaches" are currently available. (Katharine Mach, IPCC WGII TSU)
Statement has been revised to remove discussion of hard and soft
80 75152 26 3 46 3 47 Please provide evidence or reconsider the assertion that adaptive responses to flooding and water quality concerns are more limited than adaptive responses to water quantity. In+C10 the Adaptation section of section 26.3, several adaptation responses to changes in flooding are mentioned (e.g., larger culverts, adjusting coastal flood control systems, storm water control during more intense storms, etc.). See also the cross-chapter Box CC-EA which discusses Ecosystem-Based Adaptation and provides an example of how natural vegetation systems can provide flood regulation services (among other water-related ecosystem services) in light of climate change. (UNITED STATES OF AMERICA)
Statement has been rewritten
81 83662 26 3 47 3 47 If not fully supported by a probabilistic basis in the underlying evidence, a level of confidence would be preferable. (Katharine Mach, IPCC WGII TSU)
Statement has been rewritten
82 83663 26 3 47 3 52 To what extent are these changes due to climate change (and how would they differ across scenarios of climate change) as compared to changes in exposure and vulnerability? (Katharine Mach, IPCC WGII TSU)
Statement has been rewritten
83 84851 26 3 47 3 52 In line with my previous comments, how do these impacts projected for the 21st century intersect with the impacts associated with 2C and 4C increase earlier in the executive summary? (Michael Mastrandrea, IPCC WGII TSU)
the sentence has been revised
84 84852 26 3 48 3 48 The specified chapter text does not discuss droughts in this context--please provide clear line of sight. (Michael Mastrandrea, IPCC WGII TSU)
The ES has been revised and this statement no longer appears.
85 57933 26 3 48 3 49 Some recent studies have questioned drought and climate change linkages (e.g. Sheffield et al. 2012). Have you considered these studies while making this conclusions. Reference: Sheffield, J., E.F. Wood, and M. L. Roderick (2012), Little change in global drought over the past 60 years, Nature, doi:10.1038/nature11575. (Sanjiv Kumar, Center for Ocean-Land-Atmosphere Studies)
the ES has been revised.

IPCC WGII AR5 Chapter 26 SECOND-ORDER DRAFT
Government and Expert Review Page 10 of 68 28 March - 24 May 2013
# ID ChFrom Page
From Line
To Page
To Line Comment Response
86 75153 26 3 50 3 52 The sentence is confusing as written. Does the "except for" indicate that the following areas are expected to experience increased water supplies? If not, please clarify. (UNITED STATES OF AMERICA)
The ES has been rewritten
87 84853 26 3 50 3 52 Would it be clearer to specify the areas where this is projected to occur, rather than the areas where it is not? (Michael Mastrandrea, IPCC WGII TSU)
The ES has been revised to show which areas are projected to not be adversely affected. Other areas would be adversely affected.
88 71422 26 3 51 0 0 Why is "southern Mexico" italicized? (CANADA) Corrected
89 77071 26 3 52 3 52 "...west and east Canada..." Sorry, but this is vague to the point of being useless. Canada is a big country (by area, anyway) with many climates; please be more specific. (Sean Fleming, Meteorological Service of Canada)
Statement on regional differentiation of impacts has been revised to be clearer
90 84854 26 4 1 4 2 A 2C increase is not mentioned explicitly in 26.4. Please include explanation of this aspect of the finding in the chapter text. (Michael Mastrandrea, IPCC WGII TSU)
This has been removed from the ES.
91 83664 26 4 1 4 5 The 1st sentence of this paragraph implies that climate change is affecting many ecosystems with high confidence in attribution. It may be preferable to indicate more specifically the types of impacts that have been observed for ecosystems, even at the summary statement level, also with acknowledgment of the relative importance of other factors affecting ecosystems. (Katharine Mach, IPCC WGII TSU)
This sentence has been entirely replaced.
92 83665 26 4 2 4 2 It would be preferable to indicate more specifically what is meant by "widespread adverse impacts." (Katharine Mach, IPCC WGII TSU)
The phrase has been removed from the ES
93 64358 26 4 2 4 5 This paragraph could be more nuanced to focus on the commonalities rather than simply stating facts. Forests, like coasts, are affected by multiple and often interacting climate (and non-climate stresses). The reader will wonder why there is no reference to other ecosystems previously assessed as being sensitive (e.g. alpine, grasslands). (Don Lemmen, Canada National Study)
We have attempted to do this in re-writing the paragraph.
94 83666 26 4 2 4 5 How big has the role of climate change been compared to other factors? Over what time frame have observed impacts that can be attributed to climate change been observed? (Katharine Mach, IPCC WGII TSU)
There is insufficient space in the ES to address this.
95 77072 26 4 3 4 3 Change "other climate-related stresses" to "other climate-influenced stresses", because forest management practices have a lot to do with forest pests & fires. (Sean Fleming, Meteorological Service of Canada)
Change made.
96 75154 26 4 4 4 4 Consider adding increased sediment load from runoff in this list. (UNITED STATES OF AMERICA) Has been added
97 75155 26 4 4 4 5 This sentence would make more sense if were written as "_ocean acidification, coral reef bleaching, sea level rise, storms, and storm surges." (UNITED STATES OF AMERICA)
Sentence re-written.
98 75156 26 4 5 4 5 The text in section 26.4 does not address the potential effects of climate change stresses on biodiversity and ecosystem services so it is not clear what the evidence is for the sentence "Climate stresses will likely reduce biodiversity and ecosystem services". WGII Chapter 4 does indicate that "There is very high confidence that projected climate changes imply increased extinction risk for a substantial fraction of species during and beyond the 21st Century, especially as climate change interacts with other pressures" and indicates other types of effects on biodiversity (e.g., species range shifts and altered species interactions) and ecosystem services (e.g., carbon storage). We recommend that this sentence either be removed from Chapter 26 since the text does not really address the topic, or that appropriate sections of Chapter 4 are cited to support this statement (and the language clarified in terms of "likely" vs. "very high confidence"). (UNITED STATES OF AMERICA)
This sentence has been removed from the ES.
99 80911 26 4 5 4 5 Is the term 'environmental services' more appropriate? I have seen this term used in place of 'ecosystem services' increasing in the literature. (Rebecca R. Hernandez, Stanford University / Carnegie Institution for Science)
This sentence has been removed.
100 83667 26 4 7 4 8 It would be preferable to specify the levels/scenarios of climate change to which this statement applies. Additionally, what "projected changes" are meant--for what types of extremes? What does "notable" mean? (Katharine Mach, IPCC WGII TSU)
Sentence now indicates that projected rates of decline vary by model and scenario; projected changes now specified; "notable' has been removed.
101 75157 26 4 7 4 11 Is the first confidence estimate of "very high" internally consistent with the very closely related second (lower) one of "medium", given that the statement includes any adjustment for potential adaptation? (UNITED STATES OF AMERICA)
The sentence now accounts for variation in rate of decline projections by model, but the consistency across studies that yields will indeed experience a net decline (rather than increase) warrants very high confidence statement.

IPCC WGII AR5 Chapter 26 SECOND-ORDER DRAFT
Government and Expert Review Page 11 of 68 28 March - 24 May 2013
# ID ChFrom Page
From Line
To Page
To Line Comment Response
102 64359 26 4 7 4 13 Several questions on this paragraph. Does the "very high confidence" apply regardless of climate change scenario considered? What does "without adaptation" means in the context of the agriculture sector, which is continuously adapting under business as usual? If this is simply a statement that "you won't be able to grow the same amount of the same thing in the same place" , it does not warrant elevation to the Executive Summary. The statement regarding "substantial investments in adaptation" is not supported by Section 26.5. If this represents additional analysis, what does "substantial" mean? Clarity around "institutional support mechanisms" is needed. The only examples provided in text are credit and insurance. Is this an issue outside of Mexico?? (Don Lemmen, Canada National Study)
See above regarding very high confidence statement; sentence now clarified to indicate that the projections being considered here did not account for adaptation (which is the case for the majority of projections conducted to date, see Ch 7.)
103 69787 26 4 7 4 13 Without adaptation should be specified, because a certain level of adaptation is always present. Farmers can and will adjust planting dates, irrigation schemes and crop varieties, or even crops to prevent a decrease of farm income due to climate change. (see also Ch26 p21 L10, Table 4 in SMP and TS p41-42) (NETHERLANDS)
This has been specified.
104 77073 26 4 7 4 13 Just a bit of clarification is in order here, even for a brief summary. Farmers switch out their crops all the time, depending on what is most economic etc. Climate change will no doubt reduce the productivity of some crops, but won't it often open up new opportunities from an agricultural perspective as well? Please explain, as this is an obvious question that many readers may have. (Sean Fleming, Meteorological Service of Canada)
Senctence now indicates "net" decline," and acknowledges that some regions may benefit.
105 84855 26 4 7 4 13 In line with my previous comments, how do these impacts projected for the 21st century intersect with the impacts associated with 2C and 4C increase earlier in the executive summary? (Michael Mastrandrea, IPCC WGII TSU)
We have attempted to incorporate changes in climate variables and key risks in 2 and 4C in the first paragraph, as well as highlighting the time-period when certain impacts may emerge in various sector points where covered.
106 83668 26 4 10 4 10 Casual usage of "likely" should be avoided, as it is a reserved likelihood term. (Katharine Mach, IPCC WGII TSU) Removed
107 69788 26 4 11 4 11 “there will likely be a negative effect on global food security”. This formulation is biased and not supported. The effect of a change (or decrease) of food production in North America on global food security is complex. Theoretically a decrease of food production in North America could even have a positive impact on global food security, e.g. if it would stimulate food production and self suffiency in other regions. (NETHERLANDS)
Sentence has been revised.
108 83669 26 4 11 4 11 Is it possible to describe more specifically what types of adaptive responses are meant here? (Katharine Mach, IPCC WGII TSU)
Sentence has been revised,and readers directed to section of chapter that describes specific options in detail.
109 64360 26 4 15 0 0 Replace "heat extremes" with "extreme heat events" to be capture the concept of cumulative impacts. (Don Lemmen, Canada National Study)
Has been edited
110 71423 26 4 15 0 0 Why is "health impacts" italicized? (CANADA) Italics have been removed
111 83670 26 4 15 4 15 Is this a statement primarily about current vulnerability to extremes? It could be helpful to present within the bold finding more information on what such vulnerabilities reveal about current adaptation deficits. Also, it would be preferable to avoid italics of "health impacts." (Katharine Mach, IPCC WGII TSU)
Adaptation is addressed elsewhere. Italics have been removed.
112 83671 26 4 15 4 16 For the described increases in mortality and morbidity, are they a result of trends in vulnerability and exposure, or is there a rigorous attribution of increased impacts to climate change? (Katharine Mach, IPCC WGII TSU)
Has been clarified
113 75158 26 4 15 4 23 Many other health effects are not addressed, notably respiratory and cardiopulmonary considerations due to increased pollen, reduced air quality, and vector-borne diseases (which are discussed at length in the body of the chapter). (UNITED STATES OF AMERICA)
These have now been noted.
114 80854 26 4 15 4 23 It is vital to also include climate change impacts on water quality as another important concern to human health. (Fabiola S. Sosa-Rodriguez, University of Waterloo)
This has been added.
115 80853 26 4 16 4 16 “….that vary by age, (I would include by location) and socioeconomic factors. (Fabiola S. Sosa-Rodriguez, University of Waterloo)
This has been added.
116 62794 26 4 16 4 17 same comment as above: why level of confidence for observations? (Dominique Bachelet, Conservation Biology Institute) We have been using confidence statements about both observed and projected changes throughout our chapter.
117 83672 26 4 17 4 18 It would be preferable to briefly indicate what is meant by "direct and indirect pathways." (Katharine Mach, IPCC WGII TSU) This phrase has been omitted. It is not critical to the main point of the sentence.

IPCC WGII AR5 Chapter 26 SECOND-ORDER DRAFT
Government and Expert Review Page 12 of 68 28 March - 24 May 2013
# ID ChFrom Page
From Line
To Page
To Line Comment Response
118 83673 26 4 20 4 20 What types of adaptive responses are relevant here, both where "pace of adaptation" and "current levels of adaptation" are mentioned? (Katharine Mach, IPCC WGII TSU)
Some examples have been inserted parenthetically
119 83674 26 4 20 4 21 Is it possible to provide more information on areas particularly affected? Additionally, a level of confidence may be more appropriate than a likelihood term here. (Katharine Mach, IPCC WGII TSU)
This has been edited
120 84856 26 4 21 4 23 This last statement of the paragraph does not appear in section 26.6. Please provide line of sight. (Michael Mastrandrea, IPCC WGII TSU)
The statement has been removed
121 83675 26 4 22 4 22 Casual usage of "likely" should be avoided, as it is a reserved likelihood term. Also, is it possible to indicate more specifically the human health risks meant here? (Katharine Mach, IPCC WGII TSU)
Has been edited
122 64361 26 4 22 4 23 Final phrase - "there are likely to be continued human health risks in the absence of specific adaptation planning" - is misleading because there will ALWAYS be human health risks associated with storms. It is very important for the readers to understand that the objective of adaptation is to reduce negative impacts, not eliminate them. (Don Lemmen, Canada National Study)
Has been edited
123 83676 26 4 25 4 25 What kinds of social and economic impacts are meant here? (Katharine Mach, IPCC WGII TSU) Statement has been rewritten and specific impacts are mentioned in the paragraph.
124 84857 26 4 25 4 25 Please specify what impacts are meant here. (Michael Mastrandrea, IPCC WGII TSU) Statement has been rewritten and specific impacts are mentioned in the paragraph.
125 64362 26 4 25 4 26 With respect, this bold statement is so obvious it does not warrant inclusion. With the phrase "climate-related processes" basically says that weather has social and economic affects in communities. No one would argue against that. If the phrase "to climate-related processes" were revised to read "to climate change", the statement becomes relevant and significant. However it is not clear that the literature supports attributing "several" social and economic impacts to climate change. (Don Lemmen, Canada National Study)
We think this is relevant because these impacts point out vulnerability to climate. If there is vulnerability to observed climate, there can be vulneraiblity to climate change.
126 83677 26 4 25 4 28 Throughout this paragraph, it would be helpful to be clear about the role of climate change versus vulnerabilities to hazards for which a role of climate change is not being asserted. (Katharine Mach, IPCC WGII TSU)
This is addressed in the revision.
127 75159 26 4 26 4 26 This statement is confusing. The bold text says 'different degrees of uncertainty' while the italicized confidence language says '(high confidence)'. How is this possible? (UNITED STATES OF AMERICA)
Sentence has been rewritten, but confidence levels apply to the statements about certainty.
128 77074 26 4 26 4 26 I think the author might have meant to say, "climate change-related processes", instead of simply "climate-related processes" (Sean Fleming, Meteorological Service of Canada)
We are referring to some climate events and in some cases climate change. We distinguish between the two in the revision.
129 84858 26 4 26 4 28 Here and elsewhere, please clearly differentiate between climate change, climate variability and extremes, and their interactions. This list currently mixes them. (Michael Mastrandrea, IPCC WGII TSU)
We have attempted to do so in the revision.
130 83678 26 4 30 4 31 Is it possible to provide any further information on the types of impacts meant here and the ways in which they are context specific? (Katharine Mach, IPCC WGII TSU)
yes and we have attempted to do so in the chapter. Space in the ES is too limited to address there.
131 64363 26 4 30 4 38 The first two sentences of this paragraph don't say anything of value. The third sentence is useful, but readers will wonder why the term "risks" is used for urban setting and "vulnerability" for rural. While indigenous people are certainly highly vulnerable, this relates to many factors in addition to their "unique history and ties to the land", including lower levels of education, training and income, and greater reliance on a subsistence economy. With respect to profiling Mexico City, again there is no question of its high vulnerability, but the chapter does not present analysis to allow comparison with other vulnerable cities (e.g. New Orleans). (Don Lemmen, Canada National Study)
We have revised the discussion to be more specific about the different causes of vulnerability and to differentiat for example, between vulnerabilities to urban areas and vulnerabilities faced by indigenous communitiess. There is a box comparing adaptation in 3 North American cities.
132 80855 26 4 30 4 38 In addition to indigenous groups, another vulnerable group is poor people settle in risk areas illegally. This is a more common problem in Mexico than in the rest of North America. (Fabiola S. Sosa-Rodriguez, University of Waterloo)
We have elaborated on indigenous groups and feel that this is the most important group to highlight across all three countries.
133 83679 26 4 30 4 38 Throughout this paragraph, the chapter team should explore opportunities to make more nuanced and rich statements. (Katharine Mach, IPCC WGII TSU)
We have attempted to do this in responding to reviewer comments above and below.
134 83680 26 4 31 4 32 Where processes and stresses are mentioned, it would be preferable to indicate which, more specifically, are meant. (Katharine Mach, IPCC WGII TSU)
We have attempted to be more precise on causes in the revised ES.
135 83681 26 4 36 4 36 It would be preferable to remove the bold font for this statement. Also, what are the geographic areas relevant to the described indigenous peoples? (Katharine Mach, IPCC WGII TSU)
Font removed.

IPCC WGII AR5 Chapter 26 SECOND-ORDER DRAFT
Government and Expert Review Page 13 of 68 28 March - 24 May 2013
# ID ChFrom Page
From Line
To Page
To Line Comment Response
136 80517 26 4 36 4 38 suggeted change: Among the most vulnerable are indigenous peoples due "to their complex relationship with land their ancestral lands, the wide variablity in migratory patterns, and their range of adpative capacity given their highly diverse human settlemt patterns. " (Gentry Blake, Institution no 1: Gente de Iitoi A.C., non-profit in Mexico. Dir. of Health Services.)
We mention vulnerability of indigenous people in the revised ES.
137 80518 26 4 36 4 38 The suggested change is based on the analysis in the the attached supporting document : Indigenous Health Impacts from Climate Change expert reviewer Blake Gentry. See section: III. A Strategies for Adaptation Planning with Indigenous Communities , pages See pages 1-2, 5-8. (Gentry Blake, Institution no 1: Gente de Iitoi A.C., non-profit in Mexico. Dir. of Health Services.)
The actual suggested change is in Comment 136. The suggested change was simply too long, so I took what I thought were the most elemental pieces and did not adopt the rest.
138 84859 26 4 36 4 38 Please be more specific as to the sources of vulnerability mentioned here. (Michael Mastrandrea, IPCC WGII TSU) We really do not have space in the Executive Summary for details, which is why we direct readers tot he relevant sections, where such detail is provided.
139 83682 26 4 37 4 37 It would be preferable to indicate more specifically which socioeconomic and environmental sources of probability are meant. (Katharine Mach, IPCC WGII TSU)
Same comment as above. It is my understanding that ES's are not the place for detail.
140 75160 26 4 37 4 38 It is not clear why Mexico City is the only location to be called out as having the most significant vulnerability to climate change due to population density combined with socio-economic and environmental sources of vulnerability. Is this the only urban region or urban population in North America with this situation? (UNITED STATES OF AMERICA)
The revised ES no longer mentions specific cities.
141 83683 26 4 40 4 40 It would be preferable to specify what types of infrastructural elements are meant here. (Katharine Mach, IPCC WGII TSU) The ES identifies water resources and transportation infrastructure as being particularly vulnerable.
142 80856 26 4 40 4 44 In Mexico, infrastructure has not received maintenance and has not been updated during the last decades. (Fabiola S. Sosa-Rodriguez, University of Waterloo)
We believe that stating that "Infrastructure are in many cases deteriorating…" captures this well. - Mexico is now mentioned.
143 64364 26 4 42 0 0 Recognizing that the entire volume will be edited, please use the word "infrastructure" to refer to both the singular and plural in the next draft, and leave it to the editors to decide whether the "s" is to be used throughout. (Don Lemmen, Canada National Study)
Change made
144 75161 26 4 42 4 42 The electricity grid is also vulnerable and deteriorating, which deserves mention. Note treatment of this in the 2nd US National Climate Assessment, where data were provided on increases in observed power outages. (UNITED STATES OF AMERICA)
Vulnerabilities to the energy sector are discussed in the chapter. The ES focuses on transporation and water because these two sectors have received significant attention in the literature
145 83684 26 4 42 4 42 Is it possible to indicate more specifically the locations and types of water- and transport-related infrastructure meant here? (Katharine Mach, IPCC WGII TSU)
That is discussed in the chapter, but there is insufficient space to address geographic details in the ES.
146 80953 26 4 42 4 44 The unbold sentences supporting the key findings need to explain the ways in which infrasructures are deteriorating are worse of than the strengthened ones. (Monalisa Chatterjee, IPCC WGII TSU)
There is insufficient space to address this.
147 64365 26 4 44 0 0 I have strong concerns about the last sentence as it downplays the significance of risk to infrastructure in Canada and the US. If risks are greatest in Mexico that is because it currently has the greatest infrastructure deficit. But this chapter should be trying to highlight issues of shared concerns, and the fact that risks to infrastructure are one of the, if not the, issue of greatest concern in all three should be the take home point from this paragraph. (Don Lemmen, Canada National Study)
We attempt to identify risks to infrastructure across North America, but also identify sectors and countries where we think the literature shows that risk is highest.
148 83685 26 4 46 4 47 Is this statement being asserted independent of climate change? Is it possible to specify the timeframe meant? Is it possible to provide more nuance and richness in the conclusion? (Katharine Mach, IPCC WGII TSU)
The ES discussion on economic impacts is longer and we hope more nuanced.
149 64740 26 4 46 4 50 Instead of 'proactive adaptation anticipating future climate impacts' should read ''proactive adaptation anticipating future climate change impacts' since in North America there has been significant public and private sector investments in the form of storm sewers, levees, dams, habitat restoration, and shoreline stablization to adapt to the impacts of hurricanes, floods and intense rainfall. (Robert Webb, NOAA OAR ESRL)
The ES discussion on adaptation has been rewritten.
150 80954 26 4 46 4 50 This finding requires more information on observed losses, etc., before moving on to adaptation issues. (Monalisa Chatterjee, IPCC WGII TSU)
There is insufficient space to address this in the ES.

IPCC WGII AR5 Chapter 26 SECOND-ORDER DRAFT
Government and Expert Review Page 14 of 68 28 March - 24 May 2013
# ID ChFrom Page
From Line
To Page
To Line Comment Response
151 69789 26 4 47 4 49 This states that there are a few examples of 'infrastructure that have begun proactive adaptation to climate change', but this is not found in the body of the chapter. In fact, on Chapter 26 page 26 line 48, refering to infrastructures it states that "only an emerging consideration of proactive adaptation in anticipation of future global warming" suggests that proactive adaptation has not begun, and is only beginning to be considered. (NETHERLANDS)
The sentence in the ES has been revised, but the statement is still being made. The chapter does give some examples of proactive adaptation in infrastructure
152 64366 26 4 52 4 53 The recognition of the strongly inter-connected nature of the North American economy and the vulnerability of supply chains is extremely important, however it is not captured will by the phrase "dislocation in one sector"> Revise that phrase and add a supporting sentence or two after the bolded statement. (Don Lemmen, Canada National Study)
There is insufficient space to respond in the ES, but we believe sectiont 26.7 supports this statement
153 83686 26 4 52 4 53 Is a role of climate change being asserted in this statement? The intended meaning of the statement may not be fully clear. What type of dislocation is meant? How should the pairing of "emerging concern," "may," and "medium confidence" be interpreted? Is this an emerging risk in the sense of emerging risks in chapter 19? (Katharine Mach, IPCC WGII TSU)
No page and line #'s are given
154 84860 26 4 52 4 53 Please flesh out this finding and be specific as to the relevance of climate change to this issues. Please also provide clear support in the chapter text. (Michael Mastrandrea, IPCC WGII TSU)
We think this is a reasonable statement about current risks, which we believe implies that the risks could be exacerbated by climate change
155 64367 26 5 1 0 0 Change "melt" to "thaw". Permafrost refers to a thermal state that is independent of the presence of ice. Ice melts, permafrost (and chicken) thaws. Should drought be considered a slow-onset event? And if so, it is very different sea level rise and permafrost degradation. In Canada we prefer to consider drought an extreme event (even though it may last for several years) rather than a slow-onset event. (Don Lemmen, Canada National Study)
Change made
156 63170 26 5 1 5 1 Use the term "permafrost thaw" instead of "permafrost melt" which is incorrect terminology. Note that it is only the ice in the frozen ground (permafrost) that melts, not the soil or rock. (Sharon Smith, Geological Survey of Canada)
Change made
157 64368 26 5 2 5 3 While there is likely more literature about adaptation to extreme weather events, I don't feel it's accurate to say that there is little published literature about impacts and adaptation experience to either sea level rise or permafrost thaw. Much of that information is contained in government or consultants reports, but is also being increasing shared through case studies (e.g. Richardson 2010) or on-line communities of practice. (Don Lemmen, Canada National Study)
Text removed
158 75162 26 5 5 5 5 Various" may be a better first word for this sentence than "Different". (UNITED STATES OF AMERICA) This sentence has been removed.
159 64369 26 5 5 5 9 This paragraph seems to suggest that local adaptation is not a government response. There are multiple orders of government in all three countries of concern. Perhaps the final sentence is supposed to refer to "national" government responses? Given the first sentence of the paragraph there should also be reference to adaptation in the private sector. Readers should not be left with the impression that adaptation is strictly a task for governments. (Don Lemmen, Canada National Study)
We revised the statement to state that adaptation is happening at all levels of gov't, but is most evident at the local level.
160 83687 26 5 5 5 13 It would be preferable to structure these paragraphs to each start with a full sentence in bold presenting the core conclusion, followed by non-bold supporting statements. (Katharine Mach, IPCC WGII TSU)
We have changed all ES paragraphs to be structured in this way.
161 64370 26 5 11 5 13 Try to find an alternative phrase to "path dependency". Also strongly question the inclusion of top-down decision-making as a barrier to effective adaptation. Most people would consider the UK to be among the leaders of OECD countries with respect to adaptation, and almost all will point to top-down decision making in terms of the UK Climate Change Act as a key enabler. Obviously community ownership and action is imperative for effective action, but to suggest that adaptation can be addressed through bottom-up decision-making alone is likely incorrect. (Don Lemmen, Canada National Study)
We have removed path-dependancy from the ES. To address this excellent comment regarding decision-making, we have both clarified and broadened the potential barrier to read "inefficiencies in governance" which could occur at any level of governance or decision-making. -
162 80857 26 5 11 5 13 Define if those are barriers or constraints. In other chapters of the AR5, these examples are defined as constraints. (Fabiola S. Sosa-Rodriguez, University of Waterloo)
The literature refers to these as barriers, and the SPM as limits
163 80913 26 5 11 5 13 The term 'path dependency' is not intuitive in this list of barriers to adaptation. Would it be possible to explain this term parathetically? It would make this statement more accessible to the layperson. (Rebecca R. Hernandez, Stanford University / Carnegie Institution for Science)
We have removed the jargon of path-dependancy from the ES and focused on more clear and intuitive barriers. -
164 80955 26 5 11 5 13 The authors should consider coordinating this discussion on contraints with chapter 16 framings of contraints, limits and options. (Monalisa Chatterjee, IPCC WGII TSU)
We considere Ch. 16 in revising the chapter
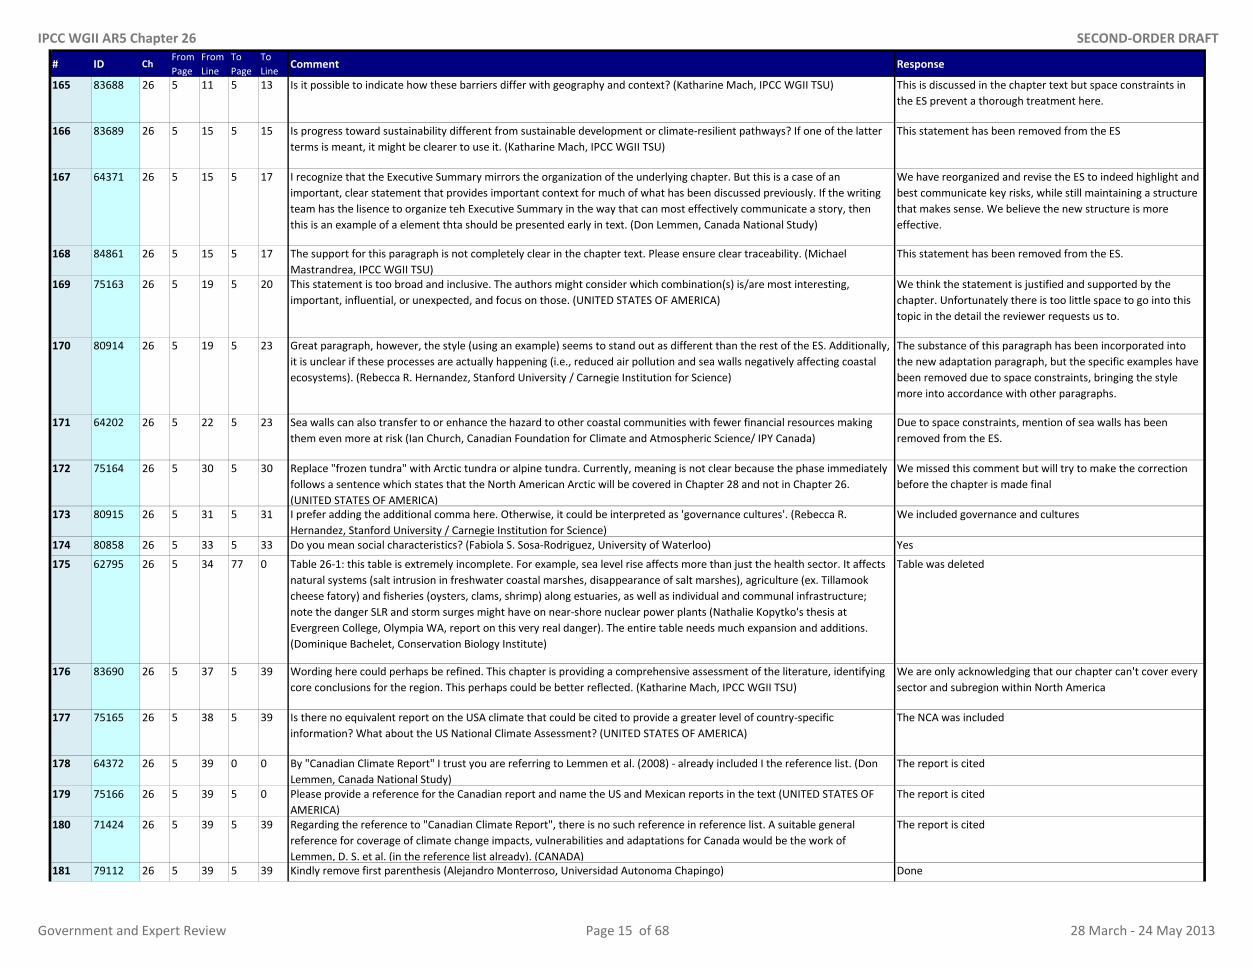
IPCC WGII AR5 Chapter 26 SECOND-ORDER DRAFT
Government and Expert Review Page 15 of 68 28 March - 24 May 2013
# ID ChFrom Page
From Line
To Page
To Line Comment Response
165 83688 26 5 11 5 13 Is it possible to indicate how these barriers differ with geography and context? (Katharine Mach, IPCC WGII TSU) This is discussed in the chapter text but space constraints in the ES prevent a thorough treatment here.
166 83689 26 5 15 5 15 Is progress toward sustainability different from sustainable development or climate-resilient pathways? If one of the latter terms is meant, it might be clearer to use it. (Katharine Mach, IPCC WGII TSU)
This statement has been removed from the ES
167 64371 26 5 15 5 17 I recognize that the Executive Summary mirrors the organization of the underlying chapter. But this is a case of an important, clear statement that provides important context for much of what has been discussed previously. If the writing team has the lisence to organize teh Executive Summary in the way that can most effectively communicate a story, then this is an example of a element thta should be presented early in text. (Don Lemmen, Canada National Study)
We have reorganized and revise the ES to indeed highlight and best communicate key risks, while still maintaining a structure that makes sense. We believe the new structure is more effective.
168 84861 26 5 15 5 17 The support for this paragraph is not completely clear in the chapter text. Please ensure clear traceability. (Michael Mastrandrea, IPCC WGII TSU)
This statement has been removed from the ES.
169 75163 26 5 19 5 20 This statement is too broad and inclusive. The authors might consider which combination(s) is/are most interesting, important, influential, or unexpected, and focus on those. (UNITED STATES OF AMERICA)
We think the statement is justified and supported by the chapter. Unfortunately there is too little space to go into this topic in the detail the reviewer requests us to.
170 80914 26 5 19 5 23 Great paragraph, however, the style (using an example) seems to stand out as different than the rest of the ES. Additionally, it is unclear if these processes are actually happening (i.e., reduced air pollution and sea walls negatively affecting coastal ecosystems). (Rebecca R. Hernandez, Stanford University / Carnegie Institution for Science)
The substance of this paragraph has been incorporated into the new adaptation paragraph, but the specific examples have been removed due to space constraints, bringing the style more into accordance with other paragraphs.
171 64202 26 5 22 5 23 Sea walls can also transfer to or enhance the hazard to other coastal communities with fewer financial resources making them even more at risk (Ian Church, Canadian Foundation for Climate and Atmospheric Science/ IPY Canada)
Due to space constraints, mention of sea walls has been removed from the ES.
172 75164 26 5 30 5 30 Replace "frozen tundra" with Arctic tundra or alpine tundra. Currently, meaning is not clear because the phase immediately follows a sentence which states that the North American Arctic will be covered in Chapter 28 and not in Chapter 26. (UNITED STATES OF AMERICA)
We missed this comment but will try to make the correction before the chapter is made final
173 80915 26 5 31 5 31 I prefer adding the additional comma here. Otherwise, it could be interpreted as 'governance cultures'. (Rebecca R. Hernandez, Stanford University / Carnegie Institution for Science)
We included governance and cultures
174 80858 26 5 33 5 33 Do you mean social characteristics? (Fabiola S. Sosa-Rodriguez, University of Waterloo) Yes
175 62795 26 5 34 77 0 Table 26-1: this table is extremely incomplete. For example, sea level rise affects more than just the health sector. It affects natural systems (salt intrusion in freshwater coastal marshes, disappearance of salt marshes), agriculture (ex. Tillamook cheese fatory) and fisheries (oysters, clams, shrimp) along estuaries, as well as individual and communal infrastructure; note the danger SLR and storm surges might have on near-shore nuclear power plants (Nathalie Kopytko's thesis at Evergreen College, Olympia WA, report on this very real danger). The entire table needs much expansion and additions. (Dominique Bachelet, Conservation Biology Institute)
Table was deleted
176 83690 26 5 37 5 39 Wording here could perhaps be refined. This chapter is providing a comprehensive assessment of the literature, identifying core conclusions for the region. This perhaps could be better reflected. (Katharine Mach, IPCC WGII TSU)
We are only acknowledging that our chapter can't cover every sector and subregion within North America
177 75165 26 5 38 5 39 Is there no equivalent report on the USA climate that could be cited to provide a greater level of country-specific information? What about the US National Climate Assessment? (UNITED STATES OF AMERICA)
The NCA was included
178 64372 26 5 39 0 0 By "Canadian Climate Report" I trust you are referring to Lemmen et al. (2008) - already included I the reference list. (Don Lemmen, Canada National Study)
The report is cited
179 75166 26 5 39 5 0 Please provide a reference for the Canadian report and name the US and Mexican reports in the text (UNITED STATES OF AMERICA)
The report is cited
180 71424 26 5 39 5 39 Regarding the reference to "Canadian Climate Report", there is no such reference in reference list. A suitable general reference for coverage of climate change impacts, vulnerabilities and adaptations for Canada would be the work of Lemmen, D. S. et al. (in the reference list already). (CANADA)
The report is cited
181 79112 26 5 39 5 39 Kindly remove first parenthesis (Alejandro Monterroso, Universidad Autonoma Chapingo) Done

IPCC WGII AR5 Chapter 26 SECOND-ORDER DRAFT
Government and Expert Review Page 16 of 68 28 March - 24 May 2013
# ID ChFrom Page
From Line
To Page
To Line Comment Response
182 80859 26 5 39 5 39 The other documents are: the National Communication of Mexico to the United Nations Framework Convention on Climate Change (UNFCCC) and the US National Climate Assessment. (Fabiola S. Sosa-Rodriguez, University of Waterloo)
Done
183 64373 26 5 47 0 0 Change "city" and "state" to "local" and "sub-national". While the US and Mexico have "states", Canada has provinces and territories. Not all local governments are cities. (Don Lemmen, Canada National Study)
We are using subnational
184 64374 26 5 49 5 53 As Box 26-1 appears first in the text, it should probably be noted as "The first". (Don Lemmen, Canada National Study) Addressed
185 83691 26 5 49 5 53 It is a bit confusing that the order of the 1st and 2nd case studies described here does not reflect their numbering within the chapter. (Katharine Mach, IPCC WGII TSU)
Addressed
186 75167 26 6 5 7 11 As presented, this section interrupts the flow of the chapter and the information presumably overlaps considerably with that presented in the Fourth Assessment. Readers are left to untangle where the two assessments differ. It may be more useful (and take less space) to enumerate places where this assessment differs from the last. If there are points from AR4 that are not deemed to require reassessment, perhaps those could be identified as well. (UNITED STATES OF AMERICA)
Section was redrafted
187 75168 26 6 28 6 28 This appears to contradict page 4, lines 7-13. (UNITED STATES OF AMERICA) Section was redrafted
188 83692 26 6 28 6 28 Casual usage of "likely" should be avoided, as it is a reserved likelihood term. (Katharine Mach, IPCC WGII TSU) Section was redrafted
189 83693 26 6 40 6 49 Casual usage of "likely" should be avoided, as it is a reserved likelihood term; this applies to lines 40, 41, 42, 43, and 49. (Katharine Mach, IPCC WGII TSU)
Section was redrafted
190 62796 26 6 43 7 2 the same sentence is repeated on both of these pages. (Dominique Bachelet, Conservation Biology Institute) Section was redrafted
191 64375 26 6 44 6 47 The final sentence of this paragraph is repeated exactly in the first paragraph on p.7 (lines 4 - 6). The two paragraphs should be combined (because they predominantly focus on health issues) and the repetition deleted. (Don Lemmen, Canada National Study)
Section was redrafted
192 75169 26 6 49 6 50 26.1 : This should read "...wildfire and forest insect pest outbreaks in large areas of Canada and the US" because the statement is not universally true, for example in some coastal regions (where moisture is expected to increase) and some near-desert regions (where wildfire probability is expected to decrease). (UNITED STATES OF AMERICA)
Section was redrafted
193 64203 26 6 50 6 51 Some species or populations of plants do not have the genetic plasticity to be adapted to long summer daylight/short dark growing seasons and are lattitudinally restricted. (example Lodgepole pine) (Ian Church, Canadian Foundation for Climate and Atmospheric Science/ IPY Canada)
Section was redrafted
194 75170 26 7 1 7 3 There is something wrong with the structure of the sentence. It is clear that early warning and surveillance systems, air conditioning, and access to healthcare are all things that can be considered countermeasures. Pollution, storm-related fatalities and injuries, and infectious diseases are not things that one would consider countermeasures. If the authors meant to suggest that investment in amelioration of these things constitutes countermeasures, the sentence should be reworded to indicate that. If, on the other hand, pollution, storm-related fatalities and injuries, and infectious diseases are things that will increase adverse health impacts, the sentence needs to be worded differently. (UNITED STATES OF AMERICA)
Section was redrafted
195 75171 26 7 3 7 3 Health impacts of extreme weather are not limited to US and Canada. For instance, Mexico City has experienced severe heat waves recently (UNITED STATES OF AMERICA)
Section was redrafted
196 83694 26 7 3 7 3 Casual usage of "likely" should be avoided, as it is a reserved likelihood term. (Katharine Mach, IPCC WGII TSU) Section was redrafted
197 57934 26 7 4 7 6 These are repeated lines from Page 6, Line 44 to 47. (Sanjiv Kumar, Center for Ocean-Land-Atmosphere Studies) Section was redrafted
198 75172 26 7 4 7 6 The same sentence is provided on page 6, lines 44-47 (UNITED STATES OF AMERICA) Section was redrafted
199 80860 26 7 8 7 11 Mention the chapters (Fabiola S. Sosa-Rodriguez, University of Waterloo) Section was redrafted
200 75173 26 7 14 7 14 A more descriptive header might be "Key Trends Influencing Vulnerability and the Need for Adaptation". (UNITED STATES OF AMERICA)
Addressed
201 75174 26 7 14 7 14 Might this section discuss trends in efforts at adaptation and building resilience? (UNITED STATES OF AMERICA) We discuss socioeconomic and institutional trends shaping vulnerability and adaptation capacity
202 75175 26 7 23 7 23 For clarity, say "percent per year" (UNITED STATES OF AMERICA) Done

IPCC WGII AR5 Chapter 26 SECOND-ORDER DRAFT
Government and Expert Review Page 17 of 68 28 March - 24 May 2013
# ID ChFrom Page
From Line
To Page
To Line Comment Response
203 64376 26 7 27 7 29 Please add a phrase providing examples of the types of climate risks that can be exacerbated by expanding peri-urban populations. Note that the phrase "peri-urban" is unlikely to resonate in Canada. (Don Lemmen, Canada National Study)
Done
204 57935 26 7 31 7 31 “… infrastructure and (???) sectors …” Which sector? (Sanjiv Kumar, Center for Ocean-Land-Atmosphere Studies) Added
205 64377 26 7 31 7 32 You need to be clear why some factors are deemed "a source of risk" and others "a source of sensitivity". They all seem to relate to risk - and if so then you should use consistent language. (Don Lemmen, Canada National Study)
Addressed
206 75176 26 7 32 7 49 Risks here is used in a very vague sense. What are the risks, specifically? (UNITED STATES OF AMERICA) Addressed
207 75177 26 7 37 7 0 Sentence should state something like "food price increases will contribute to poverty in urban areas and some rural areas, depending on agricultural response to local effects of climate change." Unclear that all rural areas will be negatively affected. Citation (Lobell et al 2011) estimates that some areas may see net increases in yields. Together with higher prices, certain food-surplus rural areas may benefit. Sentence as it reads is overly simplistic. (UNITED STATES OF AMERICA)
Addressed
208 64378 26 7 40 7 43 Figure 26-1 is not very effective. The differences in the two maps are minor - basically saying that current areas of high population are going to get larger. "Total population" is a very unusual parameter to present graphically, population density would make a lot more sense. Vancouver / Seattle seem to have disappeared until the bold coastline. Strongly suggest this figure be replaced with a table in which "total population" makes more sense, and provide absolute numbers for defined areas (e.g. Mexico City, NE US coast, Great Lakes). (Don Lemmen, Canada National Study)
Figure deleted
209 75178 26 7 40 7 43 The Figure caption for 26-1 and the same text in body of chapter (Page 7, line 31-32) is unclear in several ways. It appears that "risk"being is contrasted with "sensitivity" where the text reads "concentrations of growing populations, infrastructures and sectors in urban areas can be a source of risk" versus "geographic isolation of can be a source of sensitivity." Because the Figure is about population, the terms risk and sensitivity need clarification ( for example is this risk from climate change and how is sensitivity different than vulnerability?) unless it can always be assumed that these terms are used on accordance with the glossary. Finally, the meaning of high dispersion levels is ambiguous. Consider substituting low density if that is meaning. (UNITED STATES OF AMERICA)
Figure deleted
210 80916 26 7 48 7 50 This sentence is a little awkward. It could be re-phrased for clarity. (Rebecca R. Hernandez, Stanford University / Carnegie Institution for Science)
Redrafted
211 75188 26 8 0 0 0 Box 26.1 Comments - Please consider adding these water/transboundary citations: Getches, D.H. (2003). Impacts in Mexico of Colorado River management in the United States: a history of neglect, a future of uncertainty. Climate and water: transboundary challenges in the Americas. H.F. Diaz and B.J. Morehouse. The Netherlands, Kluwer Academic Publishers: 163-191. ; Comrie, A.C. (2003). Climate doesn't stop at the border: U.S.-Mexico climatic regions and causes of variability. Climate and water: transboundary challenges in the Americas. H.F. Diaz and B.J. Morehouse. The Netherlands, Kluwer Academic Publishers: 291-316. ; Magana, V.O. and C. Conde (2003). Climate variability and climate change, and their impacts on the freshwater resources in the border region: a case study for Sonora, Mexico . Climate and water: transboundary challenges in the Americas. H.F. Diaz and B.J. Morehouse. The Netherlands, Kluwer Academic Publishers: 373-392; Cayan, D.R., M.D. Dettinger, K.T. Redmond, G.J. McCabe, N. Knowles and D.H. Peterson (2003). The transboundary setting of California's water and hydropower systems: linkages between the Sierra Nevada, Columbia, and Colorado hydroclimates. Climate and water: transboundary challenges in the Americas. H.F. Diaz and B.J. Morehouse. New York, NY, Springer: 237-262. (UNITED STATES OF AMERICA)
Done
212 75189 26 8 0 0 0 Box 26.1 Comments - The discussion is focused almost exclusively on the long but narrow geographical border area. Additional trans-boundary issues operating at wider geographic scales deserve attention, e.g., tourism or the trade of climate-sensitive goods between the countries. These potentially affect many more people and larger portions of the respective national economies. (UNITED STATES OF AMERICA)
No it is not and many of the scholarship work we reviewed has different definitions of this border. We added reference to the multiple ways in which the border can be defined

IPCC WGII AR5 Chapter 26 SECOND-ORDER DRAFT
Government and Expert Review Page 18 of 68 28 March - 24 May 2013
# ID ChFrom Page
From Line
To Page
To Line Comment Response
213 75190 26 8 0 0 0 Box 26-1 Comments - This section cites Wilder and Varady disproportionately. It should cite and incorporate additional literature on the challenges of the US-Mexico border region that are applicable to climate change, for example on how transboundary water is governed on the US-MX border. Literature examples: (A) Fischhendler, I. (2004). Legal and Institutional Adaptation to Climate Uncertainty: A Study of International Rivers. Water Policy, 6, 281-203. Discusses the implications of treaties and responding to climate change. (B) Mumme, S. P. (1999). Managing acute water scarcity on the US-Mexico border: Institutional issues raised by the 1990's drought. Natural Resources Journal, 39(1), 149-166. Discussion of how the bilateral treaty has recently been updated in light of advances in our scientific understanding is worth highlighting (see work of the Inter-Boundary Water Commission) (UNITED STATES OF AMERICA)
If we cite Wilder et al., is because this chapter is part of the US National Climate Assessment. As such it already assessed existing literature on the US-Mexico Border. Still, we added most of the references suggested here and in 211
214 64379 26 8 1 9 14 The objective - or take home message - of Box 26.1 is not clear. It is a very interesting issue and region, but there is a need to take the analysis beyond "will likely bring significant consequences". The text does an excellent job of description, but stops short of analysis and identification of findings that can be transferred to other transboundary issues. (Don Lemmen, Canada National Study)
We want to illustrate the constraints and opportunities of adapting to climate change in a transboundary context given not only by climate trends but also by the processes shaping vulnerabilities and adaptive capacities .
215 80863 26 8 3 9 12 Consider to include the discussion presented in Vasquez-Leon, West and Finan (2003). A comparative assessment of climate vulnerability: agriculture and (Fabiola S. Sosa-Rodriguez, University of Waterloo)
We added most of the references suggested here, in 213 and in 211
216 80864 26 8 3 9 12 ranching on both sides of the US–Mexico border. Global Environmental Change 13: 159-173. (Fabiola S. Sosa-Rodriguez, University of Waterloo)
We do not understand the comment, nor what to do about this reference
217 80865 26 8 3 9 12 Consider to include the discussion presented in Feng S; Krueger AB (2010). Linkages among climate change, crop yields and Mexico–US cross-border migration. Proceedings of the US National Academy of Sciences. (Fabiola S. Sosa-Rodriguez, University of Waterloo)
We refer to migration and climate change in section 26.2.1
218 64380 26 8 5 8 6 Reconcile statement here that this is "one of the longest" borders between middle and high income countries with the statement on p.5 (line 52) that this is the longest border in the world between middle and high income countries. (Don Lemmen, Canada National Study)
Done
219 83695 26 8 9 8 9 Casual usage of "likely" should be avoided, as it is a reserved likelihood term. (Katharine Mach, IPCC WGII TSU) Addressed
220 83696 26 8 10 8 11 Is conflict between countries or are more localized issues being referred to here? (Katharine Mach, IPCC WGII TSU) Is both
221 75179 26 8 10 8 12 Box 26-1 : This box characterizes the US-Mexico cross-boundary relationship in a manner that is not particularly useful or relevant. In fact, recent agreements have demonstrated cross-border cooperation, etc. (e.g. the Colorado River Compact) that are actively contested by various parties (governmental, indigenous, etc.) to bolster this claim. (UNITED STATES OF AMERICA)
Thank you
222 80917 26 8 21 8 0 The term 'maquiladoras' should probably be defined (Rebecca R. Hernandez, Stanford University / Carnegie Institution for Science)
We introduced the English word, assembly factories before “maquiladoras”
223 75180 26 8 21 8 21 Page 8, row 21. Please define "maquiladoras" on first use and if italics are to be used, they should be used consistently. (UNITED STATES OF AMERICA)
We introduced the English word, assembly factories before “maquiladoras”
224 61656 26 8 21 8 23 What is a maquialdora? (European Union DG Research, Directorate Environment Climate Change & Environmental Risks Unit)
We introduced the English word, assembly factories before “maquiladoras”
225 62797 26 8 21 8 23 define maquiladoras and use or not italics, be consistent (Dominique Bachelet, Conservation Biology Institute) We introduced the English word, assembly factories before “maquiladoras”
226 80918 26 8 23 8 0 The term 'maquiladoras' here is italicized but was not previously. (Rebecca R. Hernandez, Stanford University / Carnegie Institution for Science)
We introduced the English word, assembly factories before “maquiladoras”
227 80861 26 8 23 8 23 Provide references (Fabiola S. Sosa-Rodriguez, University of Waterloo) References were put in the right place
228 75181 26 8 24 8 24 Reconsider use of word “explosive.” Reword to avoid implying there is an expectation that very rapid economic and population growth would create adaptive capacity. (UNITED STATES OF AMERICA)
Done
229 83697 26 8 25 8 27 Should differences between urban areas in Mexico and US be described? (Katharine Mach, IPCC WGII TSU) Example provided
230 75182 26 8 31 8 31 Please be more specific about the period of the "current drought" (UNITED STATES OF AMERICA) Done
231 75183 26 8 31 8 33 Woodhouse et al. (2010) address the long-term history of drought in the area. Perhaps they should be cited in the discussion of drought history. (UNITED STATES OF AMERICA)
We already had done, and now did twice.

IPCC WGII AR5 Chapter 26 SECOND-ORDER DRAFT
Government and Expert Review Page 19 of 68 28 March - 24 May 2013
# ID ChFrom Page
From Line
To Page
To Line Comment Response
232 57880 26 8 34 0 0 Nakaegawa et al. (2013) supported the results for the Rio Grande River: Annual river discharges in the main stream Rio Grande Riveris projected to increase but is not robust (Nakaegawa et al. 2013). akaegawa, T., A. Kitoh, M. Hosaka. 2013: Discharge of major global rivers in the late 21st century climate projected with the high horizontal resolution MRI-AGCMs -overview-. Hydrological Processes. 27. DOI: 10.1002/hyp.9831 (Toshiyuki Nakaegawa, Meteorological Research Institute)
Included
233 75184 26 8 37 8 37 You can also cite these papers for projections of future North American drought. The Hoerling et al paper criticizes the other 3 as they are based on the Palmer Index. Nonetheless, a drying in the US/Mexican border region is seen in that study as well. Michael Wehner, David R. Easterling, Jay H. Lawrimore, Richard R. Heim Jr., Russell S. Vose, Benjamin Santer (2011) Projections of Future Drought in the Continental United States and Mexico. Journal of Hydrometerology 12, 1359-1377. doi: http://dx.doi.org/10.1175/2011JHM1351.1 Christopher R. Schwalm, Christopher A.Williams, Kevin Schaefer, Dennis Baldocchi,T. Andrew Black, Allen H. Goldstein, Beverly E. Law,Walter C. Oechel, Kyaw Tha Paw U, and Russel L. Scott (2012) Reduction in carbon uptake during turn of the century drought in western North America, Nature Geoscience 5, 551-555 DOI: 10.1038/NGEO1529 MARTIN P. HOERLING, JON K. EISCHEID, XIAO-WEI QUAN, HENRY F. DIAZ, ROBERT S. WEBB, RANDALL M. DOLE and DAVID R. EASTERLING (2012) Is a Transition to Semipermanent Drought Conditions Imminent in the U.S. Great Plains? J. Climate 25, 8380-8386 , DOI: 10.1175/JCLI-D-12-00449.1 Aiguo Dai (2012) Increasing drought under global warming in observations and models, Nature Climate Change, 3, 52-58 DOI: 10.1038/NCLIMATE1633 (UNITED STATES OF AMERICA)
Because of space constrains we could not include all the references
234 62798 26 8 39 8 45 very short section it seems; there are issues with migration corridors, fire spread, invasives etc (Dominique Bachelet, Conservation Biology Institute)
We deleted that section
235 80862 26 8 40 8 45 Consider to include that there are endemic species of flora in these areas under the risk of extinction (Fabiola S. Sosa-Rodriguez, University of Waterloo)
We deleted that section
236 80919 26 8 41 8 0 California saga' should be 'California sage scrub'. (Rebecca R. Hernandez, Stanford University / Carnegie Institution for Science)
We deleted that section
237 80920 26 8 41 8 42 This section "Ecosystems" I have a lot to comment on and suggestions for improvement. I am attaching a separate word document for this. (Rebecca R. Hernandez, Stanford University / Carnegie Institution for Science)
We deleted that section
238 75185 26 8 42 8 42 There are consistent numbers for endangered species (IUCN) across the US and Mexico which would could be added to the EPA-specific numbers here. (UNITED STATES OF AMERICA)
We deleted that section
239 75186 26 8 48 8 53 The points in this paragraph about health do not appear to be climate-related, and thus it is not clear why they are included in the discussion. Consider making this more clear for example joining this paragraph more explicitly with the following paragraph. (UNITED STATES OF AMERICA)
We deleted that section
240 75187 26 8 51 8 51 It is unclear from this sentence whether the ozone of PM10 violations are severe relative to other parts of the US, Mexico, and Canada. If they are not, this sentence does not support increased vulnerability at the border. Also, whether these air quality incidents are related to the trucking is unclear. (UNITED STATES OF AMERICA)
We deleted that section
241 75201 26 9 0 10 0 Box on US-Mexico Border had many weak elements. The writing tone is less crisp and objective than other sections. Needs better organization, with like kinds of information (e.g., climate, population) grouped together. (UNITED STATES OF AMERICA)
We reorganized the box
242 83698 26 9 1 9 1 It would be helpful to clarify the phrase "as climate change enters the equation," as climate change is already occurring. (Katharine Mach, IPCC WGII TSU)
Addressed
243 80921 26 9 2 0 0 Add citation here. Possible sources: Griffen et al. 2001 (Global Change and Human Health 2:20-33, "Dust in the wind: Long range transport of dust in the atmopshere and its implications for global public and ecosystem health") and Pepper et al. 2009 (Environmental Science and Technology 39:416-432), (Rebecca R. Hernandez, Stanford University / Carnegie Institution for Science)
We removed the paragraph. We wanted to refer to these references but they mostly focus on other areas (e.g., Asia) or to the positive health impacts of soil Pepper et al., 2009
244 80866 26 9 2 9 2 Replace “draught” by “drought” (Fabiola S. Sosa-Rodriguez, University of Waterloo) Done
245 75191 26 9 6 9 12 A potential example to cite is the recent US/Mexico International Boundary and Water Commission agreement (http://www.ibwc.state.gov/Files/Press_Release_112012.pdf) that addresses water issues between the two countries. This agreement demonstrates a ‘success story’ in international relations as it relates to trans-boundary climate adaptation/planning. (UNITED STATES OF AMERICA)
Done
246 75192 26 9 7 9 12 Is there not more to say here? Are there any potential issues regarding transmission of infectious diseases, agricultural pests, etc.? (UNITED STATES OF AMERICA)
What we have is what we can support with existing studies
247 75193 26 9 10 9 10 The description of “conflicts” in this box is casual. It is recommended that this paragraph be rewritten for clarity and use of more literature sources. (UNITED STATES OF AMERICA)
Addressed
248 80867 26 9 10 9 10 Barriers or constrains? (Fabiola S. Sosa-Rodriguez, University of Waterloo) Constraints
IPCC WGII AR5 Chapter 26 SECOND-ORDER DRAFT
Government and Expert Review Page 20 of 68 28 March - 24 May 2013
# ID ChFrom Page
From Line
To Page
To Line Comment Response
249 64381 26 9 10 9 12 the examples in this final sentence represent challenges (as per section heading) but they should not be considered barriers (in the sense of something that should be broken down). There are good reasons why countries have different governance structures and why institutional fragmentation exists. In most circumstances these are things we simply have to learn to deal with, rather than try to change. (Don Lemmen, Canada National Study)
The literature we are citing in this section finds that institutional fragmentation; asymmetries in the use and dissemination of information, and language are constraints to effective adaptation
250 64382 26 9 22 0 0 Define elderly - (Over age 60, 65, 70??) (Don Lemmen, Canada National Study) We added a definition
251 64383 26 9 23 9 24 Delete reference to Figure 26-2 as it is not needed or appropriate in a section about Demographic and Socioeconomic Trends. The point of the sentence is the enhanced sensitivity of the elderly to heat waves. That sensitivity is independent of projected changes in heat waves. (Don Lemmen, Canada National Study)
Done
252 75194 26 9 25 9 26 Why do increases in female-headed households exacerbate vulnerability? It is not justified to assume this or assert it as a logical statement. Recommend that this statement be deleted or that citations are added that represent breadth of literature. In addition, if the number of single-person households is projected to increase, a citation should be given. (UNITED STATES OF AMERICA)
The literature has identified this as a highly vulnerable group (because of lower income, and heavy burden of both child bearing and work
253 76841 26 9 26 9 26 You haven't demonstrated why female-headed households per se should beexceptionally vulnerable to extreme weather events. Is the intervening variable relative poverty and access to adequate housing ? If so, say so. Perhaps the bigger point is poverty, not female -headedness. (Michael Scott, Pacific Northwest National Laboratory)
The literature has identified this as a highly vulnerable group (because of lower income, and heavy burden of both child bearing and work
254 75195 26 9 27 9 28 26.2.1.2 : The statement "institutional capacity may also be limited by challenges posed by aging populations... a resulting stress on health and economic performance" is not supported by evidence in the text. Recommend that this statement be deleted or that citations are added that represent breadth of literature. In addition it is not worded logically, as the institional capacity will not be" limited by a challenge"; it may be "limited relative the to the challenge posed by" or "challenged by the demands posted by." (UNITED STATES OF AMERICA)
Addressed
255 64384 26 9 30 9 33 This figure should be moved to section 26.2.2.2 which deals with climate change projections. Inclusion of a figure that is "forthcoming" is problematic. (Don Lemmen, Canada National Study)
Deleted
256 76842 26 9 35 10 7 You have made the point that economic disparityand poverty is forecasted to increase in Mexico but do not say why this is important for impacts. My understanding of recent economic activity in Mexico and the United States (past two-three years) suggests that immigration to the United States from Mexico has abated considerably in part due to improvement of the Mexican economy and convergence of opportunity. My point is that the situation may be more mixed than you suggest. (Michael Scott, Pacific Northwest National Laboratory)
Sentence changed to address concern
257 83699 26 9 39 9 41 There be helpful to clarify why these changes are expected. (Katharine Mach, IPCC WGII TSU) Sentence changed to address concern
258 75196 26 9 41 9 41 Are habitats vs ecosystems defined in early chapter? (UNITED STATES OF AMERICA) This comment refers to another paragraph in the border box that we already deleted
259 75197 26 9 41 9 42 A citation is needed for, "Education is a key determinant of adaptive capacity." (UNITED STATES OF AMERICA) We referred to chapter 12
260 61657 26 9 45 9 45 More explanation of the Gini index needed - it appears that the lower the number the better? An explanation of the number scale is needed: Is 1 "bad" and 0 "good"? (European Union DG Research, Directorate Environment Climate Change & Environmental Risks Unit)
Done
261 75198 26 9 46 9 47 Suggest rewording sentence about economic growth being insufficient. (UNITED STATES OF AMERICA) Sentence deleted
262 75199 26 9 48 9 51 Please list drivers of Mexico's especially high projected poverty increases. (UNITED STATES OF AMERICA) Paragraph rewritten
263 75200 26 9 53 10 7 This paragraph was very had to follow and needs to be rewritten for clarity. (UNITED STATES OF AMERICA) Paragraph rewritten
264 75207 26 10 0 10 0 Figure 26-3 Comments - this figure pertains to future climate projections, yet it is found in the section on current trends. This figure should be moved to the appropriate section (26.2.2.2). Also, the Figure does not support the claim in the text (lines 30-32) that the "warming hole" is more pronounced over the last century relative to the last three decades. It does not show the warming hole or past climate information. (UNITED STATES OF AMERICA)
The wrong figure was in the SOD. This figure should have been the North American version of the cross-chapter figures, which included observations. The North American version of the cross-chapter figures is now included.
265 75202 26 10 1 10 2 The implication seems to be that urban areas are more sensitive than non-urban areas. This should be clarified including the apparent contradiction with other statements in chapter. (UNITED STATES OF AMERICA)
We addressed this comment and redrafted the section

IPCC WGII AR5 Chapter 26 SECOND-ORDER DRAFT
Government and Expert Review Page 21 of 68 28 March - 24 May 2013
# ID ChFrom Page
From Line
To Page
To Line Comment Response
266 75203 26 10 1 10 7 The authors do not give evidence their for assertion that health and safety are a driver of migration resulting from climate change. In addition, regarding lines 5-7 it seems that lower socio-economic status itself would restrict migration because of lack of capital or resources to do so; could this also be addressed briefly? (UNITED STATES OF AMERICA)
We addressed this comment and redrafted the section
267 64204 26 10 2 10 3 Outmigration of agricultural populations from the Prairies in both Canada and the USA during the droughts of the 1930's (Ian Church, Canadian Foundation for Climate and Atmospheric Science/ IPY Canada)
We addressed this comment and redrafted the section
268 75204 26 10 4 10 4 Clarify, migration from where to where? (UNITED STATES OF AMERICA) We addressed this comment and redrafted the section
269 64385 26 10 4 10 5 Gilbert and McLeman (2010) does not talk about historic Mexican droughts, and therefore reference is inappropriate here. The reference might work if you changed the reference from Mexican droughts to droughts in North America. Relevant papers specifically related to Mexican droughts include: 1 - R. J. Nawrotzki, F. Riosmena, L. M. Hunter, Do Rainfall Deficits Predict U.S.-Bound Migration from Rural Mexico? Evidence from the Mexican Census, Population Research and Policy Review (2012), doi:10.1007/s11113-012-9251-8; and 2 - S. F. Feng, A. B. Krueger, M. Oppenheimer, Linkages among climate change, crop yields and Mexico-US cross-border migration, Proceedings of the National Academy of Science 107, 14257-14262 (2010). (Don Lemmen, Canada National Study)
We addressed this comment and redrafted the section
270 75205 26 10 5 10 7 If indeed there is a reasonable case to be made that climate shocks have accelerated northward migration, then it needs to be explicitly expanded upon, because it would be quite important. As it stands, there is an oblique reference made to it. (UNITED STATES OF AMERICA)
We addressed this comment and redrafted the section
271 64386 26 10 12 10 16 This list should also include WGI Chapter 4 (Observations: Cryosphere) because of the importance of glaciers for water supply, as well as snow and ice cover. Permafrost is more relevant to the Polar Regions chapter. (Don Lemmen, Canada National Study)
WGI Chapter 4 (Observations: Cryosphere) has been added to the list.
272 75206 26 10 21 10 21 No mention of changes to variance. This is an important omission. (UNITED STATES OF AMERICA) The reviewer does not provide peer-review literature documenting observed statistically-significant changes in variance over North America.
273 83700 26 10 21 10 21 It would be preferable to delete the 1st sentence of this paragraph, simply retaining the material that follows. (Katharine Mach, IPCC WGII TSU)
The sentence has been deleted.
274 83701 26 10 21 10 32 Would it make sense to also provide within figure 26-3 the maps of observed changes in North America, to complement this text? (Katharine Mach, IPCC WGII TSU)
The wrong figure was in the SOD. The North American version of the cross-chapter figures is now included.
275 62799 26 10 27 0 0 "cooling over central NA and eastern US" yet Vose et al. 2012 (GRL Vol 39) state that "For the conterminous United States as a whole, all trends in mean annual temperature are positive and statistically significant". t would be good to precisely say the trend comes from NOAA records 1901-2005 and covers mostly the SE USA (http://www.ncdc.noaa.gov/cmb-faq/globalwarming.html). (Dominique Bachelet, Conservation Biology Institute)
The revised cross-chapter figure follows the WGI SPM in showing temperature data from the NOAA MLOST dataset. In addition, the text has been edited to state that warming has been less pronounced and less robust over areas of the central and southeastern U.S.
276 71426 26 10 27 0 32 The authors may wish to clarify what "this warming hole" refers to. Suggest ensuring consistent language with the WGI report. (CANADA)
The text has been edited to state that warming has been less pronounced and less robust over areas of the central and southeastern U.S., and that it is possible that this pattern of muted temperature change has been influenced by changes in the hydrologic cycle, as well as by decadal-scale variability in the ocean.
277 71425 26 10 27 10 30 It is very difficult to see the stated pattern in Fig 2.22 . Relative cooling in central N.A. and eastern U.S. does not stand out in the LH panels of Fig 2.22. What is more noticeable in the Figure is the relative lack of warming in central and western Canada and the U.S. over the 1979-2011 time period. Also, Fig 26.3 is not an appropriate reference for these statements about past trends as the Figure shows future projections. (CANADA)
The wrong figure was in the SOD. The North American version of the cross-chapter figures is now included.
278 71427 26 10 28 10 28 Please clarify whether "central North America" is restricted to U.S. territory or whether it extends into Canada. Even though this may be a term for a general geographic region, Canadian readers will want to know if it applies to them in general, or not. (CANADA)
The text has been edited to state “central and southeastern U.S.”
279 64387 26 10 29 10 30 Figure 26-3 provides no support for this statement, as it presents projected changes and this statement refers to historic trends. (Don Lemmen, Canada National Study)
The wrong figure was in the SOD. The North American version of the cross-chapter figures is now included.
IPCC WGII AR5 Chapter 26 SECOND-ORDER DRAFT
Government and Expert Review Page 22 of 68 28 March - 24 May 2013
# ID ChFrom Page
From Line
To Page
To Line Comment Response
280 64388 26 10 34 10 45 This figure does not belong in a section on Current Trends, as it deals with projections. IF it is moved to section 26.2.2.2 you should revise the caption to first draw attention to the most statistically significant elements of the figure (colors without circles), then work your way backwards using the likelihood language that is standard for the report. (Don Lemmen, Canada National Study)
The wrong figure was in the SOD. The North American version of the cross-chapter figures is now included.
281 76843 26 10 35 10 45 The caption for Figure 26.3 is extremely confusing. It would help to indicate that this is the average of an ensemble of x models in CMIP5 (or however it is derived). THe temerature panel shows no white or gray, so percentage agreement between models must mean only precipitation, right? Also, despite references to what circles mean, my copy of the figure doesn't show any circles. (Michael Scott, Pacific Northwest National Laboratory)
The wrong figure was in the SOD. The North American version of the cross-chapter figures is now included, included the revised caption.
282 83702 26 10 47 10 51 Since cross-reference is provided to the relevant chapter sections in the working group 1, it would be clearer to delete "WGI notes" from lines 47 and 51. (Katharine Mach, IPCC WGII TSU)
The identified text has been deleted in both instances.
283 64389 26 10 51 11 2 I would have expected this discussion to include mention of WGI findings with respect to glacier cover and the impact on summer / fall flows in rivers originating in the western Cordillera. (Don Lemmen, Canada National Study)
Text has been added stating that observations also show decreasing mass and length of glaciers in North America, along with reference to WGI 4.3 and WGI Fig. 4.9, 4.10, 4.11.
284 76844 26 11 1 11 1 Mote (2006) and some later attempted corrections (and attacks) led to some controversy in the popular press. My understanding is that the fundamental result in Mote 2006 (historical decline of the Western US snowpack) has not been overturned, but it is probably a good idea to cite additional key articles and characterize the debate in at least one sentence. Or if the debate appears elsewhere in in AR5, cite that chapter. (Michael Scott, Pacific Northwest National Laboratory)
References to WGI section 4.5, WGI Fig. 4.21, and Barnett et al. (2008) have been added.
285 83703 26 11 2 11 11 Wherever sentences begin with working group 1 as the subject of the sentence, it would be preferable to simply give the key findings with appropriate specific cross-references as already provided. (Katharine Mach, IPCC WGII TSU)
WGI has been removed as the subject in all but the one instance where a direct quote of the WGI text is provided.
286 75208 26 11 17 12 38 This whole section is very focused on changes in mean temperature and precipitation. The only mention of climatic extremes is in the final paragraph, which only cites literature from Diffenbaugh et al. Certainly, there is a broader literature on climatic extremes in N America that would be worth referencing in this section. This issue is particularly salient in the current physical trends section, 26.2.2.2; (UNITED STATES OF AMERICA)
Given the page/line numbers and the section number that are given by the reviewer, the identified section is interpreted to be 26.2.2.2, which began on page 11, line 17 in the SOD, and was titled “Climate Change Projections”. The length allotted to this subsection is very brief. Much of the section is focused on the cross-chapter figures, which provide clear interpretations of significance and robustness. In addition, a panel showing the CMIP5 extreme precipitation results from Kharin et al. (2013) has been added. Further, References to Duffy and Tebaldi (2012) and Battisti and Naylor (2009) have been added to the extreme seasons paragraph, and an additional paragraph has been added citing additional sources of literature on projected changes in extremes.
287 80869 26 11 18 12 38 Improve this section describing what these climatic parameters changes mean in terms of adaptation needs (Fabiola S. Sosa-Rodriguez, University of Waterloo)
The implications of changes in climate variables for adaptation needs is the purview of other sections in the Chapter.
288 80868 26 11 19 11 19 Replace “processes important” by “important processes” (Fabiola S. Sosa-Rodriguez, University of Waterloo) The text has been changed to read “processes that are important for regional climate change”.

IPCC WGII AR5 Chapter 26 SECOND-ORDER DRAFT
Government and Expert Review Page 23 of 68 28 March - 24 May 2013
# ID ChFrom Page
From Line
To Page
To Line Comment Response
289 57936 26 11 22 11 40 Along with mean warming, you may also want to put the range. Because, at regional scale observed warming has not followed the mean warming rate e.g. Figure 26.4; also see relevant Figures 3 and 4 in Kumar et al. 2012. Also. You may want to remind the reader about this. In kumar et al. 2013, we found that at local/regional scales multi-model mean generally provides a conservative estimate of trends (Figures 3 and 6 in Kumar et al. 2013), because long-term trends from different models are not significantly correlated at local/regional scales (See Figures 5 and 8 in Kumar et al. 2013) (1) Kumar, S., J. Kinter III, P. Dirmeyer, Z. Pan, and J. Adams (2012). Multi-decadal Climate Variability and the "Warming Hole" in North America - results from CMIP5 20th and 21st Century Climate Simulations. J. Climate. doi:10.1175/JCLI-D-12- 00535.1, in press. (2) Kumar S., V. Merwade, J. Kinter III, D. Niyogi (2013). Evaluation of Temperature and Precipitation Trends and Long-term Persistence in CMIP5 20th Century Climate Simulations. Journal of Climate. doi:10.1175/JCLI-D-12-00259.1, in press. Further, Figure 26.4 can be improved by doing 5 or 10 years moving average of anomaly. (Sanjiv Kumar, Center for Ocean-Land-Atmosphere Studies)
The revised cross-chapter figure shows the significance quantification assessed by WGI. In addition, the text has been edited to state that warming has been less pronounced and less robust over areas of the central and southeastern U.S.
290 75209 26 11 23 11 30 RCP2.6 should also be discussed. Average temperatures over North America are +2C or higher at the middle of the 21st century and stabilize thereafter. Potential source is IPCC AR5 WG1, figure 12.11. (UNITED STATES OF AMERICA)
The North American version of the cross-chapter figures has been included. This figure includes RCP2.6. The RCP2.6 are discussed in the revised text.
291 83704 26 11 23 11 50 Wherever likelihood terms are used, for example on lines 23, 41-44, 46, 48, and 50, they should be italicized. (Casual usage should be avoided.) (Katharine Mach, IPCC WGII TSU)
The likelihood statements have been italicized as suggested.
292 64390 26 11 24 0 0 Figure 26-4 presents both historic trends and future projections, The historic trends elements on this figure is never utilized. (Don Lemmen, Canada National Study)
The wrong figure was in the SOD. The North American version of the cross-chapter figures is now included, including observations, which are referenced in the text.
293 83705 26 11 24 11 25 Where mean warming is referred to on these lines (and also on line 27), should it be specified that this is mean annual warming? (Katharine Mach, IPCC WGII TSU)
The text has been edited to read “changes in mean annual temperature”.
294 75210 26 11 27 11 29 Language is incorrect: 6 degrees C of annual warming? This makes it sound like a rate per year, which would be enormous. (UNITED STATES OF AMERICA)
“Mean annual warming” has been edited to read “changes in mean annual temperature” throughout this paragraph.
295 64391 26 11 27 11 30 These statements would be more effective with a supporting map. Current Figure 26-3 would likely serve the purpose. (Don Lemmen, Canada National Study)
The wrong figure was in the SOD. The North American version of the cross-chapter figures is now included, including the revised and clarified legend.
296 75211 26 11 29 11 30 Says “smallest mean warming” on Pacific Coast of U.S. Whereas page 12, line 25 says Western U.S. emerges as prominent area of aggregate climate warming”. Appears contradictory. (Also, the term ‘aggregate climate warming’ is not defined. (UNITED STATES OF AMERICA)
The sentence about aggregate climate change has been removed.
297 83706 26 11 30 11 30 Would it be beneficial to also indicate where largest/smallest warming as compared to natural variability occurs? (Katharine Mach, IPCC WGII TSU)
The paragraph addressing changes in seasonal temperature, which also includes assessment of the magnitude of change relative to the variability, has been moved up to directly follow the identified paragraph. This change also has the benefit of providing greater coherence to the text by grouping the annual and seasonal temperature paragraphs together and the annual and seasonal precipitation paragraphs together.
298 62800 26 11 33 0 0 Figure 26-4 had data going beyond the axis (Dominique Bachelet, Conservation Biology Institute) This figure has been removed.
299 64392 26 11 41 11 51 This paragraph can be deleted (or greatly reduced) because it repeats the same information presented graphically in figures 26-3 and 26-4. (Don Lemmen, Canada National Study)
The text provides a description to guide the reader through the North American version of the cross-chapter figures. The text has been streamlined where appropriate.
300 80923 26 11 41 11 51 I find these qualifiers 'Likely changes' and 'Very likely changes' as written to be somewhat confusing. What is the difference between them? Are these IPCC terms? (Rebecca R. Hernandez, Stanford University / Carnegie Institution for Science)
The text follows the IPCC uncertainty guidance.
301 80922 26 11 51 0 0 wide-spread to widespread (Rebecca R. Hernandez, Stanford University / Carnegie Institution for Science) The text has been edited as suggested.

IPCC WGII AR5 Chapter 26 SECOND-ORDER DRAFT
Government and Expert Review Page 24 of 68 28 March - 24 May 2013
# ID ChFrom Page
From Line
To Page
To Line Comment Response
302 76845 26 11 53 11 54 What is the" 2016-2035 period of RCP2.6"? Isn't this the same period as RCP8.5 and RCP4.5? (Michael Scott, Pacific Northwest National Laboratory)
The text has been edited to read “the 2016-2035 period in RCP2.6”.
303 75212 26 11 53 12 11 26.2.2.2 : The final paragraph of this section only cites the work of Diffenbaugh et al. Is there a broader literature on signal-to-noise ratios of climate projections over N America that can be included here? (UNITED STATES OF AMERICA)
References to Duffy and Tebaldi (2012) and Battisti and Naylor (2009) have been added to the extreme seasons paragraph, and an additional paragraph has been added citing additional sources of literature on projected changes in extremes (including likelihood statements based on formal significance testing).
304 75213 26 11 53 12 11 26.2.2.2 : The first sentence of this paragraph is logically unrelated to the rest, which addresses signal-to-noise ratio as measure of climate change robustness. Please provide some interpretation of these results. Does the finding of lower signal-to-noise ratio over the central US imply that climate change there will be less significant? Or does it mean that it will simply be harder to detect given high natural variability. (UNITED STATES OF AMERICA)
The discussion of sign-to-noise ratio has been removed. Text has also been added stating that the projected lower signal-to-noise ratio over the central and southeastern U.S. is similar to the observed pattern of temperature trend significance in the U.S.
305 64393 26 12 1 12 11 The signal to noise discussion is more appropriate for WGI. If retained here it should be simplified down tp the key messages. (Don Lemmen, Canada National Study)
The discussion of sign-to-noise ratio has been removed.
306 80924 26 12 4 12 7 "The CMIP5 and CMIP3 ensembles suggests that the response of warm-season temperatures to elevated radiative forcing exhibits higher signal-to-noise ratio than the response of cold-season temperatures (Diffenbaugh and Scherer, 2011; Kumar et al., 2012), ..." which means....? Instead of going into another statement, I think these two statements should be explained so that the reader knows what this means. (Rebecca R. Hernandez, Stanford University / Carnegie Institution for Science)
The length allotted to this section is very limited. As noted by another reviewer, explanation of signal-to-noise ratio is more appropriate for WGI.
307 71428 26 12 13 0 38 The two paragraphs appear to provide contradictory information. The first paragraph states that CMIP5 projects that winter precipitation in Canada and Alaska will increase and the second paragraph states that the same model projects substantial decreases in snow accumulation in Canada. The authors should clarify this information. (CANADA)
Text has been added to clarify that the decreases in snow accumulation over the U.S. and Canada suggest that the increases in cold-season precipitation over these regions reflect a shift towards increasing fraction of precipitation falling as rain rather than snow.
308 75214 26 12 13 12 16 26.2.2.2 : Unclear how NAO affects climate impacts. (UNITED STATES OF AMERICA) This statement links to the WGI discussion of climate processes that are important for the CMIP5-projected changes in precipitation.
309 57937 26 12 22 12 23 “…not all CMIP5 models simulate the …..(Kumar et al. 2012)”. Kumar et al. 2012 is not the right reference for this. The right reference is Kumar et al. (2013). Reference: Kumar S., V. Merwade, J. Kinter III, D. Niyogi (2013). Evaluation of Temperature and Precipitation Trends and Long-term Persistence in CMIP5 20th Century Climate Simulations. Journal of Climate. doi:10.1175/JCLI-D-12-00259.1, in press (Sanjiv Kumar, Center for Ocean-Land-Atmosphere Studies)
The reference has been changed as suggested.
310 62801 26 12 22 12 23 what is the proportion of CMIP5 models that do simulate the observed recent hydrologic trend in western North America? Important to know whether it is most or only a small fraction (Dominique Bachelet, Conservation Biology Institute)
This information was not assessed in the published work cited in this paragraph, and the reviewer did not provide a reference for this information.
311 75215 26 12 25 12 25 It is not clear what is meant by "aggregate climate change" in this sentence. (UNITED STATES OF AMERICA) This sentence has been removed.
312 83707 26 12 25 12 25 It would be helpful to specify what is meant by "aggregate" here. (Katharine Mach, IPCC WGII TSU) This sentence has been removed.
313 75216 26 12 25 12 27 26.2.2.2 : Please clarify why Mexico and the Western US are singled out here. Figures 26-3 and 26-4 indicate the greatest levels of mean temperature and precipitation change over Canada, not Mexico and the Western US. Does this statement relate to the signal-to-noise findings mentioned above? To changes in extreme values? The rest of the paragraph discusses extreme climate changes in Canada, so this appears to be an inaccurate lead sentence for the paragraph. (UNITED STATES OF AMERICA)
The sentence about aggregate climate change has been removed.
314 57938 26 12 27 12 26 These sentences are not clear to me. For example “…. 20th century maximum during the 2070-2099 period…”. How 2070-2099 can be associated with the 20th century? Please clarify. (Sanjiv Kumar, Center for Ocean-Land-Atmosphere Studies)
The text has been edited to clarify that the exceedences of the late 20th century threshold value is being quantified.

IPCC WGII AR5 Chapter 26 SECOND-ORDER DRAFT
Government and Expert Review Page 25 of 68 28 March - 24 May 2013
# ID ChFrom Page
From Line
To Page
To Line Comment Response
315 83708 26 12 30 12 31 For these projected outcomes, is it possible to also specify the ranges/uncertainties around the central estimates? The same applies to lines 34-37. (Katharine Mach, IPCC WGII TSU)
Statements of the ensemble signal-to-noise ratios that are shown in the figure have been added.
316 75217 26 12 41 12 43 26.3.3.1 : There are more than two relevant citations for this topic - suggested additions are listed in the recommended citations for this entire section (comment below). (UNITED STATES OF AMERICA)
This comment is unclear but we have addressed all the USA comments related to water resources.
317 75218 26 12 41 15 50 26.3 : Please distinguish, as much as possible, between impacts that are attributed to climate change, and those that may occur without climate change. This is a difficult distinction, but some disscusion is needed. For example, it would be helpful to label the cited studes as to whether they contain "direct", "indirect" or "related example" of climate change impacts/adaptations, defined as follows: (1) Direct are directly linked to climate change (e.g. a study of climate change induced impacts on water resources); 2) Indirect are indirectly linked to climate change (e.g., the types of temperature changes projected to occur with climate change have an impact on a water resources); 3) Related, are not linked to climate change (explicitly), but provide an example of a likely climate change outcome based on related factors (e.g. temperate increases, reduced snowpack, increased rainfall). (UNITED STATES OF AMERICA)
We have improved attribution in the Section 26.3.1
318 83709 26 12 43 0 0 Section 26.3.1. Should this section further address the observed impacts related to precipitation trends, more than done on the top of page 13? (Katharine Mach, IPCC WGII TSU)
Due to space limitations, we have focused our attention on liquid water itself, not on the drivers of water production such as precipitation and temperature.
319 75219 26 12 43 13 3 I have several comments on this section: 1) The section is too narrowly focused. Consider adding observed impacts on surface runoff (including the volume and timing) and precipitation. 2) Greater consistency is needed when describing impacts on water resources. For example, the water quality section describes the impacts on water quality and how those impacts affect water systems (as a secondary impact). The flooding section focuses almost entirely on the frequency and intensity of flooding with little discussion on how that can then affect water systems. 3) Consider changing the "instream uses" to water demand. Water demand will also be affected by climate change and that should be made more explicit. (UNITED STATES OF AMERICA)
1) As noted above, due to space limitations, we have focused our attention on liquid water itself, not on the drivers of water production such as precipitation and temperature. 2) Each of the sections does include some material on impact itself and the impacts on stakeholders, which we believe is adequate given space limitations. 3) Section 26.3.3.1 does include some references to demand changes due to climate change. These have been further clarified.
320 80870 26 12 43 13 4 Consider to include the analysis from: (Fabiola S. Sosa-Rodriguez, University of Waterloo) Incomplete reference provided.
321 80871 26 12 43 13 4 Murdock et al. (2007). Preliminary Analysis of Climate Variability and Change in the Canadian Columbia River Basin: (Fabiola S. Sosa-Rodriguez, University of Waterloo)
We were unable to include this citation because of space limitations, but think that this article would not add much to the chapter.
322 80872 26 12 43 13 4 Focus on Water Resources. (Fabiola S. Sosa-Rodriguez, University of Waterloo) Incomplete reference provided.
323 80873 26 12 43 13 4 Bruce, J; Burton, I; Martin, H; Mills, B; Mortsch, L (2002). Vulnerability and Adaptation to Climate Change. Final Report. (Fabiola S. Sosa-Rodriguez, University of Waterloo)
Article was published before the AR4 was published
324 75222 26 12 45 12 0 26.3.1 : Given projections that storm tracks will shift poleward as a result of climate change, one might not expect a continental scale trend in drought. This sentence implies that the lack of a continental drought trend is inconsistent with projections. Please rephrase or clarify that this is the intended message. (UNITED STATES OF AMERICA)
This has been clarified.
325 75220 26 12 45 12 45 26.3.1 : Please highlight which studies of drought are showing climate-induced drought (or some level of attribution) versus those numerous studies that are observational without climate change attribution. (UNITED STATES OF AMERICA)
This has been done.
326 61658 26 12 45 12 48 What direction do these local trends have? Do they suggest increasing or decreasing drought occurrence? (European Union DG Research, Directorate Environment Climate Change & Environmental Risks Unit)
This has been clarified.
327 71429 26 12 45 12 48 Line 46: No section 26.2.2.1.1 - change to 26.2.2.1 . Lines 46-48: None of the references provided are suitable for statements about trends in drought for the Canadian Prairies. Recent studies of drought in the Canadian Prairies have tended to emphasize multi-decadal variability (see for example (Bonsal, B.R. et al., 2011. Drought research in Canada: A Review. Atmosphere-Ocean 49(4): 303-319; Bonsal, B.R. et al., 2012. An assessment of Canadian prairie drought: past, present and future. Climate Dynamics. Published online 28 June 2012) . Dai et al., 2011 (Drought under global warming; a review. Wiley Interdisciplinary Reviews: Climate Change. Vol 2 Issue 1 pp 45-65) state that “recent regional trends towards more severe drought conditions were identified over southern and western Canada”. (CANADA)
We have expanded section 26.3.1.

IPCC WGII AR5 Chapter 26 SECOND-ORDER DRAFT
Government and Expert Review Page 26 of 68 28 March - 24 May 2013
# ID ChFrom Page
From Line
To Page
To Line Comment Response
328 75221 26 12 45 12 48 How likely are the local trends reported here to be anomalous or within the bounds of long-term drought patterns? It would be useful here to add a statement expressing the likelihood that the local observations of drought are within or outside of long-term drought cycles. (UNITED STATES OF AMERICA)
We have addressed these in Section 26.3.1.
329 77075 26 12 45 12 48 Would be wise to include something in here about possible changes in the severity and/or duration of seasonal drought. Seasonal (summer) droughts are becoming longer and more severe as snowpacks decrease and melt earlier, and summer ET losses increase. One example is the Cowichan region of southwestern Canada, where implications for migrating salmon have become acute. It also bears explicitly mentioning in this passage of the text that such climate change-related increases in seasonal drought may often be compounded by water management and urbanization issues. (Sean Fleming, Meteorological Service of Canada)
We have addressed these in Section 26.3.1.
330 75223 26 12 52 12 54 26.3.1 : It seems that this sentence is implying that increased rain/flood events can not be attributed to climate change. If this is not the intent, re-phrase; if this is the intent, authors should cite the literature that supports this position. (UNITED STATES OF AMERICA)
We have addressed these in Section 26.3.1.
331 57939 26 13 2 13 3 Following additional reference may be helpful here. Kumar, S., V. Merwade, J. Kam and K. Thurner (2009), Streamflow trends in Indiana: effects of long term persistence, precipitation and subsurface drains, Journal of Hydrology, Vol. 374 (1-2), pp. 171–183 (Sanjiv Kumar, Center for Ocean-Land-Atmosphere Studies)
Reviewed and added in 26.3.1.
332 75224 26 13 2 13 3 26.3.1 : There are many studies on climate change and stream flow trends, particularly in the US arid west; there should be more than one citation. If there is only to be one citation, unique results from this particular study should be mentioned. (UNITED STATES OF AMERICA)
We have addressed these in Section 26.3.1.
333 77076 26 13 2 13 3 A more complete description of streamflow trends with more literature citations is required for the US; and streamflow trends for Canada and Mexico are missing altogether from this section! This is a glaring error that really needs to be fixed. (Sean Fleming, Meteorological Service of Canada)
More information on Mexico and Canada has been added to this section . Thank you for the observation.
334 75225 26 13 6 13 20 This section seems out of place here. Consider starting section 26.3 with an overview on water resource conditions in the U.S., including demand, quality, and status of infrastructure. Acknowledge that population and economic growth, decaying infrastructure, declining water quality, etc. are putting pressure on water resources and that climate change will exacerbate this. (UNITED STATES OF AMERICA)
These concepts were added to the chapter introduction.
335 75226 26 13 6 14 34 26.3.2 and 26.3.3.1 : Please consider these water supply related citations for 26.3.3.1 for Mexico: Mexico: Metcalfe, S. and S. Davies (2007). "Deciphering recent climate change in central Mexican lake records." Climatic Change 83(1-2): 169-186. Mendoza, V. M., E. E. Villanueva and J. Adem (1997). "Vulnerability of basins and watersheds in Mexico to global climate change." Climate Research 9: 139-145. Liverman, D.M. and K.L. O'Brien (1991). "Global warming and climate change in Mexico." Global Environmental Change 1(5): 351-364. (UNITED STATES OF AMERICA)
All these older references were not included because of the need to assess new research.
336 75227 26 13 6 14 34 26.3.2 and 26.3.3.1 : Please consider these water supply related citations for 26.3.3.1. US National: Brian H. Hurd et al., "Climatic Change and U.S. Water Resources: From Modeled Watershed Impacts to National Estimates," JAWRA Journal of the American Water Resources Association 40, no. 1 (2004): 129-148, doi:10.1111/j.1752-1688.2004.tb01015.x. Hauer, F. R., J. S. Baron, D. H. Campbell, K. D. Fausch, S. W. Hostetler, G. H. Leavesley, P. R. Leavitt, D. M. McKnight and J. A. Stanford (1997). "Assessment of Climate Change and Freshwater Ecosystems of the Rocky Mountains, USA and Canada." Hydrological Processes 11(8): 903-924. Mulholland, P. J., G. R. Best, C. C. Coutant, G. M. Hornsberger, J. L. Meyer, D. J. Robinson, J. R. Stenberg, R. E. Turner, F. Vera-Herrera and R. G. Wetzel (1997). "Effects of Climate Change on Freshwater Ecosystems of the South-Eastern United States and Freshwater Ecosystems of the South Eastern United States and the Gulf Coast of Mexico." Hydrological Processes 11: 949-970. (UNITED STATES OF AMERICA)
All these older references were not included because of the need to assess new research.

IPCC WGII AR5 Chapter 26 SECOND-ORDER DRAFT
Government and Expert Review Page 27 of 68 28 March - 24 May 2013
# ID ChFrom Page
From Line
To Page
To Line Comment Response
337 75228 26 13 6 14 34 26.3.2 and 26.3.3.1 : Please consider these water supply related citations for 26.3.3.1. US Regions: Western US: Mohammad Safeeq et al., "Coupling Snowpack and Groundwater Dynamics to Interpret Historical Streamflow Trends in the Western United States," Hydrological Processes 27, no. 5 (2013): 655-668, doi:10.1002/hyp.9628. Wilkins, D. E. (1997). Studies of Basin Reponse to Abrupt Climate Change: the Trans-Pecos Closed Basin, West Texas and South-Central New Mexico. Department of Geography, University of Utah. California, US: Cayan, D. , A. Luers, M. Hanemann, G. Franco and B. Croes (2006). Scenarios of climate change in California: an overview. San Diego, CA, California Climate Change Center, Scripps Institution of Oceanography: 53. Vicuna, S., E.P. Maurer, B. Joyce, J.A. Dracup and D. Purkey (2007). "The sensitivity of California water resources to climate change scenarios." Journal of the American Water Resources Association 43(2): 482. Joyce, B. , S. Vicuna, L. Dale, J. Dracup, M. Hanemann, D. Purkey and D. Yates (2006). Climate change impacts on water for agriculture in California: a case study in the Sacramento Valley. San Diego, CA, California Climate Change Center, Scripps Institution of Oceanography: 85. Medellin, J. , J. Harou, M. Olivares, J. Lund, R. Howitt, S. Tanaka, M. Jenkins, K. Madani and T. Zhu (2006). Climate warming and water supply management in California. San Diego, CA, California Climate Change Center, Scripps Institution of Oceanography: 49. Haddad, B. M. , L. Sloan, M. Snyder and J. Bell (2003). "Regional climate change impacts and freshwater systems: focusing the adaptation research agenda." International Journal of Sustainable Development 6(3): 265. Lund, J.R. , R.E. Howitt, M.W. Jenkins, T. Zhu, S.K. Tanaka, M. Pulido, M. Tauber, R. Ritzema and I. Ferriera (2003). Climate warming and California's water future. Sacramento, CA, California's Energy Commission; Center for Environmental and Water Resources Engineering, UC Davis: 86. California Climate Scenarios Assessment, accessed April 22, 2013, http://www.springer.com/earth+sciences+and+geography/atmospheric+science.... Jamie Anderson et al., "Progress on Incorporating Climate Change into Management of California's Water Resources," Climatic Change 87, no. 1 (March 1, 2008): 91-108, doi:10.1007/s10584-007-9353-1. Michael D. Mastrandrea et al., "Current and Future Impacts of Extreme Events in California," Climatic Change 109, no. 1 (December 1, 2011): 43-70, doi:10.1007/s10584-011-0311-6. Judith Z. Drexler et al., "Fens as Whole-ecosystem Gauges of Groundwater Recharge Under Climate Change," Journal of Hydrology 481 (February 25, 2013): 22-34, doi:10.1016/j.jhydrol.2012.11.056. New York City, NY, US: Matonse et al., "Investigating the Impact of Climate Change on New York City's Primary Water Supply," Climatic Change 116, no. 3-4 (February 1, 2013): 437-456, doi:10.1007/s10584-012-0515-4. (UNITED STATES OF AMERICA)
With the exception of the first, all these older references were not included because of the need to assess new research. The first was not included as we believe we have sufficient material on this given space limitations.
338 75229 26 13 8 13 20 There is not an explicit connection to climate change in this section. The discussion of current conditions needs a link to vulnerability. (UNITED STATES OF AMERICA)
This material has been moved to section Introduction.
339 79113 26 13 13 13 13 Please do not start the sentence with number (10%) (Alejandro Monterroso, Universidad Autonoma Chapingo) The Editor has not commented upon this; thus we will let it stand.
340 80874 26 13 13 13 13 “10% to 30% of the water quality monitoring sites in Mexico have polluted or heavily polluted water” This information is related only to surface water. There are different percentages for groundwater. (Fabiola S. Sosa-Rodriguez, University of Waterloo)
We added surface water to clarify this.
341 62802 26 13 13 13 17 this paragraph is about water quality not water use as the title indicates (Dominique Bachelet, Conservation Biology Institute)
Good point. This material is being added to a new section Introduction.
342 75230 26 13 13 13 17 26.3.2 : Please explain how water quality/pollution relates to climate change, and/or change text to: "The current level of water pollution is not, in whole, attributable to climate change that has occured. The entirety of water pollution is important as context to understand the impacts of future cliamte change. This distinction should be made clear." This is related to other comments on this chapter requesting consistent distinction between impacts that are attributed to climate change and those that are not. (UNITED STATES OF AMERICA)
We were setting the context here and not attempting to attribute present WQ stresses to climate change. This material is being added to a new section Introduction.
343 76846 26 13 13 13 17 There are three different nations' methods of characterizing water quality here, so the meaning of the comparison is not clear. Can we put them on any sort of common footing? How does the Canadian "fair" relate to Mexico's "polluted" or USEPA's "supports fishing and swimming"? (Michael Scott, Pacific Northwest National Laboratory)
Good point. We assume that each nation describes the quality based upon goals that are meaningful to each nation and its citizens. Thus we are only concerned about the relative quality within each nation.
344 83710 26 13 13 13 17 Over what years do these statistics apply? (Katharine Mach, IPCC WGII TSU) We assume close to the year of the citation.

IPCC WGII AR5 Chapter 26 SECOND-ORDER DRAFT
Government and Expert Review Page 28 of 68 28 March - 24 May 2013
# ID ChFrom Page
From Line
To Page
To Line Comment Response
345 75231 26 13 14 14 0 26.3.2 and 26.3.3.1 : Please consider these water supply related citations for 26.3.3.1 for Canada. Arctic, CAN: Ford, J.D. , B. Smit, and J. Wandel (2006). Vulnerability to climate change in the Arctic: a case study from Arctic Bay, Canada. Guelph, Ontario (Canada): 55. Alberta, CAN: Ryan J. MacDonald et al., "Modelling the Potential Impacts of Climate Change on Snowpack in the North Saskatchewan River Watershed, Alberta," Water Resources Management 26, no. 11 (September 1, 2012): 3053-3076, doi:10.1007/s11269-012-0016-2. Canada: Pelley, J. (2004). "Climate change threatens Canadian water supply." Environmental Science & Technology 38(11): 200A-200A. (UNITED STATES OF AMERICA)
With the exception of the second, all these older references were not included because of the need to assess new research. The second was not included as we believe we have sufficient material on this given space limitations.
346 77077 26 13 16 13 17 "...in Canada's 16 most populated drainage basins reported..." Good - this point is worth mentioning. However, the author may also wish to note that it may be a less meaningful statistic than it seems. This is because some of the strongest water quality issues in Canada may be associated with natural resource extraction and processing industries, and much of that activity takes place in extremely remote parts of the country having very low populations, with implications more for ecosystems, fisheries, and tourism, and for safe water supply in small remote (rural, northern, and/or aboriginal) communities. I suggest doing a little more digging into the literature here. (Sean Fleming, Meteorological Service of Canada)
We added a reference to declining water quality in at least one basin outside of these areas.
347 83711 26 13 19 13 20 How much variation is seen across geographies and contexts? (Katharine Mach, IPCC WGII TSU) We made it clearer in the text that more information is in Section 26.7
348 64209 26 13 25 14 8 The publication The 1999-2005 Canadian Prairies Drought:Acience, Impacts and Lessons- R.Stewart & R. Lawford editors published by the Drought Research Initiative and CFCAS, 2011 looks at many of the aspects of cliamte processes that contributed to this drought event and pathways for portential adaptations. The drought was the worst expierneced in western Canada and resulted in significnat economic loss. http://www.meteo.mcgill.ca/dri/The%201999-2005%20Canadian%20Prairies%20Drought%20-%20Science,%20Impacts,%20and%20Lessons.pdf (Ian Church, Canadian Foundation for Climate and Atmospheric Science/ IPY Canada)
We appreciate the references. Given the space limitattions, however, we have sufficient material on Canadian prairie droughts.
349 75232 26 13 25 14 8 This section mixes impacts and adaptation options. For example, the discussion about transfers should be in the adaptation section. (UNITED STATES OF AMERICA)
This discussion really contains no material about adaptation. The material on transfers is just noting that present and perhaps future transfers can increase water stresses in some areas.
350 80875 26 13 30 13 39 Sosa-Rodriguez (2013) identified that “in the central region of Mexico, the mean annual temperature is likely to increase by up to 2.8 °C and the annual precipitation to decrease by 10.4 % from the 2020s to 2070s. These changes in temperature and precipitation may magnify pre-existing vulnerabilities arising from unmet water, energy and food demands, high demographic and economic activity, deforestation, and dependence on distant water sources”. (Fabiola S. Sosa-Rodriguez, University of Waterloo)
Citation added.
351 80876 26 13 30 13 39 Reference: Sosa-Rodriguez FS (2013). From Federal to City Mitigation and Adaptation: Climate Change Policy in Mexico City. Mitigation and Adaptation Strategies for Global Change Journal. (Fabiola S. Sosa-Rodriguez, University of Waterloo)
Added
352 75233 26 13 41 13 41 26.3.3.1 : It is unclear which impacts listed in this paragraph are attributable to climate change, versus which are important context for future effects of climate change. Please differentiate. (UNITED STATES OF AMERICA)
We clarified this.
353 76847 26 13 41 13 43 The "southwest" United States is mentioned. Is there anything specific to California in the recnet literature? (Michael Scott, Pacific Northwest National Laboratory)
There is material specific to CA but we do not look at that level of detail due to space limitations.
354 83712 26 13 43 13 45 For this projection, it would be preferable to specify the relevant scenarios of climate change and the ranges/uncertainties associated with the estimates. (Katharine Mach, IPCC WGII TSU)
This is not really possible to do: Seager does not present his quantative results in a summary manner and Geogakakos only states it qualitatively.
355 57881 26 13 45 0 0 The value of nearly 30% is reinforced by 24.1% in Table III in Nakaegawa et al. (2013) Nakaegawa, T., A. Kitoh, M. Hosaka. 2013: Discharge of major global rivers in the late 21st century climate projected with the high horizontal resolution MRI-AGCMs -overview-. Hydrological Processes. 27. DOI: 10.1002/hyp.9831 (Toshiyuki Nakaegawa, Meteorological Research Institute)
We appreciate the verification but we did not add this additional reference because the more localized research is more relevant here.

IPCC WGII AR5 Chapter 26 SECOND-ORDER DRAFT
Government and Expert Review Page 29 of 68 28 March - 24 May 2013
# ID ChFrom Page
From Line
To Page
To Line Comment Response
356 75234 26 13 45 13 46 26.3.3.1 : This needs a citation. Some references, and examples from California, US: H. J. Vaux Jr and Richard E. Howitt, "Managing Water Scarcity: An Evaluation of Interregional Transfers," Water Resources Research 20, no. 7: PP. 785-792, accessed September 27, 2010, doi:198410.1029/WR020i007p00785. Brent M. Haddad, Rivers of Gold: Designing Markets to Allocate Water in California (Island Press, 2000). Morris Israel and Jay R Lund, "Recent California Water Transfers: Implications for Water Management," Natural Resources Journal 35 (1995): 1. (UNITED STATES OF AMERICA)
Most of these are older references and we delieve the one current reference is sufficient.
357 75235 26 13 45 13 46 Change to “water transfers may entail...” rather than "will entail" or justify the certainty. (UNITED STATES OF AMERICA) We added "may" to this.
358 75236 26 13 46 13 47 It is not clear what is meant by social and cultural attributes here. Therefore, it is not apparent how or why they might be reduced by transferring water. Would the suggested reduction apply to both the area from which the water was transferred and the area to which the water was transferred? Changes in water availability certainly may lead to changes in social and cultural systems, but these might better be referred to as changes rather than reductions. Drier places do not have less culture per se. (UNITED STATES OF AMERICA)
This has been clarified.
359 75237 26 13 46 13 47 The "attributes" here are ambiguous. It is not clear what is meant by social and cultural attributes here. Therefore, it is not apparent how or why they might be reduced by transferring water. Would the suggested reduction apply to both the area from which the water was transferred and the area to which the water was transferred? Changes in water availability certainly may lead to changes in social and cultural systems, but these might better be referred to as changes rather than reductions. Drier places do not have less culture per se. (UNITED STATES OF AMERICA)
same as above.
360 83713 26 13 52 14 1 The logical contrast of these statements could perhaps be enhanced by inserting a transition such as "nonetheless" into "can remain" on line 54. (Katharine Mach, IPCC WGII TSU)
Done.
361 75238 26 14 1 14 4 26.3.3.1 : There are many studies on these impacts, and the listed impacts also pertain to the US west coast, not just the US east coast (as stated). Some recommendations are provided in the list of recommendations for this entire section (below). If only two citation are to be used to summarize this large list of impacts, for which there are many studies, please consider whether or not these two are the most comprehensive, or recent. (UNITED STATES OF AMERICA)
As the reviewer notes, there is much material on these impacts. We have tried to cover all the different hydrologic sections of NA with citations from represenative literature given space limitations.
362 77078 26 14 4 14 8 There have been quite a few other studies in various parts of Canada examining future runoff under climate change. At an absolute minimum, I suggest additionally consulting the prolific work done by the Pacific Climate Impacts Consortium (PCIC) in British Columbia, which has a very distinct climate from the rest of Canada. More broadly, it seems fair to say that some additional digging into the literature needs to be done. (Sean Fleming, Meteorological Service of Canada)
More material on Canada has been added.
363 75239 26 14 13 14 34 26.3.3.2. For as many of the projected impacts described in this section as possible, it needs to give a sense of where (what regions of NA), when (e.g., what part of century), and what level of climate change. (UNITED STATES OF AMERICA)
Locations are given. Not sufficient space to describe the detailed climate changes.
364 71430 26 14 18 0 0 Chen et al. 2011 does not refer to the point cited. Suggest reviewing. (CANADA) Thank you. This is for Line 8. Chen et al reported on the Manicouagan river basin in central Quebec, Canada. This has been corrected.
365 61659 26 14 19 14 19 What does "hypolimnetic" mean? (European Union DG Research, Directorate Environment Climate Change & Environmental Risks Unit)
This refers to the bottom layer of water in a thermally stratified lake.
366 75240 26 14 28 14 29 26.3.3.2 : How are the changes in "biological parameters and micropollutants" connected to climate change? (UNITED STATES OF AMERICA)
These are sensitive to temperature and runoff.
367 75241 26 14 33 14 3 Please clarify if this means "coastal" sewage collection systems (UNITED STATES OF AMERICA) Coastal sewer systems are threatened by higher sea levels because of resulting higher groundwater levels and, if there are coastal outfalls because it is a combined system, the higher sea levels will impede their drainage.

IPCC WGII AR5 Chapter 26 SECOND-ORDER DRAFT
Government and Expert Review Page 30 of 68 28 March - 24 May 2013
# ID ChFrom Page
From Line
To Page
To Line Comment Response
368 75242 26 14 37 14 47 26.3.3.3 : Please consider these rainfall intensity and flood related citations for 26.3.3.3. Flooding: US: Cynthia Rosenzweig et al., "Increased Crop Damage in the US from Excess Precipitation Under Climate Change," Global Environmental Change 12, no. 3 (October 2002): 197-202, doi:10.1016/S0959-3780(02)00008-0. Roger A. Pielke and Mary W. Downton, "Precipitation and Damaging Floods: Trends in the United States, 1932-97," Journal of Climate 13, no. 20 (October 2000): 3625-3637, doi:10.1175/1520-0442(2000)013<3625:PADFTI>2.0.CO;2. South-eastern US (Florida) and the US and Mexican Gulf Coast: Dingbao Wang, Scott C. Hagen, and Karim Alizad, "Climate Change Impact and Uncertainty Analysis of Extreme Rainfall Events in the Apalachicola River Basin, Florida," Journal of Hydrology 480 (February 14, 2013): 125-135, doi:10.1016/j.jhydrol.2012.12.015. Patrick J. Mulholland et al., "Effects of Climate Change on Freshwater Ecosystems of the South-Eastern United States and the Gulf Coast of Mexico," Hydrological Processes 11, no. 8 (1997): 949-970, doi:10.1002/(SICI)1099-1085(19970630)11:8<949::AID-HYP513>3.0.CO;2-G. California, US: Add flood impacts from (Hayhoe et al., 2004), already cited elsewhere in document. Michael Dettinger, "Climate Change, Atmospheric Rivers, and Floods in California - A Multimodel Analysis of Storm Frequency and Magnitude Changes," JAWRA Journal of the American Water Resources Association 47, no. 3 (2011): 514-523, doi:10.1111/j.1752-1688.2011.00546.x. Daniel R. Cayan et al., "Climate Change Projections of Sea Level Extremes Along the California Coast," Climatic Change 87, no. 1 (March 1, 2008): 57-73, doi:10.1007/s10584-007-9376-7. Tapash Das et al., "Potential Increase in Floods in California's Sierra Nevada Under Future Climate Projections," Climatic Change 109, no. 1 (December 1, 2011): 71-94, doi:10.1007/s10584-011-0298-z. Boston, Massachusetts, US: Pablo Suarez et al., "Impacts of Flooding and Climate Change on Urban Transportation: A Systemwide Performance Assessment of the Boston Metro Area," Transportation Research Part D: Transport and Environment 10, no. 3 (May 2005): 231-244, doi:10.1016/j.trd.2005.04.007. Canada Jan Adamowski, Kaz Adamowski, and John Bougadis, "Influence of Trend on Short Duration Design Storms," Water Resources Management 24, no. 3 (February 1, 2010): 401-413, doi:10.1007/s11269-009-9452-z. Huang, Y. , Y. Zou, G. Huang, M. Imran and C. Amit (2005). "Flood vulnerability to climate change through hydrological modeling: a case study of the Swift Current Creek watershed in Western Canada." Water International 30(1): 31-39. Athanasios Loukas, Lampros Vasiliades, and Nicolas R. Dalezios, "Climate Change Implications on Flood Response of a Mountainous Watershed," Water, Air and Soil Pollution: Focus 4, no. 4-5 (October 1, 2004): 331-347, doi:10.1023/B:WAFO.0000044809.79328.9d. Loukas, A., L. Vasiliades and N. R. Dalezios (2002). "Potential climate change impacts on flood producing mechanisms in southern British Columbia, Canada using the CGCMA1 simulation results." Journal of Hydrology 259(1-4): 163-188. (UNITED STATES OF AMERICA)
Many of these are pre 2007 and do not add significantly to the assessment.
369 75243 26 14 39 14 39 26.3.3.3 : Unclear whether citations are studies of North America or multiple case studies within North America (UNITED STATES OF AMERICA)
Flooding section has been expanded to have more locational detail.
370 64394 26 14 43 0 0 Unclear what "southern Quebec basin" is referring to (possibly Peribonka River watershed, Minville et al 2010??). There should be references associated with this sentence. (Don Lemmen, Canada National Study)
This refers to the Gatineau River and we added to text.
371 76848 26 14 43 14 43 After" e.g. Quebec", I would have expected to find a citation. (Michael Scott, Pacific Northwest National Laboratory) Citation added.
372 61660 26 14 43 14 47 What about flooding by hurricanes as happened in New York with Hurricane Sandy? Are there any projections of how events like this may change in the future? (European Union DG Research, Directorate Environment Climate Change & Environmental Risks Unit)
This was added to section 26.3.3.3, Table 14.3 of WG1 projects with medium to high confidence increases in extreme precipitation associated with tropical (near the center) and extratropical storms. This will also lead to more urban flooding.
373 83714 26 14 47 14 47 It may be clearest to indicate explicitly "business as usual emissions scenario" here if that is what is meant. (Katharine Mach, IPCC WGII TSU)
This has been clarified.
374 75244 26 14 50 15 7 26.3.3.4 : Please consider additional citations provided in recommendations for section 26.3.3.1 Water Supply, and also references specifically to hydropower in: Joshua H. Viers, "Hydropower Relicensing and Climate Change1," JAWRA Journal of the American Water Resources Association 47, no. 4 (2011): 655-661, doi:10.1111/j.1752-1688.2011.00531.x. ; CCSP (2007). Effects of Climate Change on Energy Production and Use in the United States . A Report by the U.S. Climate Change Science Program and the subcommittee on Global change Research. Wilbanks, T.J., V. Bhatt, D.E. Bilello, S.R. Bull, J.Ekmann, W.C. Horak, Y.J. Huang, M.D. Levine, M.J. Sale, D.K. Schmalzer, and M.J. Scott. Department of Energy, Office of Biological & Environmental Research, Washington, DC, USA. (UNITED STATES OF AMERICA)
We have space limitations and cannot include all references.

IPCC WGII AR5 Chapter 26 SECOND-ORDER DRAFT
Government and Expert Review Page 31 of 68 28 March - 24 May 2013
# ID ChFrom Page
From Line
To Page
To Line Comment Response
375 75259 26 15 0 15 0 The text states that "Most of the project-level adaptation actions are no-regret actions" but this claim is not supported and does not need to be made. The examples in the text could be considered no-regret, but they aren't necessarily, such as deeper water docks, extra capacity culverts. It would be better to reorganize this section by type of action. The section already has reducing leaks/encouraging efficiency, addressing infrastructure capacity (rainwater capture/culverts), and institutional shifts/agreements. Others are left out, such as many adaptations in the water sector include managing for uncertainty and anticipatory governance. References include o Quay, R. (2010) Anticipatory Governance. Journal of the American Planning Association 76, 496-511. (Denver and two other cities planning for future change) o Groves & Lempert (96) apply RDM to long-range water planning in California. (UNITED STATES OF AMERICA)
The no-regret statement was left in because it is important. Some of the adaptation examples given are no-regret such as green infrastructure for storm water management. While we do not include all examples of adaptation, we do incluude some non structural approaches - but not Anticipatory Governance.
376 75245 26 15 1 15 5 It would be helpful to indicate how changes in projected hydropower generation relate to demand, both today's demand and the projected demand, if that information is available. (UNITED STATES OF AMERICA)
This is outside scope of this section.
377 83715 26 15 1 15 5 For projections given on lines 1-2 and 4, it would be preferable to specify the ranges/uncertainties for the projected values. What scenarios of climate change are relevant, additionally? (Katharine Mach, IPCC WGII TSU)
There is insufficient space to add all the details. The analysis was done with several emission scenarios and we report the approximate changes, which are consistent across the scenarios. This has been clarified.
378 75246 26 15 1 15 7 Changes in water cycle are described without saying what the level of climate change was for these predictions. (UNITED STATES OF AMERICA)
There is not sufficient space for this detail.
379 61661 26 15 6 15 6 State 'low river levels during droughts' to make the point clearer. (European Union DG Research, Directorate Environment Climate Change & Environmental Risks Unit)
Added
380 64207 26 15 10 15 23 I note there is no mention of water withdrawls for energy production- fracking, Athabasca tar sands etc. (Ian Church, Canadian Foundation for Climate and Atmospheric Science/ IPY Canada)
We have combined this section with 26.7.3 and it now includes a reference to fracking.
381 75247 26 15 10 15 23 This section should also mention Cooley et al. 2011, which evaluates how relying more heavily on energy efficiency, low water use renewables, and dry cooling systems can dramatically reduce water withdrawals and consumption for electricity generation. Cooley, H., Fulton, J., & Gleick, P.H. (2011). Water for energy: future water needs for electricity in the Intermountain West. Pacific Institute: Oakland, CA. Also, should mention other factors that may increase the energy requirements for water systems: more rigorous water quality requirements, more energy intensive supplies (e.g., desalination), and population and economic growth in dry regions. Also need to discuss how conservation and efficiency can save both water and energy. It is thus an adaptation and mitigation strategy. (UNITED STATES OF AMERICA)
This section has been moved to another section in this chapter and responded to there.
382 75248 26 15 14 15 15 26.3.3.5 : Nowhere in this document does it mention a prediction of climate change affecting thermoelectric power generation to back up the claim that it makes. If this claim is to be made, the authors need to provide a citation for this - it's not in Kenny et al, 2009. A possible source: USGCRP (2009). Global Climate Change Impacts in the United States . Karl, T.R., J.M. Melillo, and T.C. Peterson (eds.). United States Global Change Research Program. Cambridge University Press, New York, NY, USA. Otherwise, a suggested rephrasing is: "Cooling of USA thermoelectric power plants may affect thermoelectric generation where surface water supplies are reduced in the eastern U.S." [this would be the IPCC's words unless they found a citation for this]. 84% of total U.S. thermoelectric withdrawals are from eastern states, and total thermoelectric withdrawals accounts for 49% of non-consumptive water withdrawals (Kenny et al., 2009)." (UNITED STATES OF AMERICA)
This section has been moved to another section in this chapter and responded to there.
383 75249 26 15 14 15 15 26.3.3.5. This statement needs to be clarified, otherwise it is misleading and alarming in terms of priorities for water management with climate change. First, 84% of thermoelectric water withdrawals occur in eastern states. Second, consumptive use of water withdrawals for thermoelectric is a small percentage of the total withdrawn. (See p.38 in Kenny et al.) Much of thermoelectric water withdrawals are returned to streams and reused downstream. (UNITED STATES OF AMERICA)
This section has been moved to another section in this chapter and responded to there.

IPCC WGII AR5 Chapter 26 SECOND-ORDER DRAFT
Government and Expert Review Page 32 of 68 28 March - 24 May 2013
# ID ChFrom Page
From Line
To Page
To Line Comment Response
384 71431 26 15 21 15 23 Saying "energy production mitigation measures" does not make sense. The goal is to mitigate climate change, not energy production. Also, the examples provided here are technology options, they are not measures (i.e., a technology is not a measure per se; a measure is something that facilitates the deployment of these technologies). Finally, not all climate change mitigation options will exacerbate stress on water supply (e.g. wind energy does not impact water supply). Therefore, suggest rephrasing the sentence to: "However, some climate change mitigation options related to energy production, such as carbon capture and storage, nuclear power, and some biofuels will exacerbate stresses on water supplies and quality." (CANADA)
This section has been moved to another section in this chapter and responded to there.
385 64395 26 15 26 15 50 This section, and most of the others in this chapter with the same subheading, is really just a listing of examples of adaptation actions being taken with no significant analysis / assessment. In this case the first sentence is the limit of the analysis. As such, it is difficult to conclude much more than "some adaptation is happening". If the literature supports stronger conclusions, these should be made. (Don Lemmen, Canada National Study)
More assessment has been added.
386 75250 26 15 26 15 60 Suggested addition to this section: Furniss et al. 2010 is an excellent climate/water resource for the forest sector to cite and discuss. It provides several suggestions for water-related adaptation principles that could be summarized in a forest sector sentence or two. Furniss, Michael J.; Staab, Brian P.; Hazelhurst, Sherry; Clifton, Cathrine F.; Roby, Kenneth B.; Ilhadrt, Bonnie L.; Larry, Elizabeth B.; Todd, Albert H.; Reid, Leslie M.; Hines, Sarah J.; Bennett, Karen A.; Luce, Charles H.; Edwards, Pamela J. 2010. Water, climate change, and forests: watershed stewardship for a changing climate. Gen. Tech. Rep. PNW-GTR-812. Portland, OR: U.S. Department of Agriculture, Forest Service, Pacific Northwest Research Station. 75 p. (UNITED STATES OF AMERICA)
This is interesting but considered outside the scope of this section.
387 75251 26 15 28 15 28 In the Adaptation context, terms have specific meanings. Please define what a "project" is and what "project-level" adaptations refers to. (UNITED STATES OF AMERICA)
The wording has been changed.
388 75252 26 15 28 15 28 The term "no regret" is used in different ways by different audiences so we recommend that it be defined if used. (UNITED STATES OF AMERICA)
Due to space limitations, we have not defined.
389 83716 26 15 28 15 28 Given terminology used in the report, would "low-regret policies" be a preferable phrase? (Katharine Mach, IPCC WGII TSU) This is a good point. We prefer no regret as more common term.
390 64208 26 15 28 15 29 When the Dam was last upgraded 1n the 1960s it resulted in extensive public opposition in British Columbia re the areas of the Skagit Valley that were being flooded. Raising the dam would back the reservoir up further into BC. The area is now a provincial park. (Ian Church, Canadian Foundation for Climate and Atmospheric Science/ IPY Canada)
This is interesting and was seen in the literature. The point, however, is that the dam was designed to be expanded over time from a construction point of view.
391 75253 26 15 28 15 41 26.3.4 : Requires a definition of "hard" and "soft" adaptations (reference to the executive summary) as well as "no regret" adaptation with cited examples of each. (UNITED STATES OF AMERICA)
References to hard and soft removed.
392 75254 26 15 28 15 50 This section begins with a statement that most of the project-level adaptation actions are no-regret policies. This is not necessarily true. Desalination is an energy intensive process but some coastal communities are considering it as a way to improve reliability. Likewise, some are discussing increased reliance on seawalls and levees, which may increase vulnerability in the long term. The use of the term "no-regret" is not clear; it's not informative to simply state "no-regrets" without adequate context about related costs and benefits. (UNITED STATES OF AMERICA)
We generalized the statement about no regrets.
393 64396 26 15 32 15 33 Better references for the Regina example are Sauchyn and Kulshreshtha (2008 - citation to follow) and Richardson 2010 (already in reference list). Citation - Sauchyn, D. and Kulshreshtha, S. (2008): Prairies; in From Impacts to Adaptation: Canada in a Changing Climate 2007, edited by D.S. Lemmen, F.J.Warren, J. Lacroix and E. Bush; Government of Canada, Ottawa, ON, p. 275-328. (Don Lemmen, Canada National Study)
We decided this reference was sufficient.
394 79076 26 15 35 15 35 Please use SI units of measurement throughout the report. (Joachim Rock, Johann Heinrich von Thuenen-Institute, Federal Research Institute for Rural Areas, Forestry and Fisheries)
We converted to meters. Thank you.

IPCC WGII AR5 Chapter 26 SECOND-ORDER DRAFT
Government and Expert Review Page 33 of 68 28 March - 24 May 2013
# ID ChFrom Page
From Line
To Page
To Line Comment Response
395 75255 26 15 43 15 50 26.3.4 : Please consider these water supply related citations for 26.3.4. Adaptations: Canada: Shepherd, P. , J. Tansey and H. Dowlatabadi (2006). "Context matters: what shapes adaptation to water stress in the Okanagan?." Climatic Change 78(1): 31-62. Crabbe, P. and M. Robin (2006). "Institutional adaptation of water resource infrastructures to climate change in Eastern Ontario." Climatic Change 78(1): 103-133. Cohen, S., D. Neilsen, S. Smith, T. Neale, B. Taylor, M. Barton, W. Merritt, Y. Alila, P. Shepherd, R. McNeill, J. Tansey, J. Carmichael and S. Langsdale (2006). "Learning with local help: Expanding the dialogue on climate change and water management in the Okanagan region, British Columbia, Canada." Climatic Change 75(3): 331-358. Resource Futures International (RFI) (2004). Walpole Island First Nation: evaluation of climate change impacts and adaptation options. Ottawa, Ontario, Resource Futures International (RFI); Natural Resources Canada: 40. Bruce, J.P. , H. Martin, P. Colucci, G. McBean, J.McFougall, D. Shrubsole, J. Whalley, R. Halliday, M. Alden, L. Mortsch and B. Mills (2003). Climate change impacts on boundary and transboundary water management. Ottawa, Ontario (Canada), Natural Resources Canada: 307. (UNITED STATES OF AMERICA)
Many of these are pre 2007 and, due to space limitations, we do not spend much space on institutional aspects of adaptation.
396 75256 26 15 43 15 50 26.3.4 : Please consider these water supply related citations for 26.3.4. Adaptations: US: Brikowski, T. and W. Anderson (2006). Droughts and reservoirs: finding storage space underground. Managing Drought & Water Scarcity in Vulnerable Environments: Creating a Roadmap for Change in the United States. Longmont, CO, Geological Society of America (GSA). California, US: David R. Purkey et al., "Integrating a Climate Change Assessment Tool into Stakeholder-driven Water Management Decision-making Processes in California," in Integrated Assessment of Water Resources and Global Change, ed. Eric Craswell et al. (Springer Netherlands, 2007), 315-329, http://link.springer.com/chapter/10.1007/978-1-4020-5591-1_19. Lach, D., H. Ingram and S. Rayner (2003). Coping with climate variability: municipal water agencies in southern California. Climate and water: transboundary challenges in the Americas. H.F. Diaz and B.J. Morehouse. The Netherlands, Kluwer Academic Publishers: 59-81. Tanaka, S. K. , T. Zhu, J. R. Lund, R. E. Howitt, M. W. Jenkins, M. A. Pulido, M. Tauber, R. S. Ritzema and I. C. Ferreira (2006). "Climate warming and water management adaptation for California." Climatic Change 76(3-4): 361-387. California Department of Water Resources (2006). Progress on incorporating climate change into management of California's water resources. Sacramento, CA, California Department of Water Resources: 339. The Pacific Institute, California Farm Water Success Stories (Oakland, CA: The Pacific Institute, December 2011), http://www.pacinst.org/reports/success_stories/index.htm. ; Juliet Christian-Smith and Peter H. Gleick, A Twenty-First Century U.S. Water Policy (Oxford University Press US, 2012), http://www.oup.com/us/catalog/general/subject/Sociology/EnvironmentTechn.... Laura J. Stroup, "Adaptation of U.S. Water Management to Climate and Environmental Change," The Professional Geographer 63, no. 4 (2011): 414-428, doi:10.1080/00330124.2011.604010. (UNITED STATES OF AMERICA)
Due to space limitations, we do not include these.
397 75257 26 15 43 15 50 26.3.4 : Please consider these water supply related citations for 26.3.4. Adaptations: Mexico: Eakin, H., V. Magana, J. Smith, J.L. Moreno, J.M. Martinez and O. Landavazo (2007). "A stakeholder driven process to reduce vulnerability to climate change in Hermosillo, Sonora, Mexico." Mitigation and Adaptation Strategies for Global Change online. Levina, E. (2006). Domestic policy frameworks for adaptation to climate change in the water sector - part II: non-annex I countries - lessons learned from Mexico, India, Argentina and Zimbabwe. Paris, Organisation for Economic Co-operation and Development (OECD): 70. (UNITED STATES OF AMERICA)
Due to space limitations, we do not include these
398 75258 26 15 43 15 50 26.3.4 : There is an entire literature (in water management, hydrology, soil and agricultural science, and economics fields) on water use efficiency in urban, industrial, and agricultural settings. If water efficiency is to be mentioned, the broad literature on this topic should be represented - at least in the form of multiple citations. (UNITED STATES OF AMERICA)
We realize this literature is very large and just tried to give some representative examples.
399 64397 26 15 48 0 0 Change "Quebec Province" to either "Province of Quebec" or simply "Quebec". (Don Lemmen, Canada National Study) Done.
400 71432 26 15 48 15 48 Replace the phrase "Quebec Province" with "The province of Quebec" (CANADA) See response to 399
401 77079 26 15 48 15 48 Change "Quebec Province" to "The province of Quebec" or "Quebec, Canada" (Sean Fleming, Meteorological Service of Canada)
See response to 399
402 75260 26 16 1 16 4 The citation provided is quite limited for the breadth of the statement; suggest using Vose et al. 2012. Vose, James M.; Peterson, David L.; Patel-Weynand, Toral 2012. Effects of climatic variability and change on forest ecosystems: a comprehensive science synthesis for the U.S. Gen. Tech. Rep. PNW-GTR-870. Portland, OR: U.S. Department of Agriculture, Forest Service, Pacific Northwest Research Station. 265 p. (UNITED STATES OF AMERICA)
Reference now added.

IPCC WGII AR5 Chapter 26 SECOND-ORDER DRAFT
Government and Expert Review Page 34 of 68 28 March - 24 May 2013
# ID ChFrom Page
From Line
To Page
To Line Comment Response
403 75262 26 16 1 18 0 26.4 : This section would be more useful if it took into account the different biomes of North America, and at the least was more comprehensive across the different forest types. Other ecosystems of concern include the North American Mediterranean forest / chaparral ecosystem, which is a large fire concern, contains 5M housing units, and is the only biodiversity hotspot in NA outside the tropics according to the IUCN. Also, text should distinguish between temperate, broad-leaved forests in the northeast, subtropical forests of Florida, and so on. Consider citing: Hammer RB, Radeloff VC, Fried JS, Stewart SI (2007) Wildland-urban interface housing growth during the 1990s in California, Oregon, and Washington. International Journal of Wildland Fire 16, 255-265. Askins, RA, F Chavez-Ramarez, BC Dale, CA Haas, JR Herkert, FL Knopf and PD Vickery. (2007). Ornithological Manuscripts, No. 64, Conservation of Grassland Birds in North America: Understanding Ecological Processes in Different Regions: Report of the AOU Committee on Conservation, pp. iii-viii, 1-46. (UNITED STATES OF AMERICA)
NA ecosystems is a broad topic and it was not possible to cover all ecosystems in similar depth within the space constraints. We have now better explained our selection of focus ecosystems and also included broader coverage in a few instances. Regarding the wildfire, the revised text covers ecosystems in all of western NA which includes the chaparral of California (box 26-2, page 19 lim 22-27) and peri-urban interface in p19 line 38.
404 75261 26 16 1 18 49 26.4 : Please address the negative effects and co-benefits climate change mitigation/adaptation measures may have on ecosystems and biodiversity. (UNITED STATES OF AMERICA)
Due to space limitations, we are unable to add any discussion of these.
405 80878 26 16 2 16 32 Consider to include the study of Peterson et al. (2002). Future projections for Mexican faunas under global climate change scenarios. Nature. (Fabiola S. Sosa-Rodriguez, University of Waterloo)
We have included relevant and new references about Mexican fauna in the revision.
406 80879 26 16 2 16 32 Consider to include the study of Gomez-Mendoza and Arriaga (2007). Modeling the effect of climate change on the distribution of oak and pine species of Mexico. Conservation Biology. (Fabiola S. Sosa-Rodriguez, University of Waterloo)
This section has been refocused away from forests and woodlands (which are covered in more depth in 26.4.2.
407 64398 26 16 3 16 32 While the final paragraph of this section provides the rationale for focusing on forests and coasts, it would be worth acknowledging in the preceding paragraphs the large number of vulnerable ecosystems in North America. Two that jump out are alpine, noting the absence of "adaptation space", and grasslands because of the role of other anthropogenic drivers. (Don Lemmen, Canada National Study)
We have added acknowledgement of this point and brief coverage of these issues in the preceding paragraphs. We have also explained clearly the reasons for focusing on forests and coastal systems in the subsequent sections.
408 75263 26 16 4 16 4 Could the phrase “consistent with warming trends” be added to send of first sentence? If not, what is connection to climate change? (UNITED STATES OF AMERICA)
We have included this phrase and also made the explicit connection to climate change that has been documented in the literature in a subsequent sentence.
409 75264 26 16 7 16 8 Do the citations in the previous statement also apply to the final sentence in this paragraph? If not, then citations should be inserted to support the statement about the interaction between climate-related range shifts and land use changes. (UNITED STATES OF AMERICA)
The citations apply to the sentence in which they are located. We have made sure to include an appropriate citation for the last sentence of the paragraph
410 75265 26 16 10 16 11 The citation provided is quite limited for the breadth of the statement; suggest using Glick et al. 2011. Also, the USDA Forest Service National Roadmap for Responding to Climate Change includes a Performance Scorecard that provides guidance for climate change vulnerability assessment and adaptation implementation in National Forests. Glick, P., Stein, B. A., & Edelson, N. A. (Eds.). (2011). Scanning the conservation horizon: A guide to climate change vulnerability assessment. Washington, DC: National Wildlife Federation. (UNITED STATES OF AMERICA)
We have included this reference.
411 80877 26 16 12 16 12 Replace “shift(Sholze et al….)” by shift_(Sholze et al….)” (Fabiola S. Sosa-Rodriguez, University of Waterloo) Change made
412 75266 26 16 12 16 14 This appears to suggest that droughts and floods are playing an increasing role in sea level rise and hurricanes, which is presumably not the intent of the authors. For example it would more clear as: "Building upon results presented in the AR4, studies have identified a more prominent role of extreme events (e.g., droughts and floods, infestation by fungi, sea level rise, hurricanes) in influencing North American ecosystems". (UNITED STATES OF AMERICA)
Phrase re-written for clarity.
413 75267 26 16 15 16 18 It would be useful to know if this projected reduction in primary production of carbon is expected to change North American forests from a net carbon sink to a carbon source. (UNITED STATES OF AMERICA)
This sentence has been removed because it was not directly relevant to North America. We agree that the projected reduction in primary production would be very useful to know but, to our knowledge, is currently highly uncertain and would not fit within space constraints.
414 75268 26 16 24 16 24 For the sentence: "Risk studies on 134 species in U.S." -- What kinds of species were modeled (Trees? Animals? Other types of species?) (UNITED STATES OF AMERICA)
We have removed this sentence in revising.

IPCC WGII AR5 Chapter 26 SECOND-ORDER DRAFT
Government and Expert Review Page 35 of 68 28 March - 24 May 2013
# ID ChFrom Page
From Line
To Page
To Line Comment Response
415 75269 26 16 29 16 32 This paragraph should include more explanation of why only forests and coastal systems are covered in this section on Ecosystems and Biodviersity. In particular, it is not clear what is meant by "where research advances since AR4 justify further exploration". Given the extensive focus of WGII Chapter 4 on forests (pages 35-42), it is also not entirely clear why the North America chapter also focuses almost entirely on forests. In particular, Box 4.2 in Chapter 4 (page 36) covers "Tree Mortality and Climate Change", a topic also discussed in Chapter 26. Care should be taken to make sure those sections are not redundant, and are well-coordinated. In Lines 31-32, the sentence should probably read "Additional synthesis of climate change impacts on ecosystems in general and terrestrial, coastal and ocean in particular can be found in Chapter 8 of the U.S. National Climate Assessment (Groffman et al. 2013) and AR5 WGII Chapters 4, 5 and 6". (UNITED STATES OF AMERICA)
We have included a more clear and direct rationale for why these ecosystems were highlighted for further exploration. In revising, we have made sure that this section is not redundant with the Ch 4 box. Finally, we have added the requested sentence referencing the US National Climate Assessment.
416 84862 26 16 37 0 0 Section 26.4.1.1: As mentioned in the context of the executive summary, this section does not provide clear support for the attribution to anthropogenic climate change discussed there. (Michael Mastrandrea, IPCC WGII TSU)
We have now provided appropriate support on this section, which is cross-referenced with the detection and attribution figure.
417 83717 26 16 39 16 42 The timeframe of these observations should be specified. (Katharine Mach, IPCC WGII TSU) Time-frame specified.
418 79114 26 16 45 16 45 Conafor is a federal institution of Mexico, please change to CONAFOR (Alejandro Monterroso, Universidad Autonoma Chapingo)
Change made
419 83718 26 16 48 16 50 It would be helpful to specify how much the average mortality rate increased as appropriate. (Katharine Mach, IPCC WGII TSU)
We have specified these mortality rates in the sentence.
420 75270 26 16 49 16 50 26.4.1 : Is this a percentage increase of the baseline average mortality rate or an increase in the absolute percentage of trees that die each year? Please list the baseline as well. (UNITED STATES OF AMERICA)
We have clarified this.
421 64210 26 17 4 17 8 To the best of my knowledge there has been no Mtn. Pine Beetle yet in Alaska - instead the Spruce Bark Beetle has resulted in major outbreaks in the southwest Yukon and parts of Alaska such as the Kenai Penninsula(I have searched the web to try and find something to prove Mt.Pine Beetle has been detected Alaska). Both beetles are the same genera but different species. However the current outbreak of the Mountain Pine Beetle is moving north out of south central British Columbia and in 2012 was detected as far north as 80 kilometers south of the 60th parrallel (the Yukon border). Forest Health Report 2012 Yukon Energy Mines and Resources http://www.emr.gov.yk.ca/forestry/pdf/forest_health_report_2012_web.pdf pages 8-15 . Mountain Pine Beetle ishas also crossed the Rocky MOuntains are infecting boreal and mountane forsests in Alberta. The concern is that they will spreadfurther east. (Ian Church, Canadian Foundation for Climate and Atmospheric Science/ IPY Canada)
We have made sure to speak specifically to mountain pine beetle in British Columbia in this point. In addition, we have included this Forest Health Report 2012 as a reference.
422 75271 26 17 4 17 8 Suggest that the last two sentences of this paragraph be revised to read "An estimated 18,177 km2 of U.S. forests have been affected (Williams et al. 2010). British Columbia, Canada experienced an even larger impact (Brown et al. 2010a), with mortality in over 7 million acres (Aukema et al. 2006)". It would be better if the last statement clarified whether the mortality in those 7 million acres was complete (i.e., all trees died) or elevated (i.e., higher mortality than in non-infected stands). (UNITED STATES OF AMERICA)
This sentence has been removed.
423 83719 26 17 4 17 8 Over what time frames have these impacts been observed? (Katharine Mach, IPCC WGII TSU) Time-frame specified.
424 64399 26 17 6 17 8 Given the rapid nature of the MPB outbreak I recommend you use the most recent statistics available to describe the size of the outbreak. In British Columbia the May 2012 figures were 18.1 million hectares of forest affected and 710 cubic metres of timber killed (http://www.for.gov.bc.ca/hfp/mountain_pine_beetle/Updated-Beetle-Facts_May2012.pdf). (Don Lemmen, Canada National Study)
We included the most recent statistics available in the revised version.
IPCC WGII AR5 Chapter 26 SECOND-ORDER DRAFT
Government and Expert Review Page 36 of 68 28 March - 24 May 2013
# ID ChFrom Page
From Line
To Page
To Line Comment Response
425 64804 26 17 11 17 31 Individual tree species have large climatic ranges, put provenances within a species can have a much narrow range and thus can become maladapted to the new climate. This will influence their growth and succeptibilty to disease. There is an extensive literature on this subject and it is a major driver behind using assisted migration of commercial conifer as an adaptation option to avoid maladaptation. As to which of the climates they may experience over their 60-100 year life is, of course, the big question. Rehfeldt, G. E., C. C. Ying, D. L. Spittlehouse, and D. A.Hamilton. 1999. Genetic responses to climate in Pinus contorta: niche breadth, climate change, and reforestation. Ecological Monographs 69:375–407. Leites, L.P., A.P. Robinson, G.E. Rehfeldt, J.D. Marshall and N.L. Crookston. 2012.Height-growth response to climatic changes differs among populations of Douglas-fir: a novel analysis of historic data. Ecological Applications 22:154–165. Aitken, S.N., S. Yeaman, J.A. Holliday, T. Wang, and S. Curtis-McLane. 2008. Adaptation, migration or extirpation: Climate change outcomes for tree populations. Evol. Appl. 1:95-111. Rehfeldt, G.E., and B.C. Jaquish. 2010. Ecological impacts and management strategies for western larch in the face of climate-change. Mitig. Adapt. Strateg. Glob. Change 15:283-306. (Dave Spitttlehouse, BC Ministry Forests, Lands and Natural Resource Operations)
This is a very good point, but unfortunately covering of this large literature is not possible within the space limitations we have here.
426 83720 26 17 13 17 14 Which ecosystems are meant by "these ecosystems" should be explicitly stated. (Katharine Mach, IPCC WGII TSU) We have stated these ecosystems.
427 83721 26 17 16 17 18 For what scenario of climate change is this outcome expected? (Katharine Mach, IPCC WGII TSU) We have included both the scenario and the climate models used.
428 75272 26 17 20 17 22 26.4.1.1 : Clarify first sentence. Unclear what "major changes" will occur in forest soil. And what are the decreases in growing season "subsequent" to? (UNITED STATES OF AMERICA)
This sentence has been revised to clarify confusion.
429 75273 26 17 20 17 22 It not clear what this sentence is trying to say. Consider splitting into two sentences or otherwise rewording. (UNITED STATES OF AMERICA)
This sentence has been revised to clarify confusion.
430 83722 26 17 20 17 22 The logic of this sentence could be clarified a bit. The growing season decrease is "subsequent" why? (Katharine Mach, IPCC WGII TSU)
This sentence has been revised to clarify confusion.
431 83723 26 17 26 17 26 For an unfamiliar reader, it could be helpful to indicate "expansion of disease" is the type of expansion that is meant. (Katharine Mach, IPCC WGII TSU)
We believe this sentence is clearest as written.
432 64400 26 17 30 0 0 Delete Latin names as they are not used for other forest pests (or indeed for any species in this section of the chapter). (Don Lemmen, Canada National Study)
Change made.
433 75274 26 17 30 17 30 Please include the common name for the two species listed. If they are the bark beetle refered to earlier, then the Latin names should be included when the beetles are first mentioned. (UNITED STATES OF AMERICA)
Change made.
434 83724 26 17 30 17 30 Is there a common name for these species that could be given? Casual usage of "likely" should be avoided, as it is a reserved likelihood term. (Katharine Mach, IPCC WGII TSU)
Changes made.
435 75275 26 17 36 17 36 This sentence should probably include the "Gulf Coast" in addition to the "East and West coasts" of North America. (UNITED STATES OF AMERICA)
This has been added.
436 75276 26 17 38 0 0 Expand the wording beyond "hurricanes" to indicate the other kinds of large storms that threaten coastal areas. Extra-tropical cyclones and other major storms cause large impacts. (e.g. Brunner and Lynch2010:118-128). Citation: Ronald D. Brunner and Amanda H. Lynch (2010) Adaptive Governance and Climate Change.American Meterological Society. Boston. (UNITED STATES OF AMERICA)
We have expanded the wording beyond hurricanes.
437 62803 26 17 43 0 0 much research summarized for Oregon - Ruggiero P., C.A. Brown, P. D. Komar, J.C. Allan, D.A. Reusser, S. Rumrill. Contributor: P. Corcoran, H. Baron, H. Moritz, and J.A. Saarinen. 2010. Chapter 6. Impacts of climate change on Oregon's coasts and estuaries. In Oregon Climate Change Research Institute, Oregon Climate Assessment Report, K.D. Dello and P.W. Mote (eds). College of Oceanic and Atmospheric Sciences, Oregon State University, Corvallis, OR. (Dominique Bachelet, Conservation Biology Institute)
We have included this reference.
438 83725 26 17 43 0 0 Section 26.4.2.1. The section title could be considered. Would "observed impacts and vulnerabilities" be more inclusive of all material assessed? (Katharine Mach, IPCC WGII TSU)
We have changed the title.
439 64595 26 17 45 18 14 26.4.2.1. It is not quite clear from all of these descriptions which of the observed impacts are attributed to climate change.Also a threat is a glimpse into the future and not an observation. (Lena Menzel, Alfred Wegener Institute for Polar and Marine Research)
We have changed the section title to include Vulnerabilities, which is what most of the paragraphs discuss. The increased CO2 paragraph is directly attributed to climate change, and we have made this distinction.
440 75277 26 17 47 17 47 26.4.2.1 : What are seagrass and mangroves affectations? (UNITED STATES OF AMERICA) Sentence re-written to remove confusion.
441 83726 26 17 47 17 47 The word choice of "affectations" is a bit unclear. (Katharine Mach, IPCC WGII TSU) Word removed.

IPCC WGII AR5 Chapter 26 SECOND-ORDER DRAFT
Government and Expert Review Page 37 of 68 28 March - 24 May 2013
# ID ChFrom Page
From Line
To Page
To Line Comment Response
442 83727 26 17 48 17 50 Over what time frame have these observations been made? (Katharine Mach, IPCC WGII TSU) We have added the time-frame of these observations.
443 75278 26 17 52 17 53 A comma appears to be missing. The term species cannot be applied to "the metabolism of many organisms". (UNITED STATES OF AMERICA)
Change made.
444 83728 26 17 54 18 1 What is the relative importance of climate variability versus climate change? This could be specified. (Katharine Mach, IPCC WGII TSU)
This sentence has been removed.
445 75290 26 18 0 18 0 Consider Citing: Mawdsley, J. R., O'MALLEY, R. O. B. I. N., & Ojima, D. S. (2009). A review of climate_change adaptation strategies for wildlife management and biodiversity conservation. Conservation Biology, 23(5), 1080-1089. (UNITED STATES OF AMERICA)
Citation included.
446 75291 26 18 0 18 0 The forest Service is conducting vulnerability assessments http://www.fs.fed.us/rm/grassland-shrubland-desert/products/species-vulnerability/ (UNITED STATES OF AMERICA)
Thank you for this reference. We have included citations to a number of acitivities being undertaken by the U.S. Forest Service.
447 75292 26 18 0 18 0 There are myriad lawsuits that are resulting in increased consideration of climate change as part of enforcement of US federal environmental laws. Consider citing: LEGAL STUDIES RESEARCH PAPER SERIES Working Paper Number 12-16 August 6, 2012 NEPA and Climate Change Mark Squillace University of Colorado Law School Alexander Hood Toward Justice NEPA and Climate Change in The NEPA Litigation Guide 261 (American Bar Ass'n, 2d ed. 2012), Also consider citing the Endangered Species Act, and the Clean Water Act (UNITED STATES OF AMERICA)
Thank you for these references. Unfortunately, coverage of this large area is not possible within the limited space of the section.
448 75279 26 18 1 18 1 Please clarify if this means MARINE mammals. (UNITED STATES OF AMERICA) Change has been made to cetaceans (marine mammals).
449 64401 26 18 5 0 0 The confidence statement here comes out of the blue as there are no other examples in the chapter (outside of the Executive Summary). Supporting references are needed. Reference to Will Box CC-OA be included in the chapter and if it isn't, you need to clearly state where it can be found (technical Summary, Chapters 5, 6). (Don Lemmen, Canada National Study)
Statement re-worded without the confidence statement.
450 75280 26 18 5 18 5 The sentence on acidification is not clear, where it states that "There is confidence about acidification". About what is there confidence -- that is already occurring? That it will occur? That it will have a negative impact? (UNITED STATES OF AMERICA)
Statement re-worded without the confidence statement.
451 64594 26 18 5 18 7 26.4.2.1. sentence structure needs repair (Lena Menzel, Alfred Wegener Institute for Polar and Marine Research) Sentence re-written.
452 83729 26 18 5 18 7 These statements could be clarified. What aspect of ocean acidification is being referred to in the 1st sentence? Additionally, the 2nd sentence should be refined--what is the geographic scope of the example as well? (Katharine Mach, IPCC WGII TSU)
Sentence re-written.
453 83730 26 18 12 18 13 What are the timelines for recovery following such events? (Katharine Mach, IPCC WGII TSU) The relative timelines are, unfortunately, beyond the scope of incorporation due to space constraints.
454 64596 26 18 19 18 38 26.4.2.2. can you provide confidence levels for statements? (Lena Menzel, Alfred Wegener Institute for Polar and Marine Research)
For consistency both within the section and across the chapter, we provide confidence levels for higher level statements, such as the executive summary.
455 64597 26 18 19 18 38 26.4.2.2. one wonders whether coverage is complete (enough). What about specific issues along the West coast asssociated with upwelling? what about specific issues along the East coast, e.g. fish distribution, and fisheries? or in the American Arctic? (Lena Menzel, Alfred Wegener Institute for Polar and Marine Research)
We agree these are all important areas. However, only so much can be covered in a roughly 2000 word section. We have attempted to cover a great deal on coastal ecosystems, but some issues and areas must necessarily not be covered due to limited space.
456 83731 26 18 20 18 20 It would be helpful to specify the mechanism through which flood tolerance is reduced. (Katharine Mach, IPCC WGII TSU) We have specified these mechanisms.
457 83732 26 18 21 18 22 It would also be helpful to clarify what is meant by "their recovery is almost impossible." Also, what are the relevant scenarios of climate change for the projections described on these lines? What drivers are relevant, and what are the ranges/uncertainties associated with the estimates? (Katharine Mach, IPCC WGII TSU)
We have removed this vague sentence.
458 62804 26 18 27 18 28 40% refers to chinook only (one species of salmon) under only 1 GCM scenario (GFDL) is comes only from Battin's paper not Crozier. Battin's conclusions are also much more nuanced than this blunt statement. (Dominique Bachelet, Conservation Biology Institute)
We have included more nuance and coverage of these two studies.

IPCC WGII AR5 Chapter 26 SECOND-ORDER DRAFT
Government and Expert Review Page 38 of 68 28 March - 24 May 2013
# ID ChFrom Page
From Line
To Page
To Line Comment Response
459 83733 26 18 27 18 28 For the described projected impact, the full range should be specified instead of "up to 40%," it would also be preferable to specify the relevant scenario of climate change and other relevant drivers if pertinent to this projection. (Katharine Mach, IPCC WGII TSU)
We have included the full range of uncertainties.
460 62805 26 18 29 0 0 this is not well phrased: it should mention seasonal as well as regional differences (Dominique Bachelet, Conservation Biology Institute)
It has been re-phrased.
461 75281 26 18 29 18 29 For clarity, consider editing this sentence to read "at the southern end of their range while doing the opposite at the northern end of their range". (UNITED STATES OF AMERICA)
Sentence revised for clarity.
462 83734 26 18 31 18 34 The relative importance of temperature change versus ocean acidification should be discussed as supported by available literature. Material in Chapter 6, 5, and 30 is relevant here. (Katharine Mach, IPCC WGII TSU)
We have incorporated in temperature and references to Ch 5 and the cross-chapter ocean acidification box.
463 83735 26 18 36 18 36 The findings of working group 1 should be cross-referenced here, with consistency ensured. (Katharine Mach, IPCC WGII TSU)
We have changed this statement to be conditional on changes in storms.
464 75282 26 18 36 18 38 Mangroves were dealt with three paragraphs above. This single sentence paragraph should probably be combined with those paragraphs. (UNITED STATES OF AMERICA)
We have chosen to keep this paragraph separately, as the section is organized by climate driver and this paragraph addresses storm surges.
465 75283 26 18 37 18 37 Please clarify what is mean by “over a period of at least 25 years” (UNITED STATES OF AMERICA) We have clarified this.
466 75284 26 18 41 19 16 Citations for comment on forest adapation. Citations are separated by square brackets. Citations: [Gleeson, J., P. Gray, A. Douglas, C. J. Lemieux, and G. Nielsen. 2011. Practitioner's Guide to Climate Change Adaptation in Ontario's Ecosystems. Ontario Centre for Climate Impacts and Adaptation Resources (OCCIAR), Sudbury.] [Ogden, A. E., and J. L. Innes. 2009. Application of structured decision making to an assessment of climate change vulnerabilities and adaptation options for sustainable forest management. Ecology and Society 14:11.] [NOAA. 2010. Adapting to Climate Change: A Planning Guide for State Coastal Managers. National Oceanic and Atmospheric Administration (NOAA), Office of Ocean and Coastal Resource Management. http://coastalmanagement.noaa.gov/climate/adaptation.html (accessed May 2012).] [Halofsky, J. E., D. L. Peterson, K. A. O'Halloran, and C. Hawkins-Hoffman. 2011. Adapting to climate change at Olympic National Forest and Olympic National Park. Gen. Tech. Rep. PNW-GTR-844. Portland, OR: U.S. Department of Agriculture, Forest Service, Pacific Northwest Research Station. 130 p.] [Weeks, D., P. Malone, and L. Welling. 2011. Climate change scenario planning: A tool for managing parks into uncertain futures. ParkScience 28:26-33.] [Poiani, K. A., R. L. Goldman, J. Hobson, J. M. Hoekstra, and K. S. Nelson. 2011. Redesigning biodiversity conservation projects for climate change: Examples from the field. Biological Conservation 20:185-201.] [Cross, M. S., P. D. McCarthy, G. Garfin, D. Gori, and C. A. F. Enquist. 2013. Accelerating adaptation of natural resource management to address climate change. Conservation Biology 27:4-13.] [Cross, M. S., E. S. Zavaleta, D. Bachelet, M. L. Brooks, C. A. F. Enquist, E. Fleishman, L. Graumlich, C. R. Groves, L. Hannah, L. Hansen, G. Hayward, M. Koopman, J. J. Lawler, J. R. Malcolm, J. Nordgren, B. Petersen, E. L. Rowland, D. Scott, S. L. Shafer, M. R. Shaw, and G. M. Tabor. 2012. The Adaptation for Conservation Targets (ACT) framework: A tool for incorporating climate change into natural resource management. Environmental Management 50:341-351.] (UNITED STATES OF AMERICA)
We have incorporated a number of these references.
467 75285 26 18 41 19 16 We suggest that this section make reference to a growing number of climate change adaptation planning approaches that are being applied to the conservation of biodiversity and ecosystems in the US and Canada. Possible text could include: "In the United States and Canada, a number of adaptation planning approaches have been proposed and applied to support the development of adaptation strategies for the conservation of biodiversity and ecosystems (e.g., Ogden and Innes 2009; NOAA 2010; Gleeson et al. 2011; Halofsky et al. 2011; Weeks et al. 2011; Poiani et al. 2011; Cross et al. 2012; Cross et al. 2013). Many of these approaches emphasize the value of collaborative dialogue between scientists and practitioners to develop science-based adaptation strategies based on a combination of local knowledge and climate change projections." Citations are provided below. (UNITED STATES OF AMERICA)
We have included coverage of these points and references in the revision.
468 75286 26 18 43 18 44 it is unclear what is meant by "the biodiversity and conservation of habitats and food chains" in the context of the rest of the sentence. (UNITED STATES OF AMERICA)
Sentence removed in revising.

IPCC WGII AR5 Chapter 26 SECOND-ORDER DRAFT
Government and Expert Review Page 39 of 68 28 March - 24 May 2013
# ID ChFrom Page
From Line
To Page
To Line Comment Response
469 64211 26 18 43 18 45 I would add the genetic capacity of various species ( biological ecosysem components) to adapt to in situ changes or if they move to tolerate bio physical conditions in potentail new habitat. For instance Scott Green (http://scottgreenunbcca.ipage.com) and otehrs have found some forest species do notcurrently have the genetic elsticity to move north because they cannot adpat to the long summer daylight period( they dehydrate). Further to page 18 lines 52 page 19-line 5 he along with his colleagues have been investigating the potential of various more southern tree species to be used to colonize forests further north. The message is that there may be constraints other than climate and distance to migrations. (Ian Church, Canadian Foundation for Climate and Atmospheric Science/ IPY Canada)
We have removed this sentence, as it was vague and confusing.
470 75287 26 18 43 18 46 This statement should be qualified: the resilience of ecosystems to climate change depends on much more than biodiversity, habitat conservation, and landuse change. Perhaps use "including" as a qualifier, allowing for other more specific factors such as structure, predominance of species at the margins of their ranges, and susceptibility to factors that interact with climate change (pests/disease, ozone, fire, frost, hail, etc) . See Swanston et al. 2011 and 2012 (and citations therein) for a list of ecosystem vulnerabilities, characteristics and accommodate change, and strategies for climate change resilience. Swanston, C.W., M. Janowiak, L. Iverson, L. Parker, D. Mladenoff, L. Brandt, P. Butler, M. St. Pierre, A. Prasad, S. Matthews, M. Peters, and D. Higgins. 2011. Ecosystem Vulnerability Assessment and Synthesis: A Report from the Climate Change Response Framework Project in Northern Wisconsin, Version 1. Gen. Tech. Rep. NRS-82. U.S. Department of Agriculture, Forest Service, Northern Research Station, Newtown Square, Pennsylvania.142p. Swanston, C.W., and M.K. Janowiak. 2012. Forest Adaptation Resources: Climate change tools and approaches for land managers. Gen. Tech. Rep. NRS-87. U.S. Department of Agriculture, Forest Service, Northern Research Station, Newtown Square, Pennsylvania. 108p. (UNITED STATES OF AMERICA)
We have removed this sentence in revising.
471 80880 26 18 43 19 5 Adaptation responses in Mexico to promote forest conservation and the benefits forests provide in terms of environmental services (e.g., carbon sequestration) include “the integration of the (Special Climate Change Programe (SCCP) with previous forest programs focused on reducing the number of forest fires, diversifying forest uses, advancing agroforestry, and developing the Mexican market for carbon sequestration, in addition to assessing climate impacts on biodiversity such as the Natural Protected Areas Program, Forest Development Program, Forest Conservation and Restoration Program, and ProArbol (Sosa-Rodriguez, 2013). (Fabiola S. Sosa-Rodriguez, University of Waterloo)
We have included mention of some of these program aims.
472 80881 26 18 43 19 5 Sosa-Rodriguez (2013) identified some constrains that reduce the effectiveness of adaptation strategies on this sector. For example, “lack of knowledge and administrative capacity for sustainable forest management, excessive regulation, and poverty within local communities have promoted illegal―and sometimes legal―forest overexploitation. Payment for environmental services (PES) provided by forests to local communities has been reduced to subsidies for not deforesting. This approach avoids local capability building and effective community participation in managing its natural resources”. (Fabiola S. Sosa-Rodriguez, University of Waterloo)
We have included consideration of this reference.
473 69790 26 18 45 18 46 Bhatti et al., 2006 is absent in reference list. (NETHERLANDS) Sentence has been removed in revising.
474 75288 26 18 45 18 46 26.4.3 : Add "water-use changes" to sentences; these changes can happen independently of land use changes (e.g. increased irrigation withdrawals to cope with drought). (UNITED STATES OF AMERICA)
Sentence has been removed in revising.

IPCC WGII AR5 Chapter 26 SECOND-ORDER DRAFT
Government and Expert Review Page 40 of 68 28 March - 24 May 2013
# ID ChFrom Page
From Line
To Page
To Line Comment Response
475 80519 26 18 46 18 48 Suggested additional examples of successful indigenous adaptation proejcts are cited in the attached supporting document: Indigenous Health Impacts from Climate Change expert reviewer Blake Gentry. See pages 10-11. The suggested additional language follows here: " ... indigenous living on ancestral lands . . .remain key to biodiversity through CO2 CDM off-set programs, and to maintaining food security. In Chiapas, Mexico, for example, the Scolel Te Project has improved reforestation and provided sustainable timber sales, organic coffee, and other agroforestry products to local farmers . In the semiarid Sonoran Desert region zone of NW Mexico, regional warming has reduced cattle and grain production, prompting SEMARNAT to fund adaptation projects. Hydroponic greenhouses for growing food, such as the one in Lomas de Bacum, Sonora, Mexico, are administered as an agricultural coop by Yaqui indigenous women . Small local technology driven projects designed to promote sustainable energy and livelihoods are applicable to migratory, resettled, and permanently settled climate vulnerable indigenous. The use of appropriate technology improves environmental management, sustains development project interventions, and improve livelihood benefits which builds reliance in indigenous communities to multi-factors causing displacement including climate change impacts. Case examples are micro-hydro for agro processing (Bolivia –I), bio-digesters in rural communities (Costa Rica –I), and solar electrification via micro enterprises (Dominican Republic-3), plus 43 more reviewed the UN Global Energy Facility small grants program. " (Gentry Blake, Institution no 1: Gente de Iitoi A.C., non-profit in Mexico. Dir. of Health Services.)
These are helpful examples, but we are unfortunately highly limited on space and thus have not been able to include them.
476 75289 26 18 50 18 51 it is unclear what is meant by "increases in plant community composition". (UNITED STATES OF AMERICA) This phrase has been removed.
477 62806 26 18 50 19 5 no mention of adapting seed source and genomic (adaptive traits) - work by Glenn Howe, Brad StClair (OSU), Tongli Wang, Sally Aitken (UBC) etc (Dominique Bachelet, Conservation Biology Institute)
This was meant to highlight examples, not be an exhaustive list. Thus, we could not include everything.
478 64805 26 18 52 0 0 Assisted migration for commercial tree species likely more useful than breeding for resistance. See references above (Note his comment on Pg 17, Line 11 for references) (Dave Spitttlehouse, BC Ministry Forests, Lands and Natural Resource Operations)
Indeed, we cover assisted migration at the bottom of this paragraph.
479 64402 26 18 53 18 54 Proper reference for chapter 4 of Canadian Assessment is Vasseur and Catto (2008). Citation - Vasseur, L. and Catto, N. (2008): Atlantic Canada; in From Impacts to Adaptation: Canada in a Changing Climate 2007, edited by D.S. Lemmen, F.J.Warren, J. Lacroix and E. Bush; Government of Canada, Ottawa, ON, p. 119-170. (Don Lemmen, Canada National Study)
Citation changed.
480 75302 26 19 0 19 0 26-2 Box : Should discuss strategies for plant communities that are fire dependent versus those not adapted to fire separately--the ecological effects of fire are different for these two cases. (UNITED STATES OF AMERICA)
Because of space constrains we could not include this- PRL
481 62807 26 19 5 0 0 Camille Parmesan and colleagues published a paper giving criteria for assisted migration that could be cited here: Ove Hoegh-Guldberg, Lesley Hughes, Sue McIntyre, David Lindenmayer, Camille Parmesan, Hugh Possingham & Chris Thomas. Moving with the times: assisted colonization and rapid climate change. Science, July 18, 2008 (Dominique Bachelet, Conservation Biology Institute)
Citation included.
482 75293 26 19 7 19 10 This statement is valid, but unduly limited -- why is only "protected area"planning and management mentioned? Most ecosystems are not protected and also require better planning and climate-adaptive management. Simply maintaining forests as forests, especially if well managed, has a carbon benefit even is additional sequestration is not the primary management goal. If this paragraph is really about carbon management, it should be clearer from the beginning, and the necessity to consider adaptation when planning mitigation should be clarified. Millar et al. 2013 and Peterson et al. 2011 should be cited in this paragraph. Millar, C.I., K.E. Skog, D.C. McKinley, R.A. Birdsey, C.W. Swanston, S.J. Hines, C.W. Woodall, E.D. Reinhardt, D.L. Peterson, and J.M. Vose. 2012. Adaptation and mitigation, p. 125-192, In J. M. Vose, et al., eds. Effects of climatic variability and change on forest ecosystems: a comprehensive science synthesis for the U.S. forest sector, Gen. Tech. Rep. PNW-GTR-870. U.S. Department of Agriculture, Forest Service, Pacific Northwest Research Station, Portland, OR. Peterson, David L.; Millar, Connie I.; Joyce, Linda A.; Furniss, Michael J.; Halofsky, Jessica E.; Neilson, Ronald P.; Morelli, Toni Lyn. 2011. Responding to climate change in national forests: a guidebook for developing adaptation options. Gen. Tech. Rep. PNW-GTR-855. Portland, OR: U.S. Department of Agriculture, Forest Service, Pacific Northwest Research Station. 109 p. (UNITED STATES OF AMERICA)
We have broadend this paragraph in revising.
483 71433 26 19 9 19 10 This statement regarding a 2C threshold needs to be supported by stronger references than currently provided. Mansourian et al (2009) is a descriptive paper that includes no analysis of impacts associated with various warming scenarios. This is an important statement and the assessment of the literature needs to be strengthened. (CANADA)
We have included additional references to support this.
IPCC WGII AR5 Chapter 26 SECOND-ORDER DRAFT
Government and Expert Review Page 41 of 68 28 March - 24 May 2013
# ID ChFrom Page
From Line
To Page
To Line Comment Response
484 64403 26 19 11 0 0 References to CDM and REDD+ will be meaningless to most readers. (Don Lemmen, Canada National Study) These sentences have been removed.
485 61662 26 19 11 19 11 What do CDM and REDD+ stand for? These acronyms need expanding. (European Union DG Research, Directorate Environment Climate Change & Environmental Risks Unit)
These sentences have been removed.
486 80520 26 19 15 19 0 Suggested additional language in single quotes inside original text in double quotes. "…recognizing the rights of indigneous people 'through prior consent' …" (Gentry Blake, Institution no 1: Gente de Iitoi A.C., non-profit in Mexico. Dir. of Health Services.)
Language has been changed in this phrase.
487 75294 26 19 20 20 25 Wildfire Box could mention fire suppression. Possible Cite: Fried, J.S., J.K. Gilless, W.J. Riley, T.J. Moody, C. Simon de Blas, K. Hayhoe, M. Moritz, S. Stephens, M.S. Torn. 2008. Predicting the effect of climate change on wildfire behavior and initial attack success. Climatic Change 87:251-264. (UNITED STATES OF AMERICA)
Reference included
488 75295 26 19 22 19 22 It is suggested that the first sentence of this paragraph should read "Large wildfire activity in North America has markedly increased" (UNITED STATES OF AMERICA)
Done
489 71434 26 19 23 19 23 The scientific paper by Gillett et al. 2004 should be provided as a reference for the increasing fire activity in Canada instead of the report by Williamson. Gillett, N.P., Weaver, A.J., Zwiers, F.W., Flannigan, M.D., 2004. Detecting the effect of climate change on Canadian forest fires. Geophysical Research Letters 31, L18211. (CANADA)
Reference added. Te reviewer didn't give a good reason to remove the Williamson reference
490 64213 26 19 26 19 27 I agree with the statement but a couple of examples might help the reader (Ian Church, Canadian Foundation for Climate and Atmospheric Science/ IPY Canada)
Example provided
491 75296 26 19 26 19 27 box 26.4 : Federal and state fire policy in the US is changing over to more of a "Let Burn" Policy where possible in recognition of the negative effects of large-scale fire suppression. In that light, this sentence could be rewritten as "Legacies of forest management, including large-scale fire suppression, also play a substantial role in wildfire risk across systems. Consider citing: Cohesive Wildland Fire Management Strategy. H.R.2996 Appropriations Bill of the Department of the Interior: Section 503. The Cohesive Wildfire Management Strategy. (UNITED STATES OF AMERICA)
Sugestion included. We also refer to other processes - By the way this is Box 26-2
492 76849 26 19 26 19 27 Legacies of forest management statement: I suggest that you supply a citation for this statement. (Michael Scott, Pacific Northwest National Laboratory)
References added
493 75297 26 19 30 19 31 box 26.5 : It is suggested that this paragraph contain a statement that recognizes the critical role that fire plays in maintaining ecosystem integrity. Many North American ecosystems have evolved with fire and many native plant and animal species depend on fire for success. Wildfire is a natural process, critical to nutrient cycling, and the promotion of biodiversity and fire-adapted species. Climate change will result in natural fire cycles changing their usual aspects, including seasonality, size, frequency, and intensity. With these changes, and mediated by the presence of invasive species, wildfires burning outside their range of historic variability are changing the dominant vegetation types and community structure in many regions. Consider citing: Bond, WJ and and B.W. van Wilgen. Fire and Plants. Chapman and Hall, New York. 1996. White, PS, and Jentsch A. 2001. The search for generality in studies of disturbance and ecosystem dynamics. Progress in Botany 62:399-450. (UNITED STATES OF AMERICA)
Comment addressed in the first and second paragraph
494 62808 26 19 32 0 0 fire suppression and forest condition drive the response of western forests to fire - using climate only as the driver of western fires is inaccurate (Dominique Bachelet, Conservation Biology Institute)
Addressed, now we refer to other processes playing a role in wildfire risk
495 75298 26 19 33 19 33 It is suggested that this sentence should read "Human use of fires in forests not prone to fires, such as tropical forests, can have devastating impacts that are strongly related to frequency of such human-caused fires" (UNITED STATES OF AMERICA)
Addressed
496 75299 26 19 35 19 36 box 26-2 : The assertion that forests affected by fire are less effective carbon sinks is overgeneralized. Many fire-maintained systems burn at lower intensities, thereby releasing less carbon overall (e.g., Longleaf pine savanna, Sierra mixed-conifer; see for example North et al, 2012). Avoid the term "healthy forests," which is not defined here, and is evocative of destructive forest policies of the past (see Davis, 2004). Consider citing: North, M., B.M. Collins, and S.L. Stephens. 2012. Using Fire to Increase the Scale, Benefits and Future Maintenance of Fuels Treatments. In press at Journal of Forestry. Davis, Jesse B. (2004) Healthy Forests Initiative: Unhealthy Policy Choices in Forest and Fire Management, The Symposium: Public Lands Management at the Crossroads: Balancing Interests in the 21st Century: Comment. 34 Envtl. L. 1209. (UNITED STATES OF AMERICA)
We addressed this comment and included the references. We decided to keep the term healthy forest and cite Davis 2004 exactly after the term
497 75300 26 19 35 19 37 box 26.2 : This sentence needs a citation or to be reconsidered if there is not a literature to base it on. (UNITED STATES OF AMERICA)
Addressed

IPCC WGII AR5 Chapter 26 SECOND-ORDER DRAFT
Government and Expert Review Page 42 of 68 28 March - 24 May 2013
# ID ChFrom Page
From Line
To Page
To Line Comment Response
498 75301 26 19 35 19 45 box 26.3 : The fire management considerations are under-represented in this box. Suggested Text: "Minimizing adverse effects of wildfires involves short-term and long-term considerations. Attention must be given to the suppression of fires where required, fuels treatments, use of fire-safe materials in construction, community planning, and reduction of arson. Additionally, changing circumstances of stakeholders, landscapes and ecosystems must be incorporated for successful planning. Not all negative consequences of fire, especially unplanned fire, can be avoided, though a mixture of techniques can be used to try to minimize adverse effects. Application of possible minimization techniques will vary due to assets involved and geographic considerations, but can be the basis for policy considerations at local, state and federal levels." Consider citing: Gill, A. Malcolm, Scott L. Stephens, and Geoffrey J. Cary. 2013. The worldwide "wildfire" problem. Ecological Applications 23:438-454. (UNITED STATES OF AMERICA)
This is a good suggestion but not for that part of the box. We are integrating it in the adaptation section
499 62809 26 19 36 0 0 emissions shoud be replaced by carbon loss; however one should also mention that fire reduces population levels of pests and pathogens thus reducing future carbon losses due to disease and pest outbreaks. Fire also reduces competition and increases biodiversity in certain cases (bird population for ex.). (Dominique Bachelet, Conservation Biology Institute)
Suggested text included in first paragraph of box. We didn't change emissions as that is the word mostly used in the literature
500 64212 26 19 42 0 0 Assume the Canadian statistics do not include deaths of people engaged in fire suppression activiteis such as aircraft crashes- I can think of several during my career. (Ian Church, Canadian Foundation for Climate and Atmospheric Science/ IPY Canada)
The source we cite does not make that assumption
501 71435 26 19 49 19 51 Some references for the impact of drought on fire activity in Canada and Eurasia should be added. Notably these three papers: Girardin, M.P., Ali, A.A., Carcaillet, C., Mudelsee, M., Drobyshev, I., Hély, C., Bergeron, Y. 2009. Heterogeneous response of circumboreal wildfire risk to climate change since the early 1900s. Global Change Biology 15, 2751–2769, doi: 10.1111/j.1365-2486.2009.01869.x // Girardin, M.P., Ali, A.A., Carcaillet, C., Gauthier, S., Hély, C., Le Goff, H., Terrier, A., Bergeron, Y. . 2013. Fire in managed forests of eastern Canada: Risks and options, Forest Ecology and Management, Special Issues on Mega Fires Vol 294: 238-249. //Groisman PYa, Sherstyukov BG, Razuvaev VN et al. (2007) Potential forest fire danger over Northern Eurasia: changes during the 20th century. Global and Planetary Change, 56, 371–386. (CANADA)
References included
502 71436 26 19 51 19 53 The following paper by Girardin and Sauchyn 2008 specifically deals with relating fire activity in northwestern North America to sea surface temperatures and this over a much longer period (1880-1998; see their Figure 6) than reported by references cited in the current text. The conclusion of Girardin and Sauchyn study is heavily in favor of the statement made in this report "As in previous studies, the current findings suggest that AAB [annual area burned] is correlated to seasonal land/ocean temperature variability and that future warming could lead to greater AAB". Girardin, M.P., and Sauchyn, D. 2008. Three centuries of annual area burned variability in northwestern North America inferred from tree rings. The Holocene 18: 205-214. // Also consider adding these references by Le Goff et al. 2007 and Girardin 2007 in relation to large-scale atmospheric processes driving historical fire activity in Canada : Le Goff, H., Flannigan, M.D., Bergeron, Y., Girardin, M.P. 2007. Historical fire regime shifts related to climate teleconnections in the Waswanipi area, central Quebec, Canada. International Journal of Wildland Fire 16(5): 607–618 //Girardin, M.P. 2007. Interannual to decadal changes in area burned in Canada from 1781 to 1982 and the relationship to Northern Hemisphere land temperatures. Global Ecology and Biogeography 16(5): 557-566, doi: 10.1111/j.1466-8238.2007.00321.x. (CANADA)
Addressed and references included
IPCC WGII AR5 Chapter 26 SECOND-ORDER DRAFT
Government and Expert Review Page 43 of 68 28 March - 24 May 2013
# ID ChFrom Page
From Line
To Page
To Line Comment Response
503 75308 26 20 0 0 0 26.5 : There is no mention of the existence or proposed use of 1) new crop varieties, 2) traditional crop breeding, or 3) non-traditional crop breeding (e.g. GMO) for climate change 'resilient' agricultural crops. Given that both drought- and heat- resistant crops are being researched and developed (see, e.g.: J. Chen et al., "Characterization of Maize Inbred Lines for Drought and Heat Tolerance," Journal of Soil and Water Conservation 67, no. 5 (September 1, 2012): 354-364, doi:10.2489/jswc.67.5.354.), and because GMO crops are cultivated primarily in North America. This topic deserves a balanced (positive and negative potential outcomes) mention in the report. An example of a negative potential outcome of the use of GMO technologies in agriculture: David Quist and Ignacio H. Chapela, "Transgenic DNA Introgressed into Traditional Maize Landraces in Oaxaca, Mexico," Nature 414, no. 6863 (November 29, 2001): 541-543, doi:10.1038/35107068. Other discussions of general use, and both positive and negative potential outcomes of use of GMO technologies in agriculture include: N. V. Fedoroff et al., "Radically Rethinking Agriculture for the 21st Century," Science (New York, N.Y.) 327, no. 5967 (February 12, 2010): 833-834, doi:10.1126/science.1186834. ; Agriculture for Development. World Bank; Washington, DC: 2008. http://siteresources.worldbank.org/INTWDR2008/Resources/WDR_00_book.pdf. ; Reaping the Benefits: Science and the Sustainable Intensification of Global Agriculture. Royal Society; London: 2009. http://royalsociety.org/Reapingthebenefits. (UNITED STATES OF AMERICA)
Space limits prohibit extensive discussion, but a sentence has been added to adaptation section with two of suggested refs.
504 71437 26 20 3 20 5 Could authors be more precise about the trends observed in drought conditions in southern and western Canada (which season, where exactly)? This is raised because such trends were not detected in trend analyses of fire danger indices across Canada conducted over the period approximating 1950-2000 or so. From reading the cited report, these statements were apparently drawn from the analysis of the PDSI. But the PDSI is potentially flawed in snowy regions. See the papers by Amiro et al. 2004 and Girardin and Wotton 2007: Amiro, B.D., K. A. Logan, B. M. Wotton, M. D. Flannigan, J. B. Todd, B.J. Stocks, and D. L. Martell, 2004: Fire weather index system components of large fires in the Canadian boreal forest. Int. J. Wildland Fire, 13, 391–400.//Girardin, M.P. and Wotton, B.M. 2009. Summer moisture and wildfire risks across Canada. Journal of Applied Meteorology and Climatology 48: 517-533. (CANADA)
Comment addressed and necessary references included
505 71438 26 20 9 20 23 How about managing forests to decrease fire disturbance risks at wildland-urban interfaces? Manipulation of vegetation composition and stand structure has been proposed as a strategy for offsetting climatic change impacts on wildfires in Canada. Given that harvesting takes place in the boreal forest, there may be opportunities for using planned manipulation of vegetation for management of future wildfire risks. The concept has a long history, and its potential effect has been demonstrated through model simulation experiments and recently found empirical support. In particular cases, this could also provide an additional benefit to the use of assisted species migration. See these two recent papers: Terrier, A., Girardin, M.P., Périé, C., Legendre, P., Bergeron, Y. 2013. Potential changes in forest composition could reduce impacts of climate change on boreal wildfires, Ecological Applications 23: 21-35. Girardin, M.P., Ali, A.A., Carcaillet, C., Blarquez, O., Hély, C., Terrier, A., Genries, G., Bergeron, Y. In press. Vegetation limits the impact of a warm climate on boreal wildfires. New Phytologist (http://www.cef-cfr.ca/uploads/Membres/girardin-new-phytol.pdf) .//The following paper in Forest Ecology and Management also provide options for adapting to high fire risks under climate change: Girardin, M.P., Ali, A.A., Carcaillet, C., Gauthier, S., Hély, C., Le Goff, H., Terrier, A., Bergeron, Y. . 2013. Fire in managed forests of eastern Canada: Risks and options, Forest Ecology and Management, Special Issues on Mega Fires Vol 294: 238-249. (CANADA)
References and suggestions included
506 75303 26 20 10 20 10 Is statement about “attention to population growth...is an important aspect of adaptation planning” sufficiently objective and justified with literature? (UNITED STATES OF AMERICA)
Population growth was deleted as the references only support land use planning, which we moved to the last sentence in the first adaptation paragraph
507 64404 26 20 10 20 11 Do not start this section with research needs, as that is not an adaptation strategy (Don Lemmen, Canada National Study) Done
508 62810 26 20 13 20 14 limiting vegetation around structures work in certain areas but not all. Look at Alex Sypard's work in S California. Wind carries ambers and Santa Ana winds are a certainty every year. developers are simply building structures in a fire prone environment that should burn frequently. The "stupid zone" that was described in the 70s in Coloroda has just spread everywhere. (Dominique Bachelet, Conservation Biology Institute)
We changed the sentence to say "managers in the U.S. have encouraged reduction of flammable vegetation around structures with different levels of success"
509 64214 26 20 13 20 14 Also construction design andmaterials and infrastructure operations which are less succeptable to wild fire (example roofing materials) (Ian Church, Canadian Foundation for Climate and Atmospheric Science/ IPY Canada)
Suggestion not included as we didn't have references to back it

IPCC WGII AR5 Chapter 26 SECOND-ORDER DRAFT
Government and Expert Review Page 44 of 68 28 March - 24 May 2013
# ID ChFrom Page
From Line
To Page
To Line Comment Response
510 71439 26 20 16 20 17 There is a substantial literature addressing adaptations (mitigation and preparedness) to wildfire risk among communities and homeowners in North America. Although not all of them can be considered here, addition of some more recent references that address community adaptation to wildfire threat is suggested: Brunson et al. 2004; Jakes et al. 2007; McCaffrey et al. 2012; McFarlane et al. 2011. (CANADA)
We only included McFarlane, et al., as that is the one full reference we could find
511 71440 26 20 20 20 20 There has been considerable research on the role of trust and communication in public acceptance of pest and fuels management. Some of this literature should be included: McFarlane et al. 2012; Shindler et al. 2003; 2009; Toman et al. 2011. (CANADA)
We only included McFarlane, et al., as that is the one full reference we could find
512 71441 26 20 20 20 20 The report recognizes that indigenous peoples are among the most vulnerable to climate change. A good example of this in North America is the risk posed by changes in wildfire regimes. In Canada, for example, indigenous communities are often located in remote, forested areas that may experience more frequent, intense wildfires. Indigenous peoples historic relationship with fire, community capacity and culture can present unique challenges and opportunities in developing adaptation strategies. Indigenous peoples' adaptation to wildfire risk in North America is beginning to receive attention in the literature. The risk posed to indigenous peoples and the emerging literature should be recognized in the report. Inserting the following "Indigenous peoples may be at higher risk from wildfire and may have unique requirements for adaptation strategies (Carroll et al. 2004; 2010; Christianson et al. 2012a; 2012b; Raish et al. 2005)" is suggested. This could be inserted before "However, institutional shifts...": References: Brunson, Mark W., and Bruce A. Shindler. 2004. Geographic variation in social acceptability of wildland fuels management in the western United States. Society and Natural Resources 17 : 661-78. Carroll, Matthew S., Patricia J. Cohn, and Keith A. Blatner. 2004. Private and tribal forest landowners and fire risk: A two-county case study in Washington state. Canadian Journal of Forest Research 34 : 2148-58. Carroll, Matthew S., Patricia J. Cohn, Travis B. Paveglio, Donna R. Drader, and Pamela J. Jakes. 2010. Fire burners to firefighters: The Nez Perce and fire. Journal of Forestry 2 : 71-6. Christianson, Amy, Tara K. McGee, and Lorne L’Hirondelle. 2012a. How historic and current wildfire experiences in an aboriginal community influence mitigation preferences. International Journal of Wildland Fire. doi: 10.1071/WF12041. Christianson, Amy, Tara K. McGee, and Lorne L'Hirondelle. 2012b. Community support for wildfire mitigation at Peavine Métis settlement, Alberta, Canada. Environmental Hazards 11(3): 177-193. doi: 10.1080/17477891.2011.649710 Jakes, Pamela, Linda Kruger, Martha Monroe, Kristen Nelson, and Victoria Sturtevant. 2007. Improving wildfire preparedness: Lessons from communities across the U.S. Human Ecology Review 14 (2): 188-97. McCaffrey, Sarah, Eric Toman, Melanie Stidham, and Bruce Shindler. 2012. Social science research related to wildfire management: An overview of recent findings and future research needs. International Journal of Wildland Fire.doi:10.1071/WF11115. McFarlane, Bonita L., John R. Parkins, and David O.T. Watson. 2012. Risk, knowledge, and trust in managing forest insect disturbance. Canadian Journal of Forest Research 42:710-719.McFarlane, Bonita L., Tara K.McGee, and Hilary Faulkner. 2011. Complexity of homeowner wildfire risk mitigation: an integration of hazard theories. International Journal of Wildland Fire 20:921-931. Raish, Carol, Armando González-Cabán, and Carol J. Condie. 2005. The importance of traditional fire use and management practices for contemporary land managers in the American southwest. Environmental Hazards 6: 115-22. Shindler, Bruce A., Eric Toman, and Sarah M. McCaffrey. 2009. Public perceptions of fire, fuels, and the forest service in the Great Lakes region: A survey of citizen-agency communication and trust. International Journal of Wildland Fire 18 : 157-64. Shindler, Bruce, and Eric Toman. 2003. Fuel reduction strategies in forest communities: A longitudinal analysis of public support. Journal of Forestry September : 8-15. Toman, Eric, Melanie Stidham, Bruce Shindler, and Sarah McCaffrey. 2011. Reducing fuels in the wildland-urban interface: Community perceptions of agency fuels treatment. International Journal of Wildland Fire 20 : 340-9. (CANADA)
We included the sentences and three of the suggested references. Thanks
513 75304 26 20 28 23 25 For residents, particularly indigenous peoples, of the Canadian and Alaskan subarctic, food security is only loosely connected to agriculture. (UNITED STATES OF AMERICA)
Sentence has been revised to acknowledge non-climate dimensions of food security.
514 76904 26 20 30 0 0 The paragraph needs to cross-reference chapter 7 findings. (Food and Agriculture Organization of the United Nations (FAO)) Suggested change has been made
515 57748 26 20 30 20 31 it is odd to just cite nelson here, which is a non-peer reviewed study. probably better to just refer to chapter 7 which has a section discussing projected changes on global prices (David Lobell, Stanford University)
Suggested change has been made
516 75305 26 20 30 20 31 Sentence implies that Climate Change (alone) will cause diversion of arable land to biofuels. That is not justified. (UNITED STATES OF AMERICA)
Reference to biofuels removed.
517 57749 26 20 30 20 32 it seems odd to mention biofuel driven changes in price as caused by climate change. biofuels are driven by many factors, one of which is sometimes concern about climate change. also, biofuels really effects demand, not supply. (David Lobell, Stanford University)
Reference to biofuels removed.

IPCC WGII AR5 Chapter 26 SECOND-ORDER DRAFT
Government and Expert Review Page 45 of 68 28 March - 24 May 2013
# ID ChFrom Page
From Line
To Page
To Line Comment Response
518 75306 26 20 30 20 36 26.5 : The connection between climate change and crop prices is too vague. Climate change alters the environmental and market conditions for different agricultural sectors, and indirectly affects prices. Introductory sentence could reference another chapter of WG2 or include a summary of direct climate change impacts on agriculture such as increases in extremes, variability, and seasonal timing, impacts on water availability, functionality of herbicides, pesticides, pest population changes, yield and crop quality changes (UNITED STATES OF AMERICA)
Reference to prices removed.
519 62811 26 20 31 0 0 mention that biofuels will only be possible if water remains available (Dominique Bachelet, Conservation Biology Institute) Reference to biofuels removed.
520 69791 26 20 36 20 36 “may have implications for global food security”. This neutral formulation is correct. It would be appropriate to also include a statement about risks for regional food security in line with statement on P22-L9 about risks for small holder subsistence farming in Mexico. (NETHERLANDS)
Several changes have been made to this paragraph.
521 75307 26 20 39 20 53 The section on Observed Impacts (26.5.1) is weak. As written, it is unclear in the first paragraph whether these are observed impacts or not. For example, the second paragraph clearly states "yield variances over time have been attributed"� and "Events ....... have also had notable negative effects". These two sentences in the second paragraph are the only observed impacts that I can decipher from this section. To discover whether there are any documented impacts for North America, I read Chapter 7 on Food Security and Food Production Systems. Chapter 7 indicates a number of studies that documented impacts of climate trends on food production, along with confidence levels. I suggest two things for section 26.5.1. First, visit Chapter 7, summarize impacts for North America that are provided in Chapter 7, and place the main summary points in Section 26.5.1. Second, consider rewriting the first paragraph in Section 26.5.1 to reflect the fact that these are changes that have been observed. If they are not changes that have been observed, and are instead background information, then this information belongs in the prior section (26.5) and not in this section (26.5.1). (UNITED STATES OF AMERICA)
Section has been entirely re-writeen to clarify.
522 76905 26 20 41 0 0 It is not clear if the paragraph's discussion is region-specific as geographical area is not specificed in many cases. (Food and Agriculture Organization of the United Nations (FAO))
Regional specificity now noted.
523 80882 26 20 41 21 2 Consider to include the discussion presented in Feng S; Krueger AB (2010). Linkages among climate change, crop yields and Mexico–US cross-border migration. Proceedings of the US National Academy of Sciences. (Fabiola S. Sosa-Rodriguez, University of Waterloo)
Thank you, we have opted to discuss migration in the human settlements section.
524 69792 26 20 42 20 43 increases in crop yield are attributed to "high precipitation"; should be "higher". Wording as "in part" and "historic" could be more specific. Suspect that the most important causes of increased yields are modernization and intensification (synthetic fertilizer, pesticides etc.). A clearer distincion between effects in differrent North American regions and a more quantitative underpinning for the net effect on Nort America as a whole would be helpful (and distinction between 2oC en 4oC scenario) (NETHERLANDS)
Suggested changes have been made.
525 62812 26 20 44 0 0 optimal temperatures already reached for grapes - cite Greg Jones'w work along the West coast of the US. (Dominique Bachelet, Conservation Biology Institute)
Cite added.
526 62813 26 20 46 0 0 increased temperatures and drought can slow decompoistion and allow carbon to remain longer in soils; more frequent fires in dry conditions will also add slow decomposing charcoal to soils. (Dominique Bachelet, Conservation Biology Institute)
Thank you, this section has been changed a bit, but this suggestion was not added due to space limitations.
527 57750 26 20 49 20 49 a more recent reference for fruits and nuts is Lobell, D., & Field, C. (2012). California perennial crops in a changing climate. Climatic Change, 109, 317-333 (David Lobell, Stanford University)
It has been added.
528 69793 26 20 51 20 51 Please, to insert the Almaraz et al., 2008 study in the reference list. (NETHERLANDS) It has been added.
529 76850 26 21 6 21 7 Here is one more study showing gains in yields in the absence of water constraints that might be mentioned: Claudio O. Stöckle, Roger L. Nelson, Stewart Higgins, Jay Brunner, Gary Grove, Rick Boydston, Mathew Whiting, Chad Kruger. 2010. Assessment of climate change impact on Eastern Washington agriculture. Climatic Change (2010) 102:77–102. DOI 10.1007/s10584-010-9851-4. And your reference Vano et al. 2010b shows adverse impacts on agricultural yields from water shortages in the same region. (Michael Scott, Pacific Northwest National Laboratory)
Vano et al 2010 is cited following this sentence: "Risk of soil moisture deficits and declining water availability is high in the U.S. Western/Southwest, the Western Prairies in Canada, and central and northern Mexico ."
530 83736 26 21 7 21 8 Is this an outcome projected across scenarios of climate change and time frames? (Katharine Mach, IPCC WGII TSU) Yes, this phrase now added.
531 83737 26 21 14 21 16 For the projections described on these lines, it would be preferable to specify the ranges/uncertainties of the projections, especially where "up to 58%" is mentioned on line 14 (the full range should be given, not just the upper bound). (Katharine Mach, IPCC WGII TSU)
Corrected.

IPCC WGII AR5 Chapter 26 SECOND-ORDER DRAFT
Government and Expert Review Page 46 of 68 28 March - 24 May 2013
# ID ChFrom Page
From Line
To Page
To Line Comment Response
532 64405 26 21 18 21 19 An example of a very helpful statement that arises from assessment of the available literature. Value-added. It would be useful to have more such statements throughout the chapter. (Don Lemmen, Canada National Study)
Thank you.
533 75309 26 21 18 21 21 26.5.2 : Figure 26-5 does not support the statement that precedes its reference. In particular, time is not a component of Figure 26-5, but the preceding sentence indicates that major crops are projected to experience declines by 2099. (UNITED STATES OF AMERICA)
Change has been made.
534 83738 26 21 19 21 20 What are the scenarios of climate change relevant to these projections? (Katharine Mach, IPCC WGII TSU) Specificity added.
535 64215 26 21 22 21 24 Check sentence structure (Ian Church, Canadian Foundation for Climate and Atmospheric Science/ IPY Canada) It has been corected.
536 62814 26 21 23 0 0 however Washington and Oregon wines do better under climate change (Jones et al.) (Dominique Bachelet, Conservation Biology Institute)
Modification to sentence has been made.
537 83739 26 21 39 21 39 Casual usage of "likely" should be avoided, as it is a reserved likelihood term. (Katharine Mach, IPCC WGII TSU) Text has been changed
538 83740 26 21 39 21 41 Are these outcomes driven by climate change, socioeconomic trends, or other factors? (Katharine Mach, IPCC WGII TSU) Text has been changed
539 57940 26 21 39 21 46 Following additional reference may be useful, because it provides CMIP5 results for changes in soil moisture (Figure 2 in the reference). Dirmeyer, P., Y. Jin, B. Singh, and X. Yan, 2013: Evolving land-atmosphere interactions over North America from CMIP5 simulations. J. Climate. doi:10.1175/JCLI-D-12-00454.1, in press. (Sanjiv Kumar, Center for Ocean-Land-Atmosphere Studies)
Ref has been added
540 83741 26 21 42 21 42 Casual usage of "likely" should be avoided, as it is a reserved likelihood term. (Katharine Mach, IPCC WGII TSU) Sentence removed
541 76906 26 21 48 0 0 It is not clear if the paragraph's discussion is region-specific as geographical area is not specificed in many cases. (Food and Agriculture Organization of the United Nations (FAO))
Paragraph revised, with regionality noted
542 80883 26 21 48 21 48 Replace “andstorm” by “and storm” (Fabiola S. Sosa-Rodriguez, University of Waterloo) Done
543 69794 26 21 51 21 52 Please, to insert the Wu et al., 2011 study in reference list. (NETHERLANDS) Citation removed in revised version
544 62815 26 21 52 21 54 missing references: Wu, and Jackson (Dominique Bachelet, Conservation Biology Institute) Citations removed in revised version
545 62816 26 22 5 0 0 not all weeds are created equal: this statement is much too general (not all weeds nor all crops have been tested under high CO2 and in competition) (Dominique Bachelet, Conservation Biology Institute)
Sentence removed
546 79115 26 22 11 0 0 The first paragraph in section "A closer look at Mexico" argues that agriculture in Mexico is vulnerable to the impacts of climate change. A group of colleagues and I have publish in the journal Mitigation and Adaptation Strategies for Global Change (this 2013) a paper that evaluate two methods for vulnerability assessment in the agricultural sector of Mexico. According to this paragraph and our results, I put to your consideration to add the next sentence at the end of line 18 page 22: “Particularly, the agricultural sector in México is vulnerable to climate change effects (Monterroso et al, 2013)” The correct reference is “Monterroso Rivas A.I., Conde Álvarez C., Gay García C., Gómez Díaz J.D., y López J. 2013. Two methods to assess vulnerability to climate change in the Mexican agricultural sector. Mitigation and Adaptation Strategies for Global Change. doi: 10.1007/s11027-012-9442-y” (Alejandro Monterroso, Universidad Autonoma Chapingo)
Nice paper. Ref has been added with revised text.
547 75310 26 22 11 22 18 What is the share of subsistence farmers with regard to total production? Why are impacts to farmers with relatively low production/small holdings important? Is it a production issue? An equity issue? Both? Please explain. If small farmers have different capacity to adapt, and if different countries have different capacities to adapt, it follows that food production in countries with higher and lower proportions of small farmers is more or less vulnerable to climate change. (UNITED STATES OF AMERICA)
Text has been changed to specify livelihood threat, not productivity
548 83742 26 22 12 22 12 Does 2.1 million refer to the number of farmers, farming households, etc.? (Katharine Mach, IPCC WGII TSU) Text has been changed; comment no longer pertains
549 83743 26 22 16 22 16 In place of "up to 30%" the full range, not just the upper bound, should be specified. (Katharine Mach, IPCC WGII TSU) Range added
550 62817 26 22 17 0 0 Magana reference missing (Dominique Bachelet, Conservation Biology Institute) Ref has been added
551 80884 26 22 17 22 17 Replace “Magana” by “Magaña” (Fabiola S. Sosa-Rodriguez, University of Waterloo) Done
552 80885 26 22 18 22 18 Explain why it is limited (Fabiola S. Sosa-Rodriguez, University of Waterloo) Sentence removed in revision

IPCC WGII AR5 Chapter 26 SECOND-ORDER DRAFT
Government and Expert Review Page 47 of 68 28 March - 24 May 2013
# ID ChFrom Page
From Line
To Page
To Line Comment Response
553 79116 26 22 21 22 21 Before: (Monterroso Rivas et al., 2011b)2011a, After: (Monterroso-Rivas et al., 2011a, 2011b) (Alejandro Monterroso, Universidad Autonoma Chapingo)
Revised
554 80886 26 22 21 22 21 Change the”)” by a “;” (Fabiola S. Sosa-Rodriguez, University of Waterloo) Revised
555 83744 26 22 21 22 21 Is livestock heat stress meant here? (Katharine Mach, IPCC WGII TSU) Yes
556 83745 26 22 22 22 22 What is the "dangerous zone"? (Katharine Mach, IPCC WGII TSU) Term used but not defined by article author. Quotations now added around the term, and definition added.
557 83746 26 22 26 22 26 Is "varieties" a term preferable to "races"? What is the mechanism underpinning the elimination? (Katharine Mach, IPCC WGII TSU)
Race is distinct from variety, and is the term used by the article authors. Specific mechanism not discussed by authors, but it has to do with shifts in habitat suitability as result of changing temperature and precipitation regimes.
558 69795 26 22 27 22 27 Please, to insert the Ureta et al., 2012 study in reference list and change et al by et al.,. (NETHERLANDS) Done
559 83747 26 22 28 22 29 It would be preferable to specify the ranges for these projections. (Katharine Mach, IPCC WGII TSU) Projection based on historic trends; text added to clarify this.
560 75311 26 22 32 23 25 The use of results of truly long term studies as inputs to decisions about adaptation options should be considered. There are some examples of use of such information in a modern sustainable development context (e.g. Ravesloot, et al. 2009). At least one volume (Cooper and Sheets 2012) has sections written specifically for non-specialists to assist in such use. Possible citations are: Cooper, Jago, and Payson Sheets, eds. 2012 Surviving Sudden Environmental Change: Answers from Archaeology. University Press of Colorado, Boulder. Ravesloot, John C. J. Andrew Darling and Michael R. Waters 2009 Hohokan and Pima-Maricopa Irrigation Agriculturalists. In The Archaeology of Environmental Change: Socionatural Legacies of Degradation and Resilience. Eds. Christopher T. Fisher, J. Brett Hill, and Gary M. Feinman University of Arizona Press, Tucson. (UNITED STATES OF AMERICA)
The archaeological record does indeed contain a welath of insight worth pursuing in future publications, but given our strict space constraints, I cannot do justice to such content here.
561 76903 26 22 34 0 0 This paragraph's discussion is very general and does not seem to be region specific. Geographical areas should be specified. It should also cross reference the chapter that deals mainly with this topic. (Food and Agriculture Organization of the United Nations (FAO))
Paragrpah revised as suggested.
562 69796 26 22 40 22 40 Please, to insert the Mercer et al 2012 study in reference list and change et al by et al.,. (NETHERLANDS) Done
563 75312 26 22 45 22 50 26.5.3.1 : Add Mexican Government Insuring Farmers -- To help maintain government budget stability. This is pretty innovative. Fuchs, A. & Wolff, H. "Concept and Unintended Consequences of Weather Index Insurance: The Case of Mexico." American Journal of Agricultural Economics. 93(2): 505-511 Also add that adaptation, particularly for small-scale farmers, is going to be affected by the linkages across the global market. Eakin, H., Winkels, A., & Sendzimir, J. (2009). Nested vulnerability: exploring cross-scale linkages and vulnerability teleconnections in Mexican and Vietnamese coffee systems. Environmental Science & Policy, 12(4), 398-412. (UNITED STATES OF AMERICA)
Thank you, both refs now added and commented upon.
564 83748 26 22 46 22 46 It would be helpful to specify why these mechanisms are not optimal. (Katharine Mach, IPCC WGII TSU) term removed.
565 75313 26 22 54 22 55 It appears that the Suddick et al. reference refers only to biogenic carbon. If this section is limited to climate impacts on biogenic carbon, then it is fine as written. Otherwise, consider changing the text to "reduce biogenic and geogenic greenhouse gas emissions (Suddick et al, 2010; Nelson et al. 2009)."� Many agricultural practices impacts fossil fuel emissions (i.e., geogenic emissions) as well as soil C and N2O emissions (i.e., biogenic emissions).C170 Nelson, R.G., C.M. Hellwinckel, C.C. Brandt, T.O. West, D.G. De La Torre Ugarte, and G. Marland. 2009. Energy use and carbon dioxide emissions from cropland production in the United States, 1990-2004. Journal of Environmental Quality 38: 418-425. (UNITED STATES OF AMERICA)
Sentence revised as suggested, and Nelson reference added.
566 75314 26 23 5 23 5 26.5.2 and 25.5.3.1 : On page 21, line 54 and page 23, line 5 there are references to Jackson and Wheeler, 2010. However, this paper does not appear in the list of references. Please correct. (UNITED STATES OF AMERICA)
Reference has now been removed from the text.

IPCC WGII AR5 Chapter 26 SECOND-ORDER DRAFT
Government and Expert Review Page 48 of 68 28 March - 24 May 2013
# ID ChFrom Page
From Line
To Page
To Line Comment Response
567 75315 26 23 5 23 5 26.5.3.1 : While some organic practices may lower greenhouse gas emissions, others, such as flame cultivation, could increase emissions. This blanket statement seems unjustified given the diversity of practices that meet the definitions of both conventional and organic agriculture. It is not possible to judge the support provided by the Jackson and Wheeler reference as the full citation is not listed in the references section. Please correct the reference and use more qualified language or drop this statement about the greenhouse gas impacts of organic agriculture. (UNITED STATES OF AMERICA)
Reference to organics has been removed.
568 64406 26 23 9 0 0 Revise subtitle to refer to barriers and enablers of adaptation. There is nothing here that constitutes criteria. (Don Lemmen, Canada National Study)
So revised.
569 80887 26 23 10 23 25 Examples of adaptation strategies in Mexico include: “Promote soil remediation programs and crop insurance; use climate information systems; change temporal range of crops and select crops resistant to droughts; diversify the activities of farmers; and capture rainwater and extend the drip irrigation infrastructure”, among others (Sosa-Rodriguez, 2013). (Fabiola S. Sosa-Rodriguez, University of Waterloo)
Some of suggested text (did not have room for entire suggestion) and reference have been added
570 75316 26 23 11 23 25 This section (26.5.3.2) mentions market forces and communication as being key criteria for adaptation. It also recognizes that market forces are not always sufficient. While communication is important, the section does not state what should be communicated. I suggest adding a statement regarding the need for information on optimum crop management practices, including production inputs and optimum geographic locations for given crops, and how this information could be used to guide adaptation practices. If a study has been conducted comparing current global crop yields to how those yields may change in the future, this would be a good study to cite here. We need information on these changes to help guide adaptation efforts. (UNITED STATES OF AMERICA)
Sentence revised as suggested.
571 83749 26 23 12 23 12 Casual usage of "unlikely" should be avoided, as it is a reserved likelihood term. (Katharine Mach, IPCC WGII TSU) likelihood term removed from sentence.
572 64407 26 23 31 23 32 For Canada, in addition to reference to Lemmen et al (2008) it is extremely important to include reference to Séguin (2008). Citation - Séguin, J. (editor) 2008. Human Health in a Changing Climate: A Canadian assessment of Vulnerabilities and Adaptive Capacity; Health Canada, Ottawa, ON., 484 p. (Don Lemmen, Canada National Study)
This reference has been added.
573 83750 26 23 41 0 0 Section 26.6.1. The title of this section should be revised to fully reflect the scope of material considered--"observed impacts, vulnerabilities, and trends"? (Katharine Mach, IPCC WGII TSU)
This has been edited.
574 83751 26 23 45 23 54 Should other storm-related impacts, such as those associated with high winds, be discussed? (Katharine Mach, IPCC WGII TSU)
We do allude to health risks due to blowing and folling objects. Space limitations preclude more extensive discussion.
575 64217 26 23 49 0 0 Another indirect risk often not considered is that if most major health infrastructure including hospitals and transportation to coastal cities is damaged it puts populations dependent on both health and other services ( like transportation of food stuffs) in the "hinterland" at risk. (Ian Church, Canadian Foundation for Climate and Atmospheric Science/ IPY Canada)
Text has been edited to include this concept.
576 64408 26 24 1 24 4 An important additional reference is bethel et al. (2011) as it provides further evidence of mental health outcomes from natural hazards specifically. Citation - Bethel, J. W., Foreman, A. N., & Burke, S. C. (2011). Disaster preparedness among medically vulnerable populations. American Journal of Preventive Medicine, 40(2), 139-143. (Don Lemmen, Canada National Study)
This reference has been added.
577 62820 26 24 8 0 0 work on heat related illness being done at Oregon State University particularly focusing on latino farm workers by Jeff Bethel (Dominique Bachelet, Conservation Biology Institute)
Full reference not provided.
578 83752 26 24 10 24 13 For these described sensitivities, is it possible to specify the time frames and geographic regions over which they have been observed, as well as the mechanisms of the effects? (Katharine Mach, IPCC WGII TSU)
We have added geographic specificity but have left mechanisms to be covered in the Human Health chapter.
579 64409 26 24 11 24 12 It would be useful to add relevant canadian references to this list. They would include Kovats and Hajat (2008), Kenny et al. (2010), hajat and Kosatsky (2010). Citations - Kovats, R. S., & Hajat, S. (2008). Heat stress and public health: A critical review. Kenny, G. P., Yardley, J., Brown, C., Sigal, R. J., & Jay, O. (2010). Heat stress in older individuals and patients with common chronic diseases. CMAJ, 182(10), 1053-1060. Hajat, S., & Kosatky, T. (2010). Heat-related mortality: A review and exploration of heterogeneity. Journal of Epidemiology and Community Health, 64(9), 753-760. (Don Lemmen, Canada National Study)
These references have been added.
580 64410 26 24 16 0 0 Throughout chapter avoid describing studies as "recent". In the context of this chapter, 2008 is not recent. (Don Lemmen, Canada National Study)
These have been deleted throughout the section.

IPCC WGII AR5 Chapter 26 SECOND-ORDER DRAFT
Government and Expert Review Page 49 of 68 28 March - 24 May 2013
# ID ChFrom Page
From Line
To Page
To Line Comment Response
581 75317 26 24 28 24 30 26.6.1.3 : The statement that forest fires can lead to respiratory diseases immediately follows a statement that climate has no as-yet identified relation to air quality. If forest fires are mentioned as a link between emissions sources, climate, and health, that needs to be spelled out. (UNITED STATES OF AMERICA)
The preceding sentence has been edited.
582 64411 26 24 32 24 33 A useful reference for this currently unsupported statement might be Potera (2011) Citation - Potera, C. (2011). Indoor Air Quality: Climate Change Impacts Indoor Environment. Environmental Health Perspectives, 119(9), A382. (Don Lemmen, Canada National Study)
This has been added.
583 83753 26 24 32 24 33 Where "likely" is used here, a level of confidence seems more appropriate and should be considered by the author team. Alternatively, a synonym such as "expected" could be used. (Katharine Mach, IPCC WGII TSU)
This has been edited.
584 75318 26 24 43 24 47 This sentence does not make sense. Some text is missing here. (UNITED STATES OF AMERICA) This has been edited.
585 62818 26 24 49 0 0 what reference for earlier pollen season in the US? can cite national phenology network reporting earlier blooms … (Dominique Bachelet, Conservation Biology Institute)
Statement has been edited.
586 64412 26 25 1 25 14 It is important to also note that severe storms and other extreme water events have a significant impact on water-borne diseases. One useful reference is Thomas et al. (2006). Citation - Thomas, M. K., Charron, D. F., Waltner-Toews, D., Schuster, C. J., Maarouf, A. R., & Holt, J. D. (2006). A role of high impact weather events in waterborne disease outbreaks in Canada. International Journal of Environmental Health Research, 16(3), 167-180. (Don Lemmen, Canada National Study)
Citation and statement added.
587 75319 26 25 17 25 35 26.6.1.6 : It seems that other sections have stuck to categorizing place specific outcomes; this section aggregates the potential vector-borne diseases to apply to all North America. Is this the case or should they be disaggregated (e.g., it would be surprising to see chikungunya in the US, line 34) (UNITED STATES OF AMERICA)
Space limitations preclude more detailed discussion of impacts.
588 62819 26 25 25 0 0 reports of mosquitoes, ticks moving in elevation: villages now dealing with insects that did not use to be at those elevations so human populations maladapted and now vulnerable (Dominique Bachelet, Conservation Biology Institute)
This is a good point, and is covered in the health chapter. Space limitations prevent further discussion here.
589 64413 26 25 30 25 31 For references discussing Lyme disease, add Koffi et al. (2012) and Leighton et al. (2012) - which documnet the increasing number of cases of Lyme disease in Canada and show how teh Lyme disease vectors are spreading along climate-determined trajectories.Citation - Koffi, J. K., Leighton, P. A., Pelcat, Y., Trudel, L., Lindsay, L. R., Milord, F., & Ogden, N. H. (2012). Passive surveillance for Ixodesscapularis ticks: Enhanced analysis for early detection of emerging Lyme disease risk. Journal of Medical Entomology, 49(2), 400-409. Leighton, P. A., Koffi, J. K., Pelcat, Y., Lindsay, L. R., & Ogden, N. H. (2012). Predicting the speed of tick invasion: An empirical model of range expansion for the Lyme disease vector Ixodes scapularis in Canada. Journal of Applied Ecology, 49(2), 457-464. (Don Lemmen, Canada National Study)
Text and ciitations added
590 64414 26 25 49 25 54 A useful additional reference here is Kelley et al. (2012). That analysis shows that declining air quality associated with increased temperatures can be offset, partially or completely, through measures taken to limit emission of pollutants. Citation - Kelly, J., Makar, P. A., & Plummer, D. A. (2012). Projections of Mid-Century Summer Air-Quality for North America: Effects of Changes in Climate and Precursor Emissions. Atmospheric Chemistry and Physics, 12, 3875-3940. doi:10.5194/acpd-12-3875-2012. (Don Lemmen, Canada National Study)
This concept and reference has been added.
591 76852 26 25 51 28 51 Dell et al. 2013 citation does not appear in the reference list. (Michael Scott, Pacific Northwest National Laboratory) That citation does not appear in the location indicated.
592 61663 26 25 53 26 1 What does the literature on PM2.5 report? Are there any projections of future effects of PM2.5 on health? (European Union DG Research, Directorate Environment Climate Change & Environmental Risks Unit)
Text has been edited regarding future projections.
593 83754 26 26 6 26 6 Where "likely" is used here, a level of confidence seems more appropriate and should be considered by the author team. Alternatively, a synonym such as "expected" could be used. (Katharine Mach, IPCC WGII TSU)
This has been edited.
594 83755 26 26 7 26 7 Projected to change due to climate change or due to other drivers? (Katharine Mach, IPCC WGII TSU) Text has been edited. -
IPCC WGII AR5 Chapter 26 SECOND-ORDER DRAFT
Government and Expert Review Page 50 of 68 28 March - 24 May 2013
# ID ChFrom Page
From Line
To Page
To Line Comment Response
595 80888 26 26 22 26 35 Examples of adaptation strategies in Mexico include: “Prevent and treat climate-related diseases by distributing oral serum and through organizing vaccination campaigns; improve diagnosis, treatment and prevention of gastrointestinal diseases by raising people’s awareness about symptoms, treatments and preventive actions; implement early warning systems to avoid disease spread; protect the most vulnerable people during extreme heat/cold periods; and improve water quality and its monitoring” (Sosa-Rodriguez, 2013). (Fabiola S. Sosa-Rodriguez, University of Waterloo)
Full reference not provided. Cannot locate.
596 80889 26 26 22 26 35 Examples of adaptation strategies in Canada include: “The Toronto’s Heat Health Alert System”. Reference: Adapting to Climate Change. An introduction for Canadian Municipalities. 2010. Government of Canada. (Fabiola S. Sosa-Rodriguez, University of Waterloo)
Space does not permit citing the many city-specific alert systems.
597 83756 26 26 24 26 24 It could be helpful to specify the range of health-related impacts for which early warning and response systems are most relevant. (Katharine Mach, IPCC WGII TSU)
This has been added.
598 75320 26 26 24 26 35 26.6.3 Why is early warning under temperature but not floods? Seems out of place in the ordering. Line 34 talks about tree planting initiatives (could cite Springfield, Edmonton etc) but neglects to mention there may be drawbacks to trees/green infrastructure. E.g., They need water, they may not survive extreme heat. Suggest that the authors explain tha the impacts of climate change on health are not evenly distributed. Morello-Frosch, R. (n.d.). The Climate Gap: Inequalities in How Climate Change Hurts Americans and How to Close the Gap. Selected pages 5-17. (UNITED STATES OF AMERICA)
Full citatin not provided. Text has been strengthenned to include these concepts.
599 75321 26 26 34 26 35 26.6.3 : Citation needed. (UNITED STATES OF AMERICA) Text has been removed.
600 64415 26 26 38 32 8 Parallel structure is needed throughout this section (Energy and Transportation currently lack sections on adaptation). Length of subsections should be proportionate with information available. A sequencing that parallels that of Chapter 10 would be more logical (and could be used as the rationale for that structure). In that case this section would start with energy, transportation, mining, manufacturing, construction, tourism and insurance. Tourism warrants its own section. Cross-references to findings of Chapter 10 would be useful. (Don Lemmen, Canada National Study)
Thank you, we agree. Have changed the order of the sub-sections to reflect chapter 10. Tourism section has been removed due to space limits.
601 75322 26 26 40 26 49 26.7 : Suggest that section discuss how different sectors are related. See Kirshen, P., M. Ruth, et al. (2008). "Interdependencies of Urban Climate Change Impacts and Adaptation Strategies: a Case Study of Metropolitan Boston USA." Climatic Change 86(1-2): 105-122. Also suggest that this section mention changes in building/infrastructure design codes, See Heather Auld, E. C. (2010). The Changing Climate and National Building Codes and Standards. In Ninth Symposium on the Urban Environment. Also (UNITED STATES OF AMERICA)
Auld 2010 is cited.
602 83757 26 26 46 26 48 Where evidence and literature are described here, the chapter team might consider use of calibrated uncertainty language, such as summary terms for evidence and agreement. (Katharine Mach, IPCC WGII TSU)
Thank you.
603 75323 26 27 1 27 49 26.7.1 : Should discuss the difficulty in cataloging adaptation from the private sector (see reading from work) Agrawala, S. et al. (2011), "Private Sector Engagement in Adaptation to Climate Change: Approaches to Managing Climate Risks", OECD Environment Working Papers, No. 39, OECD Publishing. http://dx.doi.org/10.1787/5kg221jkf1g7-en (UNITED STATES OF AMERICA)
Thank you but we are concerned about word count limit.
604 83758 26 27 3 0 0 Section 26.7.1.1. The title of this section should be revised to fully reflect the scope of material considered-- perhaps "observed impacts, vulnerabilities, and trends"? (Katharine Mach, IPCC WGII TSU)
Thank you but the title was chosen to be consistent with sub-headings across all subsections.

IPCC WGII AR5 Chapter 26 SECOND-ORDER DRAFT
Government and Expert Review Page 51 of 68 28 March - 24 May 2013
# ID ChFrom Page
From Line
To Page
To Line Comment Response
605 64218 26 27 5 27 17 One of the largest challenges alluded to here is the notion of on time delivery commonly used in manufacturing but also aspects of retail and the delivery of crtical materials suchas food. I served far a few years as the Superintendent of Yoho National Park in Canada. The park situated inthe Rocky Mountains was responsible for the TransCanada Highway,sections of which were vulnerable to avalanches. (we also hosted teh mainline of the Canadian Pacific Railway). During meetings with the trucking in 1987 we were informed that unlike in the past a closure of more than 4 hours could not be tolerated because all grocery warehousing now occured in Calgary Alberta and anymore of a delay disrupted supply of food stuffs to British Columbia. The challenge was that between Calgary and Vancouver most road routes passed through at least 4 mountian passes vulnerable to closures. Now living in the Yukon I see similar bottlenecks at work. During June of 2012 all the road routes connecting most Yukon communities with regular outside supply in southern Canada and emergenecy supply from Alaska ( a totalof 5 corridors) were shut down by floods and landslides/debris flows. Store shelves emptied and gorceries were being flown in. Likewise in our modern world disruption of critical telecommunications can seriously disrupt the securtiy of individuals and business. Again in the Yukon there is only one fibre optic link to theoutside and it is also routed on into the Mackenzie Delta communities in the NWT. It is not uncommon to have that link severed shutting down all services including the ability of retailers utilizing "outside" server banks and the financial industry. It is not uncommon to find tourists stranded because they cannot access utilize credit card or banking services. There is also a concern for industries such as mining when located in relatively isolated areas or at teh end of a single transportation corridor. For instance during the June 2012 event the single access road from the Yukon to the mine in Tungsten NWT washed out and the mine had to close and evacuate many employees. It would be more problematic if at the time the weather event had triggered an environmental challenge and critical supplies such as electricity or reagents or equipment such as heavy equipment or pumps could not be delivered. These types of disruptions would be less problematic when alternative routings are available- especially when those routings arrive pass through different natural regions and are less likely to be expierencing disruptive events concurrently. (Ian Church, Canadian Foundation for Climate and Atmospheric Science/ IPY Canada)
Thank you. Have added brief text to section.
606 75324 26 27 20 27 36 26.7.1.2 : What does the economics literature say about the distributional effects of negative shocks to US manufacturing? Climate change will affect shareholders, consumers, and employees differently. For example, the effects on shareholders vs. consumers depends on how much of increased costs can be passed through to customers. The effects on employment may be different than the effect on firms because firms can pick up and move more easily than employees. One possible starting place for this literature on US manufacturing is this paper and the citations in the introduction: http://faculty.haas.berkeley.edu/rwalker/research/walker_transitional_co... (UNITED STATES OF AMERICA)
Thank you- reviewed the suggested references, not sure about the direct link between the paper and climate change impacts and adaptation, and the ability to incorporate this (with appropriate citations) within the word count constraints.
607 75325 26 27 22 27 31 26.7.1.2 Manufacturing, Projected Impacts : Backus et al is cited numerous times, and the approach of the paper is described, but no results are included. Does the study find significant effects? Why not include them? (UNITED STATES OF AMERICA)
Reduced # of references to study and did not included specific numerical findings due to assumptions made in the methodology, and considerations not included (e.g., only considered precipitation). Still wish to reference study as it takes an interesting approach and is one of few that focuses on wide range of sectors, including manufacturing.
608 83759 26 27 25 27 28 If possible, the scenarios of climate change used in this study should be specified. (Katharine Mach, IPCC WGII TSU) Scenario added.
609 64219 26 27 30 27 31 Lately there has been considerable press coverabe of the disruption of barge trafffic on the Mississippi because of low water (Ian Church, Canadian Foundation for Climate and Atmospheric Science/ IPY Canada)
added to "observed impacts" section
610 75326 26 27 39 27 49 26.7.1.3 : Long-run adaptation strategies also include sourcing raw materials from different, less affected regions. And moving manufacturing plants to different areas (UNITED STATES OF AMERICA)
Added a sentence to adaptation section- would like a referene for this- can we follow up with reviewer?
611 83760 26 27 41 27 43 Where evidence is described here, the chapter team may wish to consider assigning summary terms for evidence and agreement. (Katharine Mach, IPCC WGII TSU)
rephrased
612 75327 26 27 43 27 44 26.7.1.3 Manufacturing Adaptation : Is this an appropriate place to bring up trade-offs between mitigation and adaptation? Increasing AC as an adaptation will also likely increase emissions from electricity production. (UNITED STATES OF AMERICA)
I think this would belong better in the energy section as it is not unique to manufacturing.

IPCC WGII AR5 Chapter 26 SECOND-ORDER DRAFT
Government and Expert Review Page 52 of 68 28 March - 24 May 2013
# ID ChFrom Page
From Line
To Page
To Line Comment Response
613 83761 26 28 3 0 0 Section 26.7.2.1. Should the title of this section be revised to fully reflect the scope of material considered, for example "observed impacts, vulnerabilities, and trends"? (Katharine Mach, IPCC WGII TSU)
We want to be consistent with sub-headings across all subsections.
614 76853 26 28 8 28 22 I am not sure if the following report is eligible gray literature for citation, but it provides updates to Wilbanks et al 2008: Wilbanks, Tom; Bilello, Dan; Schmalzer, David; Arent, Doug; Buizer, Jim; Chum, Helena; Dell, Jan; Edmonds, Jae; Franco, Guido; Jones, Russell; Rose, Steve; Roy, Nikki; Sanstad, Alan; Seidel, Steve; Weyant, John; and Wuebbles, Don"Climate Change and Energy Supply and Use: Technical Report for the U.S. Department of Energy in Support of the National Climate Assessment." Oak Ridge National Laboratory, Oak Ridge, Tennessee.2012. (Michael Scott, Pacific Northwest National Laboratory)
Have cited in revision
615 83762 26 28 19 28 19 Casual usage of "likely" should be avoided, as it is a reserved likelihood term. (Katharine Mach, IPCC WGII TSU) removed
616 83763 26 28 35 28 36 Where evidence is described here, the chapter team may wish to consider assigning summary terms for evidence and agreement. (Katharine Mach, IPCC WGII TSU)
rephrased
617 64220 26 28 39 28 40 the Canadian Government ammended the Candain Environmental Assesment Act in 2012 - many feel seriously weakening the act. http://laws-lois.justice.gc.ca/PDF/C-15.21.pdf. The words "climate"& "weather" do not appear. A procedural guidance document prepared by a committee of federal/ provincial and territorial managers ( which I sat on) responsible for environmental assessment published in November 2003 still appears on the Canadian Environmental Assessment Agency web site Incorporating Climate Change Considerations in Environmental Assessment: General Guidance for Practitioners http://www.ceaa.gc.ca/default.asp?lang=En&n=A41F45C5-1&offset=&toc=hide Most EAs are now conducted under provicial/ territorial or legislation origianting from First Nation / Inuit Final Agreements. The authors may want to check witht he Canadian Environmental Assessment Agency (Ian Church, Canadian Foundation for Climate and Atmospheric Science/ IPY Canada)
Thank you- we removed the sentence and are following up with CEAA for future reference.
618 64416 26 28 45 29 22 The Energy section requires considerable work. The importance of seasonal changes in energy demand and implications for different subsectors (electricity / oil and gas) is understated. Projected impacts deal largely with energy supply, and should be supplemented by projected changes in energy demand as well as on transmission systems (frequently a critical vulnerability). Reference needs to be made to the Energy-Water Nexus discussion of section 26.3.3.5 (and consider moving that discussion into this section). Most importantly there needs to be a section on adaptation that includes documented initiatives related to energy efficiency (e.g. Scott, M. J., Dirks, J. A., and Cort, K. A. (2008). The value of energy efficiency programs for US residential and commercial buildings in a warmer world. Mitigation and Adaptation Strategies for Global Change, 13(4), 307-339) and adaptive management in the hydroelectricity sector (e.g. Georgakakos, A. P., Yao, H., Kistenmacher, M., Georgakakos, K. P., Graham, N. E., Cheng, F.–Y., Spencer, C., and Shamir, E. (2012). Value of adaptive water resources management in northern California under climatic variability and change: Reservoir management. Journal of Hydrology, 412-413, 34-46). Useful general references include 1 - Schaeffer, R., Szklo, A. S., Pereira de Lucena, A. F., Moreira Cesar Borba, B. S., Pupo Nogueira, L. P., Fleming, F. P., Trocolli, A., Harrison, M., and Boulahya, M. S. (2012). Energy sector vulnerability to climate change: A review. Energy, 38(1), 1-12; and 2 - Ebinger, J., and Vergara, W. (2011). Climate impacts of energy systems: key issues for energy sector adaptation; The World Bank, Washington, DC, 178 p. (Don Lemmen, Canada National Study)
Have made substantial changes to the energy section. Have added many references including Schaeffer et al. Have added discussion on seasonal energy demand. Move energy water discussion from water to energy. Have added discussion on adaptation.
619 83764 26 28 47 0 0 Section 26.7.3.1. Should the title of this section be revised to fully reflect the scope of material considered, for example "observed impacts, vulnerabilities, and trends"? (Katharine Mach, IPCC WGII TSU)
Thank you but the title was chosen to be consistent with sub-headings across all sections so it has not been changed
620 69797 26 28 49 28 49 The first sentence of this paragraph "The energy is particularly sensitive…distributed among countries." doesn't make sense to me. We don't know what the authors want to say here so we cannot suggest an alternative phrasing. (NETHERLANDS)
Agree; sentence has been revised
621 75328 26 28 49 28 52 This paragraph has typing errors. First sentence should read "The energy sector..." Line 51 also has reference typo. (UNITED STATES OF AMERICA)
Have corrected
622 76851 26 28 50 28 51 Characterization of energy demand for the last 40 years: Citations are need for this statement. (Michael Scott, Pacific Northwest National Laboratory)
Have dropped statement
623 62821 26 29 1 0 0 no mention of siting solar panels, wind turbine and the huge impact on wildlife habitat, local wind patterns, bat and bird migration etc; also should mention the extensive work by Dennis Lettenmaier's group on impacts in Columbia river basin (Dominique Bachelet, Conservation Biology Institute)
We unfortunately do not have room in the chapter to get into this level of detail
IPCC WGII AR5 Chapter 26 SECOND-ORDER DRAFT
Government and Expert Review Page 53 of 68 28 March - 24 May 2013
# ID ChFrom Page
From Line
To Page
To Line Comment Response
624 75329 26 29 1 29 22 26.7.3.2 : Should also discuss impacts on electricity transmission and distribution infrastructure Consider citing: Scripps Institute of Oceanography held a workshop in 2011 titled the "California Climate Extremes Workshop." The published workshop report has lots of great info on projected climate impacts. Available at http://sio.ucsd.edu/extreme_climate/CA_climate_extremes_report_SIO_Dec20... (UNITED STATES OF AMERICA)
We cannot cite a workshop report, but will add short discussion on infrastructure [revist]
625 75330 26 29 1 29 22 The section on Energy impacts describes the direct effects of altered temperature and precipitation on energy generation and demand. Consider adding some discussion of the effect of climate change (SLR, extreme events) on energy infrastructure (UNITED STATES OF AMERICA)
Will mention SLR and extreme events
626 71442 26 29 3 29 3 As currently written, the sentence is not correct (i.e., appears to be total energy demand and it is only one model simulation). Suggest adding the word "residential" in the phrase so it reads -- decrease in annual residential energy demand" (CANADA)
The reviewer is correct. It is "residential" and the word has been added
627 71443 26 29 3 29 3 Suggest that the sentence convey clearly that climate change impacts will result in a decrease in energy demand, but that total energy demand will continue to growth. In other words, climate change will partially offset the growth in energy demand that will occur in Canada. (CANADA)
We address growth in baseline energy demand and net effect of climate change
628 75331 26 29 3 39 3 First sentence makes no sense -- something is missing. (UNITED STATES OF AMERICA) Rewritten
629 75332 26 29 4 29 4 26.7.3.2 : The claim that electricity demand will change - 15 to + 4 percent by 2080 seems to be confounding ongoing decreases in demand due to energy efficiency gains with the additional effects of climate change. The right question is not just what electricity consumption will be in 2080, but how much climate change will cause it to be different than what it would otherwise be in a world without climate change. (In other words, please clarify your assumptions about the baseline without climate change). Consider Citing: (1) Auffhammer, M and Anin Aroonruengsawat. 2011. Simulating the Impacts of Climate Change, Prices and Population on California's Residential Electricity Consumption. Climatic Change. 109(S1): 191-210. (2) Deschennes, O. and M. Greenstone. 2011. Climate Change, Mortality, and Adaptation: Evidence from Annual Fluctuations in Weather in the U.S. (with M. Greenstone), American Economic Journal: Applied Economics, 3(4): 152-185 (UNITED STATES OF AMERICA)
Clarified to make it clear that changes are projected from baseline changes, not net changes in electricity demand from today.
630 83765 26 29 4 29 5 It would be preferable to specify the scenarios of climate change for this projection as well as the importance of other drivers. For example, it is not clear if any of the statements in this paragraph pertain to effects due to climate change or due to other drivers. (Katharine Mach, IPCC WGII TSU)
have clarified that baseline energy demand will increase
631 71444 26 29 5 29 5 Delete one of the "," after 2008),, (CANADA) Done
632 80890 26 29 5 29 5 Typo (Fabiola S. Sosa-Rodriguez, University of Waterloo) Thank you
633 71445 26 29 8 29 9 Hydropower is a form of energy production; therefore, the text cannot say that rising temperatures will affect both energy production and hydropower. Please consider revising this sentence. (CANADA)
Rewritten
634 75333 26 29 8 29 22 26.7.3.2 Energy, Projected Impacts : The whole section cites Wilbanks et al. 2008 for many general statements. Wilibanks et al. 2008 is already a synthesis report and it is unclear what is a studied effect and what is a reasonably assumed effect. It would be nice to see these statements referenced to citations within Wilbanks et al. 2008. (UNITED STATES OF AMERICA)
We are referencing synthesis studies such as DOE (2013), Wilbanks et al. (2012), and Wilbanks et al. (2008). There is insufficient space to explore the many supporting studies. We think the use of synthesis reports is appropriate as there is not space to do a detailed assessemnt of energy and climate change
635 71446 26 29 16 29 18 The figures in this sentence apply to the Peribonka River only and cannot be used to describe the impacts on the entire St. Lawrence and Great Lakes region. (CANADA)
Corrected
636 83766 26 29 16 29 18 For these projections, it would be helpful to specify the scenarios of climate change and ranges of projected values. (Katharine Mach, IPCC WGII TSU)
Have done so
637 62822 26 29 25 0 0 a comparison of insurance companies in North America vs western Europe would be useful. Climate change insurance available in a "package" in Europe while individual event insurance is the norm in the USA - for greater profits less social benefots. (Dominique Bachelet, Conservation Biology Institute)
Thank you but word limit prevents including a discussion on this.

IPCC WGII AR5 Chapter 26 SECOND-ORDER DRAFT
Government and Expert Review Page 54 of 68 28 March - 24 May 2013
# ID ChFrom Page
From Line
To Page
To Line Comment Response
638 75334 26 29 25 30 27 (1) Given how lightly this section touches on the insurance issue, a cross reference to the more in-depth discussion in 10.7 may be constructive. (2) The significant presence and role of public insurance (e.g., Crop [USDA] and Flood [FEMA] in the US) is not mentioned. (3) Significant un-insured or underinsured segments of the market should be mentioned, and this trend is worsening (increasing vulnerability). [Reference is made for the case of Mexico on page 7, line 36 and elsewhere, but no parallel discussion is offered for Canada or the US). While it may be argued that that is an issue for insurance customers rather than insurers, it is clear that the industry is responding (adapting) by limiting availability of its products in some cases (or that its pricing responses are or will make insurance unaffordable to some). Similarly, raising deductibles has shifted exposure from insurers to their customers. (4) Focus of this section is strictly on underwriting. For completeness, the massive "asset management" side of this industry should be discussed (vulnerability/adaptation), as about 1/3 of global investment is done by insurers. (5) Munich Reinsurance Company's new study on severe weather events in North America should be reviewed for relevance to this section. See http://www.munichreamerica.com/ks_severe_weather_na_order.shtml (UNITED STATES OF AMERICA)
Thank you for these comments. (1) Have included cross-references to section 10.7; (2) Have added text on public insurance in the US; (3) This topic is addressed in more detail in Ch. 10. Since the issue is not unique to North America, we have not expanded on it here; (4) Space limitation prevents discussion of asset management; (5) Have reviewed and cited Munich Re paper.
639 83767 26 29 27 0 0 Section 26.7.4.1. The title of this section could be revised to more fully reflect the scope of material considered--"observed impacts, vulnerabilities, and trends"? (Katharine Mach, IPCC WGII TSU)
The section title was chosen to ensure consistency across the chapter.
640 75335 26 29 32 29 34 This literature does not contain definitive work on adaptation. The balance of causal factors is not quantitatively understood. Care should be taken that the level of certainty implied by the statements does not extend beyond what the literature supports. If the treatment of this issue differs from that in AR4, explanation should be given. The treatment of these issues in sections 2.3.3.2 and 10.7.3 are a bit more appropriately nuanced. (UNITED STATES OF AMERICA)
We revised this to be more nuanced
641 75336 26 29 36 29 38 26.7.4.1 Insurance, Observed Impacts : A citation is needed for this paragraph (UNITED STATES OF AMERICA) Reference now included.
642 83768 26 29 36 29 38 Citations should be provided to fully support these statements. (Katharine Mach, IPCC WGII TSU) Reference now included.
643 75337 26 29 41 29 47 26.7.4.2 : Flood insurance in the US is provided only by the federal government, so increased flood claims will be felt by taxpayers unless premiums are adjusted. What about other major risks -- fire, etc? (UNITED STATES OF AMERICA)
The literature reports that rising hurricane, tornado, and fire has also led to rising insurance costs for property owners.
644 75338 26 29 45 29 47 26.7.4.2 : Frequency, area and severity are all separate, somewhat independent aspects of natural disturbances. Consider rewriting as: "There is also an expectation that some weather events in North America will increase in severity, such as storm class of Atlantic hurricanes, others in area affected, such as the area burned by wildfire (Karl et al., 2008; Balshi et al., 2009), and others in frequency, including intense rainfall events (Field et al., 2012)." Consider Citing: Balshi, M. S., A. D. McGuirez, P. Duffy, M. Flannigan, J. Walsh, and J. Melillo. 2009. Assessing the response of area burned to changing climate in western boreal North America using a Multivariate Adaptive Regression Splines (MARS) approach. Global Change Biology 15:578-600. (UNITED STATES OF AMERICA)
We agree and will seek to include.
645 83769 26 29 45 29 47 Cross-reference to findings from the working group 1 contribution to the 5th assessment report, the special report on extremes, and earlier chapter sections should be made to enable a more precise statement here. (Katharine Mach, IPCC WGII TSU)
We will seek to cross reference.
646 75339 26 29 50 29 54 26.7.4.3 : Justin Gallagher has a paper about what affects homeowner decisions whether or not to purchase flood insurance. It could be cited here, and it may also include citations to other relevant papers, http://faculty.weatherhead.case.edu/jpg75/pdfs/floods_082712.pdf (UNITED STATES OF AMERICA)
Reference now included.
647 75340 26 29 50 30 24 26.7.4.3 : This is missing one important adaptation strategy: Reform of insurance premiums (especially federal flood insurance) to reflect the actuarial risk of living in flood-prone places (e.g. coastal floodplains). Currently homeowners don't face appropriate incentives because of the availability of artificially low-cost federal flood insurance. (UNITED STATES OF AMERICA)
We agree and will add to the text.
648 75341 26 29 53 29 53 Better citations are: Mills, E. 2005. "Insurance in a Climate of Change," 309, 1040-1044 and Mills, E. 2012. "The Greening of Insurance," Science 338, 1424 -1425. Note that Mills 2012 suggest increasing evidence for insurer engagement in adaptation in other countries. (UNITED STATES OF AMERICA)
Mills 2012 now included.
649 75342 26 29 53 30 8 Little of this applies in the case of Mexico. The distinction should probably be made. (UNITED STATES OF AMERICA) We agree.
650 75343 26 30 10 30 10 Reference needed for this sentence. (UNITED STATES OF AMERICA) Reference now included.
IPCC WGII AR5 Chapter 26 SECOND-ORDER DRAFT
Government and Expert Review Page 55 of 68 28 March - 24 May 2013
# ID ChFrom Page
From Line
To Page
To Line Comment Response
651 75344 26 30 10 30 18 26.7.4.3 Insurance, Adaptations : 1) There is no (clear) citation for the Bank of International Settlements study and 2) it is unclear how much information in the following sentences are attributed to this study. (UNITED STATES OF AMERICA)
Reference included.
652 64417 26 30 10 30 24 Reference needs to be provided for the Bank of International Settlements study. The final sentence of this section can be deleted with no loss of substantive content. (Don Lemmen, Canada National Study)
Reference included. Disagree with deleting final sentence.
653 80891 26 30 15 30 15 Replace “ In contrast Mexico ….” By “In contrast, Mexico…” (Fabiola S. Sosa-Rodriguez, University of Waterloo) Done.
654 80892 26 30 15 30 15 Remove parenthesis (Fabiola S. Sosa-Rodriguez, University of Waterloo) Done.
655 71447 26 30 19 30 19 Add a space to separate the two paragraphs (CANADA) Done.
656 75345 26 30 27 32 8 26.7.5 : As they are discussed in this section neither construction and housing nor transportation are service industries. (UNITED STATES OF AMERICA)
Thank you. Organization of sections has been changed.
657 64418 26 30 29 30 30 The two references provided (Ford et al., 2010, 2011) are focused on the mining sector and do not support the sentence they appear in. (Don Lemmen, Canada National Study)
Yes, those should not be there.
658 64419 26 30 29 30 37 It is not clear why discussion of tourism is limited to this overview paragraph, especially when there is more published literature on tourism than most of the other industries discussed here. If space is the issue, the case could be made for other industries such as manufacturing and construction should be treated in the same way that tourism is in this draft. (Don Lemmen, Canada National Study)
The section on tourism has been removed to due limited space available.
659 83770 26 30 42 0 0 Section 26.7.5.1.1. The title of this section could be revised to more fully reflect the scope of material considered--"observed impacts, vulnerabilities, and trends". (Katharine Mach, IPCC WGII TSU)
This title has been chosen in order to be consistent with other sections.
660 71448 26 30 45 30 46 Should the start of the sentence in line 46 be moved-up to line 45? (CANADA) Change made
661 69798 26 30 46 30 49 This paragraph has no references. It makes claims that should be substantiated by references, such as "Studies indicate that the increase in reported damage is largely due to rising wealth and populations living at risk." (NETHERLANDS)
cited SREX, 2012
662 75346 26 30 47 30 49 26.7.5.1.1 : There is no citation for the "private data." (UNITED STATES OF AMERICA) cited Munich Re, 2012
663 64420 26 31 3 31 8 This section on projected impacts requires references. (Don Lemmen, Canada National Study) cited Kelly, Kovacs and Thistlethwaite, 2012
664 69799 26 31 3 31 8 This paragraph has no references. It makes claims that should be substantiated by references, such as "Most studies project a significant further increase in damage to homes..." (NETHERLANDS)
cited SREX, 2012; Bjarnadottir, 2011
665 75347 26 31 3 31 8 26.7.5.1.2. Construction and Housing, Observed Impacts : There is no citation for this paragraph (UNITED STATES OF AMERICA)
cited Munich Re, 2012; SREX, 2012
666 83771 26 31 5 31 5 Casual usage of "likely" should be avoided, as it is a reserved likelihood term. (Katharine Mach, IPCC WGII TSU) Removed
667 64221 26 31 13 31 27 See comments on NISI re comments regarding northern construction which includes the boreal ( 7 provicial norths in Canada) Chapter 28 Page 52 lines 44-54 above (Ian Church, Canadian Foundation for Climate and Atmospheric Science/ IPY Canada)
Sorry, don't understand the comment.
668 64421 26 31 21 31 22 The phrase "change is under way in the design and construction of new homes in reaction to recent hurricanes" requires a reference. (Don Lemmen, Canada National Study)
IIBHS, 2011; OECD, 2006
669 64422 26 31 30 32 8 This section on transportation is weak and lacks any discussion of adaptation. (Don Lemmen, Canada National Study) Discussion on adaptation has been added.
670 83772 26 31 32 0 0 Section 26.7.5.2.1. The title of this section could be revised to more fully reflect the scope of material considered--"observed impacts, vulnerabilities, and trends". (Katharine Mach, IPCC WGII TSU)
Revised
671 71449 26 31 34 31 40 Suggest changing to "thawing" permafrost. This should be consistent throughout the report. In Chapter 26, the authors use the phrase "melting permafrost" while in Chapter 28 "thawing permafrost" is used. Other chapters might need to be adjusted as well. Thawing permafrost is the preferred language. (CANADA)
Revised text to remove discussion
672 63171 26 31 36 31 36 Use the term "thawing permafrost" instead of "melting permafrost" (see above) (Sharon Smith, Geological Survey of Canada)
Revised text to remove discussion
IPCC WGII AR5 Chapter 26 SECOND-ORDER DRAFT
Government and Expert Review Page 56 of 68 28 March - 24 May 2013
# ID ChFrom Page
From Line
To Page
To Line Comment Response
673 75348 26 31 36 31 40 26.7.5.2.1. Transportation, Observed : These are observations about the transportation infrastructure are not fully attributable to climate change. This should be made clear, otherwise a reader may think that all of this cost to the transportation system is attribtued to current cliamte change. (UNITED STATES OF AMERICA)
The text does not state the impacts are because of climate change, but from extreme events. We use extreme events to demonstrate vulnerabilty to climate.
674 64423 26 31 39 31 40 I have not been able to get a copy of Mirza and Haider (2003) but expect that the figure they present refers to infrastructure as a whole, not just transportation infrastructure. Please double check the original paper. For the infrastructure deficit as a whole, a more recent estimate for Canada is $145M, although I leave it to the writing team to assess the reliability of the source (http://www.policyalternatives.ca/sites/default/files/uploads/publications/National%20Office/2013/01/Canada's%20Infrastructure%20Gap.pdf). (Don Lemmen, Canada National Study)
We checked and decided to keep Mirza and Haider
675 76854 26 31 45 31 54 Alaska has somewhat different climate impact issues than other U.S. states, facing infrastructure issues more like Canada's. One recnt article on the costs and impacts in Alaska is Peter H. Larsen, Scott Goldsmith, Orson Smith, Meghan L. Wilson, Ken Strzepek, Paul Chinowsky, Ben Saylor. 2008. Estimating future costs for Alaska public infrastructure at risk from climate change. Global Environmental Change 18(3): 442-457. (Michael Scott, Pacific Northwest National Laboratory)
Ch 26 does not cover Alaska. Alaska is covered in the Polar Regions chapter.
676 64222 26 31 51 31 54 Sentence needs clarification because it makes no sense- seems to be referring to several issues. (Ian Church, Canadian Foundation for Climate and Atmospheric Science/ IPY Canada)
Rewritten
677 83773 26 32 4 32 4 Instead of "up to 100,000 bridges" it would be preferable to specify the full range, not just the upper bound. (Katharine Mach, IPCC WGII TSU)
We inserted the range
678 83774 26 32 7 32 8 What is the timeframe for these projected costs? (Katharine Mach, IPCC WGII TSU) Text has been revised to mention timeframe
679 64424 26 32 11 40 13 This section (26.8) would benefit greatly from being restructured - it stands out from the rest of the chapter (not in a good way) and it is difficult for the reader to follow the logical flow. I would recommend that there just be two major subheadings - Urban Settlements and Rural Settlements - with both having parallel internal structure. The previous structure of "Observed Impacts", "Projected Impacts" and:"Adaptation" will work but there will need to be addition subheadings under Adaptation, to capture to current useful discussion on vulnerability (including non-climate drivers) and adaptive capacity. The purpose should be less of comparing urban and rural settlements and more on providing clear analysis of both - possibly with a concluding section that draws out the similarities. There is no need to repeat content presented elsewhere in the chapter (many aspects of the "Extreme Events" section, but there should be more cross-references to other sections of this chapter as well as to other chapters of the report. (Don Lemmen, Canada National Study)
We considered this but decided to keep the current structure because it helps the reader to understand differences and commonalities in the processes shaping vulnerabilities, impacts and adaptations within and across urban and rural settlements.
680 64425 26 32 15 32 17 Attribution to "climate variability and change" is not helpful - and the phrase "with different degrees of certainty" is confusing. There is likely value in distinguishing between changes in mean conditions (referred to Executive Summary as "slow-onset events") but attribution is just a red herring. (Don Lemmen, Canada National Study)
We changed the sentence here and in the ES
681 83775 26 32 20 0 0 Section 26.8.1.1. Would an expanded title be more appropriate here--"changes in mean conditions and their impacts"? (Katharine Mach, IPCC WGII TSU)
We only have a section 26.8.1 referring to Observed Weather and Climate Impacts
682 69800 26 32 22 32 22 “storm surges have reduced development options and increased hazard risk”. Could suggest a trend. Friesinger et al. (2010) present a survey into trends and perceived causes and risks of coastal erosion in relation to climate change. They conclude that coastal erosion increases but for most of the surveyed cases no increase of storm frequency was "perceived". Major causes of increased coastal erosion were earlier thaw of coastal material in spring and an increase of frequency of storm surges. (NETHERLANDS)
Reference included
683 83776 26 32 31 0 0 Section 26.8.1.2. Would an expanded title be more appropriate here--"Extreme events and their impacts"? (Katharine Mach, IPCC WGII TSU)
We only have a section 26.8.1 referring to Observed Weather and Climate Impacts
684 64426 26 32 35 0 0 "Argued to be" is inappropriate language for a science assessment. This would be a good place to use confidence language - "likely" or "very likely". (Don Lemmen, Canada National Study)
Addressed
685 80521 26 32 40 32 40 suggest adding: " …sucha s the Rurarmuri of Chihuahua (Imison,2012). Perhas the first violent death of water occurred during a prolonged drought in Durango state of NW Mexico when a nine year old indigenous girl was shot when she was taking water from a well in a neighboring community. (La Jornada, 9, june, 2012. Asesinan a niña indígena por tomar agua de pozo en Durango. (Gentry Blake, Institution no 1: Gente de Iitoi A.C., non-profit in Mexico. Dir. of Health Services.)
Space limits?!
686 77080 26 32 43 32 43 Insert "in part" or perhaps "in large part", between "event attributed" and "to climate change". This is because a variety of factors, including forestry practices and fire suppresion policies, apparently also contributed significantly to this outbreak. (Sean Fleming, Meteorological Service of Canada)
Done

IPCC WGII AR5 Chapter 26 SECOND-ORDER DRAFT
Government and Expert Review Page 57 of 68 28 March - 24 May 2013
# ID ChFrom Page
From Line
To Page
To Line Comment Response
687 83777 26 33 2 33 2 What metric of "heat" is relevant here--daily extremes versus heat waves? (Katharine Mach, IPCC WGII TSU) we changed it to heat-waves
688 77081 26 33 4 33 6 I suggest digging into this a little more and/or refining the wording slightly. The MPB outbreak in British Columbia actually contributed to a (short-term) economic boom in many forestry communities, due to the burst of salvage logging that ensued. If that isn't recognized here, it seems likely the passage will lose credibility. (Sean Fleming, Meteorological Service of Canada)
Text has been modified
689 83778 26 33 4 33 6 Presumably the economic crisis also played a role in this trend? If so, should it be acknowledged? (Katharine Mach, IPCC WGII TSU)
No this occurred pre-recession.
690 64216 26 33 5 0 0 Last phrase "weeds are more…" seems out of place and is part of sentence on page 21 line 52-53 (Ian Church, Canadian Foundation for Climate and Atmospheric Science/ IPY Canada)
I didn't find reference to weeds here but in p. 23.
691 83779 26 33 9 33 12 What are the time frames for these examples? (Katharine Mach, IPCC WGII TSU) Recent years!?
692 64427 26 33 29 33 30 The information in this Table should be presented in a Figure. For a Table there is the assumption that both the rows and columns are important. But in this case there is no significance to the rows. It would be much more effective as a figure. (Don Lemmen, Canada National Study)
Table removed
693 76855 26 33 33 34 43 While it is probably too early for much scholarly literature on lessons concerning vulnerability from Hurricane Sandy, there should be a consdierable number of government reports that could provide additional citations for this section by the time the next draft of this chapter is completed. Because of its salience in North Amercia, it would be a good idea to incorporate as much material as possible from that experience in the relevant sections of this chapter. (Michael Scott, Pacific Northwest National Laboratory)
We are including references to Sandy
694 64223 26 33 35 33 41 What I don't see discussed here is the compounding of vulnerabilitiy caused by multiple hazards. As a simple example I would the risk of seal level rise in areas that are protected by dykes and which are also succeptible toextreme seismic events such as along the Pacific Coast of USA and Canada - a specific example would be Richmond British Columbia . IN this case rebuilidng protective sea defences following rupture by an earthquake could take a long time. Other examples could disruptions of crtical infrastructure including transportation /communication corridors or reservoirs in steep terraine that could slide or slump both on its own or in response to weatherr or seismic events. (Ian Church, Canadian Foundation for Climate and Atmospheric Science/ IPY Canada)
Addressed under Interactive hazards and impacts compounding vulnerability
695 64428 26 33 36 33 37 Replace "Of particular concern" with "Cities of concern include" to make clear that this is not a comprehensive list and that there has not been a systematic analysis of relative vulnerability. For example, Wittrock et al note the vulnerability of Canadian prairie cities, but there has never been an analysis to compare that vulnerability to cities in other regions of Canada. (Don Lemmen, Canada National Study)
Done
696 64429 26 34 17 34 20 Strongly recommend these be characterized as "challenges" for urban adaptation planning rather than barriers. The term barriers should be limited to things that should be broken down. In the case of fragmented governance, it may be a pain for planners but it exists for other, likely very important, reasons. In most cases it is something that planners must adapt to rather than change. Top-down decision-making also should not be viewed as a barrier, as in some cases it can serve as an enabler of adaptation planning. (Don Lemmen, Canada National Study)
Move to or relate to adaptation ch.16
697 64430 26 34 40 34 41 Add "In some areas," before "marginalized populations are moving to peri-urban areas" as this is not an issue in Canada and many areas of the US. (Don Lemmen, Canada National Study)
Done
698 83780 26 34 40 34 42 To what degree is this effect being observed in Mexico versus the US versus Canada? (Katharine Mach, IPCC WGII TSU) Done
699 64431 26 34 52 0 0 Andrachuk and Pearce (2010) is not an appropriate reference for this chapter as it deals with Innuvialuit communities that are part of the Polar Regions chapter. (Don Lemmen, Canada National Study)
The statement made by this reference remains valid for indigenous communities in other parts of North America, and published literature on vulnerability among indigenous peoples outside of the far north are scarce.
IPCC WGII AR5 Chapter 26 SECOND-ORDER DRAFT
Government and Expert Review Page 58 of 68 28 March - 24 May 2013
# ID ChFrom Page
From Line
To Page
To Line Comment Response
700 64432 26 35 5 35 7 Discussion of Indigenous communities may benefit from reference to Lemmen et al. (2008). The following is quoted from the report Synthesis: "Aboriginal communities are particularly vulnerable to climate changes…. Aboriginal communities, many of which retain strong linkages to the land for both economic and cultural well-being, are also particularly vulnerable to climate change (Chapters 3–8). The subsistence economy may constitute up to 50% of the total income in these communities (Chapter 2).... The adaptive capacity of many Aboriginal communities is presently being eroded by social, cultural, political and economic changes taking place in response to a range of stresses (Chapter 3). Significant impacts on traditional ways of life are unavoidable (Chapters 3, 4, 5, 7 and 8)." (Don Lemmen, Canada National Study)
Reference included
701 75349 26 35 9 35 12 In many indigenous communities, what modern infrastructure exists was designed and sited by non-resident engineers who lacked any knowledge of historical climate hazards. In many cases this resulted in extreme vulnerability of critical infrastructure. This problem continues. (UNITED STATES OF AMERICA)
Good point, but we would need references from the peer-reviewed literature to include here, and in any case we are already extremely space-limited.
702 64224 26 35 9 35 36 A challenge for rural communities is a combined product of spatial spread (tansportation is mentioned) and capacity to provide critical response ( adaptatin) resources- both physical and human to respond to hazards such as wild and structural fire response, disruption of critical services such asr telecommunications (water & electrical supply is mentioned) etc. Tourism based communites are often seasonal resulting in a lack of continuity in human capactiy to provide crtical services. (Ian Church, Canadian Foundation for Climate and Atmospheric Science/ IPY Canada)
I believe each of these aspects is covered in this section, although the wording might be slightly different in order to be consistent with cited references.
703 71450 26 35 12 0 0 Suggest changing to " communication services compromises hazard AND EMERGENCY response capacity" (CANADA) The term 'hazard' encompasses emergency, and we have very tight space limitations
704 77306 26 35 26 0 0 Doesn't make sense: a few words presumably lost (William Ingram, Met Office) Text has been checked for grammatical and editorial errors
705 64433 26 35 26 35 27 This sentence does not make sense - I think there is at least one missing word ("fiscal constraints necessary to support"??) (Don Lemmen, Canada National Study)
Text has been modified
706 64434 26 35 29 35 39 This section might be more usefully framed as "Comparing human and social capital" and moved towards the end of the section as it is the type of information that is essential to inform effective adaptation. You may consider adding reference to Walker and Sydneysmith (2008) who contrast of human and social capital of urban and remote communities in coastal BC in addressing sea level rise. (Don Lemmen, Canada National Study)
This might be a misnomer as we do not offer a systematic comparative approach. Thank you for the suggested reference; we opted not to include due to space constraints.
707 80522 26 35 35 35 35 suggest adding: " … hasd stripped indigneous communities of [add: land and] many soruces of human and social capital." (Gentry Blake, Institution no 1: Gente de Iitoi A.C., non-profit in Mexico. Dir. of Health Services.)
added
708 80523 26 35 38 35 38 suggest changing " espouse" to 'possess' (Gentry Blake, Institution no 1: Gente de Iitoi A.C., non-profit in Mexico. Dir. of Health Services.)
Changed
709 75350 26 35 38 35 39 Might the word "espouse" be replaced by "possess"? Also, it should perhaps be noted that, at least in more northern communities, residents' experience is that their existing local and experiential knowledge is or can be less applicable to changing conditions. (UNITED STATES OF AMERICA)
Done
710 75351 26 35 42 36 28 26.8.3 : Two recent economics papers estimate the projected impacts of climate change on people's enjoyment of the weather in various US metropolitan areas by end of century. They are not perfect, but represent the best available economics thinking on the subject. Consider citing: http://www-personal.umich.edu/~kelloggr/NBERw18925.pdf and http://www.nber.org/papers/w18756.pdf (UNITED STATES OF AMERICA)
Thank you; we just don't have room to add anything more.
711 83781 26 35 44 35 44 Casual usage of "likely" should be avoided, as it is a reserved likelihood term. (Katharine Mach, IPCC WGII TSU) Addressed
712 64225 26 35 47 0 0 SLR which I assume is sea level rise- Is this in a glossary? Seems to me it would make it easier for the reader to spell it out. (Ian Church, Canadian Foundation for Climate and Atmospheric Science/ IPY Canada)
It is defined in the glossary using the term sea level change
713 75352 26 35 47 35 47 26.8.3 : Please ensure that SLR was defined as an acronym for sea level rise. (UNITED STATES OF AMERICA) Done
714 83782 26 35 47 35 47 The chapter team should consider if a level of confidence would be more appropriate than the likelihood term used here ("very likely"). (Katharine Mach, IPCC WGII TSU)
Addressed
715 64435 26 35 48 0 0 Millerd (2011) is not relevant to this sentence. (Don Lemmen, Canada National Study) Citation removed

IPCC WGII AR5 Chapter 26 SECOND-ORDER DRAFT
Government and Expert Review Page 59 of 68 28 March - 24 May 2013
# ID ChFrom Page
From Line
To Page
To Line Comment Response
716 83783 26 35 52 35 52 The chapter team should consider if a level of confidence would be more appropriate than the likelihood term used here ("very likely"). (Katharine Mach, IPCC WGII TSU)
Likelihood term removed. Confidence level not added; the statement is not the least bit debatable.
717 64436 26 36 1 36 2 Need to clarify that Scott and McBoyle only refers to the ski industry. In other seasons and locations warming may decrease outdoor activities. (Don Lemmen, Canada National Study)
some' has been added to qualify statement.
718 83784 26 36 6 36 6 The chapter team should consider if a level of confidence would be more appropriate than the likelihood term used here ("likely"). (Katharine Mach, IPCC WGII TSU)
All casual use of likelihood terms have been removed from section.
719 64437 26 36 8 36 9 Should refer to WGI report for changes in hurricane frequency (Don Lemmen, Canada National Study) Text deleted
720 83785 26 36 8 36 9 The findings of the working group 1 contribution should be carefully considered for this statement about hurricanes. The relevant scenarios of climate change for the projection should also be described. (Katharine Mach, IPCC WGII TSU)
Text deleted
721 83786 26 36 17 36 18 Do these estimated losses differ across time frames and levels of climate change? (Katharine Mach, IPCC WGII TSU) The time frames and models employed in the cited studies are mentioned.
722 64438 26 36 23 36 28 This short section identifies some key impacts, but under the heading of "essential services" one is anticipating a structured discussion of things like health services, emergency response, etc. (Don Lemmen, Canada National Study)
We changed it to essential infrastructures and services
723 80894 26 36 24 36 24 Constraints to adapt in Mexico and Mexico City include “lack of understanding of the strategies’ objectives, process and outcomes by governmental agencies and inhabitants, as well as a lack of participation and public awareness about climate change. These problems have resulted in poor coordination and collaboration among these participants to address climate change impacts. Indeed, various levels of government have refused to allocate resources to reducing sectoral and local vulnerability. Furthermore, illegality and corruption stand in the way of developing adaptation capacity.” (Sosa-Rodriguez, 2013). (Fabiola S. Sosa-Rodriguez, University of Waterloo)
This line refers to ecosystem services and not to adaptation constraints. Yet we will consider the suggestion under the adaptation heading
724 83787 26 36 26 36 28 The range for this projection should be specified, and the level of precision could be considered for the percentage given. (Katharine Mach, IPCC WGII TSU)
I included findings from another Mexico City study providing the level of precision requested.
725 62823 26 36 31 0 0 no mention of rolling easements along coastlines yet much discussed; (Dominique Bachelet, Conservation Biology Institute) We would need to make reference to published literature to include here; and we face significant space limitations.
726 83788 26 36 31 0 0 Section 26.8.4. In developing the final draft of this section, the chapter team should continue to tighten the section as much as possible and should ensure the focus is sharply on examples and context relevant to North America. (Katharine Mach, IPCC WGII TSU)
Most of our statements draw from literature focused on North America. Yet we tried to make this more explicit.
727 83789 26 36 35 0 0 Section 26.8.4.1.1. As a note for this section title, as well as the title of the subsequent subsection, the adaptation chapters have been favoring the terminology of "incremental" and "transformational" adaptation. (Katharine Mach, IPCC WGII TSU)
Addressed
728 64439 26 36 40 36 42 Please provide examples of such regions within North America. (Don Lemmen, Canada National Study) Most of our statements draw from literature focused on North America. Yet we tried to make this more explicit.
729 83790 26 36 49 0 0 Section 26.8.4.1.2. Is "authorities" the clearest word here? Would "governments" be clearer? (Katharine Mach, IPCC WGII TSU)
Changed
730 80893 26 36 50 37 21 Examples of actions undertaken by federal and city authorities in Mexico and Mexico City can be found in Sosa-Rodriguez (2013). (Fabiola S. Sosa-Rodriguez, University of Waterloo)
Included
731 64440 26 36 51 0 0 Delete "leadership". Adaptation planning is more visible locally because that is where all planning is most visible. However leadership can be in the form of resources, enabling policy etc that frequently comes from higher orders of government. (Don Lemmen, Canada National Study)
We mention this in p.37 lines 20-21
732 75353 26 36 51 37 21 26.8.4.1.2 : Please consider citing: ICLEI survey of what urban municipalities are doing to respond to climate change: http://web.mit.edu/jcarmin/www/urbanadapt/Urban%20Adaptation%20Report%20... (UNITED STATES OF AMERICA)
We cited it under Carmin et al., 2012b
733 62825 26 37 8 0 0 there is a recent European study of green roofs contradicts positive effects from a handful of studies in the US; (Dominique Bachelet, Conservation Biology Institute)
That's interesting, I will look for the study. We do not have space to evaluate the effectiveness of all strategies noted here however, particularly as the published literature making such evaluations have been scant.

IPCC WGII AR5 Chapter 26 SECOND-ORDER DRAFT
Government and Expert Review Page 60 of 68 28 March - 24 May 2013
# ID ChFrom Page
From Line
To Page
To Line Comment Response
734 62824 26 37 19 0 0 could mention the role of climate deniers in power in many states and now even in Canada - reduces opportunities for preparation, information communication let alone adaptation measures and long term vision; (Dominique Bachelet, Conservation Biology Institute)
This is a good point for potential inclusion in adaptatin section, but we didn't find literature to assess.
735 64226 26 37 21 0 0 A term that has been recently used more often than "state" and that is more encompassing is "sub-national"- ie can include states, provinces, territories, regional jurisdictions and local jurisdictions such as cities and municipalities. (Ian Church, Canadian Foundation for Climate and Atmospheric Science/ IPY Canada)
Addressed
736 64441 26 37 46 37 47 What are "adaptation services"? Sentence remains correct, and is more understandable, if you simply state "… combined with higher costs of supplying services". (Don Lemmen, Canada National Study)
Changed
737 64227 26 37 47 37 49 A challenge for more "developed " lands such as in cities is that to upgrade infrastructure so as to be better adapted is often much more complex because of the restriction of other infrastructure and systems- ie upgrading one system often means large changes to many. (Ian Church, Canadian Foundation for Climate and Atmospheric Science/ IPY Canada)
Another excellent point, but again, this is a synthesis of the literature, and we have not located this issue in the literaturewe have reviewed.
738 69801 26 38 1 38 8 The benefits of participation go beyond getting information and create legitimacy. Participatory processes foster the development of the adaptive capacity of stakeholders involved and strengthen the outcomes of adaptational planning because they solicit a multiplicity of viewpoints. The paragraph constrains the benefits of participatory processes too narrowly. (NETHERLANDS)
Addressed
739 83791 26 38 21 0 0 Section 26.8.4.3. Is all material in this section focused on North America? It would be preferable to specify what applies more broadly as compared to in North America alone. (Katharine Mach, IPCC WGII TSU)
Yes it is. Yet we tried to make this more explicit.
740 64442 26 38 27 38 28 Need better references for the maladaptive impacts of sea walls than Richardson (2010). There is an abundance of solid biophysical research documenting this (see references in chapters 5 and 14. Richardson (2010) is a series of case studies for planners. (Don Lemmen, Canada National Study)
We found reference to this in chapter 14 and refer to it in the section
741 75354 26 38 27 38 28 Seawalls and other forms of coastal protection may protect the area directly behind them, but often do so in a manner that disrupts normal coastal processes. They generally displace damage, rather than preventing it, in addition to the ecosystem damage they do. A possible citation would be: Owen Mason, William J. Neal, and Orrin H. Pilkey, with chapters by Jane Bullock, Ted Fathauer, Deborah Pilkey and Douglas Swanston. Living with the Coast of Alaska. 1997. Duke University Press. Durham and London. Chapter 6 might be most pertinent. (UNITED STATES OF AMERICA)
We couldn't include this reference because our chapter does not include polar regions.
742 69802 26 38 31 38 32 (Doves, 2009) reference is not located in the reference list at the end of the chapter: "…in some cases (Eakin et al., 2010; Romero-Lankao, 2012)(Doves 2009)" (NETHERLANDS)
Removed
743 64443 26 38 37 0 0 Badjeck is spelled with a "ck" - make correction here and in references. (Don Lemmen, Canada National Study) Changed
744 70763 26 38 43 36 44 For mapping of vulnerability e.g. cite also Kienberger et al 2012, who reviewed 20 vulnerability assessments in regard to its spatial, temporal and themtic characteristics Kienberger, S., Blaschke, T., Zaidi. R.Z., (2012). A framework for spatio-temporal scales and concepts from different disciplines: the 'vulnerability cube’. Natural Hazards (online). http://dx.doi.org/ 10.1007/s11069-012-0513-x (Stefan Kienberger, University of Salzburg)
Citation added
745 80524 26 38 46 38 46 Facts about indigenous moblity as a stratey in the United States are cited in the attached supporting document: Indigenous Health Impacts from Climate Change expert reviewer Blake Gentry. See page12 (see text below). I suggest adding "eduction [add: and harnessing the rural-urban mobility of indigneous to secure technical resources for building adaptaive capacity in rural indigenous communities' … and economic development. (Gentry Blake, Institution no 1: Gente de Iitoi A.C., non-profit in Mexico. Dir. of Health Services.)
We now include discussion of migration, in which this suggestion is incorporated.
746 80525 26 38 46 38 46 Providing small centers staffed with bi-lingual indigenous liaisons can vastly improve implementation of projects after local participatory planning has taken place. This strategy takes into account that, for example in the United States 27% of Native Americans move between rural and urban areas for the highest within-state migration rates in the United States of any ethnicity (Gentry Blake, Institution no 1: Gente de Iitoi A.C., non-profit in Mexico. Dir. of Health Services.)
See comment above regarding migration; we did not include discussion of ' small centers staffed with bi-lingual indigenous liaisons' due to space constraints.
747 83792 26 39 12 39 12 This statistic could be clarified. What does "these efforts" refer to, and the total budget expenditures are for what? (Katharine Mach, IPCC WGII TSU)
Sentence was redrafted
748 64444 26 39 18 39 20 In most cases I am aware of it is not of the focus shifting from mitigation to adaptation, but rather of expanding from exclusively on mitigation to consideration of both mitigation and adaptation. (Don Lemmen, Canada National Study)
This is exactly what we say

IPCC WGII AR5 Chapter 26 SECOND-ORDER DRAFT
Government and Expert Review Page 61 of 68 28 March - 24 May 2013
# ID ChFrom Page
From Line
To Page
To Line Comment Response
749 64445 26 39 22 39 24 If you want to complete the tripartite storyline you could mention that David Cadman, Vancouver Councilor, is the president of the ICLEI (Local Governments for Sustainability) Global Executive Committee. (Don Lemmen, Canada National Study)
Done reference to him included
750 69803 26 39 34 39 37 Not sure that the lack of jurisdictional control of New York City over surrounding states is an example of "fragmentation"-- this seems to imply that cities ought to be the locus of decision-making over non-urban areas. A similar statement implying that the USA ought to have jurisdictional control over Mexico and Canada would not make sense or be well-received. (NETHERLANDS)
Text has been modifiedto read: "(Burch, 2010). Multi-jurisdictional governance structures in the broader Mexico City and New York regions (i.e., Federal District, Mexico and Hidalgo for Mexico City and Connecticut, New Jersey and New York for New York) challenge the ability to develop coordinated responses to climate change."
751 64228 26 39 42 39 43 A challenge int eh Vacouver region ( Lower Mainland) is that even if the city of Vancouver takes action can it bring with it linked action with the regional districts and municpalities outside the city or does it push pressures such as more affordable accomodation resulting in more commuting into these other jurisdictions (Ian Church, Canadian Foundation for Climate and Atmospheric Science/ IPY Canada)
Good point, but we couldn't add it because of insufficient space
752 64446 26 40 16 40 16 "State level" does not speak to Canadians. (Don Lemmen, Canada National Study) Text has been modified
753 75355 26 40 25 41 9 26.9.1 : The report mentions Canada and Mexico programs by name. Why not be specific about the US programs, such as Executive Order 13154 and Interagency Climate Action Task Force. Consider citing the following. Glicksman, R. L. (2012). Chapter 12: Governance of Public Lands, Public Agencies, and Natural Resources. The Law of Adaptation to Climate Change: U.S. and International Aspects. M. B. Gerrard and K. F. Kuh, American Bar Association: 441-480. There have also been challenges to federal agencies conducting/implementing adaptation action: Jantarasami, L. C., J. J. Lawler, and C. W. Thomas. 2010. Institutional barriers to climate change adaptation in U.S. national parks and forests . Ecology and Society 15(4): 33. [online] URL: http://www.ecologyandsociety.org/vol15/iss4/art33/ . (UNITED STATES OF AMERICA)
Unfortunately, we have insufficient space to discuss all the federal programs. We mention some programs.
754 64447 26 40 42 40 51 Change first phrase from "Canada is working towards creating a National …."to "Canada has a National …" - the framework has been in place for more than a year. Please replace outdated text regarding past programming "lines 44-47" with description of current initiatives available at http://www.nrcan.gc.ca/earth-sciences/climate-change/community-adaptation/platform/11958. on line 44, singling out a specific government department (Environment Canada) is inappropriate. (Don Lemmen, Canada National Study)
Change made.
755 71451 26 40 47 40 51 These are two of several climate change adaptation programs that were financially supported by the Government of Canada in 2011. Suggest clarifying the language here and adding in other programs as appropriate. See: http://ec.gc.ca/default.asp?lang=En&n=2D1D6FA7-1&news=B67A7995-A1CA-4DE3-89D2-E4E3C0E24BFB (CANADA)
Have revised the text
756 75356 26 41 5 41 9 A notable omission from this paragraph is the USDA Forest Service National Roadmap for Responding to Climate Change (2010; already in the lit cited), begun in 2008 and implemented in 2010, which actually includes performance elements related to vulnerability assessment and adaptation planning and implementation that all National Forests are required to meet in response to climate change. (UNITED STATES OF AMERICA)
We do not have sufficient space to discuss all the federal programs addressing adaptation.
757 75357 26 41 5 41 9 Another example of of specific adaptation efforts in the United States is the 2013 release of the inter-agency National Fish, Wildlife and Plant Adaptation Strategy (National Fish, Wildlife and Plants Climate Adaptation Partnership. 2012. National Fish, Wildlife and Plants Climate Adaptation Strategy. Association of Fish and Wildlife Agencies, Council on Environmental Quality, Great Lakes Indian Fish and Wildlife Commission, National Oceanic and Atmospheric Administration, and U.S. Fish and Wildlife Service. Washington, DC, USA) (UNITED STATES OF AMERICA)
We do not have sufficient space to discuss all the federal programs addressing adaptation.

IPCC WGII AR5 Chapter 26 SECOND-ORDER DRAFT
Government and Expert Review Page 62 of 68 28 March - 24 May 2013
# ID ChFrom Page
From Line
To Page
To Line Comment Response
758 64448 26 41 14 41 20 I am pleased that this text for Canadian provinces leads with "For example". However the level of detail the authors have chosen to provide gives a misleading impression about the level of effort. Ontario, like many jurisdictions, has an ambitious strategy but has not yet indicated how it will be implemented. Quebec, on the other hand, has a strategy that extends to 2020 and the commitment of $200M to foster adaptation (http://www.budget.finances.gouv.qc.ca/Budget/2012-2013/en/documents/climate.pdf). British Columbia's initiatives are much broader than water (check out http://www.env.gov.bc.ca/cas/adaptation/) and include innovative sea dyke guidelines to address sea level rise. I reiterate my concern on previous drafts that this type of policy and program information does not fit well within a scientific assessment. (Don Lemmen, Canada National Study)
Thi is a very helpful comment and the text will be revised to mention the provinces of Quebec and BC; and drop Ontario
759 64806 26 41 20 0 0 Bc has recently released a climate change action plan for forest management: https://www.for.gov.bc.ca/het/climate/actionplan/index.htm There are also plans developed and being developing for US National Forests. (Dave Spitttlehouse, BC Ministry Forests, Lands and Natural Resource Operations)
Thank you. Unfortunately, we do not have space to mention it.
760 75358 26 41 22 41 31 Check the correct year for Bierbaum et al. 2012 in text and References section. Should it be 2013? Also, it is suggested that the authors consider including the following information in this paragraph: "As of the end of 2012, at least 14 states have completed or started a state-wide adaptation plan and 8 more have recommended that an adaptation plan be developed (Bierbaum et al. 2013)". Also check these URLs for citations: http://www.georgetownclimate.org/adaptation/state-and-local-plans http://www.c2es.org/us-states-regions/policy-maps/adaptation http://www.climateaccess.org/sites/default/files/Bierbaum%20et%20al_A%20comprehensive%20review%20of%20climate%20adaptation.pdf (UNITED STATES OF AMERICA)
The paper was published in 2012. Note this refers to the journal article, not the yet to be published chapter in the US National Assessment.
761 64229 26 41 41 0 0 While you talk about governments at various levels it seems to me that the work of NGO's and academic instittuions are also important. I can think of organizations such as the Canadian Foundation for Climate and Atmospheric Sceince (CFCAS) now renamed as the Canadian Climate Forum (http://www.climateforum.ca), The Climate Registry which operates in all 3 countries at the sub national and other levels (www.theclimateregistry.org/),Ouranos ( CONSORTIUM ON REGIONAL CLIMATOLOGY AND ADAPTATION TO CLIMATE CHANGE) in Quebec http://www.ouranos.ca/en/ and the Pacific Climate Impacts Consortium (http://pcic.uvic.ca)and the Pacifc Institue for Climate Solutions (http://pics.uvic.ca) in British Columbia and the Northern Climate Exchange (http://www.yukoncollege.yk.ca/research/programs/northern_climate_exchange) in the Yukon as examples. I would also suggest aborigianl organizationsand governmetns that deserve specific attention such as the Arctic Athabascan Council, Council of Yukon First Nations, Inuit Circumpolar Council etc. (Ian Church, Canadian Foundation for Climate and Atmospheric Science/ IPY Canada)
Unfortunately, there is insufficient space to address the fine work of NGOs
762 64230 26 41 45 42 4 In Canada provinces are separte "Crowns" with responsibiilties assigned through the Constittuion and the federal government cannot assign them responsibilities. While not an citizen of the USA I know the states have similar independence though especially in the western states there is more federalland that falls under federal jurisdiction. (Ian Church, Canadian Foundation for Climate and Atmospheric Science/ IPY Canada)
It is not clear what specific concern the reviewer has with the text.
763 75359 26 42 3 42 4 This statement does not accurately describe all sectors; notably forest sector adaptation planning focuses primarily on supporting adaptive capacity at this point in time. See Millar et al. 2013. Suggested correction is to note that different sectors are focusing on different adaptation responses, and perhaps provide examples to illustrate the variety. Millar, C.I., K.E. Skog, D.C. McKinley, R.A. Birdsey, C.W. Swanston, S.J. Hines, C.W. Woodall, E.D. Reinhardt, D.L. Peterson, and J.M. Vose. 2012. Adaptation and mitigation, p. 125-192, In J. M. Vose, et al., eds. Effects of climatic variability and change on forest ecosystems: a comprehensive science synthesis for the U.S. forest sector, Gen. Tech. Rep. PNW-GTR-870. U.S. Department of Agriculture, Forest Service, Pacific Northwest Research Station, Portland, OR. (UNITED STATES OF AMERICA)
The USFS plan is impressive, but does not address transformational adaptation as described by Eakin and Patt.
764 75360 26 42 11 42 29 The legend for Figure 26-6 is incomplete. The colored bars are not explained and it is unclear why some wedges are blank, so it is impossible to fully interpret the figures and the associated text on page 42. (UNITED STATES OF AMERICA)
The Figure was replaced by Table 26-1

IPCC WGII AR5 Chapter 26 SECOND-ORDER DRAFT
Government and Expert Review Page 63 of 68 28 March - 24 May 2013
# ID ChFrom Page
From Line
To Page
To Line Comment Response
765 64449 26 42 11 42 50 Figure 26-6 and associated analysis is potentially very useful, but by reading this page you get the distinct impression that the writing team is not at all comfortable with including it! The text addresses abounds with notes of caution and highlights the limitations of the figure, but makes no effort to communicate what the figure says! Yet there are important messages here about the ability of adaptation and mitigation to work together to reduce levels of future risk. (Don Lemmen, Canada National Study)
Comment is right. We redrafted the section to better describe what the Table 26-1 conveys
766 83793 26 42 15 42 15 "projections" may be a preferable word here as compared to "predictions." (Katharine Mach, IPCC WGII TSU) Changed
767 83794 26 42 18 42 18 Casual usage of "likely" should be avoided, as it is a reserved likelihood term. (Katharine Mach, IPCC WGII TSU) Changed
768 64450 26 42 23 42 29 Caption needs to explain the significance (if any) of the colours purple, orange and red. It also needs to explain why some "slices" are left blank and (most curiously) why Livelihoods and Poverty and Urban Areas have been assessed for a 2C scenario but not for a 4C scenario. (Don Lemmen, Canada National Study)
The Figure was replaced by Table 26-1
769 83795 26 42 44 42 44 Casual usage of "very likely" should be avoided, as it is a reserved likelihood term. (Katharine Mach, IPCC WGII TSU) changed
770 64451 26 42 47 42 50 Delete bracketed italicized text (era of climate responsibility and era of climate options) as per comments provided on whole of WGII report through Government Review process. (Don Lemmen, Canada National Study)
Done
771 64232 26 42 48 42 50 Are these terms defined somewhere and are they utilixzed in other chapters? I didn't note them in Chapter 28 the era of climate responsibility or climate options (Ian Church, Canadian Foundation for Climate and Atmospheric Science/ IPY Canada)
Section deleted
772 64452 26 43 4 0 0 Replace "state" with "subnational" (Don Lemmen, Canada National Study) Done
773 64233 26 43 17 43 30 Significant issue for locations that are for the most part not self suficeint and that depend on transportation, communications and utility corridors or networks to meet crtical human sustainability needs or supplies that may be critcal to maintaining systems that can protect life, protect the environment etc. Often there is little or no redundancy in these lines and if the centre of supply suffers a short or long term shock or anywhere along the line is shocked these "outposts that are increasingly hosting relatively large populationscan be put at risk. The Arctic or isolated camps such as mines are an examples. (Ian Church, Canadian Foundation for Climate and Atmospheric Science/ IPY Canada)
Agree but we don't deal with the Artic here
774 75361 26 43 33 44 34 The "FAQ" formulation seems a bit contrived. There is no clear indication that these four questions are among the most frequently asked or by whom. The section could be renamed "Key Questions". (UNITED STATES OF AMERICA)
We redrafted the FAQs
775 62826 26 43 35 0 0 what makes North America different is that it has the technology, the know-how, but total inretia in preparing for climate change; climate deniers have been very effective at preventing progress; compared to other continents North America should be able to adapt the best because of its wealth and technological advantage yet when extreme events occur (ex. Katrina / New orleans) scenes that remind one of developing countries - mortality, army intervention, looting - are the norm due to the inertia of the authorities and the lack of preparation. Missed opportunities for leadership. (Dominique Bachelet, Conservation Biology Institute)
We redrafted the FAQs
776 64453 26 43 35 43 42 Rephrase question or delete entirely. "especially unique" is an unfortunate phrase - something is unique or it isn't. While all regions are unique, it is not clear that the range of variability observed in the parameters listed here is any great in North America than it would be, for example, in Asia, (Don Lemmen, Canada National Study)
We redrafted the FAQs
777 80959 26 43 35 43 42 FAQ 26.1 All regions will be unique in terms of diversity, perhaps a better question would be about unique types of impacts and risks in the region (Monalisa Chatterjee, IPCC WGII TSU)
We redrafted the FAQs
778 80960 26 43 44 0 0 FAQ 26.2 Some specific information may be useful take away points for readers. (Monalisa Chatterjee, IPCC WGII TSU) We redrafted the FAQs
779 64454 26 43 44 43 51 In addition to discussing spatial differences in precipitation patterns I would also expect discussion of seasonal changes. (Don Lemmen, Canada National Study)
We redrafted the FAQs

IPCC WGII AR5 Chapter 26 SECOND-ORDER DRAFT
Government and Expert Review Page 64 of 68 28 March - 24 May 2013
# ID ChFrom Page
From Line
To Page
To Line Comment Response
780 80434 26 43 44 43 51 FAQ 26.2: We have serious concern with the focus of this FAQ as the assessment needed to answer such a question is primarily within WG and the evidence future precipitation changes in the regions is covered in the WGI contribution to AR5. With the current focus of this FAQ, there is a serious risk here of cross-working group inconsistency and overlap that is best avoided. We thus suggest this FAQ to focus on the consequences of this for exposure, vulnerability, impacts, etc. (Gian-Kasper Plattner, IPCC WGI TSU)
We redrafted the FAQs
781 62827 26 44 1 0 0 factors leading to vulnerability: abruptness of change, tipping points and unknown thresholds; inertia despite scientific knowledge; (Dominique Bachelet, Conservation Biology Institute)
We redrafted the FAQs
782 64455 26 44 1 44 16 What was the analysis undertaken to determine the relative vulnerability of sectors / regions. While I am comfortable stating that those listed are vulnerable, I am not comfortable with saying that they are more vulnerable than other not listed. An example of a vulnerable region that is not listed is alpine ecosystems, despite the fact that they will almost certainly be extirpated in some areas. (Don Lemmen, Canada National Study)
We redrafted the FAQs
783 64234 26 44 2 44 5 At this point I note that no where in the text is there mention of the constaints on water avaialbility in some of the inter mountain regions of the western Cordilleran in all 3 countries. Examples the Okanagan Valley- the Okanogan watershed is heavily regualted; The Grand Coulee region of the Columbia Basin - the purpose of the project was to irrigate the desert. You do mention the Colorado though I don't recall mention of some of the agricultural basins in California. MOst mention is of the Great Pains and parts of Mexico (Ian Church, Canadian Foundation for Climate and Atmospheric Science/ IPY Canada)
We redrafted the FAQs
784 83796 26 44 3 44 3 Casual usage of "likely" should be avoided, as it is a reserved likelihood term. (Katharine Mach, IPCC WGII TSU) We redrafted the FAQs
785 83797 26 44 4 44 4 Casual usage of "likely" should be avoided, as it is a reserved likelihood term. (Katharine Mach, IPCC WGII TSU) We redrafted the FAQs
786 83798 26 44 7 44 7 Casual usage of "likely" should be avoided, as it is a reserved likelihood term. (Katharine Mach, IPCC WGII TSU) We redrafted the FAQs
787 69804 26 44 10 44 10 The sentence "Mention something about the wet tropical south" seems like a note an author made to him/herself and forgot to remove. (NETHERLANDS)
We redrafted the FAQs
788 80961 26 44 11 0 0 FAQ 26.3 Some specific information on location or intensity of wildfire, pest outbreaks will be useful. (Monalisa Chatterjee, IPCC WGII TSU)
We redrafted the FAQs
789 71452 26 44 18 0 0 This FAQ is quite general and does not make reference to "North America". Does it belong in this chapter? Suggest specifying that the FAQ refers to lessons learned from adaptation actions specific to North America or moving this FAQ elsewhere in the report. (CANADA)
We redrafted the FAQs
790 80962 26 44 18 20 22 FAQ 26.4 These sentences are a repeat from ES finding. Authors may wish use the term constraints in framing this question. (Monalisa Chatterjee, IPCC WGII TSU)
We redrafted the FAQs
791 79117 26 49 21 49 21 Conafor is a federal institution of Mexico, please change to CONAFOR (Alejandro Monterroso, Universidad Autonoma Chapingo)
We renamed it Comision Nacional Forestal
792 75362 26 50 9 0 0 Wilbanks, Tom; Fernandez, Steve; Backus, George; Garcia, Pablo; Jonietz, Karl; Kirshen, Paul; Savonis, Mike; Solecki, Biill; Toole, Loren; Allen, Melissa; Bierbaum, Rosina; Brown, Teresa; Brune, Nancy; Buizer, Jim; Fu, Joshua; Omitaomu, Olufemi; Scarlett, Lynn; Susman, Megan; Vugrin, Eric; and Zimmerman, Rae"Climate Change and Infrastructure, Urban Systems, and Vulnerabilities: Technical Report For The U.S. Department of Energy in Support of the National Climate Assessment." Oak Ridge National Laboratory, Oak Ridge, Tennessee.2012. Available online at http://www.esd.ornl.gov/eess/EnergySupplyUse.pdf (UNITED STATES OF AMERICA)
I don't understand the comment
793 79118 26 50 51 50 52 This citation is wrong. The correct citation is in page 53 line 50 (Alejandro Monterroso, Universidad Autonoma Chapingo) The references have been improved
794 79119 26 52 19 52 21 Please change names and year as: Sanchez-Torres E.G., Ospina-Noreña, J.E., Gay-García C., and Conde C. 2011. (Alejandro Monterroso, Universidad Autonoma Chapingo)
The references have been improved
795 75363 26 53 43 0 0 Bales, J., D. Raff, C. McNutt, M. Brewer, T. Johnson, and T. Brown, 2012: Water Resources Sector Technical Input Report in Support of the U.S. Global Change Research Program, National Climate Assessment, 2013. N.B. this report is expected to appear as a USGS technical report in ~July 2013. (UNITED STATES OF AMERICA)
The references have been improved

IPCC WGII AR5 Chapter 26 SECOND-ORDER DRAFT
Government and Expert Review Page 65 of 68 28 March - 24 May 2013
# ID ChFrom Page
From Line
To Page
To Line Comment Response
796 79120 26 53 50 53 52 Please change the citation to: Gómez-Díaz J.D., Monterroso-Rivas, A.I., Tinoco-Rueda, J.A., Toledo-Medrano M.L., Conde-Álvarez, C., and Gay-García C. 2011. Assessing current and potential patterns of 16 forest species driven by climate change scenarios in México. Atmósfera 24(1), 31-52 (Alejandro Monterroso, Universidad Autonoma Chapingo)
The references have been improved
797 75364 26 54 19 0 0 Staudinger, M.D., N. B. Grimm, S. A, S. L. Carter, F. S.Chapin III, P.Kareiva, M. 4 Ruckelshaus, and B.A. Stein, 2012: Impacts of Climate Change on Biodiversity, 5 Ecosystems, and Ecosystem Services: Technical Input to the 2013 National Climate 6 Assessment. Cooperative Report to the 2013 National Climate Assessment., 296 pp. 7 [Available online at http://downloads.usgcrp.gov/NCA/Activities/Biodiversity-Ecosystems-and-Ecosystem-Services-Technical-Input.pdf (UNITED STATES OF AMERICA)
The references have been improved
798 79121 26 63 6 63 7 Please consider the following citation: Monterroso-Rivas A.I., Conde-Álvarez C., Rosales-Dorantes G., Gómez-Díaz J.D., and Gay-García C. 2011a. Assessing current and potential rainfed maize suitability under climate change scenarios in México. Atmósfera 24(1), 53-67 (Alejandro Monterroso, Universidad Autonoma Chapingo)
The references have been improved
799 79122 26 63 8 63 9 The text in page 22 line 14 refers to this citation, kindly change it: Monterroso-Rivas A. I., Gómez-Díaz J.D., Toledo-Medrano M.L., Tinoco-Rueda J.A., Conde-Álvarez C., and Gay-García C. 2011b. Simulated dynamics of net primary productivity (NPP) for outdoor livestock feeding coefficients driven by climate change scenarios in México. Atmósfera 24(1), 69-88 (Alejandro Monterroso, Universidad Autonoma Chapingo)
The references have been improved
800 75365 26 64 3 0 0 This citation is for the full draft report of the NCADAC as a "suggestion to review these other reports". We suggest removing NCADAC 2013. (UNITED STATES OF AMERICA)
The references have been improved
801 64807 26 75 17 0 24 Duplicate of Williamson et al 2009a reference. Do not need the "a" after 2009 here and in text, e.g., page 16 line 48. (Dave Spitttlehouse, BC Ministry Forests, Lands and Natural Resource Operations)
The references have been improved
802 64205 26 77 0 0 0 Table 26-1 Initially I found this tableconfusing since I assumed there must be a realtionship across rows- which it appears there is not. The introductory text to this table suggests it highlights key sources vulnerability for urban and rural systems. Page 33 Line 26-27 . There seems to be no differentialtion between urban and rural systems indicated in the table. Did someone copy the wrong table? (Ian Church, Canadian Foundation for Climate and Atmospheric Science/ IPY Canada)
Table removed
803 83799 26 77 0 0 0 Table 26-1. It would be helpful for the reader if the intended interpretation of this table were clarified. Presumably the lines of the table are not meant to be read from left to right? Instead, does each column present a series of relevant examples? (Katharine Mach, IPCC WGII TSU)
Table removed
804 75366 26 77 0 77 0 Table 26-1 Comments - Layout of table is confusing: encourages reading across rows, which is not the intent. Is there a better (clearer) term than "Hinterland" (urban/rural is the intended distinction). Columns seem to be incomplete in some cases (e.g., agriculture are not included yet there are a whole sections later in the chapter). As much insurance activity takes place at the corporate/industrial level, it would be better to move that from the "Individual" column to the "System/Sector" columns (or include in both). Better to improve table than to retain limitations of the primary source (and say adapted from Romero-Lanka). (UNITED STATES OF AMERICA)
Table removed
805 75367 26 77 0 77 0 Table 26-1 CommentsThe design of this table, with the horizontal lines encasing each box, could be taken to suggest that the hazard of sea level rise has effects only on health, with those impacts relating to disease, and that the determinants of adaptive capacity/resilience against sea level rise are land-use planning and age of the individual. This is obviously not what is intended. Perhaps a redesign of the graphic, emphasizing the vertical columns rather than the horizontal lines, would be helpful here. (UNITED STATES OF AMERICA)
Table removed
806 64206 26 78 0 0 0 Figure 26-1 I assume the population is toatal within each pixel- what is the the area represented by a pixel- ie population per x square kilometers? Figure 26-2 Is the rate of change just a realtive number or is it the projected increase per year/ decade or? (Ian Church, Canadian Foundation for Climate and Atmospheric Science/ IPY Canada)
The wrong figure was in the SOD. This figure should have been the North American version of the cross-chapter figures, which included observations. The North American version of the cross-chapter figures is now included.
807 83800 26 78 0 0 0 Figure 26-2. It would be preferable to avoid "present-day" in describing both parts of this figure, since 1980-1999 isn't quite present-day. (Katharine Mach, IPCC WGII TSU)
The wrong figure was in the SOD. This figure should have been the North American version of the cross-chapter figures, which included observations. The North American version of the cross-chapter figures is now included.

IPCC WGII AR5 Chapter 26 SECOND-ORDER DRAFT
Government and Expert Review Page 66 of 68 28 March - 24 May 2013
# ID ChFrom Page
From Line
To Page
To Line Comment Response
808 75368 26 78 0 78 0 Figure 26-1 Comments - If possible, consistent with printing constraints, it would be preferable if maps could show the entire North American continent. (UNITED STATES OF AMERICA)
The wrong figure was in the SOD. This figure should have been the North American version of the cross-chapter figures, which included observations. The North American version of the cross-chapter figures is now included.
809 80956 26 78 0 78 0 Figure 26-1 The legend is very very difficult to read. Perhaps some hotspots could be emphasized. In comparisn to the space it is taking, the figure at present is giving very little information to readers. (Monalisa Chatterjee, IPCC WGII TSU)
The wrong figure was in the SOD. This figure should have been the North American version of the cross-chapter figures, which included observations. The North American version of the cross-chapter figures is now included.
810 80957 26 78 0 78 0 Figure 26-2 Color differences are difficult to see especially in case of categories 3-4 and 4-5. (Monalisa Chatterjee, IPCC WGII TSU)
The wrong figure was in the SOD. This figure should have been the North American version of the cross-chapter figures, which included observations. The North American version of the cross-chapter figures is now included.
811 81452 26 79 0 0 0 Figure 26-3: The boldness of the black dots (circles) make it harder to see the background information on the map. (Yuka Estrada, IPCC WGII TSU)
The wrong figure was in the SOD. This figure should have been the North American version of the cross-chapter figures, which included observations. The North American version of the cross-chapter figures is now included.
812 83801 26 79 0 0 0 Figure 26-3. Should maps of observed changes for North America be presented as well? The caption, approach to stippling, and other features of this figure of course should be updated to match the final versions. (Katharine Mach, IPCC WGII TSU)
The wrong figure was in the SOD. This figure should have been the North American version of the cross-chapter figures, which included observations. The North American version of the cross-chapter figures is now included.
813 84863 26 79 0 0 0 Figure 26-3: Please consider ways to refine the clarity of this figure and caption, particularly the descriptions of categories of results displayed. The TSU can assist with this process if desired. (Michael Mastrandrea, IPCC WGII TSU)
The wrong figure was in the SOD. This figure should have been the North American version of the cross-chapter figures, which included observations. The North American version of the cross-chapter figures is now included.
814 75369 26 79 0 79 0 Figure 26-3 Comments - It will be confusing if the stippling method to represent confidence in projections of future change is different for AR5WG2 than for AR5WG1. This issue is discussed at length in AR5 WG1 chapter 12. Suggest that all projection figures in this report use color scales and stippling/hatching methods consistent with WG1 to lessen confusion. The choice to use what is used in the WG1 chapters or the WG1 Annex is up to the WG2 authors. However, one advantage of using the choice of the chapters is that regions where the changes are small compared to 20 year variability are explicitly noted. (UNITED STATES OF AMERICA)
The wrong figure was in the SOD. This figure should have been the North American version of the cross-chapter figures, which included observations. The North American version of the cross-chapter figures is now included.
815 75370 26 79 0 79 0 Figure 26-3 Comments - It is common practice in the literature for markings to indicate areas of greater confidence than unmarked areas. In this figure, circles indicate less confidence than unmarked colored regions. This could be a source of confusion for readers. (UNITED STATES OF AMERICA)
The wrong figure was in the SOD. This figure should have been the North American version of the cross-chapter figures, which included observations. The North American version of the cross-chapter figures is now included.
816 57941 26 80 0 0 0 Figure 26-4 can be improved in following ways: (1) Use transparency while drawing the overlapping time series. (2) May be applying 5-years moving average to the anomaly will be helpful. (3) You may want to show only historical and not the natural, because differences between historical and natural runs will be extensively covered in WGI reports. (Sanjiv Kumar, Center for Ocean-Land-Atmosphere Studies)
The wrong figure was in the SOD. This figure should have been the North American version of the cross-chapter figures, which included observations. The North American version of the cross-chapter figures is now included.
817 83802 26 80 0 0 0 Figure 26-4. It would be preferable to adjust the Y axes of these plots so that the plumes are fully contained within the plots. Also, within the caption, presumably the range of years should be 1986-2005? (Katharine Mach, IPCC WGII TSU)
The wrong figure was in the SOD. This figure should have been the North American version of the cross-chapter figures, which included observations. The North American version of the cross-chapter figures is now included.

IPCC WGII AR5 Chapter 26 SECOND-ORDER DRAFT
Government and Expert Review Page 67 of 68 28 March - 24 May 2013
# ID ChFrom Page
From Line
To Page
To Line Comment Response
818 75371 26 80 0 80 0 Figure 26-4 Comments - Data go off scale. Also, If possible, add “contiguous” to label for United States. (UNITED STATES OF AMERICA)
The wrong figure was in the SOD. This figure should have been the North American version of the cross-chapter figures, which included observations. The North American version of the cross-chapter figures is now included.
819 75372 26 80 0 80 0 Figure 26-4 Comments - The use of the term "natural" with respect to the blue shading is terribly qualitative. Presumably this is the envelope of projections without human impacts (GHG emissions, land use, etc.) included. If so, best to say this directly. Secondly, it is surprising to see no distinction between red and blue for the historical record. Does not the literature tell us that we have significant changes in precipitation? Perhaps the distinction is between total and that falling in torrential events. If so, the chart may be redrawn to reflect the extreme events (which are more material to the discussion of adaptation than averages or totals). (UNITED STATES OF AMERICA)
The wrong figure was in the SOD. This figure should have been the North American version of the cross-chapter figures, which included observations. The North American version of the cross-chapter figures is now included.
820 61664 26 80 1 0 0 Some of the data exceeds the range of the axes in these figures. They should be replotted to avoid this problem. (European Union DG Research, Directorate Environment Climate Change & Environmental Risks Unit)
The wrong figure was in the SOD. This figure should have been the North American version of the cross-chapter figures, which included observations. The North American version of the cross-chapter figures is now included.
821 85237 26 80 1 80 30 The record is running off below all of the projections and you are programmed to ignore it (Vincent Gray, Climate Consultant)
The wrong figure was in the SOD. This figure should have been the North American version of the cross-chapter figures, which included observations. The North American version of the cross-chapter figures is now included.
822 57942 26 81 0 0 0 Figure 26-6: I am not sure if I understand this figure. One example is: you use gray color bar as the risk key, then what does blue, orange, and red color represent? One suggestion could be: use different colors to represent different level of risk, and do not use gray color scale. (Sanjiv Kumar, Center for Ocean-Land-Atmosphere Studies)
Figure has been redrawn
823 64231 26 81 0 0 0 Figure 26-6 Is there an error in the +2 degree plot for biodiversity?. I can't see why the risk should drop between the first plot and this one. Similar comments for the Coastal Reegion and the Infrastructure/ Key Economic Sectors (Ian Church, Canadian Foundation for Climate and Atmospheric Science/ IPY Canada)
Figure has been redrawn
824 67939 26 81 0 0 0 Figure 26-6 It is also important for policymakers to understand risks estimated for the mid-term, or the period in between the era of climate responsibility (2030-2040) and era of climate options (2080-2100); and therefore, a figure should be included for global average warming of 3 degrees Celsius above preindustrial. Furthermore, given the diversity of regional risks and effective adaptation, the risk levels provided relate to different phenomena and adaptation choices are difficult to compare; and therefore, the figure should be revised to provide examples of the projected risks and adaptation choices considered in producing the figure and to include comparable numerical values. (JAPAN)
Figure has been redrawn
825 69805 26 81 0 0 0 It is unclear initially why there are different colors in each of the radial graphs. We assume that the size of the colored blocks (purple, yellow and orange) within each wedge of the graphs indicates the range of estimates, or uncertainty within each sector. This should be stated in the caption so that the reader doesn't need to stare at it for a while to figure it out on their own. (Then the caption of the graph should be modified in the SPM and the TS also). For a good example of how this was done, see the legend of Figure SPM.5 on page 39 of the SPM, specifically the 'Interpretation of risk for a sector' legend entry. (NETHERLANDS)
Figure has been redrawn
826 81453 26 81 0 0 0 Figure 26-5: Figure caption is inadequate to explain the complexity of the plots. A few more sentences would help. (Yuka Estrada, IPCC WGII TSU)
Figure has been removed
827 83803 26 81 0 0 0 Figure 26-5. A much more extensive caption should be provided to fully explain this figure. (Katharine Mach, IPCC WGII TSU) Figure has been removed
828 75373 26 81 0 81 0 Figure 26-5 Comment - On both pages 21 and 81, the caption for Figure 26-5 does not provide enough information for the reader to understand its content. What does the histogram at the bottom of each panel represent? What does the X axis represent? Mean growing season temperature? Maximum growing season temperature? Also, please explain the source of the data and the different curves used to fit the data. (UNITED STATES OF AMERICA)
Figure has been removed

IPCC WGII AR5 Chapter 26 SECOND-ORDER DRAFT
Government and Expert Review Page 68 of 68 28 March - 24 May 2013
# ID ChFrom Page
From Line
To Page
To Line Comment Response
829 75374 26 81 0 81 0 Figure 26-5 Comment - The connection between the (green) bottom bar plot to the multi-colored yield plot on the top is not clear - nor is the y-axis label legible. Also, the caption should be modified to add “crop” to make “crop yields”. Moreover, effort should be made to heavily revise this figure to simplify it from the primary source in a way that is more comprehensible. Additionally, the discussion of this figure in the text is lacking in sufficient detail to relay its key findings. (UNITED STATES OF AMERICA)
Figure has been removed
830 75375 26 81 0 81 0 Figure 26-6 Comment - It is hard to understand this Figure and elements of the Figure are not defined by the caption or legend. Moreover, though, this figure is not clear, seems to be subjective and the concepts of "era of climate responsibility" and "era of climate options" are not intuitive. It should be considered for deletion and, perhaps, replaced with a table that states a given impact, associated confidence and how much risk is associated with that risk under different scenarios. (UNITED STATES OF AMERICA)
Figure has been redrawn
831 75376 26 81 0 81 0 Figure 26-6 Comments - Several elements of this figure need to be significantly clarified and made easier to read (here and in the SPM). The slice labels are illegible, and the reasons for varied font colors (brown, green, blue) are not clear. It is not clear what the three shading colors mean (purple, orange, and red); if they are used only to differentiate among the time periods it would be less distracting to use a single color (as the differences are indicated by the titles and temperature labels). Also, why are the color shadings sometimes indicated by a line at the margin between risk levels while others shade the entire risk-level "band"? The meanings of the subtitles are not at all clear (what is the distinction between "Era of Climate Responsibility" and that of "Climate Options"? (UNITED STATES OF AMERICA)
Figure has been redrawn
832 75377 26 81 0 81 0 Figure 26-6 Comments - The key should include an explanation of the colors. (UNITED STATES OF AMERICA) Figure has been redrawn
833 80958 26 81 0 81 0 Figure 26-5 The information provided in the legend is not useful for readers who are not familiar with the differences in these methods. Authors should consider adding descriptions in the figure caption. (Monalisa Chatterjee, IPCC WGII TSU)
Figure has been redrawn
834 61665 26 81 1 0 0 This figure is unclear. 1) What do the grey and coloured areas represent? 2) Why is there no risk assessed for human security or the oceans? 3) For 4 C many risk assessments are missing. (European Union DG Research, Directorate Environment Climate Change & Environmental Risks Unit)
Figure has been redrawn