IPC2010-31537 Fitting Repair - ChrisAlexanderchrisalexander.com/assetmanager/assets/2010 Sept Oct -...
15
Proceedings of IPC2010 8th International Pipeline Conference September 27 – October 1, 2010, Calgary, Alberta, Canada IPC2010-31537 © Copyright 2010 ASME REPAIR OF HIGH PRESSURE PIPE FITTINGS USING COMPOSITE MATERIALS Julian Bedoya Stress Engineering Services, Inc. Houston, Texas [email protected] Chris Alexander Stress Engineering Services, Inc. Houston, Texas [email protected] Tommy Precht Armor Plate, Inc. Pasadena, Texas [email protected] ABSTRACT Pipelines and piping frequently suffer from metal loss that threatens their integrity and serviceability. Multiple repair options exist for straight sections of pipe; however, repair options for pipe fittings such as elbows and tees are typically limited to composite repair systems, or section replacement. The latter method can be costly as it often requires at least a partial shut down of the pipeline while the section is replaced. A composite repair system however, can be performed in place during operations at a greatly reduced cost. The main challenge with the composite repair system is the required demonstrated ability to restore integrity and serviceability to the same level as the original metal system. Over the past 10 years, Stress Engineering Services, Inc. has been greatly involved in evaluating the ability of many composite repair systems to restore the original pipeline structural integrity by testing methods and analysis methods. The current paper investigated the ability of the Armor Plate Pipe Wrap (APPW) system to restore the burst pressure of tee and elbow pipe fittings with 60% metal loss to that of a nominal thickness system. In this program four full scale burst tests were conducted: on 12-inch nominal pipe size (NPS) Y52 tee and elbow pipe fittings. All four fittings had 60% metal loss; two were repaired with APPW, and the other two were not repaired. Prior to burst testing, elastic plastic finite element analyses (FEA) were performed to adequately size the repair thickness. The results of the FEA calculations predicted the restoration of the burst pressures of the repaired fittings up to a 1.6% agreement with the actual burst pressure results. Furthermore, the burst pressure of the 60% metal loss tee was increased from 3,059 psi (unrepaired) to 4,617 psi, or a 51% improvement. The burst pressure of the 60% metal loss elbow was increased from 2,610 psi to 4,625 psi, or a 77% improvement. Both the analysis and testing results demonstrated that composite materials can restore the pressure integrity of corroded tee and elbow pipe fittings. INTRODUCTION One of the most pressing concerns for operating companies is how to restore mechanical integrity to their pipelines and piping systems once they have been compromised. Equally important is how costly the repair alternatives are – including capital cost as well as the cost of lost production. In addition, the practicality of the solution also plays an important role in the selection of the repair method. Ultimately, the most viable solution that will be implemented is one where integrity is unquestionably and reliably restored, while minimizing lost production costs. Unlike straight pipeline sections, repair options for elbows and tees are limited to section replacement, or a composite repair. The former option requires a partial shut down of the line and therefore lost production costs are high in addition to welding considerations. The latter option can be performed in-situ and shutting down the line is seldom a requirement. Yet, composite repairs in fittings are not as widely used as their straight section counterparts. The most significant reason for composite repairs having a reduced market share in fitting repair is the increased complexity in the stress and strain distributions relative to a straight pipe. From a design point of view, the repair of an elbow or a tee will require additional material when compared to the repair of a straight pipe section and the fiber orientation becomes more significant and important. In addition, by virtue of the geometry of the pipe fittings, rigid-coil-type repairs are excluded from being able to provide a repair solution. The remaining composite manufacturers thus carry the burden of proving that their repair systems will work just as reliably in repairing fittings as in straight pipe. This paper provides analysis and testing examples of how Armor Plate Pipe Wrap (APPW) was able to restore the strength integrity of a 12-inch NPS Y52 tee and elbow pipe fittings having 60% corrosion. The paper is organized in the following sections. Background: provides information of reference allowable stresses per the American Society of Mechanical Engineers (ASME) pipeline Codes (ASME B31.4 and B31.8 for liquid and gas, respectively.) Analysis Methods: A summary of the finite element analyses (FEA) that were conducted to assess using composites as viable repair options for fittings. Testing methods: a detailed account of the burst tests performed on corroded and unrepaired elbow and tee vs. corroded and repaired (APPW) elbow and tee. Analysis results and testing results are subsequently discussed followed by a discussion section and a conclusion section. BACKGROUND The reinforcement of pipe fittings presents unique challenges when considering the use of composite materials. This condition exists primarily because of the complex bi-axial stress field that exists in pipe fittings, namely elbows and tees. When considering the use of composite materials, additional complexities are introduced because of the challenges associated with making installations around multifaceted geometries that reduce the likelihood for alignment of composite fibers in a preferred orientation. The current composite repair standard, ASME PCC-2 [1], provides some recommendations for repairing pipe fittings, but draws primarily from concepts embodied in other available piping and pipeline codes. However, previous research has shown that some of the published data for stress intensification factors (SIFs) can be non-conservative [2], especially with regards to tees.
Transcript of IPC2010-31537 Fitting Repair - ChrisAlexanderchrisalexander.com/assetmanager/assets/2010 Sept Oct -...

Proceedings of IPC2010 8th International Pipeline Conference
September 27 – October 1, 2010, Calgary, Alberta, Canada
IPC2010-31537
© Copyright 2010 ASME
REPAIR OF HIGH PRESSURE PIPE FITTINGS USING COMPOSITE MATERIALS
Julian Bedoya Stress Engineering Services, Inc.
Houston, Texas [email protected]
Chris Alexander
Stress Engineering Services, Inc. Houston, Texas
Tommy Precht Armor Plate, Inc. Pasadena, Texas [email protected]
ABSTRACT Pipelines and piping frequently suffer from metal loss that
threatens their integrity and serviceability. Multiple repair options exist for straight sections of pipe; however, repair options for pipe fittings such as elbows and tees are typically limited to composite repair systems, or section replacement. The latter method can be costly as it often requires at least a partial shut down of the pipeline while the section is replaced. A composite repair system however, can be performed in place during operations at a greatly reduced cost. The main challenge with the composite repair system is the required demonstrated ability to restore integrity and serviceability to the same level as the original metal system. Over the past 10 years, Stress Engineering Services, Inc. has been greatly involved in evaluating the ability of many composite repair systems to restore the original pipeline structural integrity by testing methods and analysis methods. The current paper investigated the ability of the Armor Plate Pipe Wrap (APPW) system to restore the burst pressure of tee and elbow pipe fittings with 60% metal loss to that of a nominal thickness system. In this program four full scale burst tests were conducted: on 12-inch nominal pipe size (NPS) Y52 tee and elbow pipe fittings. All four fittings had 60% metal loss; two were repaired with APPW, and the other two were not repaired. Prior to burst testing, elastic plastic finite element analyses (FEA) were performed to adequately size the repair thickness. The results of the FEA calculations predicted the restoration of the burst pressures of the repaired fittings up to a 1.6% agreement with the actual burst pressure results. Furthermore, the burst pressure of the 60% metal loss tee was increased from 3,059 psi (unrepaired) to 4,617 psi, or a 51% improvement. The burst pressure of the 60% metal loss elbow was increased from 2,610 psi to 4,625 psi, or a 77% improvement. Both the analysis and testing results demonstrated that composite materials can restore the pressure integrity of corroded tee and elbow pipe fittings. INTRODUCTION
One of the most pressing concerns for operating companies is how to restore mechanical integrity to their pipelines and piping systems once they have been compromised. Equally important is how costly the repair alternatives are – including capital cost as well as the cost of lost production. In addition, the practicality of the solution also plays an important role in the selection of the repair method. Ultimately, the most viable solution that will be implemented is one where integrity is unquestionably and reliably restored, while minimizing lost production costs. Unlike straight pipeline sections, repair options for elbows and tees are limited to section replacement, or a composite repair. The former option requires a partial shut down of the line and therefore lost production costs are high in addition to
welding considerations. The latter option can be performed in-situ and shutting down the line is seldom a requirement. Yet, composite repairs in fittings are not as widely used as their straight section counterparts. The most significant reason for composite repairs having a reduced market share in fitting repair is the increased complexity in the stress and strain distributions relative to a straight pipe. From a design point of view, the repair of an elbow or a tee will require additional material when compared to the repair of a straight pipe section and the fiber orientation becomes more significant and important. In addition, by virtue of the geometry of the pipe fittings, rigid-coil-type repairs are excluded from being able to provide a repair solution. The remaining composite manufacturers thus carry the burden of proving that their repair systems will work just as reliably in repairing fittings as in straight pipe.
This paper provides analysis and testing examples of how Armor
Plate Pipe Wrap (APPW) was able to restore the strength integrity of a 12-inch NPS Y52 tee and elbow pipe fittings having 60% corrosion. The paper is organized in the following sections. Background: provides information of reference allowable stresses per the American Society of Mechanical Engineers (ASME) pipeline Codes (ASME B31.4 and B31.8 for liquid and gas, respectively.) Analysis Methods: A summary of the finite element analyses (FEA) that were conducted to assess using composites as viable repair options for fittings. Testing methods: a detailed account of the burst tests performed on corroded and unrepaired elbow and tee vs. corroded and repaired (APPW) elbow and tee. Analysis results and testing results are subsequently discussed followed by a discussion section and a conclusion section.
BACKGROUND
The reinforcement of pipe fittings presents unique challenges when considering the use of composite materials. This condition exists primarily because of the complex bi-axial stress field that exists in pipe fittings, namely elbows and tees. When considering the use of composite materials, additional complexities are introduced because of the challenges associated with making installations around multifaceted geometries that reduce the likelihood for alignment of composite fibers in a preferred orientation.
The current composite repair standard, ASME PCC-2 [1], provides
some recommendations for repairing pipe fittings, but draws primarily from concepts embodied in other available piping and pipeline codes. However, previous research has shown that some of the published data for stress intensification factors (SIFs) can be non-conservative [2], especially with regards to tees.
© Copyright 2010 ASME
Provided below is text taken from ASME PCC-2 concerning the repair of pipe fittings.
3.4.9 Pipe Fittings. Equations (1) through (9) relate to the stresses in the substrate (pipe) under combinations of internal pressure and axial load. For pipe fittings, such as bends, reducers, tees, and flanges, the stress systems are more complex and may need further consideration. Calculations may be based on pressure stress multipliers for pipe components taken from ISO14692.
The pressure stress multiplier for bends, reducers, and other components where the membrane stress due to pressure is the same as for simple pipe shall be taken as unity, and for tees, shall be taken as 2. The diameter required for repair design is the largest diameter of the component.
It would seem that due to the complexity in repairing pipe fittings, additional investigation are warranted to ensure that the corroded steel beneath the composite material is adequately reinforced. The program results presented in this paper are a step in that direction; however, as will be noted in this presentation, no definitive guidelines for the repair of pipe fittings are provided. Rather, the authors are attempting to demonstrate the technical feasibility in using composite materials to reinforce corroded sections in high pressure pipe fittings. ANALYSIS METHODS
In this study, finite element analyses were performed to determine the amount of composite reinforcement that a 12-inch X 0.375-inch Y-52 60% corroded long radius elbow and straight tee required to restore the burst pressure to a value that exceeded the nominal pipe. The finite element work preceded actual burst tests of said fittings. The FEA geometry was taken from the actual specimens that were to be tested. The region of corrosion on the elbow was located at the intrados, spanning a 90° circumferential sector with the center of the corrosion at the geometric center of the fitting, and an arc length of one diameter – 12.75-inches. For the tees, the corroded region was located at the bottom of the fitting in the geometric center, spanning a 90o sector circumferentially. The length of the corroded region was also 12.75 inches. The extent of the repair with composite for both fittings included the entire fitting itself.
The finite element models were created using the pre-processor
MSC.Patran, and the processor and post-processor used was the general purpose finite element code ABAQUS version 6.7-1. The fittings were modeled with shell elements with large strain and displacement capabilities. The nodes and elements of the fittings and pipes were constructed on the neutral surface (mid-plane surface) of the geometry. The assignment of the thickness then defines the ID and the OD of the model by adding half the thickness in either direction. The corroded region was modeled by defining a group of elements within the fitting with the appropriate thickness. However, because the nodes and elements reside on the neutral surfaces, corrosion is modeled as happening from both the OD and ID. This assumption does not compromise the results of this analysis since it is thin walled pipe theory. In addition, there is continuity of the membrane strains, which is the driving parameter of determining the burst pressure.
The composite repair was modeled by adding a second layer of
elements coincident with the base metal elements, sharing the same nodes. Geometrically, these elements are located on the same position as the base metal elements; however, an offset parameter is assigned in the shell section definition of the composite that allows the ID or OD
to be offset, using a more appropriate geometric stiffness to be applied in the input of the calculations. The elastic modulus of the composite material was defined as an “effective modulus”, regardless of the actual number of layers of composite used in practice, or with the experimentally obtained “fiber” elastic modulus. The finite element models also do not include the effects of the epoxy based binding agent or its shear strength. The base metal was modeled with a modulus of elasticity of 30E6 psi and a Poisson’s ratio of 0.3. The yield strength, ultimate tensile strength, and elongation at failure for the tees, elbows, and pipe sections welded to the fittings were defined from the appropriate mill test reports (MTRs) – see Table 1. The composite material in the long radius elbows was modeled with direction dependent modulii of elasticity: the hoop modulus was defined as 2E6 psi, and the axial modulus was defined as 1E6 psi.
The crotch thickness of the tees was modeled as being 42%
thicker than the nominal thickness of the pipe as is frequently encountered in practice. The thickness was varied from this 142% value to the nominal pipe wall in 4 sets of elements comprising the crotch: 142%, 128%, 114%, and 100% of the nominal wall. The modulii of elasticity for the composite material was the average value between the hoop and axial directions used in the elbow models, which corresponds to a value of 1.5E6 psi. For both the elbows and the tees, symmetry boundary conditions were applied as noted in Figures 1 and 2, and an internal pressure was applied to the ID of the entire finite element model. Figures 1 and 2 show the finite element models of both the tee and the elbow.
The solution method employed in the FEA study consisted of
large displacement and large strains. The approach of the analysis was taken as a limit state analysis, in which the model is loaded by a large internal pressure until the model can no longer achieve static equilibrium. This load is known as the plastic collapse load (PCL) and it represents the largest load (pressure in the present case) with a statically admissible stress field – this load is the expected experimental burst pressure. As the structure is stressed from yield to the tensile strength, plasticity begins to set in, and the load is redistributed until the displacements and the strain of the metal become large enough to not converge and simulate a failure of an actual test specimen. One key difference between these simplified finite element analyses and actual burst tests is that the composite material is defined to be elastic and therefore cannot fail in the FEA. This limitation implies that the strains in the composite must remain low (approximately 0.4%) for the repair to be considered successful. However, it must be mentioned that this strain limit can vary greatly across different composite repair manufacturers. TESTING METHODS
Similar to the FEA, the objective of the testing was to determine experimentally if APPW could adequately restore the burst capacity of a 12-inch X 0.375-inch Y-52 long radius elbow and straight tee with 60% simulated ground corrosion to a minimum of the base pipe. In order to make the test more meaningful, a corroded and unrepaired long radius elbow and straight tee with approximately the same amount of corrosion were also burst. As expected, the actual wall thickness of the tees at the base of the fitting was on the order of 0.400 to 0.500 inches. References to corrosion are relative to the actual wall thickness before the simulated corrosion was implemented.
© Copyright 2010 ASME
In preparation for the burst tests, 3 feet of 12-inch X 0.375-inch X52 pipe, end caps and pressure ports were welded to the fittings. Extensive thickness measurements for both fittings and pipes were then taken and recorded. The samples were ground according to Figure 4. For the unrepaired samples, strain gages were then installed on each of the tested fittings at various locations in the corroded section and the nominal base pipe – see Figures 3 and 4. For the repaired samples, the area to be repaired was sandblasted per the recommendations from APPW. Once sandblasted, strain gages were installed per Figures 3 and 4. The purpose of the strain gages was to assess the level of reinforcement the composite repair system was providing relative to the unrepaired samples. Armor Plate then installed their repair on the appropriate samples. The final strain gages were installed on the composite repairs per Figures 3 and 4.
Calibration of strain gages and pressure transducer were completed using Stress Engineering Services, Inc. in-house data acquisition hardware and software. The following test plan was used: • Pressurize samples at a rate of 5 psi per second (all pressure
levels). • Increase pressure from 0 psi to 550 psi (25% MAOP). • Hold for 1 minute. • Increase pressure from 550 psi to 1,100 psi (50% MAOP). • Hold for 1 minute. • Increase pressure from 1,100 psi to 1,650 psi (75% MAOP). • Reduce pressure at a moderate rate to 0 psi. • Cycle pressure from 0 psi to 1,650 psi 10 times. • Increase pressure from 1,650 psi to 2,200 psi (100% MAOP) • Hold for 1 minute. • Increase pressure from 2,200 psi to 3,058 psi (100% SMYS). • Hold for 1 minute. • Increase pressure to burst. • Strain gage and pressure data were recorded continuously at a
rate of 1Hz until failure. ANALYSIS RESULTS
The assessment for all finite element models consisted in analyzing the maximum principal strain observed at a pressure just above the maximum allowed operating pressure (MAOP) – or 72% of the specified minimum yield strength (SMYS), and at the plastic collapse load (PCL), or burst pressure. A comparison of the maximum principal strain at the defect region in the unrepaired and repaired samples provides an indicator of how the composite repair system is performing. Because of compatibility constraints with the composite elements and the base metal elements as a result of sharing nodes, the strain in both materials is nearly the same. Only the strains in the base metal are discussed, but for all practical purposes, the strains in the composite can be assumed to be the same at the interface. Finally, the FEA model geometries were based on the actual specimens that were going to be tested. Because the simulated corrosion was ground and not machined, the wall thickness in the defect region had some variation. All FEA models had a “critically corroded” section as well as a “corroded” section. The former was modeled as the thinnest wall thickness measured with UT instrumentation, while the latter was the average measured wall thickness.
Unrepaired Tee: The critical corrosion section had a thickness of 0.150 inches, while the average wall thickness was 0.207 inches. The nominal fitting wall thickness was 0.495 inches. The thicknesses at the crotch were defined in three groups with the thickest at the top of the
fitting of 0.625 inches, 0.525 inches and 0.500 inches. Figure 5 shows the maximum principal strain in the corroded metal at 2,250 psi (MAOP is 2,200 psi), at a peak value of 10.8%. The maximum principal strain in the critically corroded region at the burst pressure per the FEA results (2,849 psi) was 27%. Repaired Tee
The critical corrosion section had a thickness of 0.150 inches, while the average wall thickness was 0.191 inches. The nominal fitting wall thickness was 0.500 inches. The thicknesses at the crotch were defined in three groups with the thickest at the top of the fitting of 0.625 inches, 0.525 inches and 0.500 inches. The thickness of the composite was modeled as 0.750 inches. Figure 6 shows the maximum principal strain in the corroded metal at 2,250 psi (MAOP is 2,200 psi), at a peak value less than 0.5%. The maximum principal strain in the critically corroded region at the predicted burst pressure per the FEA results was 1.7%, while the maximum principal strain in the base pipe was an order of magnitude higher at 17.7%. The FEA model predicted failure in the base pipe and not in the repaired fitting. The burst pressure was estimated by the FE model at 4,400 psi. Unrepaired Elbow
The critical corrosion section had a thickness of 0.155 inches, while the average wall thickness was 0.202 inches. The nominal fitting wall thickness was 0.400 inches. Figure 7 shows the maximum principal strain in the corroded metal at 2,250 psi (MAOP is 2,200 psi), at a peak value of 16.67%. The maximum principal strain in the critically corroded region at the predicted burst pressure per the FEA results (2,523 psi) was 29.1%. Repaired Elbow
The critical corrosion section had a thickness of 0.155 inches, while the average wall thickness of the elbow fitting was 0.205 inches. The nominal fitting wall thickness was 0.400 inches. Figure 8 shows the maximum principal strain in the corroded metal at 2,250 psi (MAOP is 2,200 psi), at a peak value of 0.51%. The maximum principal strain in the critically corroded region at the predicted burst pressure per the FEA results (4,552 psi) was approximately 1.5%. The FEA model predicted failure in the base pipe. The maximum principal strain in the base pipe at the predicted burst pressure was 21.8%. TESTING RESULTS
As noted in the testing methods, there were 10 pressure cycles applied to each specimen prior to the burst tests. During the pressure cycles a non-linear pressure vs. strain response in locations 1 and 2 of all samples occurred at 1,650 psi. For this reason, the cycling pressure was reduced to 1,100 psi (50% MAOP) for all samples. A shakedown to elastic action at locations 1 and 2 was subsequently noted in the remaining cycles, also for all samples. Unrepaired Tee
The average measured wall thickness in the defect region was 0.207 inches, or 58.6% simulated corrosion. Figure 9 shows photographs of the unrepaired tee prior to testing. Figure 13 shows the pressure vs. microstrain (10,000 microstrain is equal to 1% strain) for the unrepaired tee, the repaired tee, and the base pipe. At approximately 18,200 microstrain (1.82% strain) the strain gage on the unrepaired tee in the defect debonded, resulting in erroneous strain readings thereafter. A green dotted line of approximately the same slope as the actual pressure vs. strain data prior to the strain gauge failure, is linearly extrapolated for the purpose of comparing the performance of
© Copyright 2010 ASME
a composite repaired corroded section to an unrepaired corroded section. It is noted that generally the characteristic trend of actual pressure vs. strain data in the plastic regime is for this curve to flatten (i.e., to approach a slope of zero), and not have a constant slope. Comparing the performance of composite repaired corroded section to this linear extrapolation of the pressure vs. strain of the unrepaired section in the plastic regime results in an upper bound baseline to which the composite repair is being evaluated against. The burst of the unrepaired tee occurred in the defect region at 3,059 psi. Figure 10 shows several pictures of the failed unrepaired fitting. Repaired Tee
Figure 11 shows two photographs of the repaired tee in the burst pit prior to testing. The sample was repaired with 12 layers of APPW totaling a thickness of 0.75-inches. The average measured wall thickness at the defect was 0.191-inches, corresponding to a simulated corrosion of 61.8%. Figure 13 shows the pressure vs. strain data. Until approximately 1,800 psi internal pressure, the behavior between the repaired and unrepaired tee was very similar. However, the differences in strain increase at higher pressures. The burst for the repaired tee occurred in the nominal pipe outside of the repaired region at a pressure of 4,617 psi. Figure 12 shows a photograph of the repaired tee sample having failed in the base pipe. Unrepaired Elbow
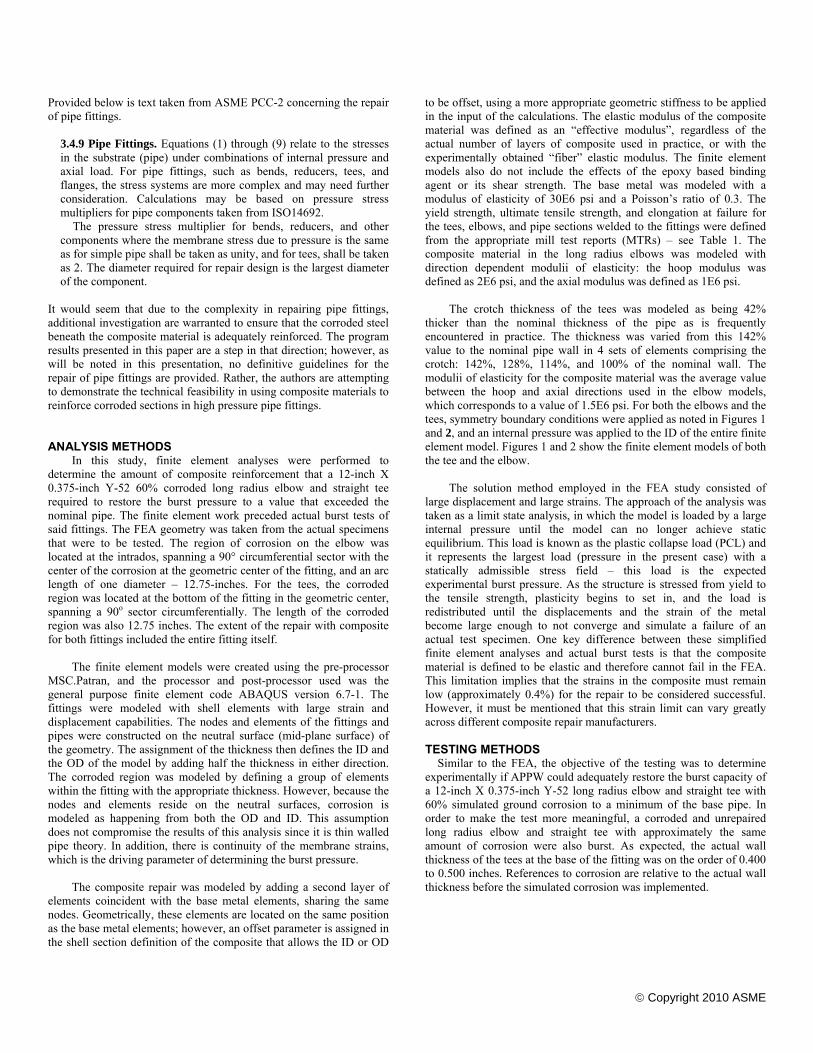
Figure 14 shows photographs of the unrepaired elbow in the burst pit prior to the test. The average measured thickness of the defect was 0.202-inches, or 59.6% simulated corrosion. The unrepaired elbow burst at a pressure of 2,610 psi in the defect. The maximum measured strain was close to 20,000 microstrain, or 2%; however, this value occurred before the actual burst, most likely due to the strain gauge becoming debonded. The pressure vs. strain data for the unrepaired and repaired elbows, and the base pipe are shown in Figure 18. Linear extrapolation of the slope of the measured pressure vs. strain just before becoming debonded is shown, providing a bounding estimate for the plastic strains between yielding and the actual burst. The maximum strain measured in the nominal pipe was 1,020 microstrain, or 0.102%. Figure 15 shows a photograph of the failure of this sample. Repaired Elbow
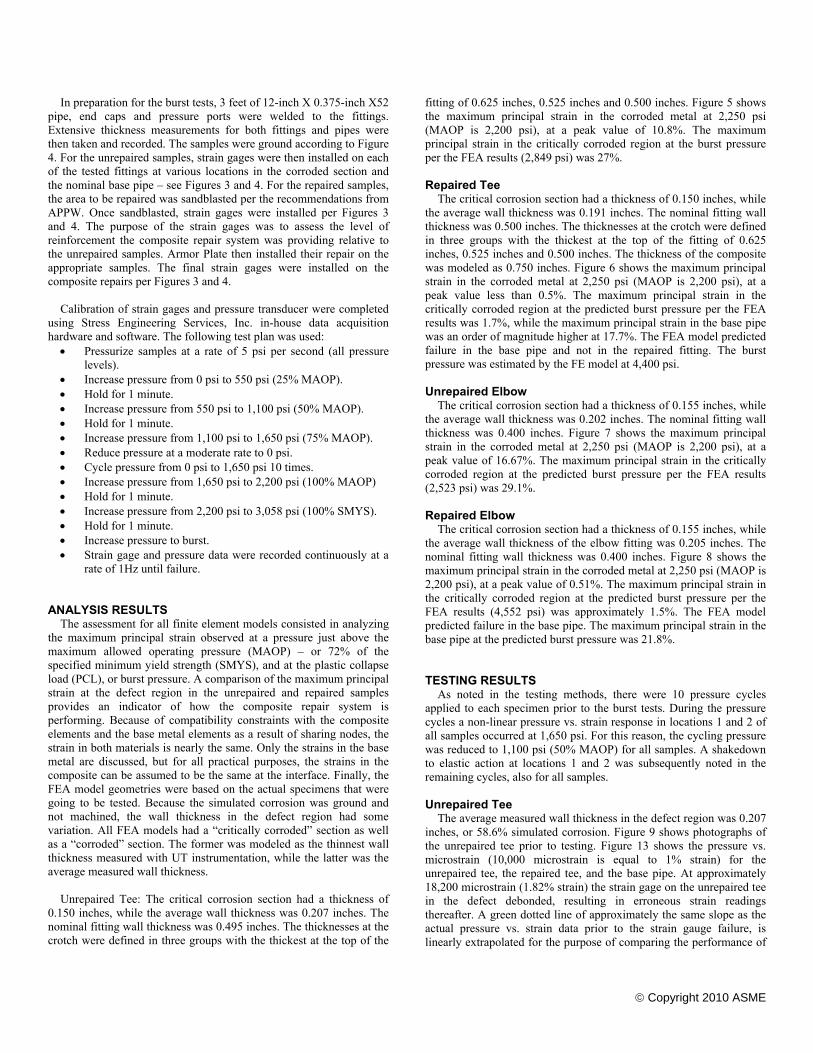
The average measured wall thickness in the defect region was 0.205-inches, or 59% simulated corrosion. Figure 16 shows two photographs of the sample prior to testing. The burst pressure of the sample occurred at 4,625 psi in the nominal pipe on the pup without strain gage data. Figure 18 shows the pressure vs. strain relationship. It can be seen that until approximately 1,500 psi of internal pressure the behavior of the repaired and unrepaired elbow were similar. At 1,500 psi of internal pressure, a sudden decrease in strain can be seen in the repair section of the sample. This is due to the composite repair becoming engaged and affecting the measured strains in the base metal. The maximum measured strain in the nominal pipe was approximately 27,000 microstrain (2.7% strain); however, this value was reached in advance of the actual burst, most likely due to the strain gauge losing the bond with the metal. The strains in the nominal pipe continued to rise until burst, but due to the strain gauge becoming debonded, this rise in strain beyond 2.7% was not captured. Conversely, the maximum strain recorded in the defect was over 36,000 microstrain (3.6% strain). Figure 18 also shows the internal pressure increasing with a constant strain in the defect. This was due to the strain gauge reaching a saturation voltage (100 mV), and not actual material behavior. At some point, the strain in the nominal pipe continued to rise to a higher value while the strains in the defect rose,
but at a slower pace. Table 2 shows a summary of maximum principal strain shown in Figures 13 and 18. Figure 17 show a photograph of the burst repaired elbow. Figure 19 shows both repaired fittings with failures outside the repair area and in the nominal pipe. Figure 20 shows a bar chart of the burst pressures for the four samples tested. DISCUSSION As can be seen in the experimental results, APPW was successful in restoring the burst capacity to the simulated corroded tee and elbow. Specifically, the burst pressure in the unrepaired corroded elbow was 2,610 psi, while the burst pressure in the repaired elbow was 4,625 psi occurring in the nominal pipe, or a 77% improvement once repaired with APPW. Similarly, the unrepaired tee had a burst pressure of 3,059 psi, while the repaired tee had a burst pressure in the nominal pipe of 4,617 psi, or a 51% improvement. Similarly, the FEA results predicted a burst pressure of 2,849 psi for the unrepaired tee, or a 7.4% difference with the actual test. The FEA results predicted a burst pressure of 4,400 psi for the repaired tee, or 4.70% difference with the actual burst pressure. The results of the elbow had a lower percentage difference: the FEA predicted a burst pressure of 2,523 psi for the unrepaired elbow, or 3.3% difference. The analysis results predicted a burst pressure of 4,552 psi for the repaired elbow, or 1.6% difference with the actual burst pressure. The discrepancies in the failure pressures are a result of the FEA model being a shell model, and not having a continuous wall thickness, but having average wall thicknesses modeled as discrete steps rather than a continuum. In addition, it is not uncommon for MTR data to be slightly off, or in some instances incorrect – although the latter was not this case.
Finally, the D/t ratio for the nominal pipe (12.75-inch OD X 0.375-
inch wall thickness) is 34 and thin wall theory is appropriate, however, when adding 0.75-inches of composite, the D/t ratio becomes 11.33, for which 3D solid elements are better suited. However, the shell model could provide a reasonable approximation given than the loading was generating mainly a general primary membrane stress.
However, the most significant results that the FEA model provided were the strain data at MAOP and at burst. In looking at the maximum principal strain FEA results of the unrepaired tee vs. the repaired tee, one can clearly see the benefit of having the composite reinforcement installed. For example: the unrepaired tee with 10.8% maximum principal strain at 2,250 psi, 50 psi above the MAOP showed a strain of less than 0.5% once the composite material was included in the model. The repaired tee model at burst indicated a strain level of 1.70% in the defect region at the burst pressure, while the strain in the base pipe was over 17% strain. However, this result in itself did not have the conclusive foresight for a successful repair. Composite materials are not known for having the capacity to undergo large strains, and the modeling technique used a linear elastic constitutive law for the composite, and strain compatibility across the composite-to-metal interface. Thus, a 1.70% strain in the metal, although large, is not enough to cause failure of the metal in most circumstances, so the FEA model would not predict failure in the defect at this strain. However, the composite material would likely not be able to handle such a large strain, but because it was elastic, the model would not predict failure in the composite. Nonetheless, the expansion and strain of the base pipe in the model was far more significant than in the repair. The experimental results confirmed this statement.
The elbow results were qualitatively very similar to the tee results. The maximum principal strain in the defect at 2,250 psi was reduced from 16.67% for the unrepaired elbow, to a peak value of 0.51% for the repaired model, at the same pressure. At burst, the FEA predicted a

© Copyright 2010 ASME
maximum principal strain in the metal of 1.50%, which is sufficient to cause the composite material to fail. Yet, similar to the tees, the strain in the base pipe in the elbow was increasing at a much higher rate than in the defect, and it was conjectured that the pipe would ultimately fail rather than the repair. This last statement should not be generalized as different composite systems have different load transfer mechanisms as well as different strain capacities.
It is also worth noting that differences between the FEA work and the actual test results is that the strains in the defect underneath the repair were quite high, even at MAOP (2,200 psi), on the order of 1.5% to 2.0%. However, it is thought that slipping between the composite repair and the filler material/metal begins occurring and the composite material itself does not experience the same magnitude of strains. This statement is supported by having generally small strains measured in the composite material even until the failure of the sample. This is another limitation of the FEA work, as the filler material was not modeled, nor the shear strength at the metal/filler material/composite interfaces, or the damage evolution.
Figures 13 and 18 show pressure vs. strain for all the fittings tested as well as the base pipe. As can be seen, the behavior of the steel (repair) in the repaired and unrepaired samples is very similar until a given pressure – 1,800 psi for the tees and 1,500 psi for the elbows – when the composite system begins to incur load. It should be understood that in principle all composite repair systems function the same way. The success of one system over the next depends highly on the combined stiffness of the steel-composite system, and the resulting ultimate tensile strength of the system.
CONCLUSIONS
This paper has provided both testing and analysis methodologies for evaluating the restoration capacity in terms of burst pressure of composite repair systems used in 12-inch NPS Y-52 elbows and tees with simulated corrosion. Both methodologies are useful and cost effective. FEA work can be extremely effective in evaluating new concepts prior to proof tests. The limitation of FEA for this study (as in many cases) were mainly material related as we lacked laminae material properties; instead, bulk elastic properties that were direction-
dependent were used. However, with appropriate material testing, the most minute material properties and data can be incorporated into a finite element analysis for increased accuracy. However, when extensive material property testing is not practical, it is advantageous to use FEA to streamline the testing parameters so that only the final design or prototype is tested. Although not discussed in this paper, a separate FEA study was conducted to determine the required thickness of composite was necessary to design successful composite repairs. As a result of this prior work, the testing program was a success.
In conclusion, the composite repair system tested in this program was able to demonstrate that it could restore the burst capacity to corroded tees and elbows and verified through testing and numerical methods. REFERENCES [1] ANSI/ASME PCC-2-2006, Repair of Pressure Equipment and
Piping, 1st Edition, American Society of Mechanical Engineers, New York, January 1, 2007.
[2] Fowler, J. R., Alexander, C. R., and Samman, M. M. (1996). A Study on the Design Guidelines for High-Pressure Pipe Fittings, 1996 Energy Week Conference, Houston, Texas.
[3] American Society of Mechanical Engineers, Liquid Transportation System for Hydrocarbons, Liquid Petroleum Gas, Anhydrous Ammonia and Alcohols, ASME B31.4, New York, New York, 2003 edition.
[4] American Society of Mechanical Engineers, Gas Transmission and Distribution Piping Systems, ASME B31.8, New York, New York, 2003 edition.
Table 1 – Summary of MTR parameters used in FEA work.
33%82,70055,600Tee
40%76,50056,900Pipe
29.5%78,00055,700Elbow
Elongation %(2” Specimen)
Ultimate Tensile Strength (psi)
Yield Strength (psi)
Fitting
33%82,70055,600Tee
40%76,50056,900Pipe
29.5%78,00055,700Elbow
Elongation %(2” Specimen)
Ultimate Tensile Strength (psi)
Yield Strength (psi)
Fitting

© Copyright 2010 ASME
Table 2 – Summary of MTR parameters used in FEA work.
Base Pipe Unrepaired Repaired Unrepaired RepairedInternal Pressure
72% SMYS (2,200 psi) 0.102% 1.824% 1.176% 1.890% + 1.180%100% SMYS (3,058 psi) 0.140% Debonded SG 1.830% Debonded SG 2.193%
Tee ElbowMaximum Principal Strain (%)
Burst Pressure (psi) 4,625 3,059 4,617 2,610 4,625
20”
12.75”
10 in
CompositeCorrosion
Crotch –thickness gradient
Symmetry BC
Internal Pressure
R1.75”
7D 7D
20”
12.75”
10 in
CompositeCorrosion
Crotch –thickness gradient
20”
12.75”
10 in
CompositeCorrosion
Crotch –thickness gradient
Symmetry BC
Internal Pressure
R1.75”
7D7D 7D7D
Figure 1 – Finite element mesh of Tee. Symmetry boundary conditions applied at top of branch connection.

© Copyright 2010 ASME
36”
Symmetry BC
36”
36”
Symmetry BC
36”
36”36”
Symmetry BC
36”36”
Figure 2 – Finite element mesh of Elbow. Symmetry boundary conditions (BC) applied at bottom pup.
90o
~10.01”(arclength)
20”12.75”
36” 36”
36”
2 SG sets on corroded metal. SG#1 in center, SG#2 in thinnest measured wall.
SG#6 on composite layer aligned with SG#1 on metal.
18”
SG Location
UT measurement Location
SG Number (B is biaxial, T is triaxial)
1B,2B,6B3T, 7T
4T5B
SG#1SG#2
90o
~10.01”(arclength)
20”12.75”
36” 36”
36”
2 SG sets on corroded metal. SG#1 in center, SG#2 in thinnest measured wall.
SG#6 on composite layer aligned with SG#1 on metal.
18”
SG Location
UT measurement Location
SG Number (B is biaxial, T is triaxial)
1B,2B,6B3T, 7T
4T5B
SG#1SG#220”
12.75”
36”36” 36”36”
36”
36”
2 SG sets on corroded metal. SG#1 in center, SG#2 in thinnest measured wall.
SG#6 on composite layer aligned with SG#1 on metal.
18”
SG Location
UT measurement Location
SG Number (B is biaxial, T is triaxial)
1B,2B,6B3T, 7T
4T5B
SG#1SG#2
Figure 3 – Geometry, strain gage (SG), and wall thickness measurement (UT) parameters for testing work for Tee.

© Copyright 2010 ASME
Composite
Corrosion
36”
36”
Hemi Head
•SG #1 at center of corroded area on base metal
•SG#2 At thinnest measured wall
•SG#6 on outside composite layer aligned with center SG on metal.
12.75” of arclength
90o
~10.01 inches (arclength)
Smooth radius transition to corroded region
SG Location – All strain gages are Biaxial
UT measurement Location
1,2,6
3
4 on base metal, 7 on composite
5 SG Number
6
Composite
Corrosion
36”
36”
36”
36”
36”36”
36”36”
Hemi Head
•SG #1 at center of corroded area on base metal
•SG#2 At thinnest measured wall
•SG#6 on outside composite layer aligned with center SG on metal.
12.75” of arclength
90o
~10.01 inches (arclength)
Smooth radius transition to corroded region
SG Location – All strain gages are Biaxial
UT measurement Location
1,2,6
3
4 on base metal, 7 on composite
5 SG Number
6
Figure 4 – Geometry, strain gage (SG), and wall thickness measurement (UT) parameters for testing work for Elbow.
Figure 5 – Maximum principal strain (εmax) at 2,250 psi (~100% MAOP) in unrepaired Tee.
Figure 6 – Maximum principal strain (εmax) at 2,250 psi (~100% MAOP) in the repaired Tee.
εmax = 10.8%
εmax = 0.50%

© Copyright 2010 ASME
Figure 7 – Maximum principal strain (εmax) in the unrepaired elbow at 2,250 psi (~100% MAOP).
Figure 8 – Maximum principal strain (εmax) in the repaired elbow at 2,250 psi (~100% MAOP).
εmax = 16.6%
εmax = 0.51%

© Copyright 2010 ASME
The average measured wall thickness in the defect region was 0.207” corresponding to 58.6% simulated corrosion.
The average measured wall thickness in the defect region was 0.207” corresponding to 58.6% simulated corrosion.
Figure 9 – Photographs of unrepaired tee prior to testing.
Figure 10 – Photograph of failed unrepaired Tee at 3,059 psi.

© Copyright 2010 ASME
The average measured wall thickness in the defect region was 0.191” corresponding to 61.8% simulated corrosion.
The average measured wall thickness in the defect region was 0.191” corresponding to 61.8% simulated corrosion.
Figure 11 – Photograph of repaired Tee prior to testing.
Figure 12 – Photograph of failed repaired Tee at 4,617 psi.

© Copyright 2010 ASME
Pressure vs. Microstrain For 12.75"X12.75" X0.375" Y52 Tee with 60% Ground Corrosion
0
500
1,000
1,500
2,000
2,500
3,000
3,500
4,000
4,500
5,000
0 5,000 10,000 15,000 20,000 25,000 30,000 35,000 40,000
Microstrain (10,000 Microstrain = 1% Strain)
Pres
sure
(psi
)
Repaired Tee on Corroded Metal
Base Pipe
Unrepaired Tee
Green Dotted Line is projected Slope of Unrepaired Tee (SG failed prematurely)
Figure 13 – Pressure vs. microstrain plots for repaired Tee, Base pipe and Unrepaired Tee. 10,000 microstrain = 1% strain.
The average measured wall thickness in the defect region was 0.202”corresponding to 59.6% simulated corrosion.
The average measured wall thickness in the defect region was 0.202”corresponding to 59.6% simulated corrosion.
Figure 14 – Photographs of unrepaired elbow prior to testing.
© Copyright 2010 ASME
Figure 15 – Photograph of failed unrepaired elbow at 2,610 psi.
The average measured wall thickness in the defect region was 0.205” corresponding to 59% simulated corrosion.
The average measured wall thickness in the defect region was 0.205” corresponding to 59% simulated corrosion.
Figure 16 – Photograph of APPW repaired elbow prior to testing.

© Copyright 2010 ASME
Figure 17 – Photograph of failed APPW repaired elbow at 4,625 psi.
Pressure vs. Microstrain for 12.75" X 0.375" Y52 Long Radius Elbow with 60% Ground Corrosion
0
500
1,000
1,500
2,000
2,500
3,000
3,500
4,000
4,500
5,000
0 5,000 10,000 15,000 20,000 25,000 30,000 35,000 40,000
Microstrain (10,000 Microstrain = 1% Strain)
Inte
rnal
Pre
ssur
e (p
si)
Unrepaired Elbow
Base Pipe
Repaired Elbow on Steel
Green Dotted Line is projected Slope of Unrepaired Elbow (SG failed prematurely)
Strain Gauge Saturation
Figure 18 – Pressure vs. microstrain plots for repaired Tee, Base pipe and Unrepaired Tee. 10,000 microstrain = 1% strain.
© Copyright 2010 ASME
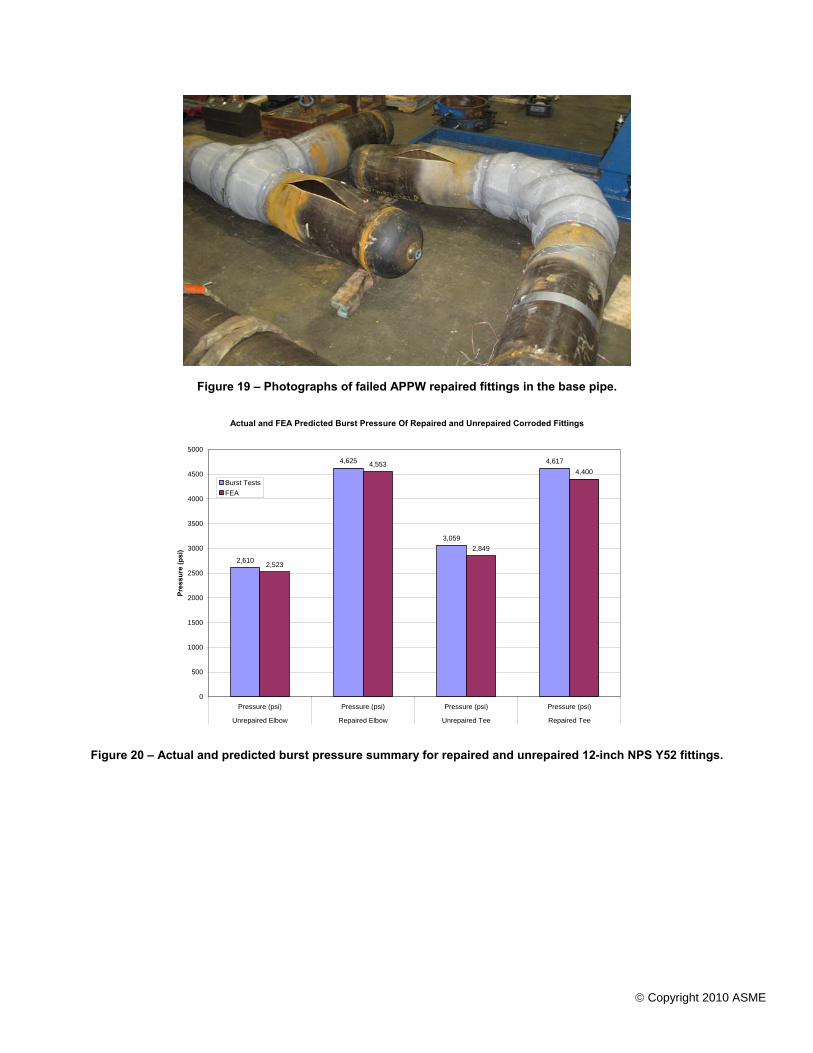
Figure 19 – Photographs of failed APPW repaired fittings in the base pipe.
Actual and FEA Predicted Burst Pressure Of Repaired and Unrepaired Corroded Fittings
2,610
4,625
3,059
4,617
2,523
4,553
2,849
4,400
0
500
1000
1500
2000
2500
3000
3500
4000
4500
5000
Pressure (psi) Pressure (psi) Pressure (psi) Pressure (psi)
Unrepaired Elbow Repaired Elbow Unrepaired Tee Repaired Tee
Pres
sure
(psi
)
Burst TestsFEA
Figure 20 – Actual and predicted burst pressure summary for repaired and unrepaired 12-inch NPS Y52 fittings.