Iowa DOT Freight Advisory Council Meeting Project … Freight... · Project Overview - Freight...
36
consulting & technology Iowa DOT Freight Advisory Council Meeting Project Overview - Freight Transportation Network Optimization Strategy November 22, 2013
Transcript of Iowa DOT Freight Advisory Council Meeting Project … Freight... · Project Overview - Freight...

co
ns
ult
ing
& t
ec
hn
olo
gy
Iowa DOT Freight Advisory Council Meeting
Project Overview - Freight Transportation Network Optimization Strategy
November 22, 2013

quèt ica
Presenter 2
Weiwen Xie, Ph.D
Executive Director, Quetica, LLC
651-964-4646 ext. 803 (O)

quèt ica
Agenda 3
Introduction
Project Approach
Freight Flow Data Analysis
Logistics Cost Data
Questions & Answers

quèt ica
Project Vision
Confidential
4
Iowa DOT Strategic Plan
• Strategic Areas of Focus: Economic Development
• Goal 2: Enhancing the Transportation System
•Strategic Modal Investments
•Performance Management and Reporting
Statewide Freight Network Optimization Strategy Development
MAP-21 Freight Performance Goals
•Improve national freight network
•Strengthen ability of rural communities to access national & international trade markets
•Support regional economic development
To effectively identify and prioritize investment opportunities for an optimized freight transportation network to lower transportation costs for Iowa businesses and promote
business growth in Iowa.

quèt ica
Project Objectives 5
Analyze freight transportation network demand and capacity to identify constraints
Design optimization strategies based on quantitative and qualitative analysis of costs and benefits
Prioritize investment opportunities and develop short and long term financial models
Develop business cases to reduce transportation costs for Iowa businesses
Document a demand-based, value-driven analysis, design, and prioritization methodology to effectively identify and evaluate investment opportunities specific to Iowa’s transportation network optimization

quèt ica
Agenda 6
Introduction
Project Approach
Freight Flow Data Analysis
Logistics Cost Data
Questions & Answers

quèt ica
What is demand-based freight network optimization?
7
Supply Chain Network
Suppliers, plants, warehouses, and flows of products from origin to the final customer
80% of the landed costs are locked in with the location of the facilities and the determination of product flows between them
Supply Chain Network Design
The discipline to determine the optimal location and size of facilities and the flow through the facility network
Demand-Based Freight Transportation Network Optimization
Applies supply chain network design and optimization techniques to freight transportation network
Focuses on end users’ transportation demand
Identifies opportunities to use lower cost transportation modes and additional infrastructure elements to enable lower cost routes

quèt ica
Project Approach 8
• Identification and prioritization of demand areas
• Analyze network demand and capacity
Analysis of Network Demand and Capacity
• Use quantitative and qualitative measurements
• Identify and prioritize current and forecasted network performance constraints
Performance Measurement and Constraints Analysis
• Develop pragmatic short-term and long-term optimization strategies
• Does not intend to identify and evaluate all optimization strategies
Creating and Prioritizing Optimization Strategies
• Conduct financial analysis and develop financial models
• Develop actionable recommendations with justifications Business Case Development

quèt ica
Project Approach 9
Evaluation and Design
Network Design & Optimization
Computer Model Network Design & Optimization Tool
Network Demand
Network Capacity
Demand Forecast
Quantitative Performance
Measurement
Computer SimulationWhat-If Analysis
Constraints, Design Alternatives and
Simulation Results
Financial Analysis
Optimization Strategies
Design Alternatives
Business Cases
Clean
se, Co
nsisten
cy Ch
eck, An
alyze, Verify, an
d
Aggregate D
ata
Qualitative Measurement

quèt ica
Data Strategy 10

quèt ica
Optimization Analysis & Expected Results 11
Optimization Analysis Quantitative Analysis
Cost, lead time requirement, capacity, etc.
Qualitative Analysis Strategic investment directions
Environmental impact (carbon footprint and road mile reduction)
Freight network redundancy
Tax incentive / funding availability
Public relations
Expected Results Baseline Optimization – how do we best use the current freight network to
deliver optimized results? Identifies alternative routes, alternative modes, etc. in current network
Greenfield Scenario Analysis – what are the infrastructure elements to develop and where should they be located to optimize the network? Identifies new intermodal facilities, commodity consolidation points, rail and barge
terminals, roadways, rail lines, etc.

quèt ica
Advantages of the Methodology 12
Holistic analysis of the entire network
Vs. examining point solutions
Analyzing the true cost-saving opportunities to the producers
Vs. increasing network capacity that may help local businesses
Prioritizing investment based on ranking of ROI and other measurement criteria
Vs. justifying investment case by case
Development of reusable framework for future studies
Specific and actionable recommendations

quèt ica
Agenda 13
Introduction
Project Approach
Freight Flow Data Analysis
Logistics Cost Data
Questions & Answers

quèt ica
Freight Flow Data – FAF3 14
FAF3 dataset from Federal Highway Administration
Developed based on data from 2007 Commodity Flow Survey by a partnership between Census Bureau and The Bureau of Transportation Statistics
Includes base year (2007) and 2015 through 2040 estimated data
123 domestic regions, 8 foreign regions (Iowa is one zone)
7 modes
Includes estimated tonnage and domestics ton-miles
Includes 43 commodity codes
Code Description Code Description Code Description Code Description
01 Live animals/fish 12 Gravel 23 Chemical prods. 34 Machinery
02 Cereal grains 13 Nonmetallic minerals 24 Plastics/rubber 35 Electronics
03 Other ag prods. 14 Metallic ores 25 Logs 36 Motorized vehicles
04 Animal feed 15 Coal 26 Wood prods. 37 Transport equip.
05 Meat/seafood 16 Crude petroleum 27 Newsprint/paper 38 Precision instruments
06 Milled grain prods. 17 Gasoline 28 Paper articles 39 Furniture
07 Other foodstuffs 18 Fuel oils 29 Printed prods. 40 Misc. mfg. prods.
08 Alcoholic beverages 19 Coal-n.e.c. 30 Textiles/leather 41 Waste/scrap
09 Tobacco prods. 20 Basic chemicals 31 Nonmetal min. prods. 43 Mixed freight
10 Building stone 21 Pharmaceuticals 32 Base metals 99 Unknown
11 Natural sands 22 Fertilizers 33 Articles-base metal

quèt ica
Freight Flow Data - iTRAM 15
FAF3 freight flow data is disaggregated based on socio-economic data
43 commodity codes
3,143 counties to 3,143 counties O-D (Origin-Destination) pairs in U.S.
3,143 U.S. counties to 8 international regions
Canada, Mexico, Rest of Americas, Europe, Africa, SW & Central Asia, Eastern Asia, and SE Asia & Oceania
4 modes: truck, rail, water, multimodal

quèt ica
Freight Flow Data – Network Optimization 16
iTRAM freight flow data is disaggregated based on socio-economic data
Disaggregate commodities such as 03 – other agriculture products, 07 – other food stuff, 08 – alcoholic beverages, etc.
99 Iowa counties to 3,143 counties O-D pairs in U.S.
99 U.S. counties to top 25 export countries/regions
4 modes: truck, rail, water, multimodal

quèt ica
Iowa Commodity Flow by Tonnage 17

quèt ica
Iowa Commodity Flow 18

quèt ica
Truck Volume Distribution Over O-D Pairs 19

quèt ica
Rail Volume Distribution Over O-D Pairs 20

quèt ica
Water Volume Distribution Over O-D Pairs 21

quèt ica
Cereal Grains – Outbound – Truck – Original
22

quèt ica
Cereal Grains – Outbound – Truck - Filtered
23

quèt ica
Cereal Grains – Outbound – Rail – Original 24

quèt ica
Cereal Grains – Outbound – Rail - Filtered
25

quèt ica
Cereal Grains – Outbound – Water – Original
26

quèt ica
Cereal Grains – Outbound – Water – Filtered
27

quèt ica
Cereal Grains – Outbound – Multimodal – Original
28

quèt ica
Cereal Grains – Outbound – Multimodal – Filtered
29

quèt ica
Cereal Grains – Inbound – Truck – Original 30

quèt ica
Cereal Grains – Inbound – Truck – Filtered
31

quèt ica
Cereal Grains – Inbound – Rail – Original 32

quèt ica
Cereal Grains – Inbound – Rail – Filtered
33

quèt ica
Agenda 34
Introduction
Project Approach
Freight Flow Data Analysis
Logistics Cost Data
Questions & Answers
quèt ica
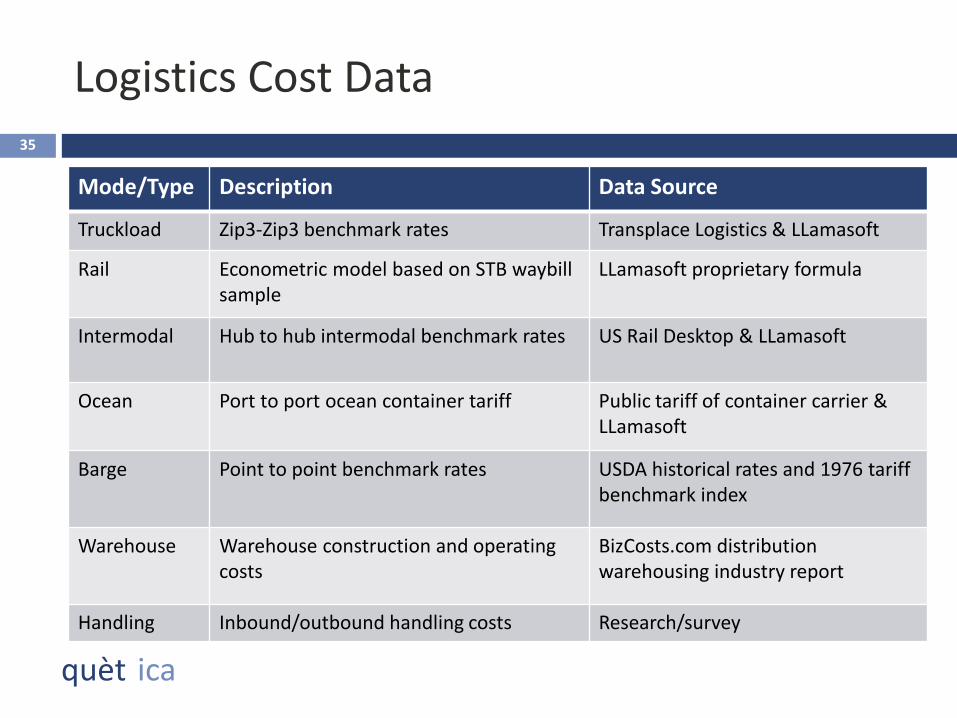
Logistics Cost Data 35
Mode/Type Description Data Source
Truckload Zip3-Zip3 benchmark rates Transplace Logistics & LLamasoft
Rail Econometric model based on STB waybill sample
LLamasoft proprietary formula
Intermodal Hub to hub intermodal benchmark rates US Rail Desktop & LLamasoft
Ocean Port to port ocean container tariff Public tariff of container carrier & LLamasoft
Barge Point to point benchmark rates USDA historical rates and 1976 tariff benchmark index
Warehouse Warehouse construction and operating costs
BizCosts.com distribution warehousing industry report
Handling Inbound/outbound handling costs Research/survey

quèt ica
36
Questions?