Iowa Business Growth Company
48
Iowa Business Growth Company 5409 NW 88th Street Johnston, Iowa 50161 515-223-4511 [email protected] m
-
Upload
community-development-society -
Category
Government & Nonprofit
-
view
38 -
download
0
Transcript of Iowa Business Growth Company

Iowa Business Growth Company
5409 NW 88th Street Johnston, Iowa 50161 515-223-4511 [email protected]
Who/What is Iowa Business Growth Company???
A For-Profit, Certified Development Company est. 1981
Market, Package and Service the SBA 504 Loan Program
Outstanding portfolio - $108.4 million
304 outstanding loans
Territory is Iowa
Market, Structure and Service New Markets Tax Credit projects
$245 million in allocations to date
18 Projects
Exclusive Administrator of the Wellmark Small Business Loan
$5 million
2

New Markets Tax Credits

Program Overview
Bringing capital to communities that have had inadequate access
to capital
And/or

Program Overview
Designed to compensate Investors for perceived risk of investing in Low-
income communities

6

Project Big Bird
7
Impacts: • 34.2% poverty rate • Unemployment 1.79 times national average • Median income 50.7% of area median income • Economic Development Hot Zone • Project cost: $10 million • 320 direct jobs • NMTC allocation: $10 million

8

Pinnacle Foods
9
Impacts: • 16.7% poverty rate • Unemployment 1.29 times national average • Median income 74% of area median income • Rural • Project cost: $40 million • 65 direct jobs • NMTC allocation: $10 million • Additional Community Benefit: $175,000

10
11
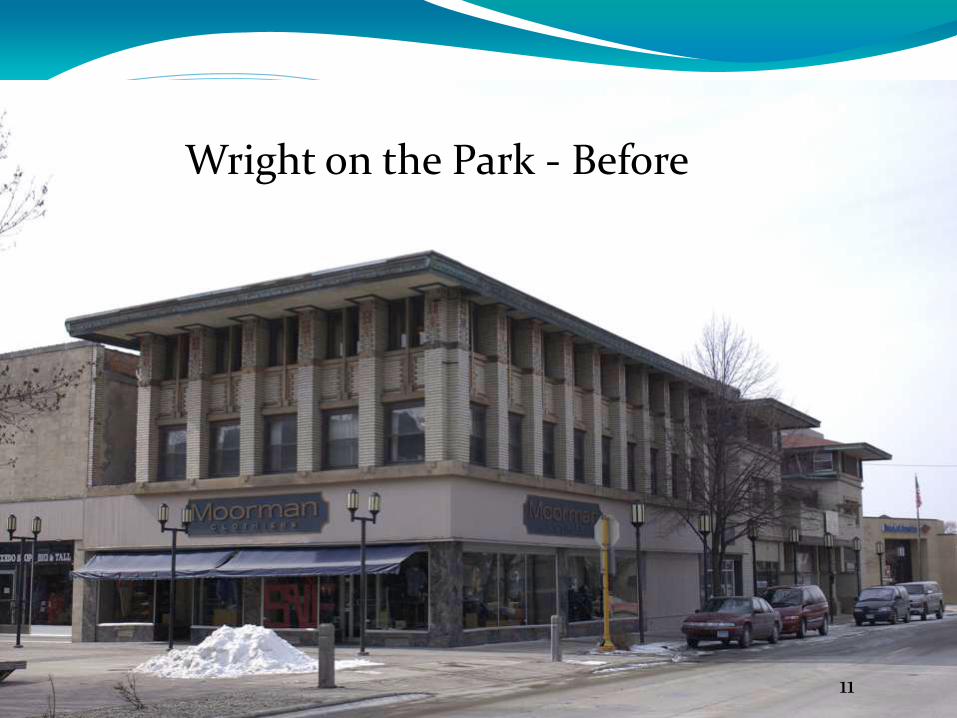
Wright on the Park - Before

12
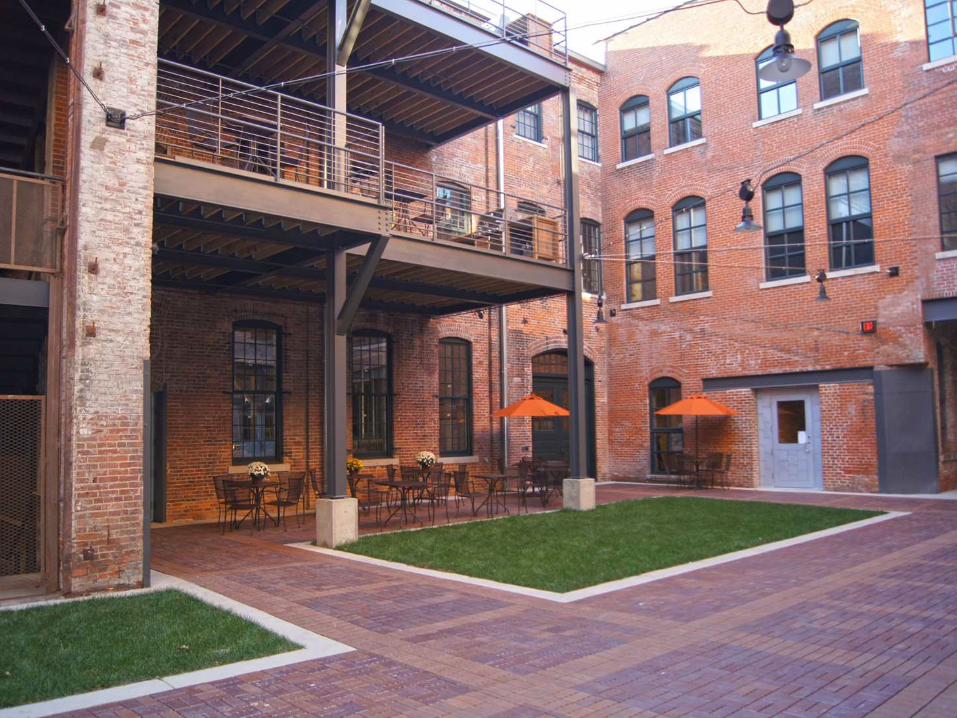
Wright on the Park - After

13

14

Wright on the Park, Mason City
Renovation of former bank building and hotel designed by Frank Lloyd Wright. Will be used as a boutique hotel, restaurant, and conference center.
Project size: $18.9 million
2008 ICD NMTC Allocation used: $10 million
Investor: US Bank
Project Construction
Direct Jobs 11 25
$1.47 million of the benefit will go to a Mason City Foundation for support of future low income Mason City area benefit.
$282,000 to the Mason City Foundation for The Music Man Square.
$50,000 to help create the “River City Sculptures on Parade” public art program.
15

16
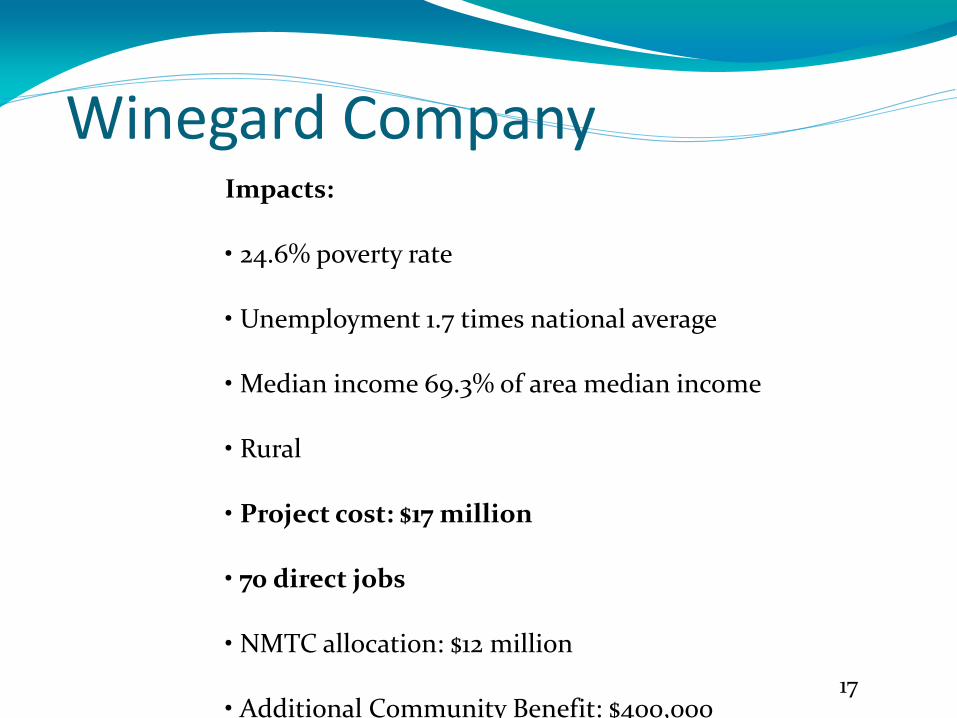
Winegard Company
17
Impacts: • 24.6% poverty rate • Unemployment 1.7 times national average • Median income 69.3% of area median income • Rural • Project cost: $17 million • 70 direct jobs • NMTC allocation: $12 million • Additional Community Benefit: $400,000
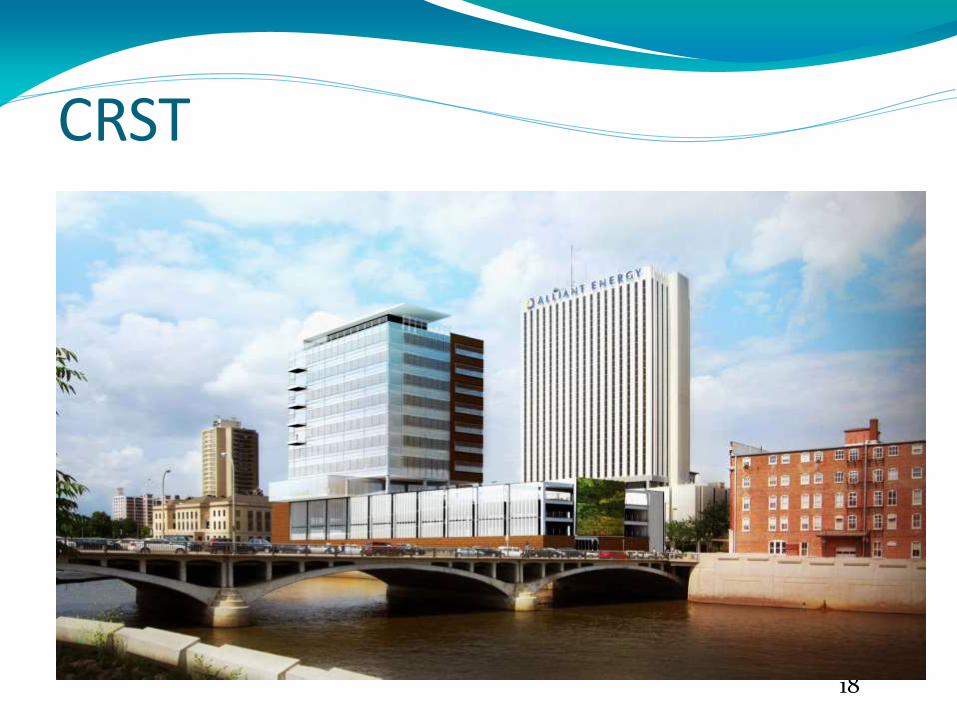
CRST
18
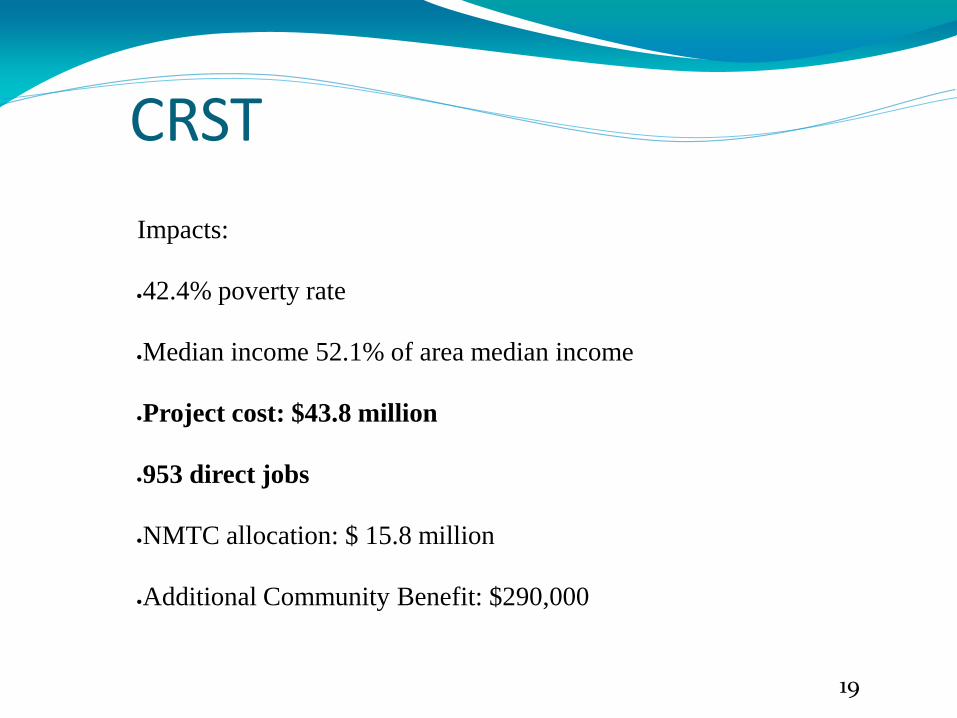
CRST
19
Impacts:
42.4% poverty rate
Median income 52.1% of area median income
Project cost: $43.8 million
953 direct jobs
NMTC allocation: $ 15.8 million
Additional Community Benefit: $290,000

Dubuque “Pre-NMTCs”
20

21
22

23

24

25

26

27

Dubuque an example of a
“New Market” Community
28
29

30

31

32
33

34

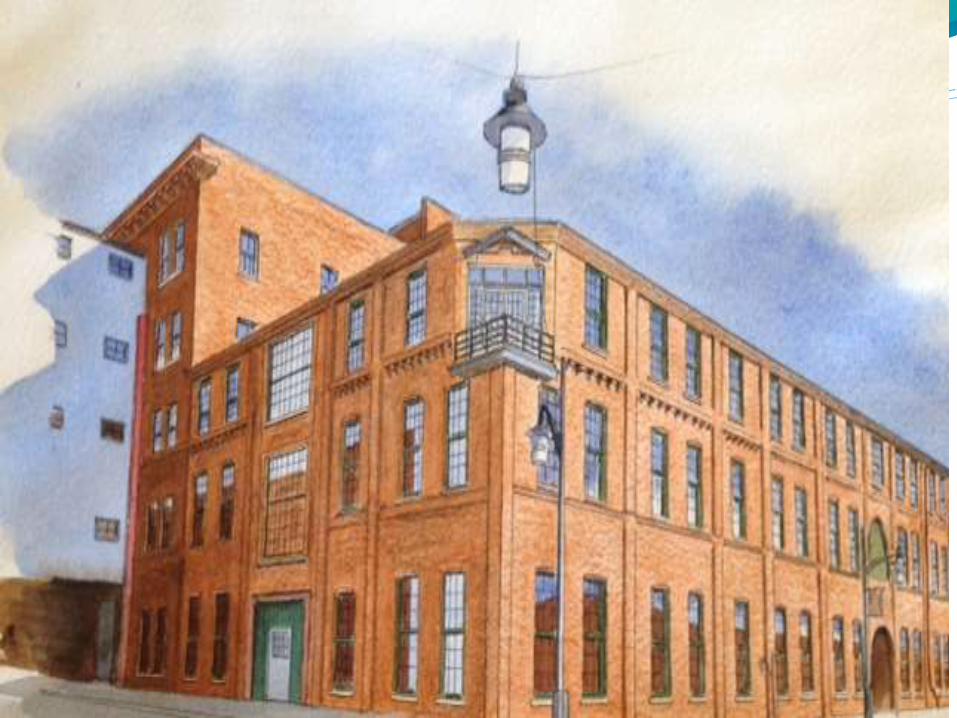
Roshek Building Redevelopment in Dubuque
35

36

37

Impacts:
38
• 24.9% poverty rate • Unemployment 1.52 times national average • Median income 53.3% of area median income • Economic Development Hot Zone • Project cost: $38.9 million • 1,300 direct jobs • NMTC allocation: $10 million • Additional Community Benefit: $589,000

Program Overview
$10 million dollar Project will produce 39% tax Credit
($10,000,000 * 39% = $3,900,000)
$3.9 million dollar tax credit converts into cash at 85¢
($3,900,000 * .85¢ = $3,315,000)
Transaction costs vary but typically can reach $400,000
($3,315,000 - $400,000 = $2,915,000)
Economic Benefit = $2,915,000 39

Program Overview
$30 million dollar Project will produce 39% tax Credit
($30,000,000 * 39% = $11,700,000)
$11.7 million dollar tax credit converts into cash at 85¢
($11,700,000 * .85¢ = $9,945,000)
Transaction costs vary but typically can reach $400,000
($9,945,000 - $800,000 = $9,145,000)
Economic Benefit = $9,145,000 40

Community Development Entities (CDEs): CDEs must:
Have a primary mission of serving low-income communities or low-income persons;
Maintain accountability to residents of low-income communities through their representation on any governing board or advisory board;
Must be certified by the CDFI Fund division of the Treasury.
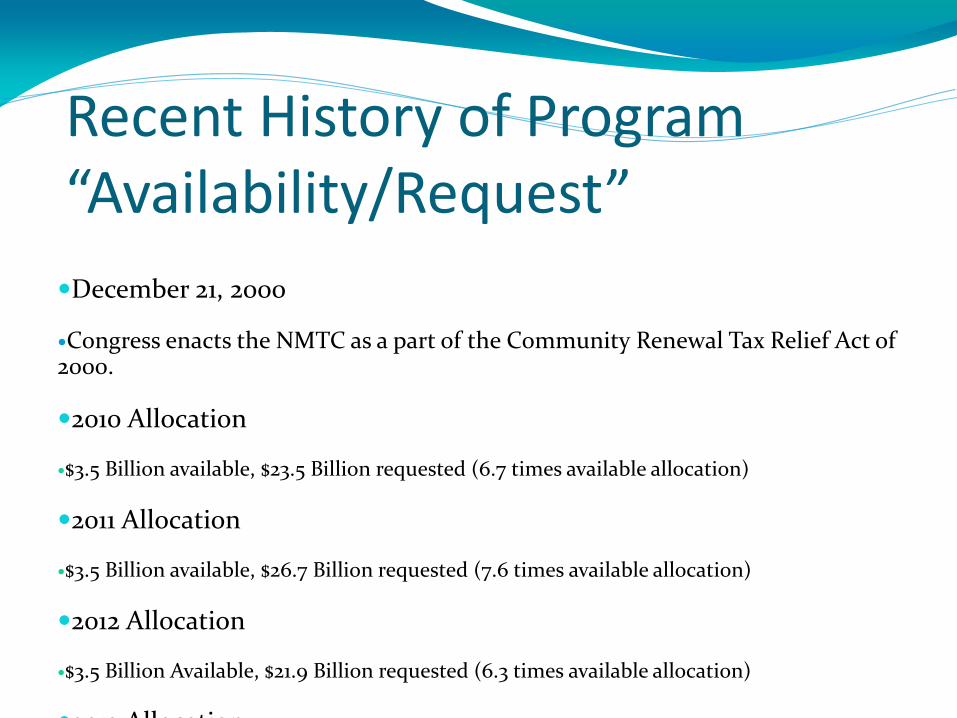
Recent History of Program “Availability/Request”
December 21, 2000
Congress enacts the NMTC as a part of the Community Renewal Tax Relief Act of 2000.
2010 Allocation
$3.5 Billion available, $23.5 Billion requested (6.7 times available allocation)
2011 Allocation
$3.5 Billion available, $26.7 Billion requested (7.6 times available allocation)
2012 Allocation
$3.5 Billion Available, $21.9 Billion requested (6.3 times available allocation)
2013 Allocation
$3.5 Billion Available, $25.9 Billion requested (7.4 times available allocation)

Characteristics of the Allocatees: 2006
$4.1 Billion available
254 CDEs applied – 63 awarded allocation (24.8%)
Average Award was $65 million
2008
$3.5 Billion available
239 CDEs applied – 70 awarded allocation (29.3%)
Average Award was $50 million
2009
$5 Billion available
249 CDEs applied – 99 awarded allocation (39.8%)
Average Award was $50 million
2010
$3.5 Billion available
250 CDEs applied – 99 awarded allocation (39.6%)
Average Award was $35 million
2013
$3.5 Billion available
310 CDEs applied – 87 awarded allocation (28.1%)
Average Award was $40 million

Low Income Communities
Census tracts where:
Poverty rate exceeds 20% or
Median income is below 80% of the greater of:
Statewide median income or
Metropolitan area median income.

45
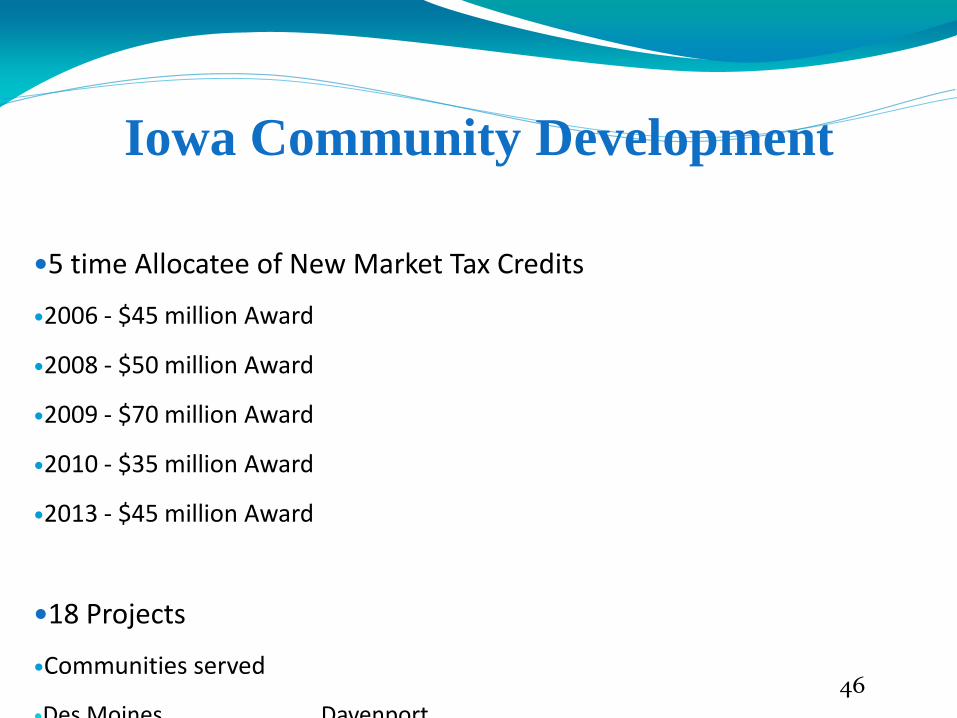
Iowa Community Development
5 time Allocatee of New Market Tax Credits
2006 - $45 million Award
2008 - $50 million Award
2009 - $70 million Award
2010 - $35 million Award
2013 - $45 million Award
18 Projects
Communities served
Des Moines Davenport
Fairfield Sioux City
Dubuque Mason City
Burlington Corwith
Marshalltown Cedar Rapids
Fort Madison Harlan
Ames
46

Iowa Community Development -Status of Allocations
47

Iowa
Business
Growth Company
Thank you!
48


![First Solar, Inc. - d18rn0p25nwr6d.cloudfront.net · Smaller reporting company [ ] Emerging growth company [ ] If an emerging growth company, indicate by check mark if the registrant](https://static.fdocuments.in/doc/165x107/5e135648216a9115bc609665/first-solar-inc-smaller-reporting-company-emerging-growth-company-if.jpg)