IOT Predictive Maintenance: Building Predictive … Predictive Vibration Analysis Models Modeling...
22
IOT Predictive Maintenance: Building Predictive Vibration Analysis Models Rick R. Durham Watson-IoT PMQ Data Scientist 6/19/2017
Transcript of IOT Predictive Maintenance: Building Predictive … Predictive Vibration Analysis Models Modeling...
IOT Predictive Maintenance: Building Predictive Vibration Analysis Models
Rick R. DurhamWatson-IoT PMQ Data Scientist 6/19/2017
2
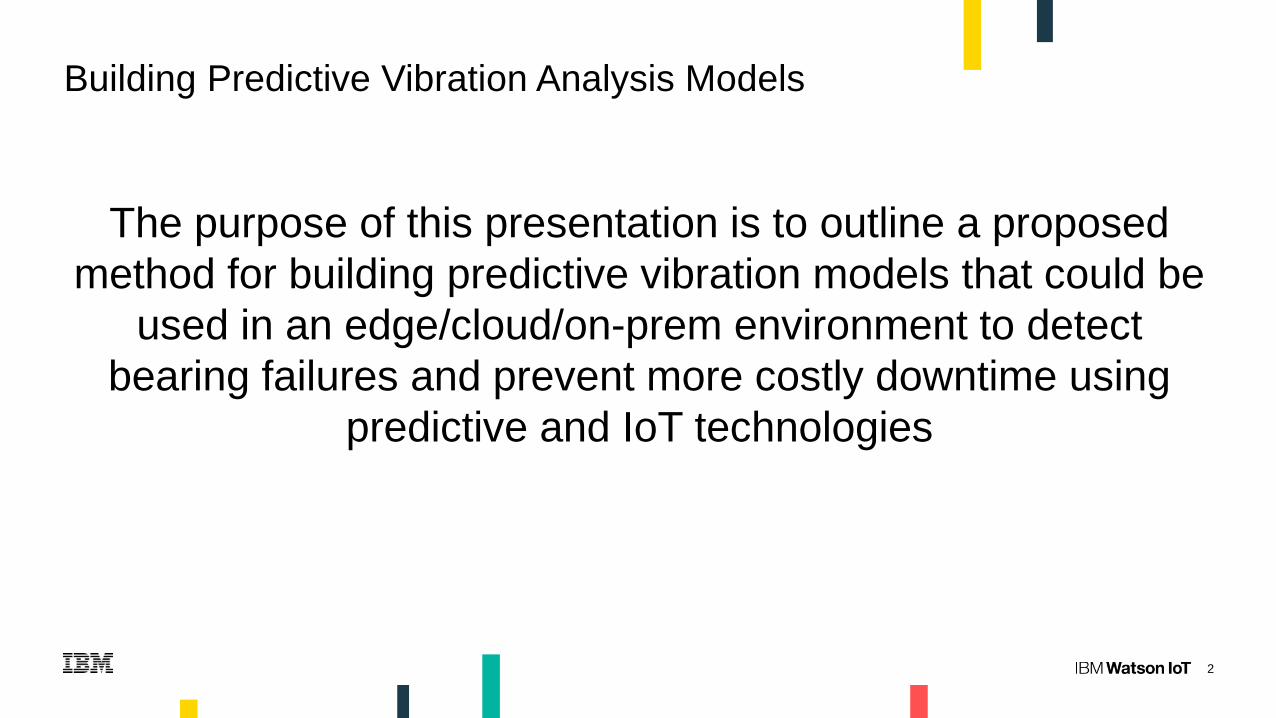
The purpose of this presentation is to outline a proposed method for building predictive vibration models that could be
used in an edge/cloud/on-prem environment to detect bearing failures and prevent more costly downtime using
predictive and IoT technologies
Building Predictive Vibration Analysis Models
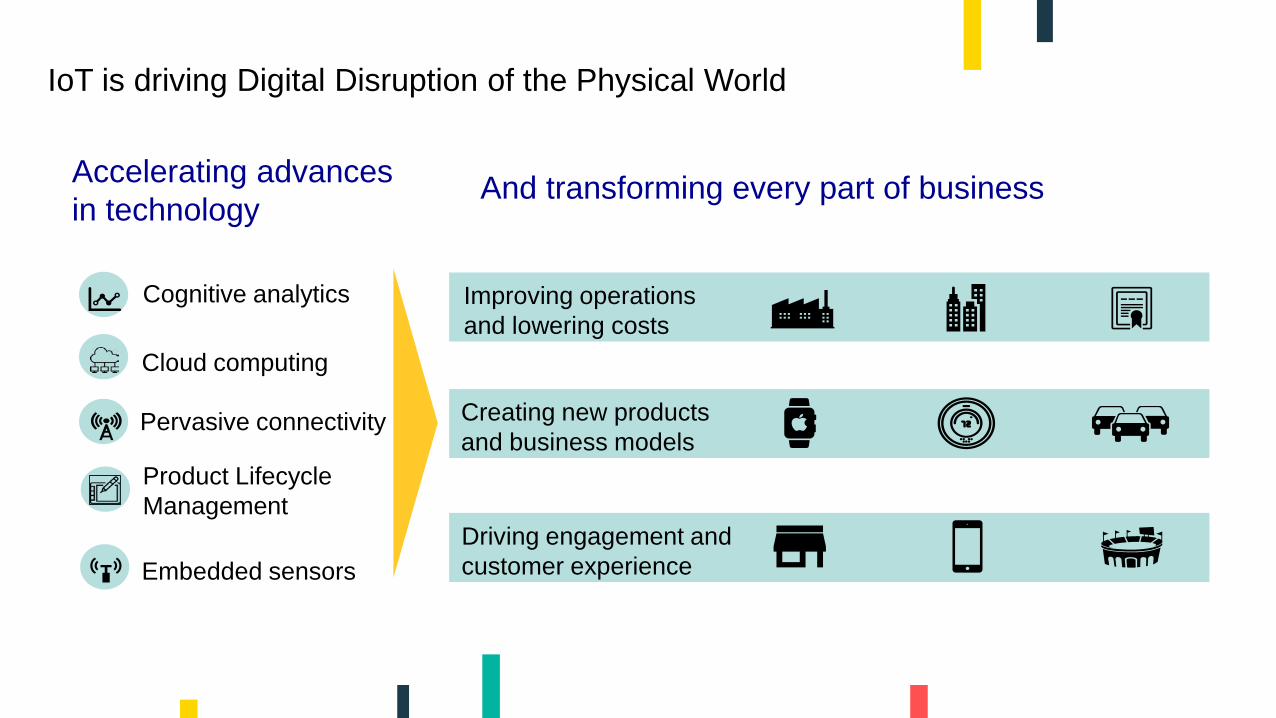
IoT is driving Digital Disruption of the Physical World
Accelerating advances in technology
And transforming every part of business
Cognitive analytics
Creating new products and business models
Improving operations and lowering costs
Driving engagement and customer experience
Pervasive connectivity
Embedded sensors
Cloud computing
Product LifecycleManagement
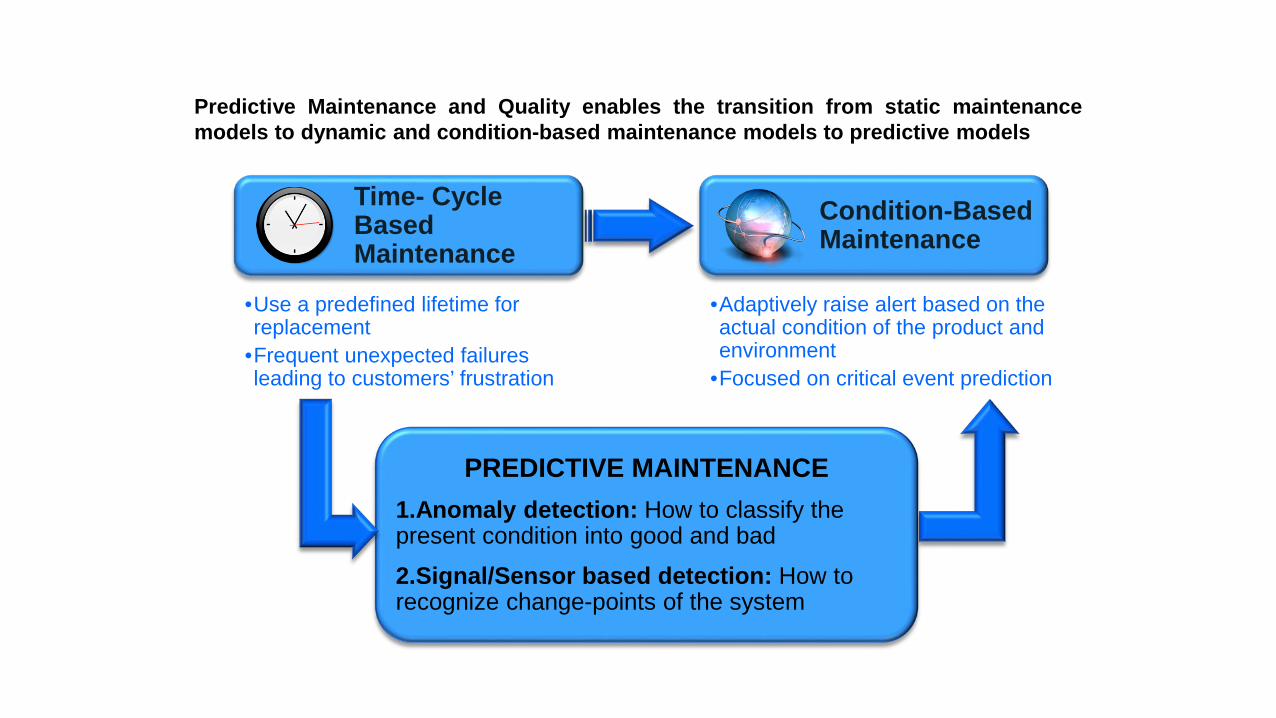
•Use a predefined lifetime for replacement
•Frequent unexpected failures leading to customers’ frustration
•Adaptively raise alert based on the actual condition of the product and environment
•Focused on critical event prediction
PREDICTIVE MAINTENANCE1.Anomaly detection: How to classify the present condition into good and bad 2.Signal/Sensor based detection: How to recognize change-points of the system
Predictive Maintenance and Quality enables the transition from static maintenancemodels to dynamic and condition-based maintenance models to predictive models
Time- Cycle Based Maintenance
Condition-Based Maintenance
4
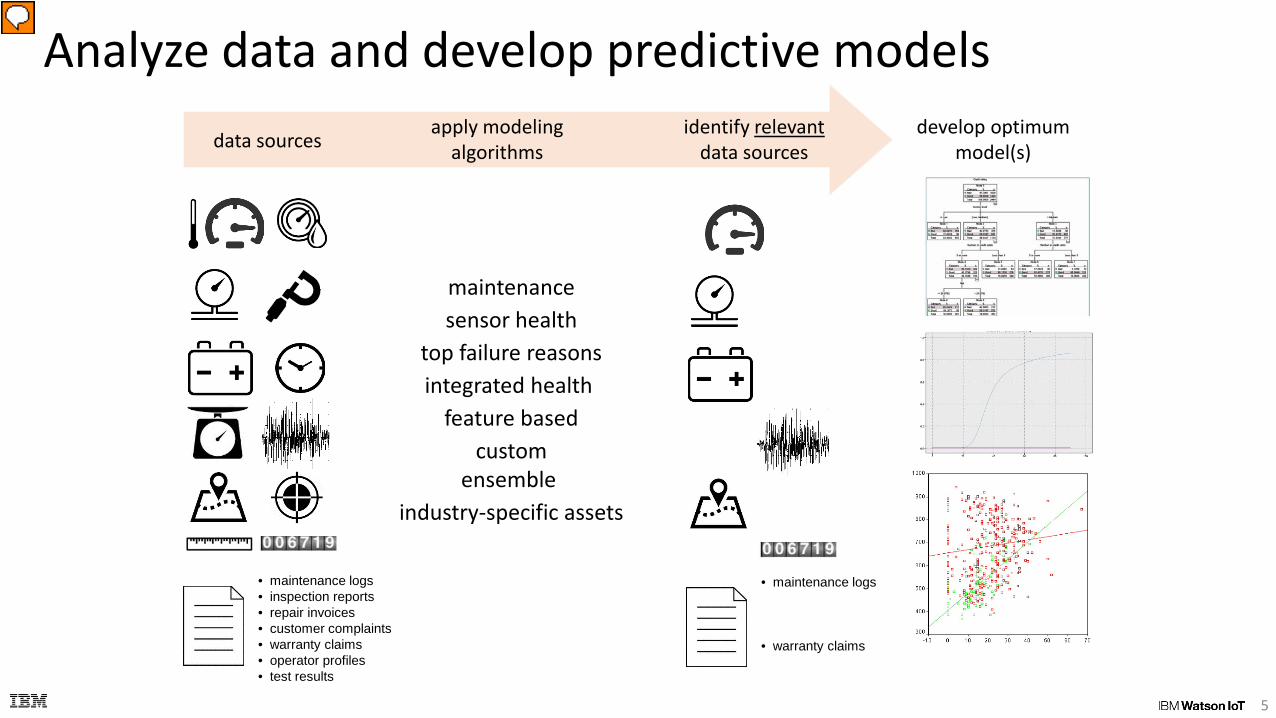
Analyze data and develop predictive models
5
data sources identify relevant
data sources develop optimum
model(s)apply modeling
algorithms
maintenancesensor health
top failure reasonsintegrated health
feature basedcustom
ensemble industry-specific assets
• maintenance logs• inspection reports• repair invoices• customer complaints• warranty claims• operator profiles• test results
• maintenance logs• inspection reports• repair invoices• customer complaints• warranty claims• operator profiles• test results
Presenter
Presentation Notes
With this slide we take the statistical and analytical concepts explained on the previous slide and go into greater detail regarding the modeling algorithms. The various models are described below. One of the key points to be made in this slide is that PM’s sophisticated statistical and analytical models help an organization determine which of many sources of asset performance data are the most relevant in describing asset performance and predicting failure. In most cases by applying the statistical and analytical models we determine that ONLY A SUBSET of asset performance data is required to develop an accurate model. In one customer example, they began be identifying over 4,000 potential factors that could describe asset performance, via analysis to determine which data best correlated to describe asset performance, reduced the number of factors to about 30. �See IBM Predictive Maintenance and Quality Version 2.5.0 Solution Guide Chapter 8 for details on predictive models. The Maintenance predictive model helps you optimize your Preventive Maintenance System. In the past, a scheduler would optimize a plant's Preventive Maintenance System (PMS) by carefully altering the days that were allotted for maintenance in the OEM's default schedule. The IBM Predictive Maintenance and Quality Maintenance predictive model helps you to optimize your maintenance schedule using predictive analysis. Often, in a new setup of PMQ sensors in the plant, even if sensor data has not gained optimal maturity for effective predictions, there may be enough data in the plant's maintenance system (Maximo/ SAP-PM etc.) to initiate a Predictive Maintenance regime. IBM PMQ's Maintenance Analytics can work on such maintenance work orders alone and does not depend on any sensor data. Therefore, the Maintenance model may help to expedite the ROI of any Predictive Analytics system before any useful sensor data is obtained. The Sensor Health predictive model analyzes an asset's sensor readings to help determine the likelihood that the asset will fail. If the likelihood of failure is high, you can schedule an urgent inspection of the machine. The Sensor Health model continuously monitors the health of a machine or an asset and predicts potential machine faults in real time. The model uses historical sensor data profile values stored in the KPI tables and keeps a running status to determine the current health of an asset. The Sensor Health model can also be used to predict the future health of an asset. The Top Failure Reason predictive model helps you identify the top failure predictors for a given asset in order of their importance. You can then further analyze the identified reasons or parameters to assist in a guided trail from cause or root cause analysis to its respective pattern discovery. This model is used to analyze and discover the top percentile and number of parameters which are influential in predicting a machine's failure (or optimal health) and their relative importance. The Integrated predictive model produces a predicted health score and days to maintenance for each asset or process at a site. The health score is used to determine an asset's performance. The health score determines how likely an asset is to fail. This health score model can continuously monitor machine or asset health and predict potential machine faults in real time. It uses historical defect and maintenance data, along with results of the other Analytics models, to determine the integrated health score and forecasted days to maintenance of an asset. The integrated model can also be used to predict the future health of an asset. The Feature-based predictive model produces a resource's predicted health score and optimal maintenance period, and recommends inspection or changes to maintenance schedules. It is an improvement to Sensor Analytics in Predictive Maintenance and Quality 2.0. Feature-Based Analytics analyzes historical failures and planned or unplanned (breakdowns) maintenance orders that are generated in IBM Maximo. It predicts a resource's health score and optimal maintenance period, and recommends inspection or changes to maintenance schedules. Using the aforementioned models that IBM provides with PMQ, clients can also modify and extend these to develop custom models to meet the specific needs of their business. Ensemble model combines senor, maintenance, custom and feature-based models into a single combined model. It allows customers to develop a model on an incremental basis. As they gain additional asset performance data they can continually improve model accuracy using ensemble modeling capability. IBM also offers industry-specific asset models for rotational equipment, turbo pumps, high-value assets, safety, turbines, energy optimization, substation transformers, distribution transformers, poles (electrical transmission) and power cables. IBM will continue to develop additional industry- and asset-specific models.
Bearing Vibration Modeling
6
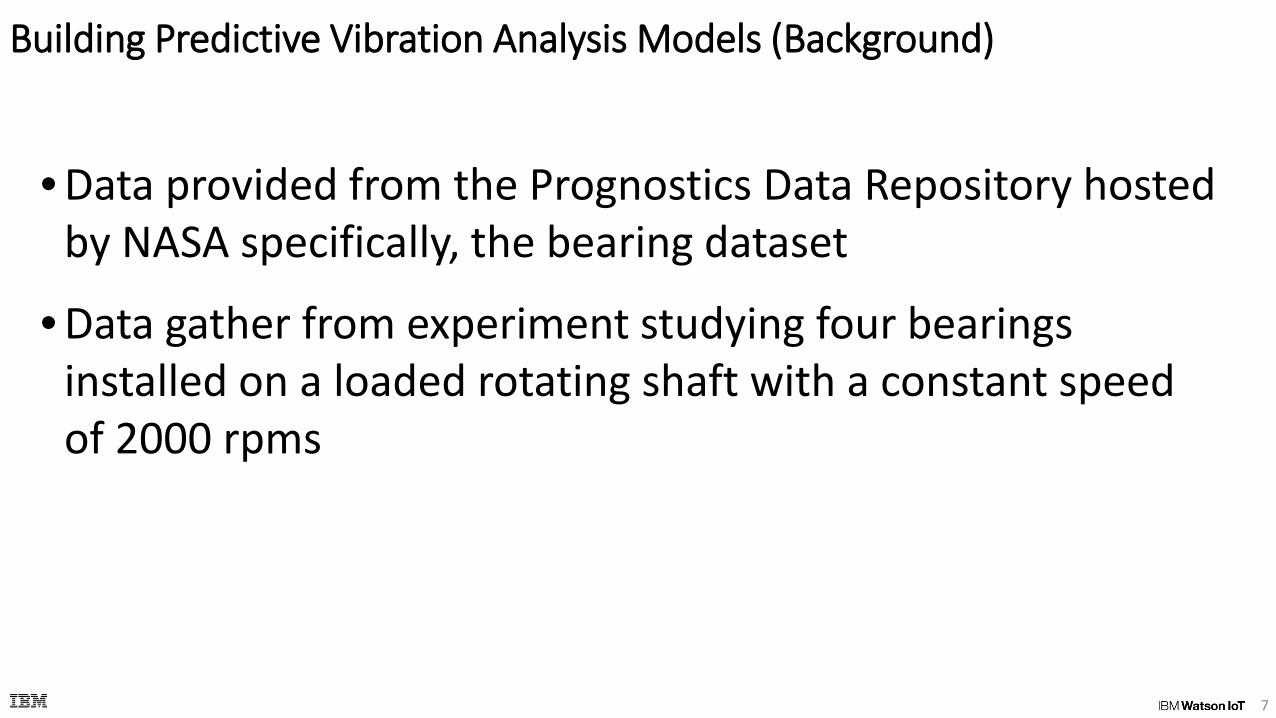
Building Predictive Vibration Analysis Models (Background)
• Data provided from the Prognostics Data Repository hosted by NASA specifically, the bearing dataset
• Data gather from experiment studying four bearings installed on a loaded rotating shaft with a constant speed of 2000 rpms
7
Building Predictive Vibration Analysis Models (Background)• Data Details:
• The analysis period range (10/22/2003 12:06 - 11/25/2003 23:39)
• Two sensors for each bearing (x, y axis)• Data recorded for a 1 second window every 5 or 10 minutes
• Sampling Rate 20 khz• Data was recorded in 2,156 files
• No engineering specifications for the bearing assemblies or the experimental setup was provided -therefore we could not calculate the expected FFT components i.e.
• Fundamental Train Frequency
• Ball-Spin Frequency• Ball-Pass Outer-Race
• Ball-Pass Inner-Race
8
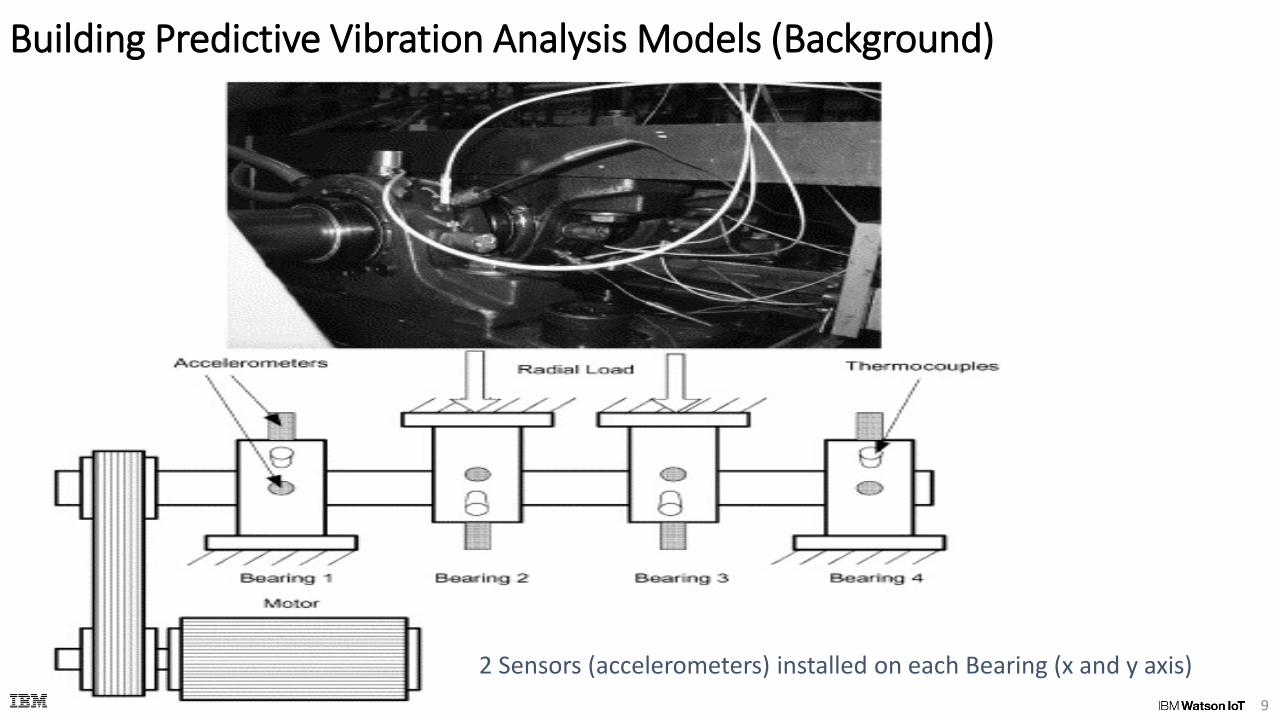
Building Predictive Vibration Analysis Models (Background)
9
2 Sensors (accelerometers) installed on each Bearing (x and y axis)
© 2012 IBM Corporation10
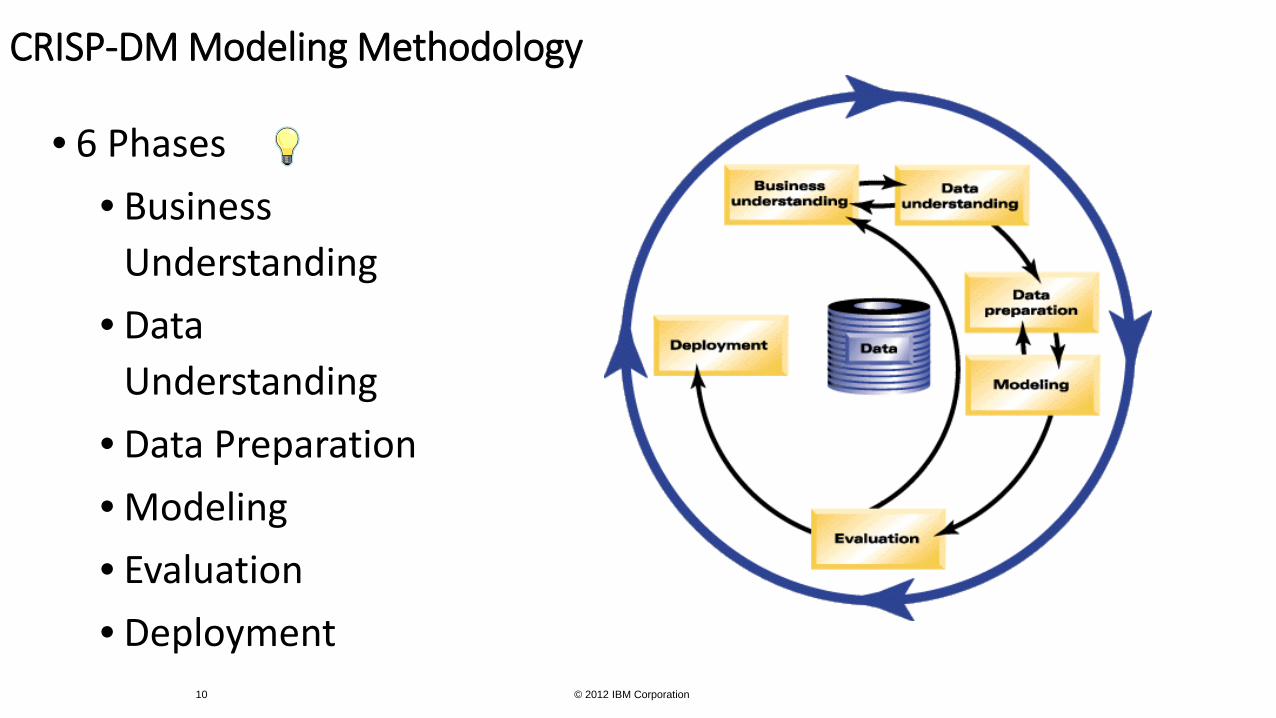
CRISP-DM Modeling Methodology
• 6 Phases• Business
Understanding• Data
Understanding• Data Preparation• Modeling• Evaluation• Deployment
Building Predictive Vibration Analysis ModelsModeling WorkFlow:• Business use case:
• Build a model to predict when a bearing is likely to fail based upon data gather from sensors (accelerometers) mounted on the bearing supports. This model could be used at the Edge level or in an IoT cloud based configuration
• Data Preparation-Data Visualization:
• Analyze the input Time Series data - Exploratory Data Analysis (EDA)• Iterate through each time series file containing accelerometer measurements and
calculate the top 5 highest “frequency spikes” for each file (1 second intervals). Store these new FFT representative features along with their respective time stamp in a new file for each bearing assembly. File in Excel *.csv format
• This creates a file for each bearing with 2156 records (four files total) for the interval
• Create visualizations to determine when failure events occur
11
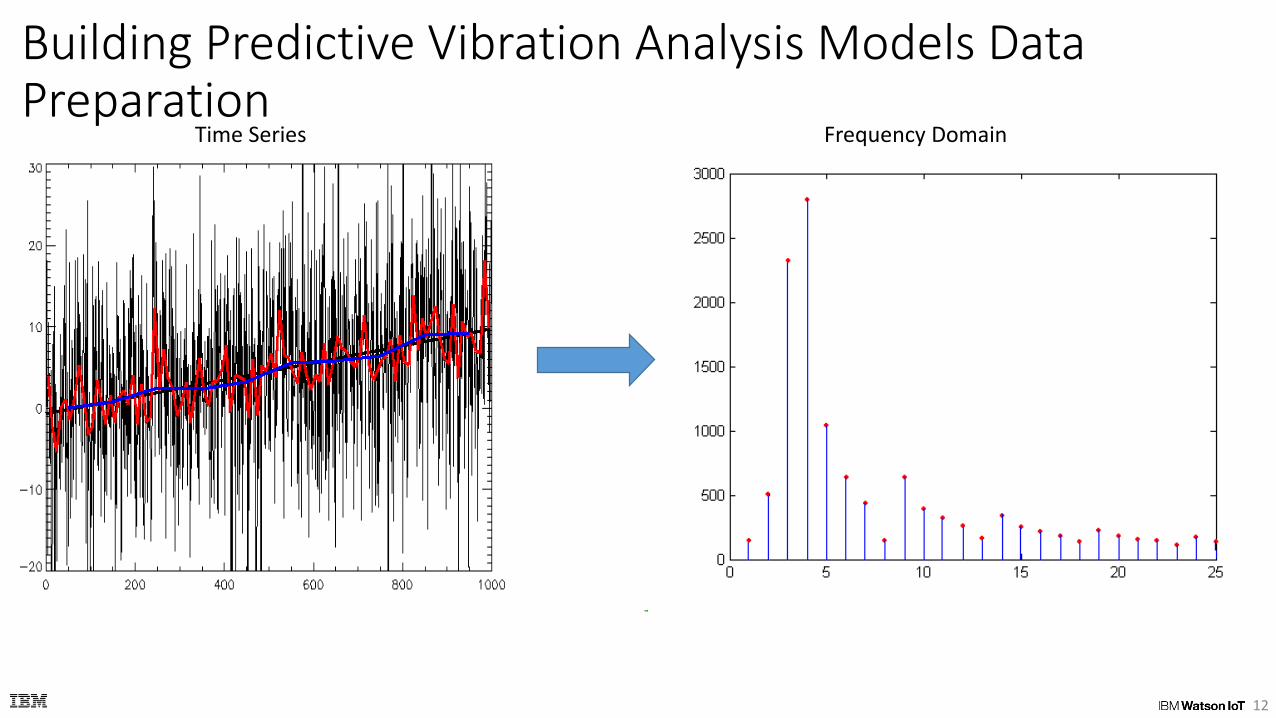
Building Predictive Vibration Analysis Models Data Preparation
12
Time Series Frequency Domain
:
• Modeling:
• Dataset built combined data from Sensor 1 (good data) and Sensor 4 (data with fault occurring) * Assumption is that these bearings are the same with the same engineering specifications and exhibiting the same levels of vibration at key frequencies
• The dataset contains 76.64 % of records with no fault and 23.36% with bearing failure pattern occurring
• The dataset was portioned into training/test sets with a 80/20 split
• A Logistic Regression model was fitted to the data
13
Building Predictive Vibration Analysis Models:Predictive Modeling WorkFlow
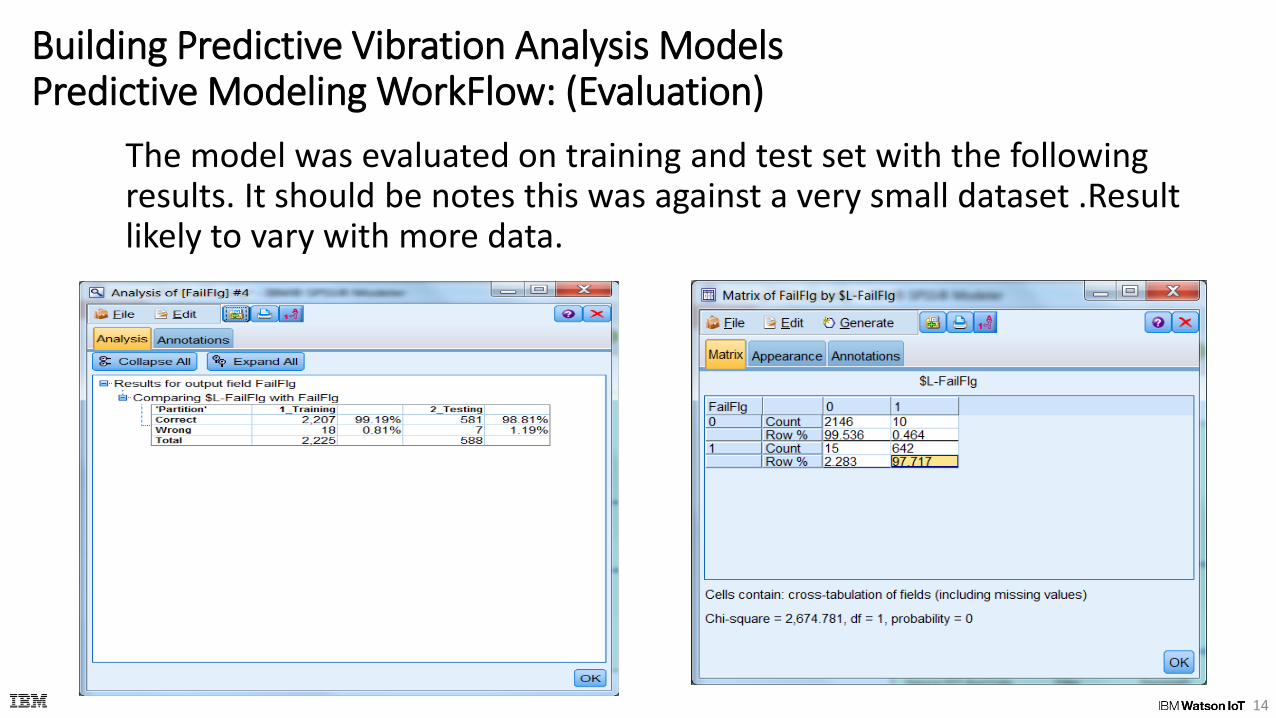
Building Predictive Vibration Analysis ModelsPredictive Modeling WorkFlow: (Evaluation)
The model was evaluated on training and test set with the following results. It should be notes this was against a very small dataset .Result likely to vary with more data.
14
PMQ Demo - Bearing Vibration Predictive Modeling WorkFlow:
• Deployment: • A scoring stream was created to score as set of bearing records
against the logistic model that was created in the modeling phase. Note: The dataset records for this scoring stream were previously converted from time series to FFT format this is a fairly trivial undertaking. In a production setting this processing would be added to the scoring stream.
• This scoring model could be used in a variety of deployment environments including:
• Edge Devices
• Cloud Based SaaS application
• On Prem operational systems
15
PMQ Demo - Bearing Vibration
Demo
16

PMQ Demo - Bearing Vibration
Q/A
17
18
predictive maintenance modeling?

Thank You
20
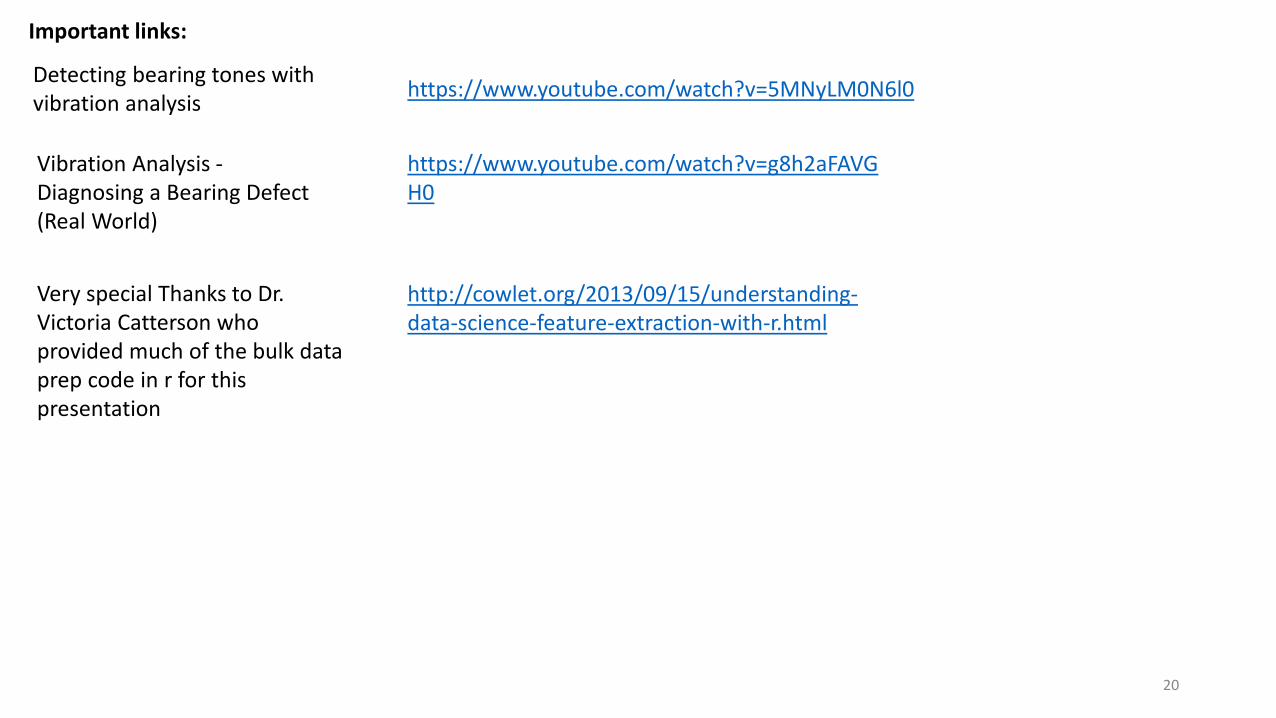
Important links:
https://www.youtube.com/watch?v=5MNyLM0N6l0
Very special Thanks to Dr. Victoria Catterson who provided much of the bulk data prep code in r for this presentation
http://cowlet.org/2013/09/15/understanding-data-science-feature-extraction-with-r.html
https://www.youtube.com/watch?v=g8h2aFAVGH0
Vibration Analysis -Diagnosing a Bearing Defect (Real World)
Detecting bearing tones with vibration analysis
IBM and Business Partner Internal Use Only
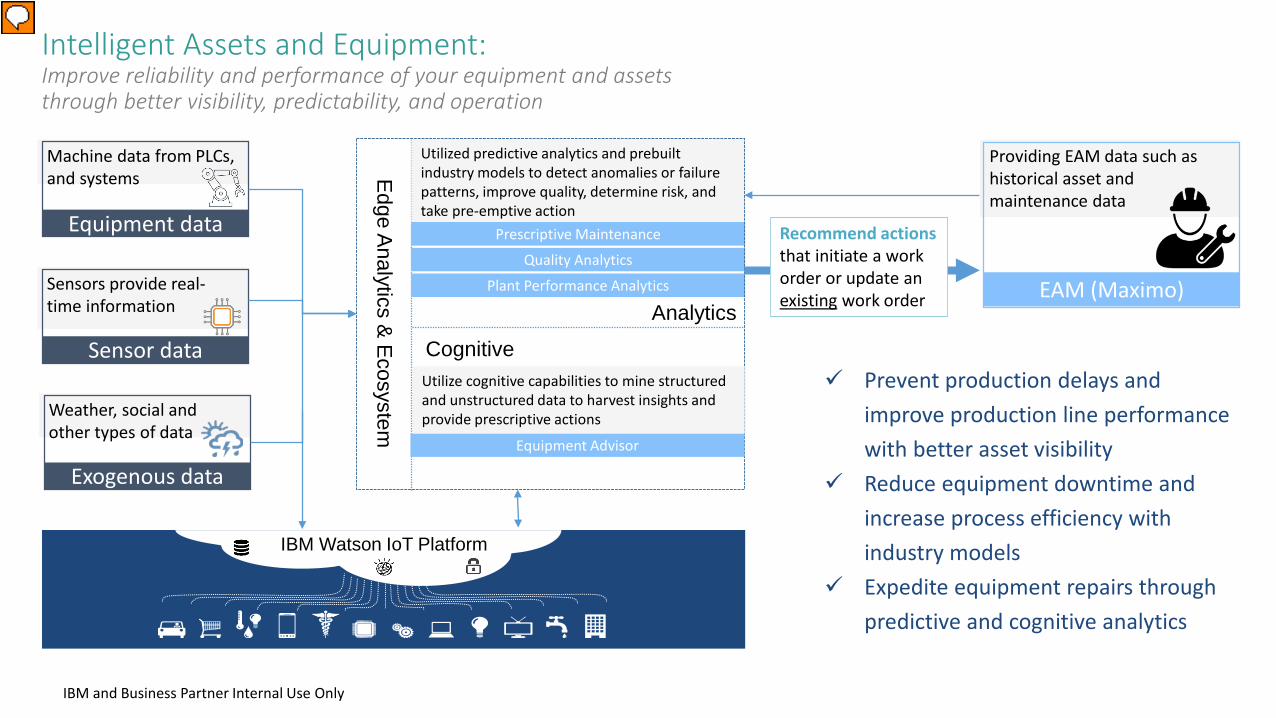
Intelligent Assets and Equipment:Improve reliability and performance of your equipment and assets through better visibility, predictability, and operation
Machine data from PLCs, and systems
Equipment data
Weather, social and other types of data
Exogenous data
Sensors provide real-time information
Sensor data
Edge Analytics & Ecosystem
Cognitive
Analytics
Utilized predictive analytics and prebuilt industry models to detect anomalies or failure patterns, improve quality, determine risk, and take pre-emptive action
Prescriptive Maintenance
Quality Analytics
Plant Performance Analytics
Prevent production delays and improve production line performance with better asset visibility
Reduce equipment downtime and increase process efficiency with industry models
Expedite equipment repairs through predictive and cognitive analytics
IBM Watson IoT Platform
Recommend actions that initiate a work order or update an existing work order
Providing EAM data such as historical asset and maintenance data
EAM (Maximo)
Equipment Advisor
Utilize cognitive capabilities to mine structured and unstructured data to harvest insights and provide prescriptive actions
Presenter
Presentation Notes
Intelligent Asset and Equipment focuses on making the equipment on your shop floor smarter, more reliable and performing more optimally so you can reduce downtime and increase performance. We have to ability to make sense of your shop floor equipment by connecting your equipment through our IoT platform and edge partners and ecosystem. Whether you have PLCs (programmable logic controls) or sensors or manufacturing gateways our IoT platform can help you bring that data together so that you can visualize the effectiveness of your equipment. Beyond just visualization, you can take advantage of our advanced analytics that can provide predictions based on specific use cases such as maintenance or quality. Our new Plant performance Analytics which will GA in October come preloaded with valuable industry models for automotive – specific to body and weld – that can help you jump start your analysis. To move beyond analytics, you can utilize our cognitive capabilities such as NLP or image and text analytics in advanced cognitive use cases such as Equipment advisor (where ingested text from manuals/logs can help suggest ways to remedy issues)
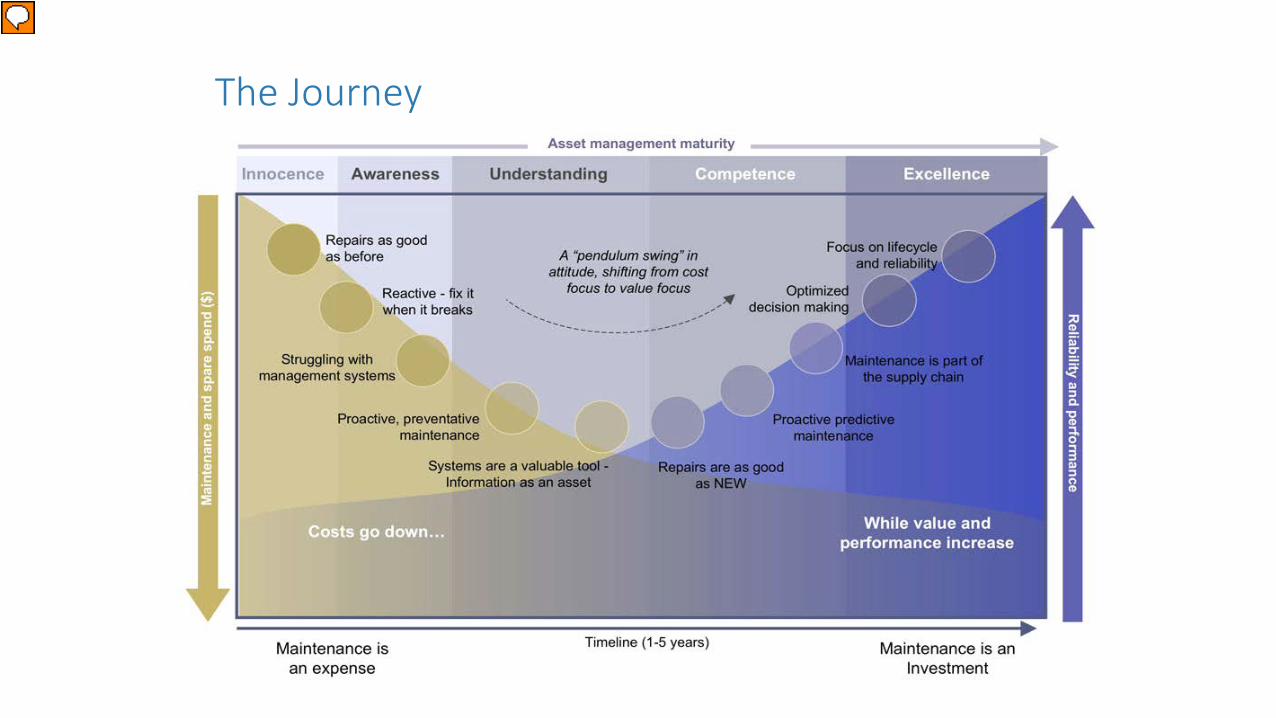
The Journey
Presenter
Presentation Notes
Asset Amnesia Speaker Guidelines: This slide show the typical path of any Asset Management organization working to become a more mature and effective organization. The path from Innocence to Excellence. It should be noted that deciding to move to Excellence is not always correct for every client or group One will note the maturity levels of this path are not evenly spaced. This is by design. If he maturity level is low and attention is paid quick improvements, some maturity levels can be obtained very early on in the process. One should note that following the path all the way to Excellence can take years…. Which can equate to time and money… It is an investment with strategic benefits in mind. The point is for any corporation, organization or group to set realistic goals when putting its asset management strategy together and deciding “where they want to go”..