Ionization and Fragmentation of Complex Molecules and Clusters452046/FULLTEXT01.pdf · Ionization...
168
Ionization and Fragmentation of Complex Molecules and Clusters
Transcript of Ionization and Fragmentation of Complex Molecules and Clusters452046/FULLTEXT01.pdf · Ionization...

Ionization and Fragmentation of Complex Molecules and Clusters


Ionization and Fragmentation ofComplex Molecules and Clusters
Biomolecules and Polycyclic Aromatic Hydrocarbons
Henrik A. B. Johansson

c© Henrik A. B. Johansson, Stockholm 2011
ISBN 978-91-7447-399-5
Printed in Sweden by Universitetsservice US-AB, Stockholm 2011
Distributor: Department of Physics, Stockholm University

To my Star-goddess


Abstract
This work deals with ionization and fragmentation of biomolecules and poly-cyclic aromatic hydrocarbon (PAH) molecules. They are studied in the gasphase both as isolated molecules and as weakly bound clusters. The purposeof the experimental and theoretical investigations are to elucidate charge andenergy transfer and related redistribution processes, as well as fragmentationbehaviors.
The first part of this thesis presents results from studies on biomolecularions, in particular nucleotides and peptides, which are primarily examinedin electron capture induced dissociation processes. These investigations arerelevant for the better understanding of radiation damage to DNA and pro-cesses involved in the sequencing of proteins. It is found that the immediateenvironment have a decisive influence on the fragmentation behaviors. Evap-oration of surrounding molecules protect the biomolecules, but their effect onthe electronic structure may also enhance or suppress different fragmentationchannels.
In the second part of the thesis, results from studies on PAH moleculesare presented. Experimentally, their properties are mainly probed through col-lisions with atomic ion projectiles having kilo-electronvolt kinetic energies.As a widespread pollutant on Earth, and as a family of abundant moleculesin space, PAHs are not only relevant from an environmental and health per-spective, but they are also important for the understanding of the universe.The present results relate to the stabilities of these molecules, both in isolatedform and in clusters, when heated or multiply ionized. It is found to be easierto remove several electrons from clusters of PAH molecules than from isolatedPAHs, and fission processes determine their ultimate stabilities. Heated low-charge state clusters of PAHs undergo long evaporation sequences once thesehave started. For isolated and heated PAHs, internal structural rearrangementsare demonstrated to be important in the fragmentation processes.
7


Sammanfattning
Denna avhandling handlar om jonisation och fragmentation av biomolekyleroch polycykliska aromatiska kolväten (PAH). Dessa komplexa system stud-eras i gasfas både som isolerade molekyler och som svagt bundna ansamlingarav molekyler, s.k. kluster. Syftet med de experimentella och teoretiska under-sökningarna är att klargöra hur laddning och energi överförs och fördelas,samt hur fragmenteringen går till.
I den första delen av avhandlingen presenteras resultat från studier avbiomolekylära joner, särskilt nukleotider och peptider, vilka främst utforskasgenom en teknik där dissociation induceras efter elektroninfångningfrån en neutral atom. Dessa undersökningar är relevanta för att bättreförstå strålningsrelaterade skador på DNA, samt de processer som ärinblandade vid sekvensering av proteiner. Det visar sig att den omedelbaraomgivningen har stor påverkan på hur molekylerna fragmenterar. Evaporationav lösningsmolekyler skyddar biomolekylerna, men effekten på denelektroniska strukturen kan också både förstärka och undertrycka de olikafragmentationskanalerna.
Den andra delen av avhandlingen presenterar resultat från studier avPAH. Deras egenskaper studeras experimentellt genom kollisioner medjonprojektiler som har kinetiska energier av storleksordningen kiloelektron-volt. Som ett föroreningsämne på jorden, och som en viktig typmolekyl irymden, är PAH inte bara viktiga ur ett miljö- och hälsoperspektiv, utanockså för förståelsen av universum. Resultaten som presenteras här relaterartill stabiliteten av dessa molekyler, både i isolerad form och i kluster, när deblir uppvärmda eller multipeljoniserade. Det visar sig att det är lättare attta bort flera elektroner från kluster av PAH än från isolerade PAH, och attfissionsprocesser bestämmer deras ultimata stabilitet. Uppvärmda kluster avPAH visar sig också genomgå långa evaporationssekvenser när dessa väl harstartat. För isolerade och uppvärmda PAH är interna strukturella förändringaren viktig del av fragmentationsprocesserna.
9


List of Papers
This thesis is based on the following papers, which are referred to in the textby their Roman numerals.
I Electron-Capture-Induced Dissociation of Microsolvated Di-and Tripeptide Monocations: Elucidation of FragmentationChannels from Measurements of Negative IonsH. Zettergren, L. Adoui, V. Bernigaud, H. Cederquist, N. Haag,A. I. S. Holm, B. A. Hauber, P. Hvelplund, H. Johansson,U. Kadhane, M. K. Larsen, B. Liu, B. Manil, S. BrøndstedNielsen, S. Panja, J. Rangama, P. Reinhed, H. T. Schmidt, andK. StøchkelChemPhysChem 10, 1619-1623 (2009)
II Electron capture induced dissociation of nucleotide anions inwater nanodropletsB. Liu, N. Haag, H. Johansson, H. T. Schmidt, H. Cederquist,S. Brøndsted Nielsen, H. Zettergren, P. Hvelplund, B. Manil, andB. A. HuberJournal of Chemical Physics 128, 075102 (2008)
III Collisions with biomolecules embedded in small waterclustersN. Haag, B. Liu, S. Brøndsted Nielsen, H. Zettergren, P.Hvelplund, B. Manil, B. A. Huber, H. A. B. Johansson, H. T.Schmidt, and H. CederquistJournal of Physics: Conference Series 194, 012053 (2009)
IV Dissociation and multiple ionization energies for fivepolycyclic aromatic hydrocarbon moleculesA. I. S. Holm, H. A. B. Johansson, H. Cederquist, and H.ZettergrenJournal of Chemical Physics 134, 044301 (2011)
11

V Multiple ionization and fragmentation of isolated pyrene andcoronene molecules in collision with ionsA. Ławicki, A. I. S. Holm, P. Rousseau, M. Capron, R.Maisonny, S. Maclot, F. Seitz, H. A. B. Johansson, S. Rosén, H.T. Schmidt, H. Zettergren, B. Manil, L. Adoui, H. Cederquist,and B. A. HuberPhysical Review A 83, 022704 (2011)
VI Unimolecular dissociation of anthracene and acridinecations: The importance of isomerization barriers for theC2H2 loss and HCN loss channelsH. A. B. Johansson, H. Zettergren, A. I. S. Holm, N. Haag, S.Brøndsted Nielsen, J. A. Wyer, M.-B. S. Kirketerp, K. Støchkel,P. Hvelplund, H. T. Schmidt, and H. CederquistJournal of Chemical Physics 135, 084304 (2011)
VII Ions Colliding with Cold Polycyclic Aromatic HydrocarbonClustersA. I. S. Holm, H. Zettergren, H. A. B. Johansson, F. Seitz, S.Rosén, H. T. Schmidt, A. Ławicki, J. Rangama, P. Rousseau,M. Capron, R. Maisonny, L. Adoui, A. Méry, B. Manil, B. A.Huber, and H. CederquistPhysical Review Letters 105, 213401 (2010)
VIII Ionization and fragmentation of polycyclic aromatichydrocarbon clusters in collisions with keV ionsH. A. B. Johansson, H. Zettergren, A. I. S. Holm, F. Seitz, H. T.Schmidt, P. Rousseau, A. Ławicki, M. Capron, A. Domaracka,E. Lattouf, S. Maclot, R. Maisonny, B. Manil, J.-Y. Chesnel, L.Adoui, B. A. Huber, and H. CederquistPhysical Review A 84, 043201 (2011)
Reprints were made with permission from the publishers.
Articles not included in this thesis are listed in appendix C.
12

The Author’s Contribution
The work presented in this thesis is the result of collaborative efforts by re-search groups at Stockholm University, Aarhus University, and the CIMAPlaboratory in Caen, France. Papers I-III, which concern biomolecules, werecarried out at Aarhus University. Here I actively participated in the executionof the experiment on the dipeptide GA (paper I), as well as in associated dis-cussions. I also carried out part of the quantum chemical calculations on thestructures of the molecular complexes. For papers II and III on the AMP an-ions I mainly contributed to the data evaluation and to the discussions of theresults. I also implemented and refined my own version of the evaporationmodel used to interpret the experimental observations, and the results frommy version of the model are included in chapter 5 of this thesis.
My contributions to the work on PAH molecules (papers IV-VIII) is moreextensive. Paper IV is a theoretical study to which I contributed with quantumchemical calculations and I also participated in the manuscript work and as-sociated discussions. Papers V, VII and VIII are based on experiments carriedout at the CIMAP laboratory. I participated actively in all these experiments,and for paper VII I aided in the data analysis, manuscript work, as well asin related discussions. Paper VIII was written almost entirely by me, and Iperformed most of the data analysis. The PAH cluster evaporation model re-ported in paper VIII paper was developed and implemented by me, in closecollaboration with mainly H. Zettergren, and it is a modified version of theone I made for the hydrated AMP anions. For the work reported in paper VI Iparticipated very actively in the execution of the experiment, I performed allthe calculations on the unimolecular reaction pathways, and I wrote the paper.
13


Contents
1 Introduction . . . . . . . . . . . . . . . . . . . . . . . . . . . . . . . . . . . . . . . . . . 172 Using Density Functional Theory to Interpret the Present Experimental
Results – a Brief Introduction . . . . . . . . . . . . . . . . . . . . . . . . . . . . . 23
Part I: Biomolecules3 Biomolecules . . . . . . . . . . . . . . . . . . . . . . . . . . . . . . . . . . . . . . . . . 29
3.1 Peptides . . . . . . . . . . . . . . . . . . . . . . . . . . . . . . . . . . . . . . . . . . . . . . . 293.1.1 Dissociation Methods . . . . . . . . . . . . . . . . . . . . . . . . . . . . . . . . . . . 323.1.2 Probing Peptide Electron Capture Induced Dissociation Mechanisms by
Means of Complexation . . . . . . . . . . . . . . . . . . . . . . . . . . . . . . . . . 353.2 Nucleotides . . . . . . . . . . . . . . . . . . . . . . . . . . . . . . . . . . . . . . . . . . . . . 35
3.2.1 Probing DNA Radiation Damage Due To Secondary Electrons . . . . . . . 374 Experimental Techniques I . . . . . . . . . . . . . . . . . . . . . . . . . . . . . . . . 39
4.1 Electrospray Ionization (ESI) . . . . . . . . . . . . . . . . . . . . . . . . . . . . . . . . . . 394.2 The Tandem Mass Spectrometer Separator 1 (SEP1) Setup . . . . . . . . . . . . 42
4.2.1 Procedure for Experiments on Microsolvated [GA+H]+ . . . . . . . . . . . . 434.2.2 Procedure for Experiments on Hydrated AMP− . . . . . . . . . . . . . . . . . 43
5 Results and Discussion I . . . . . . . . . . . . . . . . . . . . . . . . . . . . . . . . . 455.1 Probing the Mechanism Behind N–Cα Bond Cleavage by Means of Complex-
ation . . . . . . . . . . . . . . . . . . . . . . . . . . . . . . . . . . . . . . . . . . . . . . . . . . 455.2 Dissociation of Hydrated AMP Anions . . . . . . . . . . . . . . . . . . . . . . . . . . . 51
5.2.1 Collision Induced Dissociation Results . . . . . . . . . . . . . . . . . . . . . . . 535.2.2 Electron Capture Induced Dissociation Results . . . . . . . . . . . . . . . . . 535.2.3 An Evaporation Model for Neutral Water Molecule Emission from
AMP−/[AMP-H]2− . . . . . . . . . . . . . . . . . . . . . . . . . . . . . . . . . . . . . 545.2.4 Discussion of AMP Results . . . . . . . . . . . . . . . . . . . . . . . . . . . . . . . 59
6 Summary of Part I . . . . . . . . . . . . . . . . . . . . . . . . . . . . . . . . . . . . . . 63
Part II: Polycyclic Aromatic Hydrocarbons7 Polycyclic Aromatic Hydrocarbons . . . . . . . . . . . . . . . . . . . . . . . . . . 67
7.1 Aromaticity and the Structure of Benzenoid Aromatic Compounds . . . . . . . . 677.2 Different Types of Aromatic Molecules . . . . . . . . . . . . . . . . . . . . . . . . . . . 717.3 Dissociation Pathways for PAHs . . . . . . . . . . . . . . . . . . . . . . . . . . . . . . . 737.4 Ionization of PAHs . . . . . . . . . . . . . . . . . . . . . . . . . . . . . . . . . . . . . . . . . 747.5 Clusters of PAH Molecules . . . . . . . . . . . . . . . . . . . . . . . . . . . . . . . . . . . 75

8 Experimental Techniques II . . . . . . . . . . . . . . . . . . . . . . . . . . . . . . . 798.1 Colliding keV Energy Projectile Ions with Neutral Targets . . . . . . . . . . . . . . 798.2 Ion-Induced Ionization and Fragmentation with Time-of-Flight Mass Spec-
trometry . . . . . . . . . . . . . . . . . . . . . . . . . . . . . . . . . . . . . . . . . . . . . . . . 808.2.1 Electron Cyclotron Resonance Ion Source . . . . . . . . . . . . . . . . . . . . 818.2.2 Neutral Target Sources . . . . . . . . . . . . . . . . . . . . . . . . . . . . . . . . . . 828.2.3 Time-of-Flight Mass Spectrometer . . . . . . . . . . . . . . . . . . . . . . . . . . 84
9 Results and Discussion II . . . . . . . . . . . . . . . . . . . . . . . . . . . . . . . . 879.1 Ionization and Fragmentation of Isolated PAH Molecules . . . . . . . . . . . . . . . 87
9.1.1 Ionization . . . . . . . . . . . . . . . . . . . . . . . . . . . . . . . . . . . . . . . . . . . 899.1.2 Loss of Neutral Atoms or Small Neutral Molecules . . . . . . . . . . . . . . . 999.1.3 Multifragmentation . . . . . . . . . . . . . . . . . . . . . . . . . . . . . . . . . . . . . 106
9.2 Ionization and Fragmentation of PAH Clusters . . . . . . . . . . . . . . . . . . . . . . 1079.2.1 An Evaporation Model for Neutral Monomer Emission from Singly
Charged PAH Clusters . . . . . . . . . . . . . . . . . . . . . . . . . . . . . . . . . . 1129.2.2 Modeling Multiple Ionization of Single Stack Coronene Clusters . . . . . . 119
10 Summary of Part II . . . . . . . . . . . . . . . . . . . . . . . . . . . . . . . . . . . . . 12311 Outlook . . . . . . . . . . . . . . . . . . . . . . . . . . . . . . . . . . . . . . . . . . . . . . 125
AppendicesA Energies and Nuclear Coordinates for Multiply Charged Anthracene Re-
action Pathways . . . . . . . . . . . . . . . . . . . . . . . . . . . . . . . . . . . . . . . 131B Coronene and Anthracene Vibrational Frequencies . . . . . . . . . . . . . 143C List of Additional Publications . . . . . . . . . . . . . . . . . . . . . . . . . . . . . . 145
Bibliography . . . . . . . . . . . . . . . . . . . . . . . . . . . . . . . . . . . . . . . . . . . . . 149
16

1. Introduction
Complex molecular systems, defined by having many degrees of freedom, arestudied in a wide variety of sciences, ranging from fundamental physics to bio-physics and interstellar chemistry. These kinds of systems pose an importantbridge between the understanding of small systems, consisting of only a fewatoms, to large polyatomic molecules bound in groups by weak intermolecularvan der Waals or electrostatic forces. The term "complex" may here take onanother meaning as it is also used to describe such weakly bound moleculargroups that consist of two or more molecular species, while the term "clus-ters" is more general but in this thesis primarily used to denote weakly boundhomomolecular systems.
The study of complex molecular systems pose a wide variety of challengesboth to experimental and theoretical physics and chemistry. Experimentally,large molecules, especially biomolecules, are often fragile by nature and re-quire soft ionization techniques [1]. Their many degrees of freedoms may alsoallow for a wide range of molecular structures that may affect the outcome ofthe experiments, and for these reasons theoretical modeling and calculationsplay a very important role in aiding the interpretation of the experimental re-sults. But theory is also challenged by the complexity of the systems as theirpotential energy surfaces are vast with many local and shallow minima de-manding large computational resources for their explorations. Molecular clus-ters and complexes add to the experimental challenges in being difficult to pro-duce in a size selective manner. Neutral clusters and complexes are generallyalso short-lived with respect to binary collisions at room temperature [2], andtherefore require special experimental conditions to form. The weak natureof the intermolecular forces in molecular clusters and complexes, especiallythe neutral ones, offer additional challenges for theoretical calculations as theattractive parts of the forces involved are due to long range effects that aredifficult to describe with economical computational methods [3, 4].
The molecular systems under study in this thesis are biomolecules and poly-cyclic aromatic hydrocarbon (PAH) molecules. Both are organic moleculesbut differ in that, from a terrestrial perspective, biomolecules are primarilyproduced by and utilized by living organisms, while PAH molecules are ratherassociated with abiological processing of organic matter, such as the forma-tion of crude oil [5] and the anaerobic combustion of biological material [6].
Biomolecules in living cells may be both ionized and fragmented by ioniz-ing radiation. Such radiation exists naturally on the Earth in the form of cosmic
17

rays, long-lived radioactive nuclides, and high-energy photons. Ionizing radi-ation may give rise to free electrons and chemically very reactive atomic ormolecular radicals, which have unpaired electrons, within the cell [7]. Thesemay then attack other parts of the cell and either damage or alter them inmanners destructive for their functions, which give rise to, e.g., mutations andcancers [8]. Evolution has equipped life with mechanisms to counteract andrepair radiation damage, as long as it is minor. But man-made objects and de-vices, such as nuclear power plants, nuclear weapons, aeroplanes and mannedspacecrafts (which increase crew and passenger exposures to radiation orig-inated in space), and various laboratory as well as medical equipments, hasincreased human exposure to ionizing radiation and the research into its ef-fects on living tissues is intense. Although the large scale effects of ionizingradiation on biology to some extent are well characterized [9], the details onthe atomic level are still poorly understood.
This thesis presents experiments in which the damaging effects onbiomolecules due to electron capture processes has been investigatedusing the nucleotide adenosine 5’-monophosphate (AMP) in gas phasecomplexes with controlled numbers of water molecules (also referred toas the AMP molecules being hydrated). Such systems represent moremanageable subsystems of RNA – a sibling molecule to DNA – and providesa better proxy to in vivo processes than bare gas phase systems. Clustersand complexes bound primarily by hydrogen bonds are also known toaffect biomolecular conformations [10], reactivities [11], and fragmentationchannels [12]. Studying such systems on the molecular level is thereforeimportant for understanding their intrinsic properties and how they areinfluenced by their immediate surroundings as well as by charge and energytransfers.
Electron transfer processes are also used as analytical tools for determin-ing the structures of proteins [13, 14]. Proteins are the molecules responsi-ble for carrying out biochemical functions within the cell, and they are con-structed from amino acid subunits. The sequences of amino acids within pro-teins are very important for defining their large scale structures and functions,and thus it is of primary interest to determine these sequences. A common ap-proach for doing so is through the use of mass spectrometry. By fragmentingchains of amino acids, so-called peptides, via interactions with neutral gas tar-gets, surfaces, or photons, or by electron capture processes, the sequences ofamino acids may be determined through characteristic bond cleavages alongthe backbone of the molecules. Of these different fragmentation techniques,fragmentation due to electron capture processes show unique properties inbeing very selective towards disulfide (S–S) and so-called nitrogen-alpha-carbon (N–Cα ) bonds [15], but the exact physical mechanisms behind thesebond cleavages have for a long time been a matter of debate (see, e.g., ref-erences [15–18]). In the present work the physics behind the cleavage of theN–Cα bonds are probed using a small peptide consisting of only two amino
18

acids, i.e. a dipeptide, in complexes with different attached molecular species.By conducting a systematic study of the fragmentation behavior of the dipep-tide as a function of what molecular species it is in complex with, it is possi-ble to influence the electron capture site and thereby the energetics involvedin the fragmentation. In this way it becomes possible to probe the variousmechanisms involved in the N–Cα bond cleavages.
Terrestrial PAH molecules are linked to biomolecules in that their carbonatoms are all part of the carbon cycle [19], which is the biogeochemical ex-change of carbon between the atmosphere, hydrosphere, biosphere, and litho-sphere. Several PAH molecules are known for being toxic to biology and mayalso cause cancers and mutations [20]. Others are relatively harmless, and thedegree of toxicity of PAH molecules is greatly influenced by their molecularstructures. On Earth, PAHs may be found in a wide range of environments,from deep-sea sediments [21] to the Arctic ice [22]. Human activities throughindustrialization and urban life are known to greatly influence the concentra-tion of PAHs in soil samples [6, 23]. In this respect the formation of PAHmolecules is linked to combustion efficiencies, as incomplete combustion fa-vors the formation of PAHs [6]. Clusters of PAH molecules may also act asprecursors to larger scale soot particles [24].
PAH molecules are not only ubiquitous on Earth, but also in space. Thisis known from characteristic emission features at mid-infrared wavelengthsthat agree very well with laboratory measurements of known PAH speciesas well as with quantum chemical calculations [25]. The emission featurescorrespond to relaxation by photon emission of different vibrational modeswithin PAH molecules that may have been excited by, e.g., ultraviolet (UV)photons from nearby stars. For example, the emission band at 3.3 µm is as-sociated with carbon–hydrogen stretching modes, the 6.2 µm band relatesto carbon–carbon stretching modes, and the 11.3 µm band corresponds tocarbon–hydrogen out-of-plane bending modes [25]. (Many PAH molecules,including the ones studied in this thesis, are flat flakes of carbon, similar toa cut-out of a graphene sheet, saturated by hydrogen atoms at their edges.)These emission bands can be found in almost all astrophysical objects, includ-ing star forming regions [26], planetary nebulae [27], and low density partiallyionized gas clouds [28], so-called HII regions, to name a few. Variations of theemission bands suggest that PAH molecules are not only present in their neu-tral forms, but also as ionized [29–31] and protonated species [32], as well asin PAH-related forms where one or more carbon atoms are substituted by otheratoms, as e.g. nitrogen [33, 34]. There are also strong indications that looselybound clusters of PAH molecules are present in regions with less intense UVlight, and that these may form a base for even larger structures, such as car-bonaceous grains [35, 36]. Interstellar grains are believed to be important forinterstellar chemistry, and are, e.g., believed to be required for the formationof molecular hydrogen in the present age universe [37], and may well also beessential for more advanced interstellar chemistry [38]. PAH molecules are
19

very likely to be important components of the interstellar medium and con-tribute significantly to the heating of neutral interstellar gases as well as theionization balance therein [25]. It is estimated that a few [39] up to almost 20percent [40] of all cosmic carbon is locked up in PAH molecules. Evidenceof extraterrestrial PAHs has also been found in closer proximity to the Earth.They have been detected in meteorites [41, 42], in so-called interplanetarydust particles [43], as well as in dust particles collected by the Stardust space-craft from the vicinity of the comet 81P/Wild 2 [44]. UV spectra of the comet1P/Halley have also been attributed to fluorescence of the PAH molecule an-thracene [45]. The abundances of PAH molecules in the interstellar mediumand their presence in comets and asteroids strongly suggests that they couldhave constituted a significant fraction of the early carbon inventory on Earth.
Many of the experiments on PAHs found in the literature are based on pho-toexcitation and fragmentation methods (see e.g. references [46–50]), but afew that, e.g., use electron-impact techniques [51, 52] or collisions with neu-tral targets [53, 54] can also be found. Studies of atomic ions interacting withPAH molecules [55, 56, present work] are, however, just emerging. In thisthesis, slow atomic ions are used to probe the properties of PAH moleculesand PAH clusters. Slow atomic ions offer several advantages to other exper-imental methods. For example, highly charged ions mainly ionize the targetsat rather large distances, and then induce only small amounts of thermal en-ergies during the collision itself. This then allows charge stability limits to bestudied, i.e. how many electrons may be removed from the target before it isspontaneously destroyed. The time scales for the collisions are on the orderof femtoseconds, during which the molecular structures of the targets maybe seen as being frozen. Slow highly charged ions may, e.g., also be used toprobe charge mobilities within PAH cluster target systems. When projectileions with low charge states are used, the targets will be ionized at much closerdistances in which thermal excitation energy may be induced through pene-tration of the electron cloud of the targets. Such collisions are used to proberedistributions of excitation energies within the targets after initial heating in,e.g., PAH clusters at positions closest to (glancing) ion trajectories
The thesis is organized as follows: Following this introduction I will brieflyintroduce quantum chemical calculations using density functional theory(DFT), as these are used throughout the thesis to aid in the interpretationof the experimental results. This is followed by Part I, in which I will firstintroduce the types of biomolecules that have been studied and provide somebackground information for the various experiments. In chapter 4 I willdescribe the experimental techniques used, and in chapter 5 I will presentand discuss the results. More in-depth information will also be providedon a simple evaporation model used to describe the sequential evaporationof water molecules from hydrated AMP anions, and/or dianions, and howsemi-empirical internal energy distributions are deduced with the aid of thismodel. A brief summary of this Part of the thesis is given in chapter 6.
20

Part II of the thesis concerns PAH molecules and PAH clusters. It beginswith an introduction to their properties in chapter 7, while chapter 8 describesthe experimental techniques. The results are presented and discussed in chap-ter 9, which also includes additional information on ionization cross sections,fission barriers, and a modified version of the evaporation model describedin Part I for hydrated AMP anions, in Part II adapted for the evaporation ofneutral PAH monomers from singly charged PAH clusters. Chapter 10 sum-marizes Part II, and the thesis is concluded by an outlook on how future the-oretical and experimental work can build upon, and improve on, the presentresults.
21


2. Using Density Functional Theoryto Interpret the Present ExperimentalResults – a Brief Introduction
This thesis includes molecular structure calculations that provide informationon, e.g., ionization energies, dissociation energies, reaction barriers, electronicstructures (responsible for UV/visible spectra), vibration frequencies (infraredspectra), etc. These types of calculations are used within the field of quantumchemistry, but overlap strongly with other areas of science as well. The pur-pose of the calculations included in the present thesis are to guide the inter-pretations of the experimental observations and provide a qualitative under-standing of the various systems under study. For these reasons the computa-tional methods used were chosen mainly for being computationally efficientand for having documented reliability for the relevant applications (see e.g.references [16, 18, 57–60]). No extensive investigations on the robustness ofthe results using, e.g., different computational methods have been carried out.
The basic goal of quantum chemistry is to solve the time-independentSchrödinger equation
H Ψ = E Ψ (2.1)
for, e.g., a molecular system. Here, H is the Hamiltonian operator, Ψ is thewave function, and E is the energy of the system. The Hamiltonian can bedivided into two parts, such that
H = Hn +He (2.2)
where Hn is the nuclear Hamiltonian and He is the electronic Hamiltonian. Itis common practise to solve the Schrödinger equation for the nuclei and elec-trons separately by applying the Born-Oppenheimer approximation [61]. Itassumes that the nuclei are infinitely heavier than the electrons – a reasonableassumption considering that a proton is almost two thousand times heavierthan an electron – and the electronic and nuclear motions can therefore betreated independently. The problem is thus reduced to solving the electronicSchrödinger equation to obtain the electronic energy E, which is the expecta-tion value of the electronic Hamiltonian
E = 〈ψ|He|ψ〉 (2.3)
23

where ψ is the electronic wave function and He may be divided into threeoperators: One kinetic energy operator Te, one potential energy operator forthe electrons in the field of the nuclei Vne, and one potential energy operatorfor the electrons in the field of the other electrons Vee.
The computational method applied in the present work for finding the elec-tronic energy is called density functional theory (DFT). In the original for-mulation of DFT, the ground state electronic energy of a system is uniquelydetermined by the electron density ρ [62], and there is no need to determinea wave function. Because the electron density depends on the position r, theelectronic energy is in fact a functional, E[ρ(r)]. It may be written as
E[ρ] = Te[ρ]+Vne[ρ]+Vee[ρ] (2.4)
where Te is the kinetic energy of the electrons, Vne is the attractive energybetween the nuclei and the electrons, and Vee is the electron-electron repulsionenergy. The last term can be divided into two parts: One classical Coulombpotential term and one nonclassical term. Determining the ground state of asystem thus becomes a problem of finding the ρ that produces the minimumE. The variational principle has been shown to hold for DFT [62], meaningthat E will always be larger than or equal to the true ground state energy.
By expressing the electronic energy only in terms of the electron densityρ(r), the number of variables that need to be solved for are significantly re-duced from 4Ne (three spatial and one spin coordinate) in the wave functionapproach, where Ne is the number of electrons, to just 3 (the spatial coor-dinates). However, there are difficulties in finding an accurate functional Te
(see e.g. reference [63] for a review) and this leads to unacceptably low ac-curacies. A significant improvement is obtained with the re-introduction oforbitals, so-called Kohn-Sham (KS) orbitals [64]. Because KS theory uses or-bitals, the number of variables are increased from 3 to 3Ne, but for the methodas a whole the complexity is still far less than for many-particle wave functionmodels. In the KS approach, E is divided into two parts: One part that is basedon non-interacting electrons, and therefore can be computed exactly, and onepart which is a correction for the electron interactions. With this it is possibleto rewrite equation 2.4 as
E[ρ] = Ts[ρ]+Vne[ρ]+ J[ρ]+Exc[ρ] (2.5)
where Ts is the kinetic energy of non-interacting electrons in the field of thenuclei. The electron-electron interaction is given by the last two terms, whereJ is the classical Coulomb potential energy, and Exc is the exchange correlationenergy. It is defined as
Exc[ρ] = Te[ρ]−Ts[ρ]+Vee[ρ]− J[ρ]. (2.6)
By defining it this way, Exc becomes the only term that can not be computedexactly in the expression for E, and the task of KS theory is to find an expres-
24

sion for it. There exist hundreds of approaches for this, and the ones whichwill be used in this thesis are B3LYP and M06-2X.
B3LYP [65] is based on the Becke 3 parameter hybrid functional for the ex-change energy [66], and the Lee, Yang and Parr functional for the correlationenergy [67]. The expression for the B3LYP exchange correlation energy is
EB3LYPxc [ρ] =(1−a0)ELSDA
x [ρ]+a0EHFx [ρ]+ax∆EB88
x [ρ]
+acELYPc [ρ]+ (1−ac)EVWN
c [ρ].(2.7)
In this expression, ELSDAx is the exchange energy as expressed through the
Local Spin Density Approximation, which treats the electron density locallyas a uniform electron gas with different densities for spin up and spin downelectrons. EHF
x is the exchange energy as given by the wave function basedHartree-Fock (HF) theory. ∆EB88
x is a gradient correction to the LSDA ex-change energy and it is included because the electron gas is in reality notuniform. ELYP
c is a similar gradient corrected functional for the correlationenergy. And EVWN
c is the Vosko-Wilk-Nusair functional for the correlationenergy [68], which are analytical interpolated formulas based on Monte Carlosimulations of homogeneous electron gas. The coefficients a0, ac and ax arefound through fitting the functionals to experimental data.
One drawback with density functionals, such as B3LYP, is that they arepoor at describing weak interactions dominated by dispersion forces. Suchare important in, e.g., neutral clusters bound together by weak van der Waalsforces, and in the interactions between aromatic (see section 7.1) molecules.New functionals have however been developed that greatly reduce these draw-backs, and one such functional is M06-2X [69]. For the present work it wasused only in the calculations on the weakly bound clusters in paper VII. Allother calculations have been made with B3LYP.
As mentioned earlier KS theory calls for the use of (molecular) orbitals.A molecular orbital (MO) can be represented by a set of known functions, aso-called basis set. If the basis set is complete it will accurately describe theMO. However, this would require an infinite number of functions, which is ofcourse not possible in real numerical calculations. Therefore a finite basis setmust be chosen, and it must be large enough as to give a reliable result, yetsmall enough for reasonable computational resources. The ones used in thepresent thesis are 6-31G(d), 6-311++G(d,p), and 6-311++G(2d,p) [70–72].The first one is generally considered a small basis set, while the latter two arelarge basis sets with the last one being the largest. They are all based on prim-itive Gaussian functions. Gaussians, which contain an exponential of the forme−ζ r2
, are not by themselves able to describe the qualitative features of MOsthat tend to resemble Slater functions, where the exponential is of the forme−ζ r. The 1s orbital of hydrogen is for instance described by a Slater function.However, by using linear combinations of several Gaussians it is possible to
25

adequately resemble Slater features. This has the unfortunate drawback of re-quiring more functions for describing the MO, but the computational gain isin spite of this significant as the Gaussian functions provide more easily eval-uated integrals.
Another reduction in computational efforts can be obtained if parts of thelinear combination of Gaussian functions are made fixed, which creates a so-called contracted set of Gaussian functions. This contraction is especially ad-vantageous to apply for the core electrons, as they do not contribute much tochemistry of the molecules. The first number of the above basis sets, the "6"in e.g. 6-31G(d), describes how many contracted Gaussian functions are usedto describe the core orbitals. The numbers following the hyphen, i.e. the "31"or the "311" in 6-31G(d) or 6-311++G(d,p)/6-311++G(2d,p), concern the va-lence electrons. These are the ones that participate in chemical bonds, and theshape of their MOs may therefore deviate from the atomic orbitals (AOs) dueto, e.g., bonding. For this reason they are not described by one function, butin this case by two or three functions. The first is a contraction of three Gaus-sians (the first "3"), the second consists of only one Gaussian (the first "1"),as does the third (the second "1") if it is used. This arrangement where thefunctions for the valence electrons are doubled or tripled, but not so for thecore electrons, is referred to as a double split valence basis set or a triple splitvalence basis set, respectively.
Finally, the designation for the basis sets can also include plus signs as wellas a description in parenthesis. The plus signs designate diffuse functions,which are functions with a low exponent that are added to more accuratelydescribe the behavior at larger distances from the nucleus [72]. Such a de-scription is known to be important for anions and hydrogen bonded systems.If only one plus sign is added in the basis set designation it means that dif-fuse function are only added for atoms heavier than hydrogen and helium.Two plus signs also includes diffuse functions for the two lighter species. Thefinal notation within parenthesis refers to the addition of polarization func-tions [70,71]. These are functions of higher angular quantum number that areadded to better describe contributions from such states, which for instance arepresent in hybridized orbitals, and they are thus important for the accurate de-scription of chemical bonds. The "d" notation means that sets of d-functionsare added for the valence electrons of the second row elements in the periodictable, i.e. lithium through fluorine, and "p" means that p-functions are addedfor hydrogen electrons.
In Part I of this thesis all quantum chemical calculations were carried outusing the GAUSSIAN 03 [73] program package. In Part II the newer versionGAUSSIAN 09 [74] was used. GAUSSIAN has been under development sincethe 1970s and is a widely used software within the field of quantum chemistry.
26

Part I:Biomolecules

3. Biomolecules
The experiments discussed in this Part of the thesis concern biomolecules andrelate to papers I-III. There are many different kinds of biomolecules and whatdefines them is that they are produced by living organisms. For a long time itwas believed that they were produced exclusively by living organisms, butthis view was altered after Friedrich Wöhler [75] performed the first artificialsynthesis of urea in 1828. Thus was the foundation laid for organic chemistry– one of the most important branches of chemistry. Today, biomolecules aresynthesized and utilized in a wide range of applications such as medical drugsor as additives in the food industry. The study of biomolecules is perhapsmost important for the progression of our knowledge regarding processes inthe living cell and how these processes are affected by external influences.
In this chapter I will introduce peptides and nucleotides, which are thebiomolecules of interest in this thesis. I will also describe, as well as moti-vate, the type of experiments that have been carried out on these molecules inthe present work.
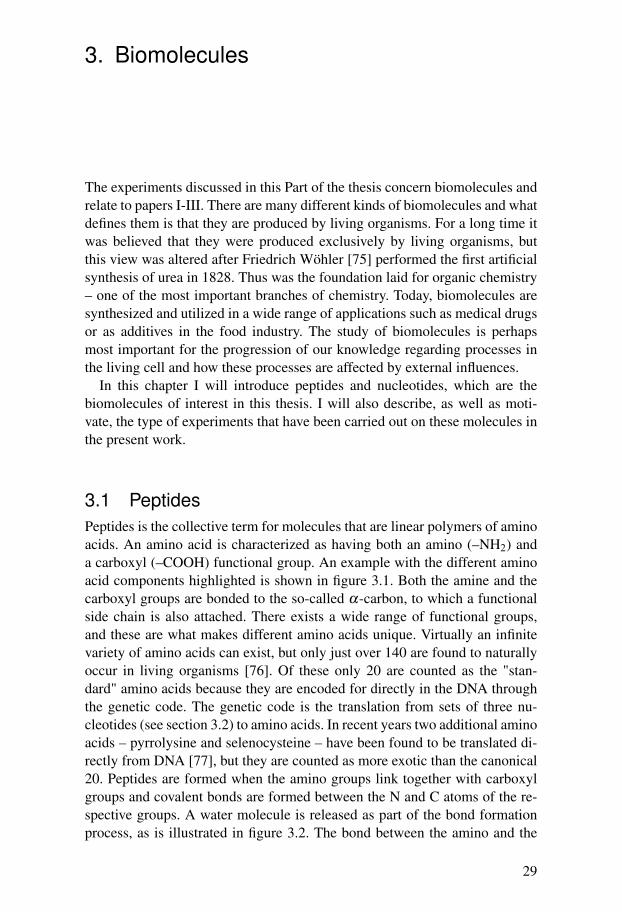
3.1 PeptidesPeptides is the collective term for molecules that are linear polymers of aminoacids. An amino acid is characterized as having both an amino (–NH2) anda carboxyl (–COOH) functional group. An example with the different aminoacid components highlighted is shown in figure 3.1. Both the amine and thecarboxyl groups are bonded to the so-called α-carbon, to which a functionalside chain is also attached. There exists a wide range of functional groups,and these are what makes different amino acids unique. Virtually an infinitevariety of amino acids can exist, but only just over 140 are found to naturallyoccur in living organisms [76]. Of these only 20 are counted as the "stan-dard" amino acids because they are encoded for directly in the DNA throughthe genetic code. The genetic code is the translation from sets of three nu-cleotides (see section 3.2) to amino acids. In recent years two additional aminoacids – pyrrolysine and selenocysteine – have been found to be translated di-rectly from DNA [77], but they are counted as more exotic than the canonical20. Peptides are formed when the amino groups link together with carboxylgroups and covalent bonds are formed between the N and C atoms of the re-spective groups. A water molecule is released as part of the bond formationprocess, as is illustrated in figure 3.2. The bond between the amino and the
29

R
Carboxylgroup
Aminogroup
Functionalside chain α-carbon
Carbona) b)
Hydrogen
NitrogenOxygen
Figure 3.1: a) The structure of an amino acid with the functional groups and side chainencircled. An arrow marks the position of the α-carbon b) An amino acid in the simpletwo-dimensional and black-and-white skeletal form, in which C atoms are inferred atsolid line vertices and only non-C and non-H atoms are indicated explicitly. Solid linesrepresent bonds in the plane of the paper, solid wedges represent bonds going out fromthe paper plane, and dashed lines indicate bonds going into the plane of the paper.
carboxyl groups is referred to as the peptide bond, and the O-C-N-H atomsassociated with it are referred to as an amide or a peptide group.
The peptide bond exhibits partial double bond characteristics due to thepresence of two dominant electron structures in resonance; one with the dou-ble bond between the C and O atoms, and one where it is between the C andN atoms (see figure 3.3) [78]. This creates an almost planar distribution ofthe peptide group atoms that is resilient to rotation about the C–N bond. Thebonds between the peptide groups and the Cα atoms are, on the other hand,purely single, and rotation about them is possible. For this reason peptides cansimplistically be seen as linked planar sheets that can rotate freely about thelink axis.
Naming of peptides is done by their order of appearance (see example infigure 3.2). By convention, the amino end is the beginning of the peptide.This end is also referred to as the N-terminal of the peptide. The oppositeend, where the carboxyl group is located, is referred to as the C-terminal.The example in figure 3.2 shows a peptide consisting of two amino acids –glycine (G) and alanine (A). Using their one-letter abbreviation this peptideis galled GA. A general term for peptides consisting of two amino acids isdipeptides. With three amino acids they are called tripeptides. The generalterm for single chains of many amino acids is polypeptides. Peptides consist-ing of several tens of amino acids, and possibly also two or more polypeptidesjoined in a non-linear manner, are normally referred to as proteins [79]. Withina living cell, proteins are the molecules that control most of the functions,such as transportation of substances across the cellular membrane, catalysa-tion of chemical reactions, or rotation of the flagella which allows certain
30

+
Glycine Alanine Glycine-Alanine (GA)
Peptidegroup
Figure 3.2: The carboxyl group in glycine reacts with the amino group of alanine andforms the dipeptide glycine-alanine (GA). A water molecule is released as part of thebond formation process.
cells/bacteria to swim. The sequence of amino acids within a protein, oftenreferred to as the protein’s primary structure, is very important for its largerscale structures. Through interactions with itself, via e.g. hydrogen bonds,proteins can form secondary structures such as spirals (so-called α helixes)or pleated sheets (so-called β sheets). The complete three-dimensional struc-ture of a protein is called its tertiary structure, and it is generally crucial forthe function of the protein. Quaternary structures may also be formed as com-plexes of two or more proteins.
The primary structure of a protein is the basis for all the higher order struc-tures, and therefore a very important step in understanding a protein is toknow the sequence of its amino acids. This is often accomplished with theuse of mass spectrometry [80]. With this technique proteins, or mostly ratherpolypeptide parts of proteins, are ionized and fragmented, followed by a mass-to-charge analysis of the fragmentation products. The amino acid sequencecan be determined due to very characteristic bond cleavages along the back-bone of the polypeptides. But where this bond cleavage occurs depends on thedissociation method used, and it is important to understand the mechanismsbehind these dissociations.
Figure 3.3: The two resonance structures of the peptide bond.
31

x y z
a b c
Figure 3.4: Nomenclature for peptide fragments for the case of a dipeptide.
3.1.1 Dissociation MethodsPeptide fragments follow an established nomenclature [81]. A schematic viewof the nomenclature is shown in figure 3.4 for the case of a dipeptide. Frag-ments that contain the N-terminal are called a, b or c fragments depending onwhether they broke off before, in or after the amide group. Fragments that con-tain the C-terminal, and are thus the complement of the N-terminal fragments,are termed x, y or z fragments. For peptides that consist of more than twoamino acids, a subscript integer denotes the number of amino acid residuesthat the fragment contains.
Fragmentation experiments of peptides are generally carried out on ionizedgas phase molecules. A common ionization method is to use electrospray ion-ization (see chapter 4), which produces ions by means of attaching n numberof protons, H+, to the peptide molecule M, i.e. [M+ nH]n+. The fragmen-tation techniques of relevance to this thesis are fragmentation via collisionalactivation, so-called collision induced dissociation (CID), and fragmentationfollowing capture of a bound electron, so-called electron capture induced dis-sociation (ECID). The latter method is not very widespread as a peptide se-quencing tool. However, a related method that has gained popularity in thefield is one in which fragmentation is induced by the capture of a free electronto the peptide. This is called electron capture dissociation (ECD).
Collision Induced Dissociation (CID)In CID ionized peptides are collided with neutral targets, often inert nobelgases. The collisions can induce sufficient energies in the peptides to bringthem to a so-called activated state, which then may subsequently lead to dis-sociations. The process can be seen to take place in two steps:
[M+nH]n++A−→ [M+nH]n+∗+A
[M+nH]n+∗ −→ fragmentation
where A is the neutral target and the asterisk (∗) signifies that the ion is ac-tivated, i.e. excited, and may undergo fragmentation. The evidences for the
32
above two-step process comes from CID spectra that are nearly all consis-tent with unimolecular dissociation following an earlier collisional activa-tion/excitation process [82]. CID of peptides typically result in the cleavageof the amide bond and thus produce b and y fragments [83]. This is the bondthat requires the least amount of energy to break [84], which indicates thatfragmentation occurs after the absorbed energy has been redistributed amongthe internal vibrational degrees of freedom in the peptide, i.e. it is statisti-cal. However, a drawback with this technique is that it may also break otherweaker bonds within the peptides, and thus give rise to richer spectra that aremore difficult to analyze.
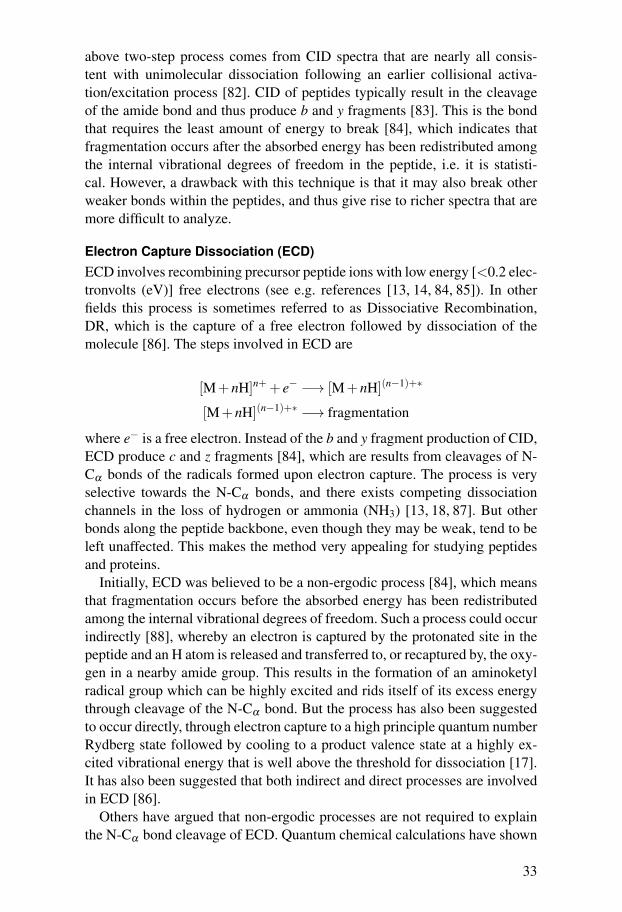
Electron Capture Dissociation (ECD)ECD involves recombining precursor peptide ions with low energy [<0.2 elec-tronvolts (eV)] free electrons (see e.g. references [13, 14, 84, 85]). In otherfields this process is sometimes referred to as Dissociative Recombination,DR, which is the capture of a free electron followed by dissociation of themolecule [86]. The steps involved in ECD are
[M+nH]n++ e− −→ [M+nH](n−1)+∗
[M+nH](n−1)+∗ −→ fragmentation
where e− is a free electron. Instead of the b and y fragment production of CID,ECD produce c and z fragments [84], which are results from cleavages of N-Cα bonds of the radicals formed upon electron capture. The process is veryselective towards the N-Cα bonds, and there exists competing dissociationchannels in the loss of hydrogen or ammonia (NH3) [13, 18, 87]. But otherbonds along the peptide backbone, even though they may be weak, tend to beleft unaffected. This makes the method very appealing for studying peptidesand proteins.
Initially, ECD was believed to be a non-ergodic process [84], which meansthat fragmentation occurs before the absorbed energy has been redistributedamong the internal vibrational degrees of freedom. Such a process could occurindirectly [88], whereby an electron is captured by the protonated site in thepeptide and an H atom is released and transferred to, or recaptured by, the oxy-gen in a nearby amide group. This results in the formation of an aminoketylradical group which can be highly excited and rids itself of its excess energythrough cleavage of the N-Cα bond. But the process has also been suggestedto occur directly, through electron capture to a high principle quantum numberRydberg state followed by cooling to a product valence state at a highly ex-cited vibrational energy that is well above the threshold for dissociation [17].It has also been suggested that both indirect and direct processes are involvedin ECD [86].
Others have argued that non-ergodic processes are not required to explainthe N-Cα bond cleavage of ECD. Quantum chemical calculations have shown
33

cleavage of the N-Cα bond to be facile in model peptide ketyl radicals [16],which are formed following electron attachment to the amide oxygen. Thisradical is, however, not necessarily formed by direct electron attachment. Thepresent understanding is that the electron in most cases are captured to a Ry-dberg orbital located on a positive site in the protonated peptide, but duringthe relaxation process the electron can transfer directly to an oxygen in anamide group where it forms an anti-bonding (π∗) orbital in the amide group(see e.g. reference [15] for a recent review). The π∗ orbital is stabilized due tothe presence of the protonated site by ∼2.5 eV [15]. The N-Cα bond can thenbe cleaved directly [15], or via an exothermal abstraction of a proton from anammonium group to the amide oxygen [18].
Important progress has clearly been made towards understanding the mech-anism, or mechanisms, behind ECD, but more work is still required to testthe proposed scenarios. One such study is presented in paper I of this thesis.While ECD is often employed together with Fourier transform ion cyclotronresonance mass spectrometry (FT-ICR), which is beneficial because of thehigh resolution of the method, other techniques have been developed that re-semble ECD. The experimental study presented in paper I makes use of theECD-like method of ECID. One advantage of ECID is that it allows for frag-ments due to electron capture to singly charged cations to be studied throughthe charge reversal technique (see chapter 4.2.1).
Electron Capture Induced Dissociation (ECID)In ECID, as it is implemented in the experimental setup used for the presentwork (see chapter 4), peptide ions with kilo-electronvolts (keV) kinetic ener-gies collide with neutral gas phase alkali metal atoms from which they cancapture the loosely bound valence electron. For a cesium target the processcan be described as
[M+nH]n++Cs−→ [M+nH](n−1)+∗+Cs+
[M+nH](n−1)+∗ −→ fragmentation.
Experimental studies of ion yields from peptides have demonstrated that ECIDmimics ECD [89–92]. These similarities indicate that the two processes relyon similar dissociation mechanisms, which is interesting considering that theydiffer in several respects: In ECID the electron is captured from a bound statein the alkali metal, while in ECD using FT-ICR the electron is captured froma free state. The timescale from electron capture to detection is also muchshorter in ECID (µs) compared to ECD with FT-ICR (ms to s) [90], as is thetimescale of electron capture (fs vs. µs up to several seconds) [90,93,94]. Theprocesses themselves also differ in that ECD is an adiabatic process, meaningthat the peptide structure has time to relaxes during the electron capture pro-cess. In ECID, on the other hand, the process is vertical, which means that the
34

a) b) c) d)
Front view Side view
Figure 3.5: The structure of the four different molecules used in paper I to formcomplexes with [GA+H]+. a) water (H2O), b) methanol (CH3OH), c) acetonitrile(CH3CN), and d) crown ether (C12H24O6, abbreviated CE).
electron is captured to an unpopulated molecular orbital and that the molecularstructure is "frozen" during the electron capture process.
3.1.2 Probing Peptide Electron Capture Induced DissociationMechanisms by Means of ComplexationThe approach used in paper I for studying the mechanisms behind fragmenta-tion of protonated peptides following electron capture makes use of complexa-tion to affect the electron capture behavior. One of four different molecules areused in complexes with the protonated dipeptide GA: Water (H2O), methanol(CH3OH), acetonitrile (CH3CN), and 18-crown-6-ether (C12H24O6). Thesefour molecules are shown in figure 3.5. Each of them affect the conditionsfor electron capture differently. The most dramatic effect is displayed in com-plexes with crown ethers (CE), which are well known for their propensityto encapsulate positive charges and forming stable complexes [95]. In proto-nated peptides the CE will position itself over the N-terminal, which is wherethe proton is located, and thus effectively shield this area so that electron cap-ture directly to the N-terminal becomes highly unlikely. The results from thesestudies will be discussed in section 5.1.
3.2 NucleotidesDeoxyribonucleic acid (DNA) and ribonucleic acid (RNA) – the carriers ofgenetic information within a cell – are built up of subunits called nucleotides.These nucleotides in turn consists of three parts: A base, a sugar, and a phos-phate. The sugars and the phosphates make up the backbone of DNA/RNAwhile the sequences of bases are what carries the actual genetic information.
35

1'2'
3'4'
5'
Figure 3.6: A cut-out of an RNA string showing three nucleotides. The bases fromleft to right are C-A-G. The different components of the nucleotide are highlightedin the center one. Green marks the base (A), blue the sugar (ribose), and yellow thephosphate. Also marked is the numbering of the C atoms in the sugar. The inset showsthe deoxyribose and the site of the missing O atom compared to ribose is marked bya red circle. The grey dotted lines marks the sites where the bases hydrogen-bond totheir respective base pairing partner.
Figure 3.6 shows three nucleotides in an RNA strand where the different com-ponents have been highlighted.
There are five different bases. Two of them – adenine (A) and guanine (G)– are called purines because they are derivatives of purine (see section 7.2),which consists of a six-membered heterocyclic aromatic organic ring fusedto a similar but five-membered ring. The other three bases – cytosine (C),uracil (U), and thymine (T) – are derived from pyrimidine (see section 7.2) andcalled pyrimidines. They contain only a six-membered heterocyclic aromaticorganic ring. An important ability of bases is to form hydrogen bonded base-pairs. In DNA G pairs with C, and A pairs with T. RNA differs only in that Uis used instead of T to pair with A.
When a base links to the five-carbon sugars ribose or deoxyribose it is calleda nucleoside. The names of the different bases in their nucleoside states areadenosine, guanosine, uridine, cytidine, and thymidine. Deoxyribose bearingnucleosides are distinguished with the prefix "deoxy" added to the name. Thedifference between ribose and deoxyribose (and hence the difference betweenRNA and DNA) is that the 2’ carbon atom in deoxyribose does not have anOH-group linked to it, but instead has only an H atom (see inset in figure 3.6).
One or more phosphate groups can be added to the nucleoside to form anucleotide. The full name of a nucleotide specifies how many are added andwhere they are added. For example, the nucleotide which is used in the studiespresented in papers II and III, and also in section 5.2, is the adenosine 5’-
36

Figure 3.7: One possible structure for a complex consisting of AMP− and four watermolecules [101].
monophosphate. It has one phosphate group added to the 5’ sugar carbon inadenosine. It is also this molecule that is highlighted in the center of figure3.6. This molecule will from now on simply be referred to as AMP.
3.2.1 Probing DNA Radiation Damage Due To SecondaryElectronsIt is well known that ionizing radiation (e.g. α-, β -, x-, or γ-rays) representsa danger to the living cell. A large part of this danger does not arise from di-rect energy deposition, but rather from the secondary ions and free electronsproduced by the primary radiation [7]. Even electrons with energies belowthe ionization threshold of the molecules are sufficient to yield both single-and double-strand breaks in DNA [96–98]. Single-strand breaks are relativelycommon errors that can readily be repaired by the array of proteins in thecell nucleus dedicated to such tasks. Double-strand breaks are more difficultto repair and may lead to mutations, unregulated cell divisions, or to a com-plete breakdown of the in cell’s ability to function. Attachment of very lowenergy electrons have also been shown to yield efficient and site specific dam-age to the nucleobase adenine in the form of hydrogen loss [99]. Similar ECIDexperiments on bare nucleotide anions have shown a high propensity for hy-drogen loss following electron capture [100]. Interestingly, the probability forhydrogen loss increases with the number of hydrogens bonded to nitrogens inthe base of the nucleotides [100]. This suggests that the hydrogens lost are theones involved in the DNA/RNA base-pairing.
In the cell the DNA/RNA is surrounded by on average a few watermolecules per base pair [102]. The work in papers II and III take one stepcloser towards the cellular conditions by performing ECID experiments onhydrated AMP anions. Figure 3.7 shows one possible structure for the AMP−
hydrated by four water molecules [101]. Generally the water molecules liketo cluster around the phosphate group, which is where the negative charge is
37

located, and they may also form bridges to the adenine [103, 104]. In section5.2 the results for ECID experiments on hydrated AMP− will be summarizedand compared to earlier CID results (from reference [105]) on similarcollision systems, where it was found that with 13 or more water moleculesthe AMP− is completely protected against damage, i.e. fragmentation.
38

4. Experimental Techniques I
The experiments for this Part of the thesis were carried out at the tandemmass spectrometer setup called Separator 1 (SEP1), located at Aarhus Univer-sity in Denmark. There, ions were produced using an electrospray ion source,and then accelerated, mass-to-charge selected with a bending magnet, broughtto collide with target gasses in a collision cell, and finally analyzed togetherwith fragments formed from the collisions using an electrostatic analyzer. Thischapter provides a general description of this experimental setup, and morespecific information will also be given in relation to the two biomolecular ex-periments discussed in this thesis. Further details regarding the SEP1 setupcan also be found in references [106] and [107]. I will begin by describingthe process of electrospray ionization, as it plays a central role in making thepresent experiments possible.
4.1 Electrospray Ionization (ESI)The foundation for the electrospray ionization (ESI) technique was laid in the1960’s, in particular by Malcolm Dole [108], who demonstrated that it is pos-sible to produce intact gas-phase macromolecules from a solution. However, itwas not until the 1980’s that the technique really started to take off through thework of John B. Fenn [1,109]. Fenn was awarded the Nobel prize in chemistryfor this work in 2002. The ESI technique is especially useful for generatinggas-phase ions of biomolecules, something which previously had been verydifficult to do due to their fragile nature. ESI is a soft ionization technique,meaning that it ionizes the parent ions with low fragmentation yields.
Figure 4.1 shows a schematic of the ESI source used for the present ex-periments. It works as follows: A solution consisting of the analyte moleculeand a solvent are first mixed together. Methanol (CH3OH) is a common sol-vent for organic molecules but, depending on the type of ion beam desired,water or other solvents/compounds may be added to the solution. The analyteions are typically ionized either by becoming protonated or de-protonated.Peptides are generally protonated, and for this reason an acid is added to thesolution to act as a proton donor. The protons tends to attach to the sites thathas the highest basicities. For molecules such as peptides, these are often theN-terminals. A sample from the analyte solution is extracted into a glass sy-ringe and and infusion pump is used to continuously feed the analyte througha fused silica capillary to a stainless steel spray needle at a rate of, e.g., 6
39

1 mbar
Rotarypump
Turbopump
Turbopump
HeatedCapillary
Octupoleion guide
Sprayneedle
Einzel lens
Acceleration tube
SkimmerEnd electrode& tube lens
Atmosphericpressure 10-3 mbar 10-5 mbar 10-6 mbar
Tube lens
Fused silicacapillary
Figure 4.1: A schematic of the electrospray ion source used for the present experi-ments.
µL/min. The needle is situated 10 mm in front of the entrance to a heatedcapillary. By applying a high voltage potential between the needle and thecapillary analyte ions in the solution are pulled towards the capillary. Figure4.2 shows an illustration of the ESI process. The balance between the elec-trostatic forces acting on the surface charges and the surface tension, causesit to take on a quasi-conical shape. When the potential difference is increasedsufficiently, so that the two forces are equally balanced, a Taylor cone [110]is formed. If the potential difference is further increased, the cone destabi-lizes and charged droplets are emitted from the cone apex, where the electricfield is the strongest, creating a fine spray towards the capillary. The potentialdifference when this occurs is called the onset voltage, and it is typically ofthe order of a few kV for the present setup. A small section of the spray issampled by the 0.4 mm bore of the capillary, which is heated to temperaturesbelow 100 ◦C if the purpose is to study complexes, or to around 140 ◦C if bareanalyte ions are desired. Collisional heating causes neutral solvent moleculesto evaporate from the droplets, which decreases their size and increases theirsurface charge density. At the Rayleigh charge limit [111] the droplets be-come unstable. This is due to the electrostatic repulsion becoming equal tothe surface tension force. Below this size the droplets will undergo Coulom-bic fission and break up into two or more smaller droplets, which do not needto be of equal size. Subsequent evaporations and Coulombic fissions leads toeven smaller droplets. That such subdivisions actually takes place have beenobserved experimentally (see e.g. reference [112]). According to Dole’s [108]originally proposed mechanism, the so-called charged-residue model (CRM),the fission down to smaller droplets carries on until just the bare analyte ionsare left (see figure 4.2b). An alternative explanation, dubbed the ion evapo-ration model (IEM), has been offered by Iribarne and Thomson [113, 114].Supported by experimental results, they proposed that Coulombic fission dueto Rayleigh instability only occurs down to a droplet sizes on the order of 10nm. At this limit, the surface charge density becomes high enough for surfaceions to be pushed out from the droplet and thus transferred into the gas phase
40

+ HV -
E=0
+ + +++ + - - -
-- -
+ HV -
0<E<Eonset
++ +++
+-- -
--
-
+ HV -
E>Eonset
+++ ++++
+
++++
- -- - --- --
+
+
+++
+
+
+ +++
+++
++
+
++
+ +
+++++ +++
+++ +
+
+
+++
++
+++
++
+++
Solventevaporation
Rayleighlimit
Coulombic�ssion
a)
b)
+
+
+
+
++
+
+
+
+++++
Charged-residue model
+
+++
+
+
+
+
++ +
++
++
+
+
+++
+
+
+
+
++ +
++
++
+
Ion evaporation model
Figure 4.2: a) Illustration of the formation of a Taylor cone and spray as the electricfield E between the spray needle and the capillary increases. A spray is formed atEonset. b) Droplets from the spray decrease in size through solvent evaporations andCoulombic fissions. The final stage to free ions are can be explained either by thecharged-residue model or the ion evaporation model (see text).
(see figure 4.2b). Whether CRM or IEM is the correct mechanism is still amatter of debate, but at least a part of the answer lies in the size of the analyteions. For smaller ions, such as alkalis and amino acids, experiments tend tosupport the IEM [115–117]. Larger ions on the other hand, with a lower masslimit typically in the order of several thousand atomic mass units (amu), seemto form through the CRM [118–120], though it is possible that some ions areable to form through both mechanisms. The heated capillary is situated in thefirst differential pumping stage where the pressure is maintained in the lowermbar-range with the use of a rotary vane pump. This transfer from a highpressure to a low pressure region through a small nozzle causes the flow toundergo a supersonic expansion, in which the gas is efficiently cooled. Ionsin the expanding supersonic plume are focused with a tube lens and sampledby a skimmer placed before the second pumping stage. An octupole radio fre-quency ion guide is used to guide the ions through the second stage, where aturbomolecular pump keeps the pressure at 10−3 mbar. In the third stage thepressure is reduced further to 10−5 mbar, and lenses are used to focus the ionsinto the acceleration tube, where they are accelerated by a potential differenceof 50 kV.
41
ElectrostaticAnalyzer
Channeltrondetector
CollisionCells
Ionbeam
ESI-50 kV
0 V
Magnet
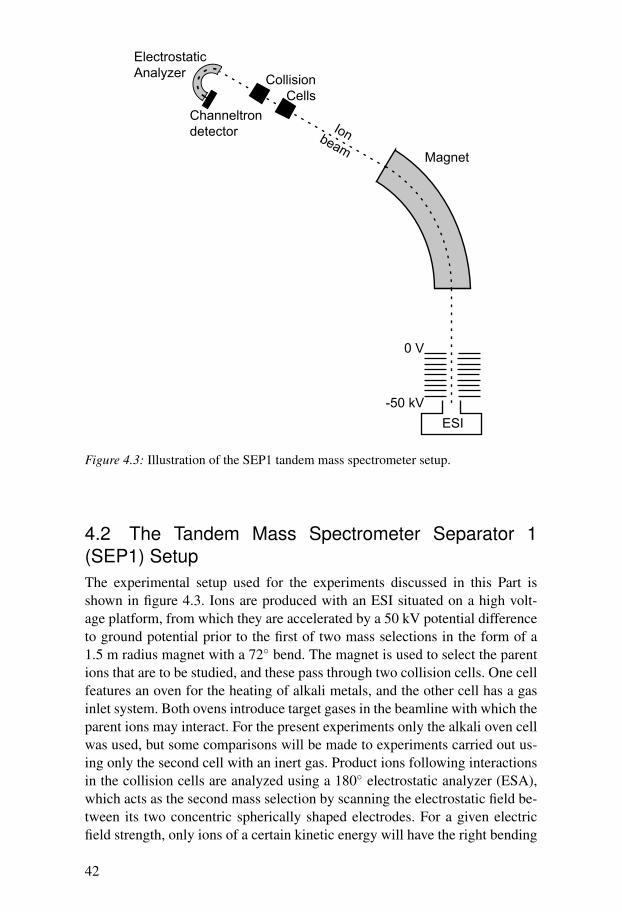
Figure 4.3: Illustration of the SEP1 tandem mass spectrometer setup.
4.2 The Tandem Mass Spectrometer Separator 1(SEP1) SetupThe experimental setup used for the experiments discussed in this Part isshown in figure 4.3. Ions are produced with an ESI situated on a high volt-age platform, from which they are accelerated by a 50 kV potential differenceto ground potential prior to the first of two mass selections in the form of a1.5 m radius magnet with a 72◦ bend. The magnet is used to select the parentions that are to be studied, and these pass through two collision cells. One cellfeatures an oven for the heating of alkali metals, and the other cell has a gasinlet system. Both ovens introduce target gases in the beamline with which theparent ions may interact. For the present experiments only the alkali oven cellwas used, but some comparisons will be made to experiments carried out us-ing only the second cell with an inert gas. Product ions following interactionsin the collision cells are analyzed using a 180◦ electrostatic analyzer (ESA),which acts as the second mass selection by scanning the electrostatic field be-tween its two concentric spherically shaped electrodes. For a given electricfield strength, only ions of a certain kinetic energy will have the right bending
42

radius to pass through the exit of the analyzer. Fragments formed from the in-teractions in the collisions cell will have different masses, but their velocitiesalong the beamline will be approximately the same, and they will thus havedifferent kinetic energies. Because of this the kinetic energy analyses fromthe ESA can be translated into a mass spectrum. Ions that pass through theanalyzer are detected using a channeltron detector, from which the signals areprocessed by analog amplifiers and discriminators before becoming digitizedby a multi-channel scaler and recorded as a function of analyzer voltage on acomputer. Flight time from the collision cells to the detector range from a fewµs up to 10 µs.
4.2.1 Procedure for Experiments on Microsolvated [GA+H]+
Protonated GA, having a mass-to-charge ratio (m/z) of 147 amu, was createdthrough ESI of a solution of GA mixed in water/methanol (1:1 ratio) with 5% acetic acid. Small amounts of CH3CN or CE (crown ether, see figure 3.5)if was also added when required. Following acceleration the bending mag-net was used to select the parent ions to study: Either bare [GA+H]+ ions or[GA+H]+ ions in complexes with H2O, CH3OH, CH3CN, or CE (see section3.1.2 and figure 3.5).
The parent ion beams interacted with Cs vapor in the collision cell featur-ing the oven. Both ECID and CID mass spectra were recorded with the ESA.The CID spectra were obtained by running the ESA in a positive mode, i.e. itrecorded positive fragments. For this type of measurement the pressure in thecollision cell was kept low in order to ensure single collision conditions. TheECID process, on the other hand, produced neutral products which could notbe detected. To circumvent this problem a so-called charge reversal (+CR−)technique was implemented in which the Cs pressure was increased such thatit become large enough to allow for capture of two electrons in collisions withtwo different Cs atoms. The idea is that the [GA+H]+ captures an electronand produce neutral fragments in a first collision, and in second collisionselectrons are attached to the neutral fragments so that they become negativelycharged and thus possible to analyze with the ESA. More information aboutthe +CR− technique utilized at SEP1 can be found in reference [91]. Unfortu-nately, the +CR− experiments are not able to measure the absolute branchingratios of the fragmentation channels as these depend on factors such as theelectron attachment cross section of the neutrals and the stability of the soformed anions. However, changes in the fragmentation pattern can be identi-fied when, e.g., a controlled number of molecules are added to the bare ion.
4.2.2 Procedure for Experiments on Hydrated AMP−
In the AMP experiments, AMP was dissolved in methanol, containing ∼0.1% of water, in which AMP became deprotonated an thus negatively charged.
43

Complexes of AMP− and water molecules may form as part of the electro-spray ionization process, and ion beams consisting of AMP−·(H2O)m, with0 ≤ m ≤ 16 (m/z = 346 + m · 18 amu), were mass selected with the bendingmagnet before brought to collide with Na vapor in the collision cell. The heat-ing of the Na was gentle enough so that only a low pressure of Na vapor waspresent in the cell, thereby giving small interaction probabilities (single col-lision conditions) for the AMP−·(H2O)m complexes. The weakly bound Navalence electron may be capture by the anionic complex in the ECID processdescribed in section 3.1.1, and products from both ECID and CID processeswere recorded with the ESA.
44

5. Results and Discussion I
This chapter presents some of the results from the experiments carried out onprotonated GA dipeptide complexes and hydrated AMP anions. It is based onmaterial included in papers I-III. The results from these two different molec-ular systems will be presented in two different sections. First, I will discussthe GA results in terms of how different attached molecules to GA affect theprocess in which the electron is captured and the resulting branching ratiosbetween typical fragmentation channels. Then I will present the AMP resultsas a comparison between collision induced dissociation (CID) and electroncapture induced dissociation (ECID), which display remarkably different be-haviors in terms of the energetics involved and how the water molecules pro-tect the AMP molecule from damage. I will also describe a simple evaporationmodel and apply it to the hydrated AMP anions for both CID and ECID.
5.1 Probing the Mechanism Behind N–Cα BondCleavage by Means of ComplexationIn paper I of this thesis ECID experiments were carried out on the baredipeptide GA (see figure 3.2) as well as complexes of GA and one or moremolecules of either H2O, CH3OH, CH3CN, or CE (see section 3.1.2 andfigure 3.5).
Figure 5.1, left panel, shows the positive ion spectrum obtained from col-lisions between protonated GA, i.e. [GA+H]+, with a mass-to-charge ratio(m/z) of 147 amu, and a Cs target. Note the presence of b+ and y+ frag-ments, which are typical for the CID process discussed in section 3.1.1 (cf.figure 3.4). Other prominent peaks are a+, CO+
2 as well as the loss of COOHand NH3 from [GA+H]+. Fragments that stem from ECID of singly chargedpositive ions create neutral fragments and can thus not be detected directlyin the experiment. This obstacle is to a certain extent circumvented throughthe charge reversal (+CR−) technique (see section 4.2.1), in which the neutralfragments capture an electron in a second collision with another Cs atom andthus become detectable anions. The +CR− spectrum for [GA+H]+ is shown infigure 5.1, right panel. It clearly shows the presence of z−, y−, and NH3 loss.A peak corresponding to the loss of two hydrogens can also be discerned. They− peak is believed to originate from y and b+ fragments produced by CID,followed by electron capture to the neutral y, which is supported by the pres-
45

Figure 5.1: Left panel: CID: [GA+H]+ + Cs → charged fragments. Right panel:ECID: [GA+H]+ + Cs→ neutral fragments + Cs+. Neutral fragments + Cs→ nega-tively charged fragments + Cs+. Intensity scale in arbitrary (arb.) units.
Figure 5.2: The +CR− spectra of [GA+H]+ with one water (top left panel), onemethanol (top right panel), one acetonitrile (lower left panel), and one crown ether(lower right panel) attached.
46

Figure 5.3: Ratios between the intensities of the ammonia loss peak and the z− frag-ment (I(-NH3)/I(z−)), following ECID, as a function of the number n of differentattached molecules. The z− fragment is produced when breaking the N-Cα bond.
ence of b+ ions in the positive mode spectrum. The z− and NH3 loss peaks arethus the two most prominent peaks that can be attributed to ECID processes.A schematic view over the electron capture process is shown in scheme 2 ofpaper I.
Figure 5.2 presents the +CR− spectra for complexes with [GA+H]+ andone H2O, one CH3OH, one CH3CN, or one CE molecule. For both H2O andCH3OH the NH3 loss dominates over z−. But for CH3CN the situation is re-versed, and for CE no significant NH3 loss can be observed. The strongestpeak in the [GA+H]+·CE spectrum is C2H4O−, which is cleavage of the CE(C12H24O6). A compilation of the ratios between the intensities of the NH3-loss peak and the z− peak as a function of the number of attached molecules, n,is shown in figure 5.3 for each of the four different attached molecular species.These ratios are shown to be larger than the bare ion case for both H2O andCH3OH, while for CH3CN and CE it is smaller. For CH3CN it also decreasesfurther when two molecules are added.
The change in branching ratio due to H2O and CH3OH attachment is at-tributed to cooling of the complex through H2O/CH3OH evaporation. Such acooling would favor the fragmentation channel with the lowest dissociationbarrier. Calculations have shown that NH3 loss is typically associated with abarrier of 0.4 eV [121], but to break the N–Cα bond and to produce the ob-served z− fragment requires more energy. In an ECD experiment on doublyprotonated tripeptides of KYK (K = lycine, Y = tyrosine) it was found that theminimum energy to form z+2 fragments was 1.8 eV [122]. A similar result of1.3 eV was obtained in quantum chemical calculations of the energy requiredto break the N-Cα bond in the Nα -glycylglycine amide radical [16]. Thesenumbers support the evaporation picture as an explanation for the observedresults for H2O and CH3OH. But the experimental results show that same lineof reasoning cannot be applied to CH3CN and CE, even though they are bound
47

0 0.31b) d) f)
0 0.31a) c) e)
Figure 5.4: Left column show the two most stable conformers of [GA+H]+: a) ex-tended structure, and b) L structure. Middle column display the electrostatic potentialon a surface of constant electron density in the protonated cation, and the right columnshow the wave function of the SOMO in the radical neutral [GA+H]• molecule.
by similar energies to [GA+H]+, and should therefore also favor loss of NH3.An explanation can instead be found by studying the ground-state electronicwave functions.
The [GA+H]+ structures with the minimum energies are shown in figures5.4a and b. All calculations performed on these structures, as well as all sub-sequent structures in this section, have been carried out with the B3LYP func-tional and the 6-311++G(d,p) basis set. The structures in 5.4a and b are takenfrom Kohtani et al. [59], who performed an extensive exploration of the con-formation space with the use of molecular dynamics followed by high levelquantum chemistry calculations, and found two structures that are almost de-generate, the energy difference being only 0.05 eV. One of these structureswill be referred to as extended (figure 5.4a) and the other one as the L struc-ture (figure 5.4b). It is the L conformer which has the slightly lower energy.Figures 5.4c and d shows the electrostatic potential for [GA+H]+ on a surfacewith constant electron density. The most positive potential is at the N-terminalbecause that is the location of the proton. The N-terminal therefore seems tobe the most probable location for the electron to be captured to. Indeed, thisis also the area around which the captured electron seems to be located, asseen in figures 5.4e and f. These figures show the wave function of the singlyoccupied molecular orbital (SOMO), i.e. the radical electron, at a constant ab-solute value of the wave function. Green represents positive values, and redare negative values. The great similarity between the wave functions of thetwo conformers indicate that the structural orientation of the alanine is notimportant for the electron capture process. For this reason, and for simplicity,the following calculations will only show the results based on the extendedconformation.
48

0 0.23d) h) l)
0 0.27c) g) k)
0 0.28b) f) j)
0 0.29a) e) i)
Figure 5.5: Left column: The structure of the complexes of [GA+H]+ with a) water,b) methanol, c) acetonitrile, and d) crown ether. Middle column: The electrostatic po-tential an a surface of constant electron density shown for each respective protonatedcomplex. Right column: The radical neutral SOMO wave function.
The left column in figure 5.5 shows the structure of the complexes with[GA+H]+ and one H2O, CH3OH, CH3CN, or CE molecule. The middle col-umn displays the electrostatic potentials for the cations, and the right col-umn the wave functions of the SOMO’s of the neutral radicals. In all casesthe same display settings as in figure 5.4 have been used. For H2O, CH3OH,and CH3CN the most positive potential is, as for the bare ion case, at theN-terminal. The SOMO wave function is also located there. But for CE thepicture changes: The N-terminal becomes less positive and and the SOMOwave function shifts to lie further in along the backbone. This means that theelectron capture is directed towards the N-Cα bond, which supports the ob-served results that more z fragments are produced with CE than in the othercases. A similar picture is seen when examining the SOMO wave functionwith two CH3CN attached to [GA+H]•, as shown in figure 5.6. In this case
49

0 0.23a) b) c)
Figure 5.6: a) The structure of [GA+H]+ with two acetonitrile molecules. b) Theelectrostatic potential on a surface of constant electron density for the cation. c) Thewave function of the SOMO in the neutral radical.
b) d)
a) c)
Figure 5.7: The structure and SOMO wave function of [GA+H]+ with two watermolecules (top row) and two methanol molecules (bottom row).
the SOMO wave function is also pushed towards the middle of the backbone.A possible explanation for this lies in the larger dipole moment of CH3CN(∼2 times larger than for H2O) which more effectively shields the N-terminal.The SOMO wave function is not shifted towards the middle of the backbonewhen two H2O or CH3OH molecules are attached to [GA+H]•, as is shown infigure 5.7.
The discussion above provides a simple, yet reasonable, interpretation forthe observed +CR− spectra. But it should be noted that the explanation is notcomplete. For a more detailed picture of the dissociation process the evolutionof the electronic wave function after geometrical relaxation must be explored,as well as transition states and rate constants for the various unimoleculardissociation channels. Such studies are very complex and time demanding,and goes beyond the intentions of this thesis.
50

AMP– + Ne
AMP– + Na
Figure 5.8: The spectrum of AMP− in collision with Ne (upper panel) and Na (lowerpanel). Vertical dashed gray line marks position of [AMP-H]2−.
5.2 Dissociation of Hydrated AMP AnionsThe second set of experiments in the first Part of the thesis concerns ECIDexperiments on hydrated AMP−. As will be discussed later in this section,the protective effect of the water molecules is quite different in the ECIDcase compared to CID. But first, figure 5.8 shows the fragmentation spec-tra of bare AMP− following collisions with Ne (upper panel) and Na (lowerpanel) atoms. The spectrum with Ne (ionization energy, IE = 21.6 eV) fea-tures products from CID processes, while the one with Na (IE = 5.1 eV) con-tains elements from both CID and ECID. It is by the capture of the looselybound valence electron of Na that the ECID processes may proceed. The mostprominent spectral feature is the parent AMP− peak (off scale), for whichm/z = 346 amu. Among the largest fragments observed are the negative phos-phate groups, PO−3 and H2PO−4 , and the adenine anions, A−, as well as theirAMP molecule counterparts, [AMP-AH]−. These fragments are attributed toCID processes as they are the dominant features in collisions with Ne [105].The [AMP-O]− peak on the other hand, which represents the loss of an oxy-gen atom, is attributed to ECID as it is mainly present in the case of the Natarget [105, 123] as can be seen in figure 5.8. The ECID spectrum also fea-tures the dianion [AMP-H]2−. I will return to the significance of the loss of
51

m = 6
m = 10
m = 13
m = 20
Figure 5.9: CID spectra of AMP− in complexes with m = 6, 10, 13, and 20 watermolecules. The rightmost peak in each spectrum is the primary ion complex, followedby peaks corresponding to the loss of one water molecule down to the bare AMP− ionat m/z = 346 amu. Note the decrease in fragmentation of AMP− (located to the leftof the bare ion peak) for increasing m.
one hydrogen in the dianion after having reviewed the general CID results onhydrated AMP−.
52

Figure 5.10: Mass spectrum of AMP−·(H2O)6 + Na. The enlarged view shows thedianion peaks formed through electron capture. Numbers above the peaks indicate thenumber of water molecules attached to [AMP-H]2−.
5.2.1 Collision Induced Dissociation ResultsWhen m water molecules are added to the AMP−, creating an AMP−·(H2O)m
complex, the spectrum below the AMP− mass remains fairly similar to thepure anion case if m≤ 10. For m > 10 the intensity of all fragment peaks de-crease, and for m > 13 no clear fragmentation can be seen [105]. The spectrafor collisions of AMP−·(H2O)m with Na, for m = 6,10,13, and 20 are shownin figure 5.9. The decreased intensities of fragments for larger m is due to cool-ing of the complex through evaporation of H2O molecules – a picture whichis also supported by the fact that no hydrated AMP fragments are observed,regardless of the value of m. Instead, this evaporation chain is caused by CIDand is always followed by a local maximum for the bare AMP−, as can be seenin figure 5.9. Clearly, for m > 13 the complex is cooled sufficiently to protectthe AMP− itself from fragmenting within the experimental time frame. Thisbehavior is, as we will see, changed for the dianion fragmentation followingelectron capture.
5.2.2 Electron Capture Induced Dissociation ResultsFigure 5.10 shows the spectrum of AMP−·(H2O)6 after collision with Na aswell as an enlarged view of the m/z region between 170 and 230 amu, whichshows the dianion peaks [AMP-H]2−·(H2O)n, where n = 1,2, ...,6 is the num-ber of attached water molecules at the time of detection. Careful calibrationof the m/z scale show that a single H-atom is always lost after electron cap-ture (see reference [100] and discussion in paper II), and this is the completelydominant process for ECID. The difference in m/z between each dianion peakis precisely 9 amu per charge, corresponding to one water molecule (mass 18
53

Figure 5.11: Mass spectra for AMP−· (H2O)m + Na → [AMP-H]2−·(H2O)n + Na+
+ ..., for initial numbers of attached water molecules of m = 6 (upper left panel),m = 10 (upper right panel), m = 13 (lower left panel), and m = 16 (lower rightpanel).
amu), and no doubly charged fragments of the AMP molecule itself are ob-served.
Electron capture is always followed by a high probability for the loss of afew water molecules, as can be seen in figure 5.10 for m = 6, as well as infigure 5.11, which also shows corresponding enlarged views for m = 10,13,and 16. This behavior is in stark contrast to the CID case where the cross sec-tions increase with n. In addition, it is found the the cross section for damageto the AMP molecule itself upon dianion formation increases with increasingnumber of water molecules attached to the AMP (see figure 5 in paper III).
5.2.3 An Evaporation Model for Neutral Water MoleculeEmission from AMP−/[AMP-H]2−
The experimental results for both CID and ECID on AMP−·(H2O)m canbe used to gain insight into the energy transfers as well as the evaporationbehaviors involved in the two mechanisms. This is accomplished through
54

the development and application of a simple numerical evaporation model.In the case of CID the evaporation model describes the sequential lossof water molecules from parent AMP−·(H2O)m complexes and theirdaughter AMP−·(H2O) j complexes, where j ranges from m to 0. ForECID processes the evaporation model describes water evaporationsfrom [AMP-H]2−·(H2O)m complexes in sequential steps through to the[AMP-H]2−·(H2O)n daughter ion complexes. After evaporation of all watermolecules the AMP− or [AMP-H]2− is allowed to fragment. In the model,they are not allowed to fragment before completing the evaporation chain asno fragments with attached water molecules are observed in the spectra. Thedecay rate is given by the Arrhenius expression
Γ = A exp(−Ed/kBT ) (5.1)
where A is the pre-exponential factor that characterizes the frequency for thedissociation mode (here taken to be 1013 s−1), Ed is the dissociation energy,kB is the Boltzmann constant, and T is the temperature of the complex. In theapplied model kBT is expressed in terms of the total internal energy, Ei, ofthe complex, which is assumed to be evenly distributed amongst the (3N−6)vibrational degrees of freedom, where N is the total number of atoms in thecomplex. Equation 5.1 can thus be rewritten as
Γ j = Ae−(Ed ) j
Ei/(3N−6) . (5.2)
The notation j = −1 is used to designate fragmentation of the bare anion ordianion. Evaporation of m water molecules leads to m+2 coupled differentialequations:
dcm
dt=−Γm−1cm
dcm−1
dt= Γm−1cm−Γm−2cm−1
...dc j
dt= Γ jc j+1−Γ j−1c j
...dc0
dt= Γ0c1−Γ−1c0
dc−1
dt= Γ−1c0
(5.3)
where the derivatives are taken with respect to the time t, and c j is the inte-grated intensity of the peak with j number of water molecules attached andc−1 is the integrated intensity of all fragments from the AMP− or [AMP-H]2−
55

Figure 5.12: Upper panel: The final distribution of populated [AMP-H]2−·(H2O) jcomplex sizes, according to the model described in the text, for 13 water moleculesinitially attached to the [AMP-H]2−, after the time of flight to the detector and as afunction of the assumed internal energy. The vertical dashed line at 2.95 eV marksthe cut-off energy, below which less than 0.01 % is lost from the parent ion com-plex. Lower panel: An approximate picture of a stepwise decrease in j as the internalenergy of the complex is increased. It reflects the dominating complex size for eachenergy in the upper panel
molecules themselves. Values for Ed are taken to be 0.45 eV for the first watermolecule attached to AMP−, 0.41 eV for the second water molecule attachedto AMP−, 0.40 eV for the third water molecule attached to AMP−, and 0.37eV for the forth water molecule attached to the AMP− [103]. For any num-ber of water molecules above four it is assumed that the dissociation energyremains constant at 0.37 eV. The same values are applied to [AMP-H]2−. Thedissociation energy for fragmentation of the bare anion and dianion is set to1.26 eV [124]. The dissociation energies are what characterizes the complexesin the model. The model is allowed to run for a length of time that corresponds
56

0
0.2
0.4
0.6
0.8
1
Inte
nsity
[eV
−1]
0 1 2 3 4 5 6 7 8 9 100
0.2
0.4
0.6
0.8
1
Internal energy [eV]
Inte
nsity
[eV
−1]
CID
ECID
Figure 5.13: The approximate internal energy distribution (black squares) and the fit(blue curve) made with two Gaussian functions to these points for CID (upper panel)and ECID (lower panel) with 13 water molecules attached.
to the flight time from the interaction region to the energy analyzer, and it isbetween 6 and 9 µs depending on the size of the initial complex.
The fit parameter of the model is the distribution of the internal energies,f (Ei), in the parent complexes. The model assumes this distribution to de-crease by Ed following the evaporation of a water molecule, which also de-creases the number of degrees of freedom in the complex by nine, as a watermolecule consists of three atoms. An approximation of the shape of this dis-tribution may be obtain from a combination of the model itself and the experi-mental data. Figure 5.12, upper panel, shows the distribution of complex sizesof the dianion, with thirteen water molecules attached, at the time of detectionas a function of the initial internal energy of the complex. As can be seen inthe figure, one size dominates for a certain internal energy. If this dominanceis assumed to be complete, the picture can be redrawn as a stepwise changein size from thirteen (in this example) water molecules down to fragmentationof the AMP− or [AMP-H]2−, j =−1. This behavior is illustrated in the lower
57

Figure 5.14: The fit to the semi-empirical internal energy distributions, obtained inthe same way as in figure 5.13, for CID and ECID with 6, 10 and 13 water molecules.Solid blue curves are the sum of the two Gaussian curves (black dashed lines).
Figure 5.15: The results of the water evaporation model for CID and ECID with 6, 10and 13 water molecules attached before the collisions. Black squares are the experi-mental data and red circles show the model predictions when using 20 000 discretevalues from the continuous energy distributions in figure 5.14.
panel in figure 5.12. From the measured fragmentation spectra it is knownhow many complexes there are of each size, i.e. for each value of j. Takingthese amounts and normalizing each of them with the energy range of thatcomplex size according to the lower panel in figure 5.12, and plotting them asa function of the internal energy, produces figure 5.13, where the upper panelshows the results for the CID case and the lower panel shows the results forthe ECID case. A good fit to this approximate energy distribution is obtainedthrough the sum of two Gaussian functions, which are characterized by their
58

Table 5.1: The parameters of the internal energy distribution used in the evaporationmodel. The µ values are the centers of the two Gaussian functions and σ designatethe standard deviations. Below the cut-off energy the energy distribution is put to zero.I(G1)I(G2)
is the ratio of the integrated intensities of the two Gaussians.
1st Gaussian 2nd Gaussian
G1 = A1e− (Ei−µ1)
2
2σ21 G2 = A2e
− (Ei−µ2)2
2σ22
Mechanism m µ1 σ1 µ2 σ2 cut-off [eV] I(G1)I(G2)
CID 6 1.60 1.10 2.20 3.00 2.15 6
CID 10 2.30 1.40 3.70 3.20 2.65 10
CID 13 2.90 1.60 5.00 3.30 3.00 13
ECID 6 4.05 0.20 4.50 0.72 2.11 0.64
ECID 10 4.82 0.20 5.50 0.60 2.59 0.40
ECID 13 5.62 0.25 6.40 0.70 2.95 1.06
widths, positions of maxima, and their relative intensities. Furthermore, a cut-off energy, which truncates the energy distribution, is specified as the energyat which less than 0.01 % destruction of the parent complex occurs, and it ismarked by a vertical dashed line in figure 5.12, upper panel. Complexes withenergies below this value do not contribute to the observed spectra within theexperimental time frame, and so no information is obtained regarding theirdistributions. Figure 5.14 shows the internal energy distributions for both CID(AMP−) and ECID ([AMP-H]2−) in the case of 6, 10, and 13 water moleculesattached. The results from the model for these six cases are presented in figure5.15 together with the experimental values. As seen in the figure, the model isable to reproduce the observed peak intensities reasonably well. A summaryof the model parameters used to obtain these graphs is given in table 5.1.
5.2.4 Discussion of AMP ResultsAs can be seen in figure 5.14 the evaporation model requires that two dis-tinctively different internal energy distributions contribute to CID and ECIDin order to describe the observed intensities in the spectra. In both cases twoGaussian functions are used. For CID, one of the Gaussians has a significantlyhigher intensity than the other one, and is interpreted to represent the initial in-ternal energy as well as contributions from glancing collisions [105]. The lessintense Gaussian, which has its center at a higher energy, is believed to be dueto closer collisions [105]. Without the smaller second Gaussian it is not pos-
59

Figure 5.16: The distribution of populated complex sizes for CID (upper panel) andECID (lower panel) with 13 water molecules as a function of time.
sible to reproduce the observed experimental behavior when the evaporationmodel reaches small j.
The internal energy distributions associated with ECID differ from the CIDones in being shifted to larger energies, having a distinct peak, and a largercontribution from the second Gaussian function. Although the exact causeof this change in energy distribution is not clear, it is thought to be becauseof electron transfer into electronically excited states, and a subsequent rapiddistribution of these excitation energies on the internal degrees of freedom(see also discussions in papers II and III). The shift to higher energies withthe sharp peak in the energy distributions could therefore be explained by thecomplex always obtaining a certain minimum internal excitation energy in thedianion, which always leads to the loss of at least a few water molecules. Ithas not been possible to reproduce the loss of a few water molecules withoutthe sharp, and somewhat abrupt, left side incline in the energy distributions.
60

According to the model, the CID and ECID processes also differ in therate of change of each complex size. Figure 5.16 shows the distribution ofcomplex sizes for both cases, with thirteen water molecules attached, as afunction of time. It clearly shows that the size of the ECID complexes are stillundergoing a significant change upon reaching the energy analyzer, while theCID complexes are nearly at an equilibrium.
As already mentioned in subsection 5.2.2, electron capture to theAMP−·(H2O)m complex always leads to the loss of a H atom from AMP2−.The present experiment does not provide any information about what specificH atom is lost, but another study on bare nucleotides revealed a H loss tooccur for all nucleotides, including AMP−, upon dianion formation [100].The intensities of these H-loss channels were furthermore found to beproportional to the number of N–H hydrogens in the nucleobases, whichstrongly indicates that the H loss occurred from one of these sites. TheN–H hydrogens are the ones that participate in hydrogen bonding betweennucleobases in the DNA, and thus constitute an important part of themolecule. That such a H atom is lost is further supported by quantumchemical calculations performed on model phosphate complexes, whichindicated that hydrogen loss from the phosphate group could result ina dianion which is electronically unstable, regardless of having a watermolecule attached to it or not [125].
61


6. Summary of Part I
Biomolecules is a group of molecules that are produced and utilized by liv-ing organisms. Some of the most fundamental biomolecules are amino acids,which are able to polymerize through peptide bonds into long chains calledpeptides. These in turn can form proteins – the types of molecules that areresponsible for carrying out most of the functions within the living cell. Col-lision induced dissociation (CID) and electron capture dissociation (ECD) aremass spectrometry methods used to determine the sequences of amino acidsin peptides. Both provide characteristic fragmentation patterns, albeit of dif-ferent kinds. CID typically cleaves the peptide bond, producing characteristicso-called b and y fragments. But ECD rather cleaves the N-Cα bond, whichresults in other characteristic fragments, so-called c and z fragments. In thislatter case, N-Cα bond cleavage takes place in competition with the loss ofammonia. Electron capture induced dissociation (ECID) is a technique thatmimics ECD by capturing the loosely bound valence electron of an alkalimetal rather than a free electron. ECD and ECID display similar behavior interms of what fragments are produced following electron capture.
In this Part of the thesis the protonated dipeptide glycine-alanine([GA+H]+) was in a series of ECID experiments used as a model peptide tostudy the effect of different attached molecular species on the two competingfragmentation channels. Water and methanol was found to increase theratio of ammonia loss to z fragments compared to the bare ion, i.e. NH3loss became increasingly important in relation to N-Cα bond cleavage.Acetonitrile gave little change when just one molecule was added, but withtwo acetonitriles the ammonia loss channel decreased. With one crownether attached, the ammonia loss channel was completely closed. The waterand methanol behavior was attributed to cooling of the complex throughwater/methanol evaporation, similar to what has been observed for AMP−.Such cooling would favor the weakest bond to be broken, which in this caseis the bond between the ammonia group and the rest of the peptide. But thesame explanation could not be applied for acetonitrile and crown ether. Inthis case, quantum chemical calculations revealed that the wave function ofthe radical electron formed after electron capture to [GA+H]+ was movedfrom being located primarily around the ammonia group, as was the case forthe bare ion and the complexes with water and methanol, to rather beingshifted further in on the peptide backbone. This was believed to indicate thata shift had occurred in the site to which the electron capture was directed,
63

thereby producing more z than ammonia loss fragments for complexes withtwo acetonitriles or one crown ether.
Other types of biomolecules are the nucleotides, which are subunits of DNAand RNA. These have been show to be prone to damage by slow moving elec-trons, that are, e.g., produced as secondary particles in a living cell exposedto ionizing radiation. The effect of electron capture was studied on the nu-cleotide anion adenosine 5’-monophosphate (AMP−) using the ECID tech-nique. This effect was studied for both bare AMP anions, and for AMP anionsin complexes with water molecules. It was found that after electron capture theAMP2− always dissociates, the primary dissociation channel being the loss ofa hydrogen atom, regardless of how many water molecules were attached tothe AMP−. This result presented a stark contrast to collision induced dissoci-ation (CID) results, in which more than thirteen water molecules were foundto completely protect the AMP− from fragmentation within the experimentaltime frame. A simple evaporation model was developed to provide insight intothese experimental results. The model explained the observed intensities fordifferent numbers of water molecules attached to the AMP anions as sequen-tial evaporations of water molecules from the complexes, and it was appliedto both the ECID and CID cases. It was found that two distinctly differentinternal energy distributions, which were the sum of two Gaussian functions,contributed to ECID and CID. The ECID distributions had a sharp peak fea-ture in the first Gaussian with the lower mean, and a large contribution fromthe second Gaussian with the higher mean. The CID distributions had lowermean values for both Gaussians, no sharp peak and a smaller contributionof the second Gaussian. For CID, the lower mean Gaussian was believed tocontain the initial internal energy distribution as well as contributions fromglancing collisions, whilst the higher mean Gaussian was believed to be dueto closer collisions. In the ECID case, the change in the internal energy distri-bution and shift to higher lying Gaussian mean values was discussed to be dueto electron transfer into electronically excited states, with a certain minimumenergy always being absorbed by the complex in the transfer.
64

Part II:Polycyclic Aromatic Hydrocarbons


7. Polycyclic Aromatic Hydrocarbons
This Part of the thesis focuses on a group of organic molecules called poly-cyclic aromatic hydrocarbons (PAHs), which are the types of molecules stud-ied in papers IV-VIII. PAHs consist, as the name implies, only of hydrogenand carbon atoms. In this chapter I will introduce these compounds, begin-ning with a discussion of the aromatic concept and how this helps to stabilizePAH molecules. I will then proceed by describing different types of PAHs,where the term "polycyclic" will become apparent. Then follows an introduc-tory discussion of more specific properties of the PAH molecules importantfor the work presented in this thesis, including how PAH molecules fragmentand how much energy it takes to remove electrons from them. Finally, I willintroduce PAH clusters and some of their relevant properties. Much focus willbe on the PAH molecules anthracene (C14H10) and coronene (C24H12), whichare investigated in the present work both as isolated molecules and as pureclusters of either one of them.
7.1 Aromaticity and the Structure of BenzenoidAromatic CompoundsEarly in the history of the science of organic molecules certain compounds inthis group of chemicals were classified as being aromatic. The term arose fromthem having a distinct sweet, and generally pleasant, fragrance. The first aro-matic molecule to be isolated was benzene – a feat accomplished by MichaelFaraday in 1825 [126]. Nine years later Eilhard Mitscherlich determined themolecular formula of benzene to be C6H6 [127]. This came as a surprise atthe time because during the development of the structural theory of chemistryit became established that carbon is tetravalent, i.e. capable of forming fourchemical bonds. That benzene has an equal number of carbon and hydrogenatoms means that it is highly unsaturated in bonds. In spite of this, chemicalexperiments on benzene found it to be remarkably unreactive.
Today it is known that the stability of benzene and other aromatic moleculesis partly due to the delocalization of electrons, which is a consequence of theelectrons forming energetically more favorable molecular orbitals comparedto their atomic equivalents. The ground state electron configuration of carbonis 1s22s22p2. The two 1s core electrons do not contribute to bonding, andaccording to Hund’s rule the two 2p electrons will occupy two different 2p
67
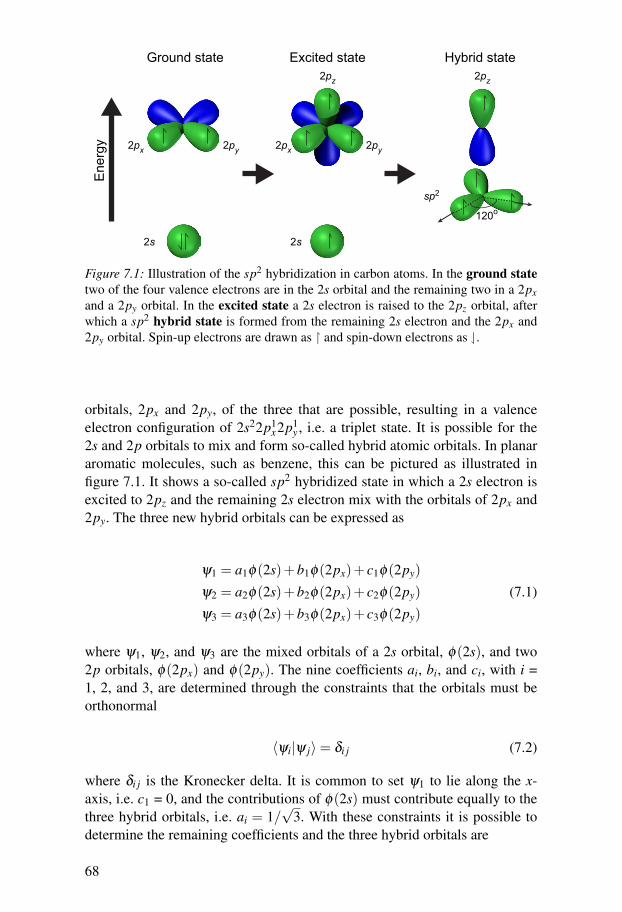
2s 2s
2px 2px 2py
sp2
2pz 2pz
2py
Ground state Excited state Hybrid state
Ene
rgy
120o
Figure 7.1: Illustration of the sp2 hybridization in carbon atoms. In the ground statetwo of the four valence electrons are in the 2s orbital and the remaining two in a 2pxand a 2py orbital. In the excited state a 2s electron is raised to the 2pz orbital, afterwhich a sp2 hybrid state is formed from the remaining 2s electron and the 2px and2py orbital. Spin-up electrons are drawn as � and spin-down electrons as �.
orbitals, 2px and 2py, of the three that are possible, resulting in a valenceelectron configuration of 2s22p1
x2p1y , i.e. a triplet state. It is possible for the
2s and 2p orbitals to mix and form so-called hybrid atomic orbitals. In planararomatic molecules, such as benzene, this can be pictured as illustrated infigure 7.1. It shows a so-called sp2 hybridized state in which a 2s electron isexcited to 2pz and the remaining 2s electron mix with the orbitals of 2px and2py. The three new hybrid orbitals can be expressed as
ψ1 = a1φ(2s)+b1φ(2px)+ c1φ(2py)
ψ2 = a2φ(2s)+b2φ(2px)+ c2φ(2py)
ψ3 = a3φ(2s)+b3φ(2px)+ c3φ(2py)
(7.1)
where ψ1, ψ2, and ψ3 are the mixed orbitals of a 2s orbital, φ(2s), and two2p orbitals, φ(2px) and φ(2py). The nine coefficients ai, bi, and ci, with i =1, 2, and 3, are determined through the constraints that the orbitals must beorthonormal
〈ψi|ψ j〉= δi j (7.2)
where δi j is the Kronecker delta. It is common to set ψ1 to lie along the x-axis, i.e. c1 = 0, and the contributions of φ(2s) must contribute equally to thethree hybrid orbitals, i.e. ai = 1/
√3. With these constraints it is possible to
determine the remaining coefficients and the three hybrid orbitals are
68

E1 = α + 2β
E2 = α + βBonding MOsAntibonding MOs
E3 = α - β
E4 = α - 2β
Ene
rgy
Figure 7.2: Left: The molecular structure of benzene. Middle: Electrostatic potentialmap of benzene. Right: Energy level diagram for the six delocalized π electrons inbenzene.
ψ1 =1√3
φ(2s)+
√23
φ(2px)
ψ2 =1√3
φ(2s)− 1√6
φ(2px)+1√2
φ(2py)
ψ3 =1√3
φ(2s)− 1√6
φ(2px)−1√2
φ(2py).
(7.3)
Because the 2s orbital is spherically symmetric, the contributions from thetwo 2p orbitals are the ones that determines the direction of the hybridizedorbitals. A comparison finds them to lie in a plane and their directions to beseparated by 120◦. This is the reason for the shape of the benzene ring (seefigure 7.2). It is planar because the sp2 hybridized orbitals lie in a plane, andthe 120◦ angle separation between each bond is perfect for a hexagonal shape,with one carbon atom placed in each of the vertices. The sp2 hybrid orbitalsform σ bonds – where the electron cloud is cylindrical symmetric along thebond axis – with sp2 hybrid orbitals of neighboring carbon atoms as wellas to the 1s orbital in the hydrogen atoms. The energy gained by such bondformations well compensates the energy required to excite the carbon atoms(from 2s to 2pz) and to form the hybridized orbitals.
One of the four valence electrons is not used in forming the σ bond withthe hybrid orbitals. This is the electron in the 2pz orbital. The interactionsof the six 2pz orbitals – one for each carbon atom in benzene – form a π
electron system, in which bonds are formed through overlaps between the2pz orbital lobes. It turns out that it is energetically favorable to delocalizethe π electrons in the benzene ring such that their molecular orbitals cover thewhole ring, and this is what causes the stability of benzene and its aromaticity.This behavior can be depicted with an electrostatic potential map of benzene,such as the one in the middle of figure 7.2. It shows that the electrostaticpotential is roughly the same for a given radius, as is expected for delocalized
69

π electrons. The delocalization phenomena can also be deduced analytically,and a relatively simple method for doing so is found in the Hückel molecular-orbital theory. For more in depth calculations and explanations of this theory,see e.g. references [128–130]. But as the theory provides a nice explanationfor the stability of benzene I will now briefly review the results.
The orbitals of the π electrons may be expressed as a linear combination ofatomic orbitals, just as was done above for the hybrid orbitals, according to
ψπ =6
∑i=1
ciφi (7.4)
where φi are the orbitals for each of the six 2pz electrons and ci are normal-ization constants. Then, by assuming the motions of the π orbitals can be de-coupled from the σ electrons and that they move in a potential field due to aneffective Hamiltonian from both the σ and the other π electrons as well as thenuclei, it is possible to express the Schrödinger equation for the π electrons as
H effπ ψπ = Eπψπ . (7.5)
By applying the variational method and make further assumptions that orbitaloverlap is unity in the case of identical orbitals and zero otherwise, that allbond lengths in benzene are equal, and that the π electrons only interact withtheir nearest neighbors, it is possible to express the secular determinant forequation 7.5 as∣∣∣∣∣∣∣∣∣∣∣∣∣∣∣
α−E β 0 0 0 β
β α−E β 0 0 0
0 β α−E β 0 0
0 0 β α−E β 0
0 0 0 β α−E β
β 0 0 0 β α−E
∣∣∣∣∣∣∣∣∣∣∣∣∣∣∣= 0 (7.6)
where α are the Coulomb integrals,∫
φiH effπ φidτ , and β are the resonance
integrals,∫
φiH effπ φ jdτ , i 6= j. Solving the secular equation gives four energy
levels – E1, E2, E3, and E4 – as shown in figure 7.2, where it should be notedthat β has a negative value [131]. Two of the energy levels are degenerate.Because α is essentially the energy of an isolated π electron, it can be set asa zero reference for the energy levels. Thus the energy levels correspond tothree bonding orbitals and three anti-bonding orbitals. In the ground state ofbenzene, the six π electrons fill the three bonding orbitals. The total energyof these six delocalized electrons is 6α + 8β . If the π electrons instead hadbeen assumed to be localized to three double bonds, the total energy wouldhave been 2β larger. This can be demonstrated if performing the same Hückelmolecular-orbital theory calculations as above for ethylene, C2H4, which con-tains one localized π bond, multiplying the result by three to obtain the energy
70

for three localized π bond, and subtracting the energy for the delocalized ben-zene π electrons. The 2β energy difference is called the resonance energy, andit is one reason for why benzene is such a stable molecule, despite being un-saturated in hydrogen atoms. Other reasons for its stability are its closed shellelectron structure and strong σ bonds due to the hexagonal structure matchingperfectly with the 120◦ separation between the sp2 hybrid orbitals, leaving thestructure relaxed and without strain.
In addition to the sp2 hybridized state it is also possible for carbon to formsp and sp3 hybridized states, where the former is the mixing of one 2s and one2p orbital, and the latter is the mixing of one 2s and three 2p orbitals. With sphybridization, linear bonds are formed, such as in acetylene (C2H2), while sp3
hybridization, which can be found in methane (CH4), leads to bonds directedfrom the center towards the corners of a tetrahedron.
Aromatic compounds based on benzene hexagons are called benzoids.Although such molecules are often used as examples of typical aromaticmolecules, it is important to note that others exist as well. In the next sectionI will discuss different aromatic molecules relevant for this thesis. But first,let us also note that the original definition of an aromatic compound – itssmell – has since lost its meaning. Today an aromatic molecule is defined ashaving a system of delocalized π electrons that stabilizes the molecule.
7.2 Different Types of Aromatic MoleculesAromatic molecules that consist of two or more benzene-like rings are calledpolycyclic aromatic hydrocarbons (PAHs). They can be divided into two cat-egories based on the manner in which the rings are fused together. In cata-condensed PAHs no more than two rings share the same carbon atom, whilein pericondensed PAHs three or more rings share common carbon atoms. Thenumber of possible ways in which benzene-like rings may be combined intoPAHs of various sizes and shapes is enormous. Figure 7.3 shows a few ofthem that also are relevant to this thesis. They are acenaphthylene (C12H8),biphenylene (C12H8), anthracene (C14H10), phenanthrene (C14H10), pyrene(C16H10), and coronene (C24H12). Of these six the first and the last two arepericondensed, while the remaining ones are catacondensed. Biphenylene andacenaphthylene also feature a four and a five membered carbon ring respec-tively, and such compounds with non-hexagonal carbon rings are sometimesreferred to as non-alternant PAHs.
A group of molecules closely related to PAHs are fullerenes, and they onlycontain carbon atoms. The most famous fullerene example is the sphericalC60 molecule (see figure 7.3), which features twenty hexagons and twelvepentagons.
It is also possible to substitute one or more of the carbon atoms in a PAHwith other atomic species and maintain the aromatic properties in the newly
71

Anthracene PhenanthreneBiphenyleneAcenaphthylene
Pyrene Coronene Buckminsterfullerene
Acridine Phenanthridine Pyrimidine Purine
C14H10
C24H12 C60
C12H8
C16H10
C13H9N C5H4N4C4H4N2
Figure 7.3: Examples of aromatic molecules.
formed molecule. This way one may form the two isomers acridine andphenanthridine (C13H9N), which in the pure hydrocarbon form correspondto anthracene and phenanthrene, by substituting one carbon atom, as wellas the hydrogen atom bonded to it, with a nitrogen atom. The nitrogen canalso be sp2 hybridized and donate one electron to the π system, while twosp2 electrons will form σ bonds with the two neighboring carbon atoms. Theremaining two of the nitrogen’s five valence electrons will share the third ofthe nitrogen’s sp2 orbitals, making them a lone pair. For this reason bothacridine and phenanthridine have the properties of a base – a property thatwas used to obtain protonated species of acridine in the experiment carriedout in paper VI.
When discussing the properties of aromatic molecules it is worthwhileto note two contradictory properties in regards to their influence on humanhealth: On the one hand, PAHs display various degree of toxicity, from skinirritation to carcinogenesis [132], and are thus dangerous to humans. On theother hand, there are three amino acids – phenylalanine, tryptophan, andtyrosine – that contain benzene rings and these amino acids are important forour survival. Both phenylalanine and tryptophan cannot be produced in the
72

human body, and are thus classified as essential in our diet. The nucleobasesin our DNA and RNA (discussed in section 3.2) are also based on the twoaromatic compounds purine and pyrimidine (see figure 7.3).
PAHs are the aromatic molecules that carry the greatest relevance to thisthesis, and for this reason the remaining three sections will discuss them inmore detail. I will focus mainly on anthracene and coronene, as these willhave key-roles in the results and discussion in chapter 9.
7.3 Dissociation Pathways for PAHsStudies of the unimolecular dissociation behavior of PAHs are almost exclu-sively carried out on monocationic species. The reason for this is mainly apractical one, as ions can be more readily studied experimentally. However,one can argue that the general results from studies of PAH monocations canbe applied to neutral species as well. This is because of the delocalized na-ture of the π electrons. Removing one of them should not change the generalbehavior of a PAH molecule as a whole [133]. For clarity, I will however re-fer to the ionic species where such have been the object of study. And if theion is a radical it will also be marked by a superscripted dot. For example,anthracene•+ is the anthracene radical cation.
The way in which PAH molecules/ions dissociate depends greatly on theirinternal energies, and there are typically three dissociation channels that domi-nate and compete with each other at lower internal energies. These are the lossof a H atom, a H2 molecule, or a C2H2 (acetylene) molecule (see e.g. refer-ences [46, 134–139]). Near the appearance energy for PAH fragmentation theH-loss channel is typically the most prominent one. It is a barrierless dissoci-ation with an activation energy in the 4.4-4.6 eV range for naphthalene [136],anthracene [139] and pyrene [137] cations. As the internal excitation energyis increased the loss of H2 and C2H2 become more important. The branchingratio between the three channels depend not only on the internal energy butalso on the PAH species. For smaller PAHs C2H2 loss seem to appear at in-ternal energies only slightly larger than those for H loss [46, 136, 139, 140].For example, the activation energy for C2H2 loss from anthracene•+ is only4.5 eV [139]. Larger and catacondensed PAHs, especially symmetrical onessuch as pyrene and coronene [46, 47, 137], seem to be much more resilient toC2H2 loss. The loss of H2 is important for all PAH species, and the activa-tion energy is, e.g., 4.6 eV for anthracene•+ [139] and as low as 3.5 eV forpyrene•+ [137]. There is an inherent experimental uncertainty with the H2-loss channel in whether it actually represents the loss of a H2 molecule, or ifit is rather two consecutive H losses [46, 141]. Time-resolved photoionizationexperiments suggest that there is a preference for the loss of a H2 molecule atlower internal excitation energies, while the loss of two consecutive H atomsbecome more important with increasing internal excitation energy [137–139].
73

The fact that PAHs may loose H2 molecules prove that the hydrogens in thePAH molecules tend to shift positions prior to dissociation. This is sometimesreferred to as hydrogen scrambling and is a well known phenomena in organicchemistry (see e.g. references [142–144]). The effects of hydrogen scramblingis something that needs to be kept in mind when studying the fragmentationbehaviors of PAH molecules.
Another important aspect of PAH dissociation is that of possible changesin isomeric form taking place in the parent molecule/ion prior to dissociation,which may lead to different isomers of the dissociation product. The latteris especially important following the loss of a C2H2 molecule. Isomerizationeffects are prominent for PAH molecules due to their ability to store largeamounts of internal energies prior to fragmentation [145]. This is highlightedby the nearly identical fragmentation patterns obtained by PAH isomers whenstudied in keV-energy collision-induced dissociation experiments. [54, 145].At lower collision energies (tens of eVs) it does however seem possible to dis-tinguish different PAH isomers [146]. For example, time-resolved photoion-ization experiments of the two isomers pyrene•+ and fluoranthene•+ haveshown that they do not interconvert prior to dissociation [137]. Anthracene•+
and its isomer phenanthrene•+ is, on the other hand, a case where isomeriza-tion and dissociation have been suggested to be competing processes [139]. Inthe latter context it is interesting to note that the most probable product iso-mer following the loss of C2H2 from both anthracene•+ and phenanthrene•+
has been proposed to be the same, namely biphenylene•+ [139, 147]. Forphenanthrene•+ there exists an obvious path to biphenylene•+ via the elim-ination of C2H2 from the central ring, but for anthracene•+ the mechanismsinvolved are not as clear.
The question of what mechanisms may be involved in C2H2 loss fromanthracene•+, as well as the importance of isomerization processes in thiscontext, is the topic of paper VI, and it is also discussed in section 9.1.2.
7.4 Ionization of PAHsThe first ionization energy (IE) is well known for most PAHs (see e.g. theNIST chemistry WebBook [148]). For anthracene it is 7.4 eV [149,150], whileit is 7.4 eV and 7.2 eV for pyrene [151] and coronene [151–153], respectively.The second IE is also known for several PAHs. It is 12.1 eV for duterated an-thracene [152], 12.4 eV for pyrene [152], and 11.3 eV for coronene [52,153].Beyond these IEs little experimental or theoretical information is available.However, the removal of several electrons affect the thermodynamical stabili-ties of PAH molecules, as well as the stabilities of clusters of PAH molecules.These issues are explored in greater detail in papers IV, V, VII, and VIII, andare also discussed as one of the main topics in the results and discussion inchapter 9.
74

D(2)D(1)
D(3) Anthracene4
Figure 7.4: Approximate representations of three possible anthracene dimer structures(D(1), D(2), and D(3)) calculated by Piuzzi et al. [158] and one tetramer structurecalculated by Bouvier et al. [159].
7.5 Clusters of PAH MoleculesThe study of clusters of PAH molecules is important for, e.g., a better un-derstanding of aromatic (π-π) interactions as well as the interactions of aro-matic to hydrogen atoms (π-hydrogen bonding) [154]. These types of systemsare highly relevant to biochemistry, where macromolecules often include aro-matic components that contribute to the non-covalent interactions. PAH clus-ters have also been suggested to be present in the interstellar medium as so-called very small carbonaceous grains (VSGs) [35, 36, 155–157]. It is verychallenging to study PAH clusters in the laboratory. Because neutral PAHclusters are weakly bound systems, they form inefficiently at room temper-ature. There are generally two ways to circumvent this. The first is to producethe clusters in a system not in thermodynamic equilibrium, such as in a su-personic expansion [2]. The second, and more straightforward approach, is toproduce the clusters in cold environments, for example at liquid nitrogen tem-peratures. This is the method used for the experiments related to the presentthesis, and more details are given in section 8.2.2.
PAH clusters also pose a challenge to theoretical calculations due tothe nature of the forces holding the clusters together. Because many PAHmolecules have a weak, if any, permanent dipole moment the attractive forceswithin PAH clusters are mainly governed by dispersion interactions [160].Long range forces, such as those caused by dispersion, generally requireexpensive computational methods that are ill suited for applications wherecalculations need to be made on a large number of structures. But that isoften the scenario one is facing when trying to find the lowest energy cluster
75

Parallell-displaced-1 (PD-1) Twisted sandwich (TS)
3.4 Å3.3 Å
Figure 7.5: Two low energy structures for the coronene dimer as calculated by Zhaoand Truhlar [58].
geometry. This is due to the large numbers of degrees of freedom involved,shallow potential energy surfaces, and substantial structural rearrangementsrequired in a search for global energy minima. A common approach to handlethese issues is to use model potentials for the intermolecular interactions.This way several possible structures for anthracene clusters, ranging fromdimers up to the pentamers, have been calculated [158, 159]. A few of thepossible neutral dimer structures, as well as a neutral tetramer structure, areshown in figure 7.4. For smaller neutral anthracene cluster sizes there seemsto be a multitude of structures that are close in energy, but as the cluster sizeincreases the tendency has been suggested to go towards the herringbone-likepattern found in anthracene crystals [158, 161–163] – a trend also shownby other PAHs [164, 165]. Experiments have confirmed that at least twoisomers exist for the anthracene dimer in the ground state [166, 167]. Thebinding energy for the neutral anthracene dimer is in the range of 0.2 to0.4 eV [158, 159, 168, 169], and between 0.6 to 0.8 eV for the ionizeddimer [159].
Neutral coronene dimers have been studied using several different computa-tional methods (see e.g. references [58,60,160,170,171]). A couple of the pos-sible structures are shown in figure 7.5. It seems as if coronene dimers preferstacked structures, for which the binding energies lie in the range from 0.8 to1.0 eV [58,60,160,170,171]. Single stacks also seem to be the preferred struc-tures for coronene clusters consisting of up to eight coronene molecules [165].For larger cluster sizes three dimensional structures become more important,as is illustrated in figure 7.6 for a cluster of ten coronene molecules [165].
Surprisingly, little theoretical work has been carried out on cluster geome-tries for ionized PAH clusters. Presently only studies on singly charged an-thracene [159] and coronene [172] clusters may be found. Both these studieshowever show that the charge delocalizes within the clusters, and for sym-metric structures the charge tend to be somewhat more concentrated towardsthe cluster centers. In addition, the delocalized charge makes the ionized clus-ters more strongly bound compared to their neutral equivalents [159, 172].
76

Figure 7.6: Three low-energy structures for the coronene decamer: (a) "Handshake",(b) single stack, (c) herringbone pattern. 1 kJ/mol ≈ 0.01 eV. Reprinted with permis-sion from Rapacioli et al. [165]. Copyright 2005 American Chemical Society.
However, due to the charge delocalizing towards the cluster center, the chargestabilization is weaker for the outer molecules in large clusters.
The stabilities of PAH clusters, as well as how charge and excitation en-ergies is redistributed within them, are probed using keV-ion projectiles inpapers VII and VIII. These results are also summarized, with certain aspectspresented in more detail, in section 9.2.
77


8. Experimental Techniques II
The experiments related to this Part of the thesis have mainly been carried outat the ARIBE1 installation of the CIMAP2 laboratory, located on the site ofGANIL3 in Caen, France. The principle behind the experiments performed inCaen is that keV projectile ions collide with neutral PAH monomer or clustertargets, which are ionized and extracted into a time-of-flight mass spectrome-ter. In this chapter I will describe the Caen experimental setup with focus onsome key components. More information can also be found in references [173]and [174]. First, however, I will provide a brief discussion on some of the ad-vantages in using atomic ion projectiles to study the ionization and fragmen-tation of PAH monomers and clusters.
8.1 Colliding keV Energy Projectile Ions with NeutralTargetsThere are several reason for colliding ion projectiles with neutral molecularmonomer or cluster targets in order to study their stabilities. The most funda-mental one is to ionize the targets – something that is essential for obtainingproducts that are easily analyzed by mass spectrometric methods. Other mo-tivations include the possibility to study excitation energy flows within singlemolecules and within clusters, but also charge transfer and relaxation pro-cesses as well as charge stability limits.
When ionizing neutral targets by means of collision with ion projectiles itis desirable that it is done in a controlled manner. The electron(s) should notonly be released from the target, T , but it/they should also be captured by theprojectile, P, i.e. in a first step the reaction may proceed as
Pz++T → Pz−s +T s+ (8.1)
where the initial positive charge of the projectile is z and s electrons are ini-tially removed from the target. Of course, electrons initially captured by theprojectile may later be released in autoionization processes. By comparing
1Accélérateurs pour les Recherches Interdisciplinaires avec les Ions de Basse Energie. Englishtranslation: Accelerators for the Interdisciplinary Research with Low Energy Ion Beams.2Centre de Recherche sur les Ions les Matériaux et la Photonique. English translation: Ions,Materials and Photonics Research Center.3Le Grand Accélérateur National d’Ions Lourds. English translation: The Grand National HeavyIon Accelerator.
79

the critical distances for electron capture and release it is possible to derive anexpression for the highest velocity, vlim, at which the conditions for electronrelease and capture are met for the removal of the first electron [175]
vlim = z1/4√IE1 (8.2)
where atomic units are used and IE1 is the first ionization energy of the target.For PAH molecules, where the first ionization energy typically lies in the rangefrom 7 to 8 eV, vlim would be∼1 atomic units (a.u.) for a projectile with z= 20,and∼0.6 a.u. for a projectile with z= 2. At these velocities the kinetic energiesfor 129Xe20+ and 3He2+ projectiles are 3.2 MeV and 26.8 keV respectively.Thus if up to tens of keV kinetic energy projectile ions are used the dominantionization process for a neutral target is electron capture to the projectile. Forhigh charge state projectile ions electrons are predominantly removed at largedistances with little direct energy transfers to the targets. For low charge stateprojectile ions energy is to some extent deposited locally in the targets andclose to the projectile ion trajectories. This makes ion projectiles excellenttools for studying charge and energy transfer and redistribution processes.
In section 9.1.1, I will discuss the ionization process for PAH molecules inmore detail, especially in terms of the classical over-the-barrier model, whichdescribes the charge transfer process in a simple manner.
8.2 Ion-Induced Ionization and Fragmentation withTime-of-Flight Mass SpectrometryA photograph of the experimental beamline is shown in figure 8.1a, and a sim-plified top view is shown in figure 8.1b. In the present application the setupis used to perform crossed beams experiments of ion projectiles and neutraltargets. It works as follows: Ions are produced in an Electron Cyclotron Reso-nance (ECR) ion source, mass-over-charged selected with a 90◦ bending mag-net, and guided to the interaction region where it is merged with a beam ofneutrals (either isolated PAH molecules or clusters of PAH molecules) pro-duced from one of two ovens mounted perpendicular to the ion beam. Thereis a beam chopper, which pulses the ion beams before they enter the inter-action region. In between ion pules, the ionized and/or fragmented productsfrom the neutral targets are directed into a time-of-flight (TOF) mass spec-trometer by means of an extraction field pulse. Figure 8.1c illustrates how thetiming is arranged for the beam pulsing and the ion extraction. Typical ionbeam pulse lengths for the present experiments were tion = 1 µs with a rep-etition frequency of the order of 1.5 kHz. The extraction field was switchedon for durations of text = 30 µs typically at times ∆t = 10 µs after the ionbeam was chopped off. When the flight time for the ion beam to travel fromthe beam chopper to the interaction region is taken into account, the ionized
80

ECR Ion Source TOFspectrometer
Bending magnets
Clustersource
Monomersource
Beamchopper
ECR Ion Source TOFspectro-meter
Interaction region
Ionbeam
Cluster source
Monomer source
Beamchopper
Time
Extraction
ontion
text∆t
off
Time
Ion Beam
on
off
a)
c)b)
Figure 8.1: a) Photograph of the experimental hall with highlighted beam line com-ponents. b) Schematic top view of the beam line. c) Illustration of the ion beam andextraction teaming scheme.
products were extracted ∼0.1 µs after the ion pulse had left the interactionregion.
8.2.1 Electron Cyclotron Resonance Ion SourceThe ECR ion source is of the type SUPERSHYPIE [176]. It operates at 14.5GHz, and is able to produce atomic ions with charge states, z, ranging from1 and up to about 30, depending on the ion species. Maximum beam intensi-ties may range from several µA for heavier elements and up to 1500 µA forHe1+/2+ [176]. The high voltage platform is able to provide acceleration toenergies between 1.5 keV/z and 25 keV/z.
In the ECR ion source, a plasma is confined in a cylindrical chamber bothin the axial direction, along which ions from the plasma are extracted, and inthe radial direction. The axial confinement is provided by magnetic mirrorsand the radial confinement is by a magnetic hexapole. The initial plasma isgenerated by 14.5 GHz microwaves, but further ionization is obtained with
81

Monomer oven
Mounting
Monomer jeta) b) c)
Ion beam
Figure 8.2: a) The PAH monomer source mounted on its flange. b) Detail of the up-per part of the picture to the left with the top shielding removed to show the outletthrough which the jet effuses. c) A view towards the interaction region as seen fromthe monomer source. The PAH monomer jet enters the center aperture, which leadsinto the interaction region where the jet is crossed perpendicularly by the ion beam.The housing of the interaction region is cooled by liquid nitrogen.
the electron cyclotron resonance effect. Resonance conditions occur when theangular frequency, ωc, of the rotational motion of the electrons in the magneticfield equals the angular frequency of the microwaves injected into the source.This may happen at various points in the plasma chamber where the magneticfield strength B produces a matching cyclotron motion such that ωc = eB/me,where e and me are the charge and mass of the electron, respectively. The res-onance effect heat the electrons in the plasma and through repeated collisionsthey may ionize the plasma even further.
Some of the advantages of an ECR ion source is that it is able to producehigh currents of high charge states, and it can run for a long time with a stablebeam [177]. Some disadvantages are that the design is expensive and has ahigh power consumption [177].
8.2.2 Neutral Target SourcesTwo neutral targets sources – mounted perpendicular to the beam line and onopposite sides of it – are available in the experimental setup. One is for theproduction of pure monomer targets, and the other one for the production ofcold cluster targets. The main components of both sources are small ovens,which typically are loaded with commercially available PAH powders. Forthe present work the setup was only used for experiments with PAH molecules
82

He gas at ~1 mbarLiquid N2
PAH
Casing
Oven
a) b)
c) d)
Figure 8.3: a) The PAH cluster source enclosure and mounting. b) Schematic of thecluster source oven and enclosure. c) The cluster source oven open. d) View towardsthe interaction region, which is behind differential pumping stages (only the entrancehole to the next pumping stage is seen).
purchased from Sigma-Aldrich or Fluka with purities ranging from 97 to 99%.
Monomer SourcePhotographs of the monomer source are shown in figure 8.2. This source con-sists of a cylindrically shaped oven, electrically heated by a resistive wire,with a casing that provides a small exit hole for the evaporated molecules.Around this oven there is a shielding to prevent the effusive jet from spread-ing too much inside the vacuum chamber. The oven is mounted directly on aremovable flange for easy access. The exit from the monomer oven is locatedclose to the entrance to the interaction region.
The temperature of the oven during an experiment depends on the typeof molecule used. A temperature of 60◦C is, e.g., used for both anthraceneand pyrene molecules, while 250◦C is suitable for coronene molecules. Thedifference is due to anthracene and pyrene being more volatile compoundsthan coronene.
Cluster SourceThe cluster source oven (figure 8.3c) is similarly designed as the monomeroven. It is cylindrically shaped with a casing having a small exit aperture. Thedifference lies in that the cluster source oven is mounted inside a container
83

Figure 8.4: Example of a distribution of anthracene anionic clusters (see text).The red curve is the log-normal distribution f (k,µ,σ) = 1/(k
√2πσ2) exp[−(lnk−
µ)/(2σ2)], with µ = 3.9, σ = 0.45, and k being the number of PAH molecules insingly charged clusters. The spike at k/z = 10 and the bump at k/z < 10 are experi-mental artifacts. Mass spectrum courtesy of Elie Lattouf, CIMAP, Caen, France.
(figures 8.3a and 8.3b) filled with helium buffer gas at a pressure of the orderof millibars. Liquid nitrogen is used to cool the helium gas down to temper-atures slightly below 100 K. The PAH molecules are collisionally cooled bythe He buffer gas, and significant clustering will take place if the molecularconcentration in the jet is high enough. Sufficient concentration is achievedby adjusting the temperature of the oven to values that are often higher thanwhat is used in the monomer oven. For example, 120◦C is used to produceanthracene clusters, and similar temperatures may be used for pyrene clusters,but for coronene clusters the same temperature of 250◦C as in the monomercase is sufficient. Differential pumping is used to separate the high pressurearea of the cluster source from the low pressure area of the interaction region.
The cluster source produces a wide range of cluster sizes that follow closeto a log-normal distribution. An example of such a distribution for anthraceneclusters is shown in figure 8.4. This cluster distribution was measured afteradding an electron to anthracene molecules prior to condensation by meansof an electric discharge. This creates negatively charged clusters that can beextracted into the time-of-flight mass spectrometer.
8.2.3 Time-of-Flight Mass SpectrometerA schematic of the time-of-flight mass spectrometer used for the present ex-periments is shown in figure 8.5. It consists of four regions: i) extraction, ii)acceleration, iii) field-free, and iv) detection. The extraction region is wherethe target molecules interact with the ion beam and are thus ionized and/orfragmented. This region is 110 mm long and situated inside a copper screencooled by liquid nitrogen to obtain a low residual gas pressure down to typ-
84

-4 kV
-23 kV
-15.4 kV-13 kV
0 V
MCP
2.145 kV
-4 kV0 V
[PA
H]z+ j,
PAH
-frag
men
ts
Weak B-field
Ion beam
Extraction
Acceleration
Field-freeregion
Interaction regione-e-
e-
e-e-e-
Detector
Cluster source
Ion beam
Ext
ract
ed io
ns
Cluster beam
Magneticcoils
Figure 8.5: Left: Photograph of the time-of-flight mass spectrometer. Right:Schematic of the time-of-flight mass spectrometer with some typical voltage settings.
ically 10−9 mbar. Ions of different masses and with z positive charges areextracted in a homogeneous electric field between the potentials V1 and V2,where V1 is the potential at the point where the ions are located when the ex-traction begins, and V2 is the potential at the end of the extraction region. Theions are thus given the kinetic energy Ek = z(V1−V2) = mv2/2, where v is thevelocity of the ions after the extraction. The constant acceleration of the ionsin the extraction region is a = z(V1−V2)/(mLext), where Lext is the length thatthe ions travel in the extraction region. The time it takes for the ions to passthe extraction region is thus
text =va= Lext
√2
V1−V2
√mz. (8.3)
Following extraction the ions enter a short acceleration region of length Lacc =30 mm. The purpose of this region is partly to compensate for the initial spa-tial spread of the ions, and together with the following field-free drift regionit is possible to make ions created at different positions in the extraction re-gion arrive at the same time to the metal plate at the end of the drift region.This feature, so-called time focusing, may be obtained through various fieldconfigurations and was first described by Wiley and McLaren [178]. The timespent in the acceleration region is
tacc =Lacc√
2V2−V3
(√V1−V3−
√V1−V2
)√mz
(8.4)
85
where V3 is the potential at the end of this region. After the acceleration regionthe ions enter a field-free drift region of length LFFR = 1000 mm. Here the ionsspend the time
tFFR =LFFR√
2(V1−V3)
√mz. (8.5)
The total time-of-flight from extraction to detection, tTOF = text+ tacc+ tFFR, isthus proportional to
√m/z and may be used to obtain a mass spectrum.
The detection region features a Daly-type [179] detector, in which ionsimpinge on a metal plate from which secondary electrons are emitted. Inthe present setup the conversion plate is made of stainless steel with a layerof gold. The post-acceleration field increases the ion velocities and thus in-creases the secondary electron yield from the ions hitting the metal plate.The weak magnetic field is used to guide the electrons towards a two-stagemicrochannel-plate (MCP) detector, which is placed with its active front sur-face perpendicular to the flight path of the ions. This arrangement has the ad-vantages that it may give high detection efficiencies across a large mass rangeand it may also improve the signal-to-noise ratio compared to setups with di-rect ion detection, as many secondary electrons are emitted per impinging ion.
The signals from the MCP detector are amplified and discriminated beforebeing fed to a PC that records the time between extraction and detection foreach hit on the detector. Flight times from extraction to detection vary from afew µs to some tens of µs.
86

9. Results and Discussion II
In this chapter I will present and discuss results obtained from experimentson keV ions in collisions with PAH monomers and clusters, but also fromtheoretical calculations on PAH fission, fragmentation, and ionization. Mostof the material are summaries of the studies presented in papers IV-VIII, butthere are also some additional results and complementary information that arenot included in these papers. The chapter is divided into two parts. In the firstpart I focus on results for PAH monomers (single PAH molecules isolated invacuum) and in the second part I deal with the PAH clusters. Anthracene andcoronene molecules are used as PAH examples throughout the chapter, withthe former being used for specific case studies.
9.1 Ionization and Fragmentation of Isolated PAHMoleculesThroughout this chapter focus will be put on two different processes that canoccur within the target when a keV ion projectile collides with a neutral PAHmonomer target. The most essential one is ionization. Ionization happens onfemtosecond timescales, which is the time it takes for the projectile ion to passthe target molecule. The second process is fragmentation, i.e. the breaking ofchemical bonds and formation of smaller molecular subunits. Two differentfragmentation patterns can be seen in the mass spectra: One that originatesfrom multifragmentation processes, and one that is due to the loss of neutralatoms and/or small neutral molecules. Losses occur when the target moleculesbecome hot, i.e. when they are vibrationally excited, such that structural rear-rangements may take place and weaker chemical bonds are broken. In otherwords, the molecule should become somewhat to moderately hot for losses tooccur. The energy that initially excites the target molecule is transferred in in-elastic collisions where the projectile ion may loose some of its kinetic energyto the target’s electronic system by passing through the molecule’s electroncloud – a so-called electronic stopping process. Multifragmentation can alsotake place following inelastic collisions, but in this case multiple bonds arebroken, which reflects much more strongly excited molecules. In this casethe multifragmentation is said to be thermally driven. Charge driven multi-fragmentation occurs when PAH molecules become so highly ionized thatinternal Coulomb forces are sufficiently strong to fragment the ions within the
87

Figure 9.1: Mass-per-charge spectrum due to the ionization and fragmentation of an-thracene molecules following collisions with 11.25 keV kinetic energy (Ekin) 3He+
projectiles (top panel), 22.5 keV 3He2+ projectiles (middle panel), and 360 keV129Xe20+ projectiles (bottom panel).
timescale of the experiment. Multifragmentations may also happen when pro-jectile ions remove parts of the target molecules directly by hitting its atomshead-on in a so-called nuclear stopping process, but the probability for this isvery low for the present experimental conditions, as will be discussed in sec-tion 9.1.2. Loss processes typically yield larger sized fragments, while multi-fragmentation processes typically yield smaller fragments.
Figure 9.1 shows examples of mass spectra for 11.25 keV 3He+, 22.5keV 3He2+, and 360 keV 129Xe20+ ions colliding with anthracene (C14H10)molecules. It illustrates the relative importance of the three processes andhow they depend on the projectile ion. The intact monomer peak, C14H+
10, is
88

the dominant peak and located to the far right in the spectra. To the left of itthere are loss peaks labeled by the molecule lost from C14H+
10, as e.g. for the"-C2Hx" peak, where x is the number of hydrogen atoms. Even further to theleft there are distributions of smaller sized fragment peaks that mainly are dueto multifragmentation processes. In the top panel spectrum these are labeledby the number of heavy ions, n, in each CnH+
x fragment group. The top panel(He+ projectiles) is also the one that features the most prominent productsfrom losses and multifragmentation processes. The fragmentation probabilityhere is 83 %, compared to 57 % for He2+ projectiles (middle panel) and65 % for Xe20+ projectiles (bottom panel). Peaks from multiply ionizedcollision products are also visible in all three spectra, but are most prominentwith the Xe20+ projectiles. For He+ projectiles it is somewhat surprisingthat intact dications, C14H2+
10 , are produced since double electron captureprocesses should be negligible in this case. These dications are thereforemost likely products from thermionic emission processes, which seems likelyas the observed large fragmentation probability strongly indicates that veryhot singly charged monomers are produced with He+. Also observed in thespectrum is a peak representing the loss of C2H2 from C14H2+
10 . For He2+
projectiles double electron capture processes becomes more likely. For Xe20+
projectiles it becomes possible to capture more than two electrons, andintact anthracene ions with up to four electrons removed are observed in thespectrum. An interesting new fragmentation pathway becomes possible forthe higher charged species in that also charged fragments may be released.The peak at m/z = 76 amu could be a result from both C2H2 loss fromC14H2+
10 ions and C2H+2 elimination from C14H3+
10 ions. The elimination ofcharged fragments are sometimes referred to as Coulombic fission processes.
In the following subsections I will discuss the processes of ionization, lossof neutral atoms or small neutral molecules, and multifragmentation in moredetail.
9.1.1 IonizationThere are two conditions that need to be fulfilled for an electron to move tothe projectile ion from the target. The first is that the distance between thetwo bodies must be sufficiently small for the electron to make the transition(see section 8.1), and the second is that there must be a resonant energy levelavailable in the projectile to which the electron may be captured. If the pro-jectile is highly charged there will be a large number of states available to sat-isfy the second criterium [180], and the approximation can be made that theprobability for charge transfer only depends on the distance between the pro-jectile and the target. This is the basis for the classical over-the-barrier (COB)model [181] used in papers IV and V to obtain ionization cross sections forPAH molecules.
89

Pot
entia
l ene
rgy
(U1)
[eV
]
Distance (R) [a0]a)
0
-IE1
R > R1r
b
0
Pz+e-T+
*
b)
Pot
entia
l ene
rgy
(U1)
[eV
]
Distance (R) [a0]
0R1r0
Pz+e-T+
-IE1*
Figure 9.2: Illustration of how the first ionization energy, IE1, and barrier b changesin the classical over-the-barrier model when an electron e− is removed from a targetT towards a projectile ion Pz+. In a) the distance R between Pz+ and T is larger thanthe first ionization distance R1 and e− cannot be captured. In b) Pz+ is at distance R1from T and there is no barrier preventing e− from being transferred to Pz+
Classical Over-the-Barrier ModelConsider a point-sized target T located at the origin and a point-sized projec-tile ion Pz+ located at a distance R from T . Due to the presence of Pz+ thefirst ionization energy, IE1, of T will increase due to the Coulomb attractionby the projectile on the active target electron such that that the Stark-shiftedionization energy becomes
IE∗1 = IE1 +zR
(9.1)
in atomic units (used consistently throughout this part of the discussion unlessotherwise stated). If an electron e− is removed from T towards Pz+, it willexperience the potential
U(r) =−(
1r+
zR− r
)(9.2)
when it is at the distance r from T . The situation for when R is too largefor classically allowed electron transfer is illustrated in figure 9.2a. Here, apotential energy barrier of height b exists that prevents e− from making thetransition to Pz+. The maximum of this barrier is located at the distance rmax =R/(1+
√z), which gives a maximum potential energy of
Umax =−(1+√
z)2
R. (9.3)
If Pz+ is brought closer to T the Stark-shifted ionization energy, IE∗1, willincrease, but at the same time the potential energy barrier will be lowered. Atthe first critical distance for ionization of the target, R1, the two will becomeequal, such that
90

IE1 +q
R1=
(1+√
z)2
R1(9.4)
which gives
R1 =2√
z+1IE1
. (9.5)
This situation, which allows for e− to move to Pz+, is depicted in figure 9.2b.Assuming that multiple ionization of T takes place by sequential removal ofelectrons it is possible to generalize the reasoning above and obtain the elec-trostatic potential felt by the ith electron removed from the target as
Ui =ir+
z− i+1R− r
(9.6)
which gives the critical distance for the transfer of the ith electron as
Ri =2√
z− i+1√
i+ iIEi
(9.7)
where IEi is the ith ionization energy of T . This way of looking at electrontransfers between a target and a projectile ion is the simplest form of the clas-sical over-the-barrier (COB) model [181, 182]. Whether or not multiple elec-tron transfers do occur in sequential order depends on the type of projectileand its charge state, but is is a reasonable assumption for large z, in which casethe density of capture states will also be large [175].
From the COB model it is possible to obtain the ith ionization cross sectionsas
σi = π(R2i −R2
i+1). (9.8)
In figure 9.3 these cross sections are illustrated for a point-sized target withionization energies corresponding to those of coronene (see table II in pa-per IV), and with projectiles of charge states z = 20 (left panel) and z = 2(right panel). The coronene molecule is also shown to scale for comparison,although it is treated as a point-sized object when calculating the critical dis-tances.
If the coronene spatial extension and orientation with respect to the projec-tile ion is taken into account, electron transfer (or ionization) cross sectionswill change in both form and size due to polarization effects in coronene inthe presence of the charged projectile. Recently, Forsberg [183] applied theCOB concept to such a scenario by assuming that the coronene molecule canbe modeled as an infinitely thin circular and electrically conducting disc. Asimilar assumption of modeling the C60 molecule as a conducting sphere hasyielded results that agree well with experimental observations [184]. A valuefor the radius of the coronene-like conducting disc can be obtained from a
91

i
1
2
3
4
≥ 5
i
1
2
Figure 9.3: Left panel: Cross sections, according to the classical over-the-barriermodel, for the capture of up to four electrons, as well as five or more electrons, bya z = 20 projectile from a point target with ionization energies corresponding to thoseof coronene. Right panel: The same but for z = 2. The coronene molecule is shownto scale in both panels for comparison.
linear fit to the calculated ionization energies in paper IV, which gives the ith
ionization energy as
IEi = 2.7+4.059i eV. (9.9)
In atomic units, the classical electrostatic expression for the ionization energyof a conducting object is [185]
IEi =W +i−1/2
C(9.10)
where W is the work function and C is the capacitance of the object. For aconducting circular disc of radius a the capacitance is C = 2a/π , which wheninserted into equation 9.10 and set equal to equation 9.9 gives a = 10.53 a0 –a slightly larger number than the 8.75 a0 radius of the molecular skeleton ofcoronene. It should be noted that a would decrease if the thickness of coronenewas taken into account, but the mathematical tools used by Forsberg [183] arethis far only applicable to infinitely thin discs. Without getting in to the mathe-matical details, the expression obtained by Forsberg [183] for the electrostaticpotential experienced by the ith electron moving from the disc to the projectileis
92

z [a
0]
x [a0]
i
1
2
3
i
4
≥ 5
a) b) c)
Figure 9.4: a) A slice of the cross sections, according to the classical over-the-barriermodel, for the capture of up to four electrons, as well as five or more electrons, bya z = 20 projectile from a infinitely thin disc target of radius 10.53 a0 (cf. text). Thecoronene molecule is drawn to scale at the position of the disc. b) An illustration ofthe slice used in a). c) Perspective view of the surface defined by the first electroncapture distance, with the coronene molecule drawn to scale.
Uπ/2i (r) =
−12πr
[tan−1
(ar
)− ar
a2 + r2
]+
1aπ
[tan−1
(ax
)]2
− 2(z− i+1)π(r2−R2)
[R tan−1
(ar
)− r tan−1
( aR
)]− 1
a
[2(z− i+1)
πtan−1
( aR
)− i]
tan−1(a
r
)− z− i+1
R− r
(9.11)
for the specific case when the projectile with charge z is located on a line fromthe disc center perpendicular to the disc plane. The radius of the disc is a,the distance from the disc to the projectile is R, and r is the distance fromthe disc to the electron. The expression is given here solely for the purpose ofconveying the significant increase in complexity compared to the simple caseof a point-sized target (equation 9.6). The first two terms in equation 9.11represent the electron’s self-induced potential, the next two terms representthe induced potential due to the projectile of charge z, and the last term is thepotential due to only the projectile.
Figure 9.4a shows some electron capture distances for coronene as obtainedusing the disc model and a projectile ion with an initial charge state of z = 20.For simplicity, the figure only shows the results for the first quadrant of a planethat goes through the center of the disc with the origin placed at the center of
93

the disc, as is illustrated in figure 9.4b. Clearly, the shape of the electron cap-ture distances differ from the spherical ones obtained using a point target (cf.figure 9.3). An illustration of the three dimensional surface for the first elec-tron capture distance is shown in figure 9.4c. In general, the results from thedisc model agree well with results obtained from DFT calculations [183], inwhich the electron density distribution is calculated for an "active" electron inthe field of a singly charged coronene molecule and a point-charged projectile.However, it should be emphasized that the disc model is still under develop-ment. Nonetheless, the present results highlight the importance of polarizationeffects when modeling electron capture processes from PAH molecules, andthis model will certainly aid in obtaining new and more accurate results infuture work.
One important observation that can be made from the over-the-barriermodel is that for highly charged projectile ions, such as z = 20, the distancesfor the capture of the first few electrons are, regardless of whether the pointor disc model is used, so far away from the molecule that the density of itselectron cloud there should be very low. This means that little energy shouldbe induced in the target molecule by electronic stopping processes. But forlow charge state projectiles, such as z = 1 or z = 2, the distances for electroncapture are so close to the target molecule (cf. figure 9.3) that significantenergy transfers in electronic stopping processes are expected.
Stability LimitsDue the ability of highly charged projectile ions, such as Xe20+, to removeelectrons from target molecules at large distances, they induce little or no heatin the targets in the collisions themselves. The method is thus very suitablefor investigating charge stability limits, i.e. at some point when several elec-trons are removed from a molecule the Coulomb repulsion forces, facilitatedby the weakening of chemical bonds, will be strong enough to fragment themolecule.
Figure 9.5 shows a summary of the maximum number of charges that PAHmolecules can hold without fragmenting as a function of the number of car-bon atoms, n, in the PAH molecules. Values are given both from the presentexperiments (papers V and VII), theoretical calculations of thermodynamicstabilities (papers IV), and fission barriers (paper IV and present work). Thethermodynamic stability is defined as the highest charge state for which thedissociation energy, i.e. the energy difference between the parent ion and thesum of the two daughter molecules/ions, is such that the parent ion is the lesserbound system. The thermodynamic stabilities were obtained from calculateddissociation energies for H and C2H2 loss under the assumption that the moststable daughter ion isomer is formed. The experimental values lie one or twounits of charge above the thermodynamic stabilities, which indicates the ex-istence of fission barriers, i.e. energy barriers that impede the decay such thatthe ions may stay intact on the experimental time scale even when they are
94

Figure 9.5: Charge stability limits versus the number of carbon atoms in PAHmolecules. Squares are from thermodynamical stabilities (paper IV), circles are fromexperiments (papers V and VII) and triangles are from calculations including fissionbarriers (paper IV and present work). The fission stability limit for n = 14 applies tothe present experimental conditions (see text).
thermodynamically unstable. Through the removal of additional charges thesebarriers may become negligible or negative. The calculated charge stabilitywhen considering the fission barrier for anthracene lies one unit of chargeabove the experimental value. There are several possible explanations for thisdifference. One possibility is that the theoretical calculations do not includethe pathway with the lowest fission barrier. A second is that higher chargestates do exist in the mass spectra, but are not resolved due to overlap of lowercharge state fragment groups or large background signal. A third explanationis that the calculated fission barriers accurately represent the real barriers, butthat the highly charged ions formed in the interactions are already at theirformation hot enough to overcome the fission barriers.
A very interesting result from the study of thermodynamical stabilities isthat the fragmentation channel which seems to determine the stability limitfor the higher charge states is the loss of C2H+
2 , and not H+ or neutral H/C2H2fragments (cf. paper IV).
Case Study I: Fission Barriers for C2H+2 Loss from Multiply Charged
Anthracene CationsFigure 9.6 shows two pathways for eliminating C2H+
2 from anthracenemolecules when between six and nine electrons have been removed. The twopathways represent different C–C bond cleavages in one outer ring and hastwo different C12Hz+
8 isomers as end products. The pathways are direct inthe sense that no structural rearrangements take place prior to dissociation,which appears as reasonable for Xe20+ collisions where electrons are mainlyremoved at large distances with little direct induced heating of the anthracenetarget. The calculations were carried out at the B3LYP/6-31G(d) level oftheory and the energies given in figure 9.6 are relative to the correspondingintact ionized anthracene molecule, including zero-point energies scaled with
95

0
-2.35
1.231.28
-0.96
3.06
-8.23
1.501.07
0.65
-2.33
0.17
-10.99
0.760.40
-3.25
-0.97
-13.75
0.410.31
-4.43-3.69
-16.03
-4.06
-1.85
-9.21
-12.16
-14.86
-5.74
-3.85
-6.57
0
6+
6+
7+
7+
8+
8+9+
9+
1z+1z+
40z+
41z+
(TS1-38)z+ (TS1-40)z+
(TS40-41)z+
(TS38-39)z+
38z+
39z+
+ CCH2+
+ CCH2+
Figure 9.6: Two different pathways for direct elimination of C2H+2 from an outer ring
in anthracenez+, with z = 6, 7, 8, and 9. The molecular structures shown are for z = 6.Relative energies are given in eV.
0.9806 [186]. As seen in figure 9.6 there are energy barriers for the breakingof the first C–C bonds, although the barrier heights decrease with increasingcharge state z. At z = 9, the barrier is only a few tenths of an eV high, whichis low enough for the molecular ion to fragment promptly except under verycold conditions. For z = 10 the calculations show the anthracene ion tospontaneously fragment regardless of the internal ion temperature, which wasalso the case for the structures 389+ and 399+. The second barrier becomesnegative in the left hand reaction pathway for z = 7, while it is close to zero
96

Table 9.1: Anthracene relaxation energies from vertically ionized neutral structuresto ground state ionized structures, calculated at the B3LYP/6-31G(d) level of theory,including zero-point energies scaled with 0.9806 [186]
Charge state Relaxation energy
(z) [eV]
5 1.06
6 2.72
7 5.16
8 8.88
9 13.17
in the right hand pathway. From these calculations a charge stability limitfor multiply charged anthracene in its vibrational ground state may be putto z = 9. An interesting observation from these calculations is also that theemitted C2H+
2 unit is not acetylene+ [H–C≡C–H]+, but rather [C=CH2]+.There are a few more aspects that need to be considered when investigating
charge stability limits valid for the experimental conditions that apply whenkeV Xe20+ ions collide with anthracene molecules. The first is that the gasphase anthracene molecules are produced by evaporation of an anthracenepowder in an oven at 60◦C (cf. section 8.2.2). At this temperature anthracenealready has an internal energy of a few tenths of eV, and it may thus overcomea small fission barrier. Second, the interaction between the Xe20+ ion andthe anthracene molecular target occurs on timescales of femtoseconds. Thismeans that the molecule will not have time to relax while the electrons are re-moved, and the ionization can be viewed as taking place vertically. Followingionization the anthracene ion will relax down towards its vibrational groundstate, but it will keep an excitation energy roughly equal to the energy dif-ference between the vertically ionized structure and the relaxed ground statestructure. Table 9.1 lists these relaxation energies for z = 5 and up to z = 9.A comparison between these excitation energies and the highest barriers infigure 9.6 shows that z = 9 clearly can not remain stable, and neither shouldz= 7 and 8 be stable on long timescales. For z= 6 the lowest direct fission bar-rier (1.50 eV) is slightly more than half of the relaxation energy (2.72 eV). Asimilar relation can be found between the typical internal energies associatedwith C2H2 loss from anthracene cations in paper VII (7-8 eV), and the lowestoverall dissociation barrier calculated in paper VI (4.95 eV). Therefore ionswith z = 6 are expected to decay on the experimental µs timescale. For z = 5the lowest direct fission barrier is 1.95 eV (not shown in figure 9.6), which isalmost double the relaxation energy. Therefore this charge state should have
97

0
2.13
0.54
-0.71
1.26
2.41
1.24
2.48
-1.23
1.25
-6.55
-10.54
-14.16
-0.47
-4.78
-3.37
-6.72
1.46
-0.260.49
-0.86
1.64
0.23
1.39
0.22
1z+
(TS1-7)z+ (TS7-8)z+ (TS8-42)z+
(TS42-11)z+
7z+8z+
42z+
11z+
5+
6+
7+
+ CCH2+
Figure 9.7: Pathways for elimination of C2H+2 from anthracenez+, with z = 5, 6, and 7,
following an initial two-step hydrogen-shift analogous to one of the reaction pathwaysin paper VI. The molecular structures shown are for z = 5. Relative energies are givenin eV.
a sufficiently long lifetime against C2H+2 emission to survive on the present
experimental time scale.A third aspect to consider in the experimental context is that while the first
few electrons captured to the Xe20+ projectile should come from the outermolecular orbitals in anthracene, this may not be the case when many elec-trons are removed. Resonant electron captures of inner shell electrons maythen be possible, giving even larger internal vibrational energies.
Considering that some internal excitation energy is available following thepost-ionization relaxation, it is also of interest to study alternative C2H+
2 elimi-nation pathways. In paper VI three reaction pathways were identified for elim-inating C2H2 from the singly charged anthracene ion. The most direct path-
98

way of these is elimination of C2H2 from an outer ring following an internaltwo-step hydrogen-shift. Figure 9.7 shows the same reaction pathway but forC2H+
2 elimination from multiply charged anthracene with z = 5, 6, and 7. Forall charge states barriers exist for the hydrogen shifts. For z= 7 the barriers forC–C bond cleavage are negative and the barriers for the hydrogens shifts areonly a couple of tenths of eV high. For z = 6 the largest barrier is lower thanthe relaxation energy (cf. table 9.1), while it is larger for z = 5, i.e. the trendis similar regardless whether the fission proceeds directly (according to figure9.6) or via hydrogen shifts (figure 9.7). With the above reasoning the chargestability limit for multiply ionized anthracene is, for the present experimentalconditions, put to z = 5. Again, however, it should be noted that such a highlycharged anthracene molecule is thermodynamically unstable and, given time,will always decay even with the lowest possible internal excitation energy. Allmultiply charged anthracene structures are included in appendix A.
9.1.2 Loss of Neutral Atoms or Small Neutral MoleculesLosses from a molecule take place when it becomes sufficiently hot to re-lease one or more neutral atoms or smaller neutral molecular units. Beforediscussing the experimental findings, I will briefly review how the energy re-quired for these losses may be transferred from a projectile ion to a targetmolecule, and how these aspects relate to the present experimental results.
In figure 9.3 one can see that projectile ions with z = 2 have to interact withpoint targets at small distances in order ionize them. Even though the shape ofthe ionization cross section will change when the physical extension of PAHtargets are taken into account, it is still evident that a low charge state projec-tiles must get so close to the PAH molecules to ionize them that direct interac-tions between the projectiles and the electron clouds or the atoms of the targetmolecules become important. The interaction of a projectile ion with a targetmolecule’s electron cloud is an inelastic process in which the slowing downof the projectile transfers energy to the whole target molecule – a process re-ferred to as electronic stopping. The direct interaction between a projectile ionand the heavy nucleus in an atom in the target molecule can on the other handbe seen as an elastic binary collision in which a certain amount of energy istransferred directly to the atom and may even eject it from the molecule if theenergy transfer is sufficiently large. This form of energy loss from projectileions is referred to as nuclear stopping. Both nuclear and electronic stoppingprocesses occur simultaneously, but they can be treated separately [187, 188].Lindhard et al. [187] introduced two dimensionless variables
ε = EaM2
Z1Z2e2(M1 +M2)(9.12)
and
99

Nuclear stoppingElectronic stopping 129Xe/16O
Electronic stopping 3 He
3He2+
22.5 keV3He1+
11.25 keV
16O3+
37.2 keV129Xe20+
360 keV
Figure 9.8: Theoretical electronic and nuclear stopping cross sections in variables of ρ
and ε . Dashed vertical lines mark ε1/2 values for different projectile ions with carbontargets. For 360 keV 129Xe20+ projectiles it should be noted that ionization of thetargets primarily happen at large impact parameters with little direct interactions withthe targets themselves (little nuclear or electronic stopping, see text). Figure is adaptedfrom Lindhard et al. [187].
ρ = RNM24πa2 M1
(M1 +M2)2 (9.13)
as measures of energy and range, respectively. E is the energy of the projec-tile ion, a = 0.8853a0(Z
2/31 + Z2/3
2 )−1/2 is the screening length of the targetatom, where a0 is the Bohr radius. Z and M are the atomic number and massof the projectile and target atoms, with the subscripts 1 and 2, respectively.The electron charge is e, with e2 = 14.39 eV Å. R is the range, N is the num-ber of atoms per unit volume. With ε and ρ Lindhard et al. [187] were ableto present a universal range-energy description of nuclear and electronic stop-ping processes in good agreement with experimental observations. Figure 9.8shows a plot adapted from Lindhard et al. [187, 188] of dε/dρ , which relatesto the stopping cross section, versus ε1/2, which depends on the energy of theprojectile. For nuclear stopping,
dε/dρ =
ε∫0
f (x)ε
dx (9.14)
where f (x) is the Thomas-Fermi scattering function (see reference [188] formore details). For electronic stopping, dε/dρ = kε1/2, with
k ∼= Z1/61
0.0793 Z1/21 Z1/2
2 (A1 +A2)3/2
(Z2/31 +Z2/3
1 )3/4 A3/21 A1/2
2
. (9.15)
100

Figure 9.9: The upper part of the mass-per-charge spectra for anthracene targets ion-ized by 11.25 keV He+ projectiles (upper left panel) and 22.5 kev He2+ projectiles(upper right panel), as well as for tetracene targets ionized by 27 kev He2+ projec-tiles (lower left panel) and 37.2 keV O3+ projectiles (lower right panel). The spectrafeature the main peaks due to loss processes, i.e. the losses of 2H/H2 and C2Hx. Thespectra are normalized to the intensities of the intact monocations, and the verticalscales are the same in all four panels.
For many systems k lies in the range from 0.1 to 0.2 [187], but if the projectileis much lighter than the target, higher values will be obtained. For both 129Xeand 16O projectiles k = 0.15 is a good approximation, but for 3He projectilesk = 0.71. These are the values use for k in figure 9.8, where dashed verticallines mark the values of ε1/2 for 360 keV 129Xe20+, 37.2 keV 16O3+, 11.25keV 3He+, and 22.5 keV 3He2+, which are projectiles used for experimentsdiscussed in this thesis. Clearly, for both 3He+ and 3He2+ projectiles elec-tronic stopping is the dominant energy transfer process, while nuclear stop-ping is relevant for the 129Xe20+ and 16O3+ projectiles. However, a very im-portant aspect which is not reflected in figure 9.8 is the distance at whichionization occurs. For 129Xe20+ it was already established in the previoussubsection that ionization predominantly takes place at large distances withlittle direct energy transfer. A similar conclusion, although not as extreme,is probably true for 16O3+. But for both 3He+ and 3He2+ projectiles small
101

Figure 9.10: Intensities of the C2Hx and H2 loss peaks for different PAH molecules,relative to the intensity of the respective parent ion.
enough impact parameters are expected for significant direct interaction withthe target molecule to occur. In these direct interactions the target moleculebecomes heated and vibrationally excited. If the excitation is strong enoughthe molecule may fragment.
Losses of small neutral atoms and small neutral molecules are the lowestactivation energy fragmentation channels for PAH molecules [46, 137–139].The most prominent ones are the losses of H, H2, and C2H2. These can, de-pending on the excitation of the molecule, be preceded or followed by addi-tional H-losses. In figure 9.9 I show examples of how these peaks relate toeach other and to the parent ion peak in cases with anthracene (C14H10) ortetracene (C18H12) target molecules. All four spectra in the figure are shownon the same intensity scale. The strongest contributions from loss processesare observed with 11.25 keV He+ projectiles on anthracene targets. This ismost likely due to a combination of large energy transfers in electronic stop-ping processes in small impact parameter ionizations, and the difference in thenumbers of internal degrees of freedom for C14H10 and C18H12. For 22.5 keVHe2+ projectiles less contributions from loss processes are observed becausein this case the impact parameters required for ionization are larger comparedto 11.25 keV He+ projectiles. For 27 keV He2+ projectiles on tetracene tar-gets there is less loss of C2Hx, but more of H2 loss compared to 22.5 keVHe2+ projectiles on anthracene targets. The exact cause of this is probablyrelated to the larger number of degrees of freedom in tetracene compared toanthracene, which would create a cooler cation not able to access as manyof the structural rearrangements required to emit a C2H2 unit. Another con-tributing factor could be that anthracene has a slightly larger ionization energy(7.4 eV [149, 150]) compared to tetracene (7.0 eV [189]) and this means thatanthracene targets generally experience smaller impact parameter ionizations.Differences in dissociation barriers and rate constants may also contribute tothe observed difference in peak intensities due to loss processes. For 37.2 keVO3+ projectiles on tetracene targets the contributions from loss processes are,
102

-H-2H
-3H-4H-CH3
+50 keV C14H10 + Xe11.25 keV He+ + C14H10
-C2H2
-C2H3-C2H4
Figure 9.11: A comparison of the loss peaks in the mass-per-charge spectrum for 50keV anthracene cations in collision with Xe target atoms (black line) and 11.25 keVHe+ ions in collision with neutral anthracene target molecules (red line). The spectraare normalized to the intensities of the 2H-loss peak.
for both the C2Hx-loss and H2-loss channels, less than with 27 keV He2+ pro-jectiles. Here, contributing factors to the observed difference could be largerimpact parameter ionizations with O3+ projectiles, but also that the velocity ofthe 37.2 keV O3+ projectiles is half of that of 27 keV He2+ projectiles, whichimplies less deposited energy in electronic stopping processes.
Figure 9.10 shows the total intensities of the C2Hx-loss and th H2-loss chan-nels, relative to the total intensity of the respective parent ion, for anthracene,tetracene, pyrene and coronene targets, ionized by He+, He2+, or O3+ pro-jectiles. The general difference between the pericondensed and catacondensedspecies is that there are fewer contributions from loss processes in the pericon-densed case. This is true also when comparing tetracene (C18H12) and pyrene(C16H10), even though the former has a larger number of degrees of freedomas well as a lower ionization energy (smaller impact parameters for ionization)compared to pyrene (7.4 eV [150]). The difference lies rather in the increasedstability of a pericondensed structure, making it more resilient to C2H2 loss.The increased stability for pericondensed PAHs has been observed in experi-ments [46, 47] and it can also be seen in theoretical calculations of adiabaticdissociation energies (cf. Table V in Paper IV).
This Part of the thesis mainly concerns experiments in which atomic ionscollide with neutral PAH monomer targets, but it is also possible to havethe opposite situation in which PAH ions collide with neutral atomic targets.The latter approach was used for the experiment in paper VI, in which thesame electrospray ion source and setup as described already in chapter 4 wasused, and which was also used for experiments with biomolecular ions. Here,C14H+
10 ions were used as projectiles and the target gas was Xe, for whichelectron transfer processes are negligible and energy should be transferredmainly through nuclear and electronic stopping processes. Figure 9.11 showsa comparison of the mass-per-charge region containing the loss peaks for 50keV anthracene cations in collisions with neutral Xe targets, and 11.25 keVHe+ projectile ions in collisions with neutral anthracene targets. The spectra
103

are normalized to the intensities of the 2H-loss peak. The two spectra over-lap well, which indicates that similar excitation energies are induced in theanthracene molecules/ions during the collisions.
I will now discuss in more detail the specific case of how C2H2 may beemitted from anthracene cations in a loss process.
Case Study II: C2H2 Loss from Anthracene MonocationsA large part of paper VI presents results from a computational study of reac-tion pathways that lead to the loss of C2H2 from anthracene cations. The pa-per also includes the loss of C2H2 and HCN from acridine cations, but theseresults will not be discussed further in this summary. All calculations werecarried out using the B3LYP functional and the 6-311++G(2d,p) basis set. Forfurther computational details, see paper VI.
Due to the delocalized π electrons, PAH molecules feature relatively strongC–C bonds and exhibit a general resilience to bending and rotation about thesebonds. Because of this it requires a lot of energy to break PAH C–C bonds ina direct manner. The C–H bonds, on the other hand, are of σ character, whichmeans that they are more easily bent or rotated. In addition, the low massof H atoms facilitates their mobility even further. These factors contributeto making the H atoms in PAH molecules relatively mobile. Thus, if a PAHmolecule becomes sufficiently hot, the H atoms are able to shift positionsin the PAH molecules, something often referred to as hydrogen scramblingor hydrogen randomization. The phenomena is well known from deuteriumlabeled experiments [142, 143, 190], and it has also been reported to occur inpeptides [144].
If a H atom bonded to a C atom shifts position to another C atom that isalready bonded to three atoms, the character of those bonds need to change,from being of double bond (π) type to having more of a single bond (σ ) char-acter, in order to bond to the shifted H atom. If the C that the H atom shifts topreviously was unhydrogenated, the orientation of the new C-H bond will beclose to perpendicular to the molecular plane, effectively disrupting the delo-calized π electrons for that carbon atom. These kinds of H migrations mark theonset for the C2H2-loss mechanisms described in paper VI for the anthracenecation, as they will weaken the C–C bonds to the C that received the H atom.
After a C–C bond has been broken different pathways open up dependingon which H atom that has migrated and to where. In paper VI a total ofthree fragmentation pathways were calculated for how C2H2 may be lostfrom anthracene monocations. One pathway is direct in the sense that theC2H2 is released from an outer ring with few reaction steps. The othertwo pathways proceed via structural changes to C14H•+10 isomers. Theisomerizations are driven by ring shift mechanisms. For the complete pictureof the calculated fragmentation pathways I refer to paper VI. A summaryof the three fragmentation pathways is shown in figure 9.12. It presentsthe structures of the C14H•+10 isomers anthracene•+ (1), phenanthrene•+
104

1
37
2 27
5
6
4.474.99
5.28
0
4.89
0.27
5.64
4.95
0.53
3.70
4.74
3.29
11
+ C2H2+ C2H2
+ H
+ C2H2
Figure 9.12: Summary of the three reaction pathways calculated for the release ofC2H2 from anthracene cations, together with the highest associated barrier. Alsoshown is the dissociation energy for H loss. Relative energies are given in eV.
(2), and cyclohepta[de]napththalene•+ (27), as well as the three differentC12H•+8 product isomers following C2H2 loss: 2-ethynylnaphthalene•+ (11),biphenylene•+ (6), and acenaphthylene•+ (5). Also shown in the figure isthe lowest dissociation channel structure following the loss of one H atom(37). Energies, relative to anthracene•+, are given for each structure aswell as for the highest energy barriers for isomerization and fragmentation.Clearly, isomerization and fragmentation are competing processes. The mostfavorable end product based solely on the energetics is acenaphthylene•+ (5).However, it also has the longest fragmentation pathway, featuring thirteentransition states, compared to seven for the formation of biphenylene•+
(6) and four for the formation of 2-ethynylnaphthalene•+ (11). So eventhough acenaphthylene•+ (5) should be present near the appearance energyfor C2H2, it is not necessarily the dominant fragmentation pathway whenthe other pathways become accessible. To determine the branching ratiosbetween different fragmentation channels one needs to study the kinetics ofthe systems. One common approach to determining unimolecular reactionrates involves Rice-Ramsperger-Kassel-Marcus (RRKM) theory. These typesof calculations have not been carried out for the reaction pathways obtainedfor the C2H2 loss from anthracene•+, but they do pose a natural continuationof the study and will hopefully be carried out in the not too distant future.
105

Figure 9.13: Distributions of CnH+x fragment intensities as functions of n, normal-
ized to the integrated intensities of the fragments and parent ions, for different pro-jectile ions. Left panel: Anthracene target molecules. Middle panel: Pyrene targetmolecules. Right panel: Coronene target molecules.
9.1.3 MultifragmentationThe lower mass region of the PAH mass spectrum contains series of CnHz+
xfragments (see e.g. figure 9.1). The most dominant charge state are the mono-cations, but dications are also observed and most prominently so when multi-ply charged projectiles are used. The origin of the CnHz+
x fragments dependsgreatly on the projectile ion. For low charge state keV ions the small impactparameters induce significant amounts of energies in electronic stopping pro-cesses, and in the higher tail end of these induced energy distributions thePAH molecules will be sufficiently hot to undergo fragmentations in multi-ple steps. For higher charge state keV ions the removal of multiple electronsleads to strong Coulomb repulsions within the ionized PAH molecules, whichin combination with weakening of C–C bonds due to the removal of multiplearomatic π electrons, may lead to fission of the PAH molecule. The manner inwhich the fragmentation occurs is reflected in the distributions of the CnHz+
xfragments.
The distributions of CnH+x fragments from anthracene, pyrene, and
coronene target molecules, normalized to all detected ions (fragments andintact ions), are shown for different projectile ions in figure 9.13 as functionsof the number of carbon atoms, n, in the fragments. For the low charge stateprojectiles there is more fragmentation and the distributions feature more ofthe larger sized fragments. Distributions due to collisions with high chargestate ions are, on the other hand, more dominant towards the lower sizedfragments, and especially n = 1 and 2 stand out. This is most likely due tofission processes that emit small singly charged fragments from multiplyionized parent molecules (cf. discussion in section 9.1.1 and papers IV andV).
Other striking features of the distributions in figure 9.13 are the even-oddoscillations, in which fragments with odd numbers of carbon atoms havelarger intensities than even ones. It is generally recognized that carbon clusters
106

Figure 9.14: Relative yield of CnH+x fragments from 22.5 keV He2+ ions colliding
with anthracene target molecules, for n = 2, 3, 4 and 5.
with n < 10 form linear structures [191]. The preferred bonding configurationwas early on believed to be cumulenic (:C=C· · ·C=C:) with near equivalentbond lengths [191]. Figure 9.14 shows the relative yield of CnH+
x fragments,as functions of x, for n = 2, 3, 4, and 5, when anthracene monomer targets areionized and fragmented in collisions with 22.5 keV He2+ ions. It clearly showsthat the most probable number of hydrogen atoms in the molecular fragmentsare two when n is even, and one when n is odd – a behavior that would notbe expected if the bonding configurations were the same for even and odd n.When n is odd the cumulenic bonding (only double bonds) is the only possibil-ity, but for even-n polyyne structures (·C≡C−C· · ·C−C≡C·) with alternatingbond lengths (alternating triple and single bonds) are also possible. Due totheir two unpaired electrons, polyyne structures are expected to easily bondwith two hydrogen atoms. This readily explains the pattern observed in figure9.14, and similar results have been reported from experiments by Postma etal. [55], and also from reaction experiments with carbon clusters and molec-ular hydrogen [192], as well as from sputtering of C84-covered surfaces byhighly charged keV Ions [193]. In addition, collision induced dissociationexperiments have revealed small odd-n pure carbon cations to have a largerdissociation energy than even ones [191], again hinting at a difference in thestructure of the chemical bonds. The larger dissociation energy for when n isodd is also consistent with the observed even-odd oscillations in figure 9.13,as it means that the odd-n structures are more stable than even-n structures.
9.2 Ionization and Fragmentation of PAH ClustersWhen the targets for the ion projectiles are pure PAH clusters, it is possibleto study the dynamics of such clusters as they are multiply ionized and/or in-ternally heated. Indeed, the ionization and fragmentation processes followingsuch actions take on a slightly different behavior compared to the case of puremonomer targets. These kinds of studies are the focus of papers VII and VIII,for which I will now briefly review some of the main experimental obser-
107

Figure 9.15: Left panels: Mass-per-charge spectra for anthracene clusters ionizedand fragmented by 11.25 keV 3He+ (top), 22.5 keV 3He2+ (middle), and 360 keV129Xe20+ (bottom) projectile ions. Note the linear vertical scale. Insets show the in-tegrated intensities of CnH+
x fragments, normalized to the total integrated intensitiesof all fragments and intact anthracene ions, as a function of n. Right panels: Clus-ter size-per-charge spectra for the same systems as those in the left panels. Note thelogarithmic vertical scale.
vations before moving on to more detailed discussions regarding theoreticalmodels for evaporation and ionization of PAH clusters.
The mass spectra for keV He+, He2+, and Xe20+ ions in collisions withanthracene cluster targets are shown in figure 9.15. Beginning with the leftpanels, they contain the lower parts of the mass spectra, which includes theC14H+
10 monomer peak and the CnHz+x fragments. When comparing these mass
spectra to those of the pure monomer targets in figure 9.1, the perhaps moststriking features are the greatly reduced intensities of CnHz+
x fragments, with
108

Figure 9.16: The intact anthracene monocation peak for anthracene monomer targets(black) and anthracene cluster targets (gray) following ionization by 11.25 keV He+
ions (left panel) and 360 keV Xe20+ ions (right panel).
a small yet dominant peaks due to C2Hx losses in the top and middle panels(He+ and He2+ projectiles), but a noticeable shift in the intensity distributiontowards larger CnHz+
x fragments in the bottom panel (Xe20+ projectiles). Theinsets in the left panels show the CnH+
x distributions as functions of n for boththe monomer targets (open symbols) and the cluster targets (closed symbols),normalized to the integrated intensities of the fragments as well as the parentions. For both He+ and He2+ projectiles the intensity distributions are rathersimilar in the two target cases, but with strongly reduced intensities for thecluster target. But for Xe20+ projectiles, the intensity distribution is shifted to-wards larger masses for the cluster target case. Particular note should be takento the much reduced intensity of the n = 2 group, and the greatly increasedintensity of the n = 12 group. The former was in the previous section arguedto be an indication of fission of multiply ionized anthracene, while the lat-ter is a low energy dissociation channel for hot anthracene cations. Thus, onecan conclude that the observed CnH+
x fragments are, following collisions withXe20+, charge driven in the case of monomer targets, but thermally driven inthe case of cluster targets. For He+ and He2+ projectiles the fragmentation isthermally driven in both target cases, but the greatly reduced fragment inten-sities in the cluster target case indicate that there are not as many anthracenemolecules hot enough to undergo fragmentation as in the monomer target case.Other noticeable differences in the cluster target mass spectra compared totheir monomer counterparts are the increased widths of the C14H+
10 peaks.This is highlighted in figure 9.16 where the C14H+
10 peaks for both monomerand cluster targets are normalized to their peak intensities and plotted togetherwhen ionized by He+ projectiles (left panel) and when ionized by Xe20+ pro-jectiles (right panel). Clearly, the peaks are wider for the cluster targets, andparticularly wide in the case of Xe20+. A widening of peaks in the time-of-flight mass spectrometer is (provided the experimental conditions are equal)
109

associated with increases in kinetic energy releases. Kinetic energy releasesincrease the initial velocities of the ions at the time of extraction, which cre-ates a larger spread in the flight times to the detector, and thus wider peaks inthe recorded mass spectra.
Turning back to figure 9.15 and now focusing on the right panels, which fea-ture the cluster parts of the mass spectra (note the logarithmic vertical scales).For all three projectile ions, the singly charged monomer dominates, and thereis a sharp decrease in peak intensities with increasing cluster size j. This clus-ter intensity distribution deviates greatly from the log-normal distribution pro-duced in the cluster source (cf. section 8.2.2) and thus shows that the clustersfragment strongly once they are ionized under the present experimental con-ditions. For both He+ and He2+ projectiles dications appear at j = 15. ForHe+ projectiles dications as large as j = 23 are detected, but it is difficultto resolve larger monocations than j = 11. The situation is similar for He2+
projectiles, except that monocations appear out to j = 21. In the case Xe20+
projectiles it is difficult to discern any larger sized clusters than j = 6. Allproduct cluster peaks are broadened due to kinetic energy releases. The peaksdue to smaller product clusters also feature tails extending on their right-handsides. Such tails would be expected if some of the clusters fragment duringthe extraction, in so-called delayed fragmentation processes. How this gives atail can be seen as follows: A cluster of size j is accelerated in the extractionregion at the onset of the extraction. At some point during the extraction thecluster is reduced in size to j−1 whereupon its acceleration is increased. Butbecause the larger acceleration began at a later point in time, as well as at ashorter distance before the end of the extraction region, this j−1 product willhave a longer flight time to the detector, and will consequently not end up inthe same peak as the j− 1 clusters formed before the onset of the extractionpulse. Further, it will not be in the j peak because clusters that remained ofsize j during extraction will have a longer flight time. Instead, the "delayed"j−1 fragment will end up somewhere in between the j−1 and j cluster peaksin the time-of-flight spectrum, and thus give rise to the tail feature. In addition,one can see features in the mass spectra that correspond to delayed fragmenta-tion during the field-free drift region of the time-of-flight mass spectrometer.As seen in figure 8.5, the metal plate at the end of the time-of-flight massspectrometer has a more negative potential than the field-free region, and thiscauses the cations to accelerate at the very end of their flight path. So if frag-mentation occurs in the field-free region, this can be seen as a small splittingof peaks in the mass spectra. This is indeed also observed. An enlarged viewof a cluster peak that features both delayed fragmentation features is shownin figure 9.17. Finally, no peaks that correspond to fusions between clusterconstituents, or clusters consisting of some intact anthracene molecules plusanthracene monomer fragments, can be seen in the cluster part of the clus-ter target spectra. Similar observations are also made for the coronene clustertargets (cf. paper VIII).
110

Intactj = 6
Delayedfragmentationduring extraction
Delayed fragmentationin the field-free region
Figure 9.17: The [C14H10]+6 peak following ionization by 22.5 keV He2+ projectileions, with marked features due to delayed ionization in the extraction region and inthe field-free drift region of the mass spectrometer.
With the above observations from the cluster target mass spectra, as wellas with the knowledge from the previous section of how PAH molecules frag-ment, it is now possible to draw a picture of how the ionization and frag-mentation of PAH clusters occur. For low charge state projectiles the targetsare ionized in small impact parameter collisions that transfer energy in mainlyelectronic stopping processes. For the present projectile velocity range Postmaet al. [55] calculated the electronic stopping to be of the order of several tensof eV. More specifically, for 22.5 keV 3He2+ projectiles, which have a veloc-ity of 0.55 a.u., a typical value for the electronic stopping is 40 eV per eachanthracene molecule hit [55]. Considering the cluster geometries (cf. section7.5) it is also not unlikely that several of the molecules in a cluster may behit for each ion trajectory. Following the ion interaction, the absorbed heat isredistributed within the PAH cluster. This is evident from the greatly reducedfragmentation in the lower part of the mass spectra, which means that mostPAH molecules are too cold to fragment. That only clusters consisting of intactPAH molecules (integer j) are observed indicates that the clusters rid them-selves of the heat absorbed in the collisions by evaporation of intact monomerunits. The charge has a higher probability to remain at the larger body of thetwo evaporation products, and thus mostly neutral monomers should be evap-orated. Evaporation can also be seen as the most likely action for hot PAHclusters considering the weak binding energies of the clusters (cf. section 7.5).From the dominance of the smaller cluster sizes, and in particular the intactsingly charged monomer, it seem evident that the evaporations generally occurin long sequences. Long evaporation sequences was also reported by Schmidtet al. [194] for coronene clusters excited by UV-laser radiation.
For the Xe20+ projectiles the observed large numbers of thermally drivenCnH+
x fragments are strong indications of very hot singly charged PAHmonomer ions. Also the large widths of the intact monocation peaks indicateviolent break-up processes. But there are very little of the larger cluster
111

sizes. From the monomer results in the previous section it is known thatXe20+ projectiles are able to ionize their targets at large distances with littlesimultaneous heating. It is also known that Xe20+ projectiles may multiplyionize monomer targets, so multiple ionizations could be an explanation forthe observed lack of larger cluster sizes. Such multiple ionization may causeCoulomb explosion of the clusters – a process in which significant partsof the Coulomb potential energy may be transferred to internal vibrationalmodes in the daughter ions. For example, the Coulomb energy for theoutermost charge of ten point-sized charges arranged on a line and separatedby 3.4 Å (the same distance as the intermolecular separation in the coroneneTS dimer, see figure 7.5) is 12 eV. But it is still surprising that no larger sizedclusters are detected, as such clusters should be able to both more internalenergy.
In the following two subsections I will discuss two models that give supportto the above interpretations. They also aid in explaining the main features ofthe mass spectra, such as the long evaporations sequences for low chargesstate projectiles, and the absence of larger product cluster sizes for the highcharge state projectiles.
9.2.1 An Evaporation Model for Neutral Monomer Emissionfrom Singly Charged PAH ClustersIn section 5.2.3 I described an evaporation model for the sequential evap-oration of water molecules from AMP-water complexes. A slightly modifiedversion of that model can be applied to the present scenario of monomer evap-oration from PAH clusters. First, remember that the rate of evaporation wasassumed to follow an Arrhenius type equation
Γ = A exp(−Ed/kBT ). (5.1)
The same equation may be used to determine how PAH clusters decrease insize as a function of time. But before equation 5.1 can be applied to PAHclusters, one needs to be able to determine the temperature of a PAH clusterfor a given internal energy. For the AMP-water complexes, the internal energywas treated classically with all vibrational modes active and with equal sharesof the intramolecular vibrational energy Evib
intra, i.e.
Evibintra = (3N−6)kBT. (9.16)
where N is the total number of atoms in the molecule. However, a more accu-rate description is to take the effect of finite temperatures into account. This ismuch simpler for PAH clusters, which consist of planar rigid structures, thanfor AMP-water complexes with the more flexible AMP structure. Pure PAHcluster can also be assumed to display bulk like properties, while computationof the intra- and intermolecular vibrational modes of the numerous conforma-
112

Figure 9.18: Energy-temperature relation for different expressions of the inter-and intramolecular vibrational energy per coronene molecule for bulk coronene.(Evib
intra)classical is calculated using equation 9.16, (Evibinter)classical is simply 6kBT ,
(Evibintra)harmonic is calculated using equation 9.18 with vibrational frequencies from
DFT calculations (see text), and (Evibinter)harmonic is also calculated using equation 9.18,
but with vibrational frequencies from Rapacioli et al. [165]. Inset shows an enlargedview of the difference between (Evib
inter)classical and (Evibinter)harmonic.
tions of AMP-water complexes is a difficult task at best. For PAH moleculesit is therefore possible to use the harmonic approximation and express the av-erage thermal energy of the ith vibrational mode, ωi, in thermal equilibrium as(see e.g. ref [195])
Evibi =
12
hωi +hωi
exp(hωi/kBT )−1(9.17)
where the first term is the zero-point energy and h is the reduced Planck con-stant. The kBT energy in the Arrhenius equation (5.1) does not include zero-point energy effects as it only refers to the excitation energy relative to theground state. Therefore the first term is equation 9.17 can be neglected andthe total intramolecular vibrational energy in one PAH molecule becomes
Evibintra =
3N−6
∑i=1
hωi
exp(hωi/kBT )−1. (9.18)
The intermolecular energy between molecules in PAH clusters can likewisebe obtained from the harmonic approximation. The vibrational frequenciesfor these are however more difficult to calculate as they depend on the geo-metrical structures of the clusters. Dimer intermolecular vibrational frequen-cies were reported by Rapacioli et al. [165] for coronene. If these frequenciesare assumed to be representative of the intermolecular modes regardless ofcluster size, it is possible to compare these intermolecular energies to the clas-sical value of 6kBT , which represents the intermolecular vibrational energy in
113

bulk PAH material at high T . Figure 9.18 shows the inter- and intramolecu-lar vibrational energies for coronene according to both the classical expres-sions (6kBT and equation 9.16) and the harmonic approximation (equation9.18 applied to both inter- and intramolecular vibrational frequencies). Alsoshown is the sum of the intramolecular vibrational energy according to theharmonic approximation and the classical intermolecular vibrational energy.Intermolecular vibrational frequencies are taken from Rapacioli et al. [165],while the intramolecular vibrational frequencies are from DFT calculations atthe B3LYP/6-311++G(2d,p) level of theory. The latter frequencies are listedappendix B for anthracene and coronene. As seen in figure 9.18 there is anoticeable difference between the classical and the harmonic intramolecularvibrational energy. This is because not all vibrational modes are active at lowtemperatures. Also note that there are very small differences between the har-monic and classical intermolecular energies. For this reason the much simpler6kBT expression is used for the intermolecular vibrational energy, and the totalvibrational energy per molecule in a PAH cluster may be written as
Evibtot (k)
k=
3N−6
∑i=1
hωi
exp(hωi/kBTk)−1+
k−1k
6kBTk. (9.19)
With an expression for how the internal vibrational energy depends on thetemperature it becomes possible to look at how a PAH cluster cools off asneutral monomer units are evaporated. Following evaporation, the internal en-ergy in the cluster decreases by the dissociation energy Ed for the emitted unitas well as the kinetic energy release. The latter is assumed to be the average ofthe sum of the translational and rotational energy, i.e. (6/2)kBT . In addition,the vibrational energy should be reduced by the internal vibrational energy ofthe emitted monomer. Thus the total reduction in internal energy is
Evibtot ( j−1) =
[1− 1
j
][Evib
tot ( j)− 62
kBTj−Ed( j)]
(9.20)
for 2 ≤ j ≤ k. Dissociation energies were reported for single stacks of singlyionized coronene molecules by Rapacioli et al. [172]. According to their cal-culations, Ed decrease from 1.3 eV for the dimer to 0.9 eV for the octamer.This behavior is shown in figure 9.19, which also includes scaled dissocia-tion energies for anthracene. The scaling is done by the factor 3/7, whichcorresponds to the ratio of benzene-like rings in the two molecules, and theresult agrees well with the binding energies reported for the singly ionized an-thracene dimer [159]. For cluster sizes larger than eight, a constant value of 0.8eV is used as the dissociation energy for coronene clusters [172], and a corre-spondingly scaled value for anthracene clusters, which again reproduce valuesreported by more accurate calculations of the anthracene dimer [159,168,169].Binding energies similar to those of neutral dimers can be expected for largersingly ionized cluster sizes as the cluster charge delocalizes towards the clus-ter center (cf. section 7.5 and Rapacioli et al. [172]). With the dissociation
114

Coronene
Anthracene
Figure 9.19: Dissociation energiesfor singly charged coronene (squares)[172] and anthracene (circles) clusterstacks as functions of cluster size. Theanthracene values are the coronenevalues scaled by the factor 3/7 (seetext).
Coronene
Anthracene
Figure 9.20: The decrease in tem-perature according to the evaporationmodel for coronene (squares) and an-thracene (circles) clusters with an ini-tial size of k = 12 and internal energiesof 4.8 eV/k for the coronene clusterand 1.2 eV/k for the anthracene clus-ter.
energies of figure 9.19, the decrease in internal temperature for an initial clus-ter size of k = 12 is shown in figure 9.20 for a coronene cluster with initially4.8 eV per molecule, and for an anthracene cluster with initially 1.2 eV permolecule.
Having established how the internal energy in a PAH cluster depends on itstemperature, and how the temperature of a singly ionized cluster decreases asneutral monomer units are evaporated, I now return to the Arrhenius expres-sion of equation 5.1 and the formulation of the differential equations neededto solve for how a cluster of k PAH molecules decreases in size as a functionof time. Using the same notation as in equation 5.3 with c j as the number ofclusters of size j ≤ k, the differential equations become
dck
dt=−Γk−1ck
dck−1
dt= Γk−1ck−Γk−2ck−1
...dc j
dt= Γ jc j+1−Γ j−1c j
...dc1
dt= Γ1c2−Γ0c1
dc0
dt= Γ0c1
(9.21)
115

Figure 9.21: Total cluster vibrational energy per molecule required to completelyevaporate clusters of size k coronene (squares) or anthracene (circles) molecules.Dashed lines represent different values of κ – an upper limit for the number ofmolecules within the clusters that a 22.5 keV 3He2+ projectile typically must passthrough in order to induce complete evaporation (see text).
where j = 0 designate the fragmentation of the remaining singly charged PAHmonomers themselves. A dissociation energy of 4.5 eV, which correspondsroughly to the dissociation energy for loosing a neutral hydrogen atom, isassumed for PAH monomer fragmentation. The model I have just describedresembles the evaporative model used by Schmidt et al. [194] to describecoronene clusters as evaporative ensembles, and it is also able to reproducethe essence of their results.
In paper VIII the differential equations (9.21) were solved to find the dis-tribution of different initial cluster sizes after 0.6 µs, which corresponds tothe average time between ionization and extraction in the time-of-flight massspectrometer. The initial internal energy was then tuned so that 99 % of theparent cluster intensity ended up in the monomer peak or became a fragmentthereof. This may somewhat arbitrarily be referred to as complete evapora-tion of the parent cluster. Figure 9.21 shows the internal vibrational energyper molecule required to completely evaporate singly charged clusters of an-thracene or coronene molecules up to k = 100. In these calculations the pre-exponential factor A in equation 5.1 was set to 1015 s−1. The general resultsfrom the model are not very sensitive to A (cf. discussion in paper VIII). TheEvib
tot /k for k = 12 was the energies used as input parameters to generate figure9.20.
With the 40 eV electronic stopping discussed in section 9.2 taken as theaverage energy transferred to a cluster per constituent PAH molecule hit by a22.5 keV 3He2+ projectile, it is possible to estimate how many molecules, κ ,in the cluster that the projectile must pass through in order to induce completecluster evaporation. The dashed lines in figure 9.21 are curves of Evib
tot /k =
116

Figure 9.22: Internal energy distribution assumed in Case Study III.
40κ/k eV for different values of κ , and represent upper limits for completeevaporations. From this picture it is evident that the projectile ion need onlyto pass through a few molecules in an anthracene cluster for it to evaporatecompletely. The limit is higher for coronene clusters, which is reasonable con-sidering the larger number of degrees of freedom in coronene molecules, aswell as their stronger intermolecular binding energies, which makes them ableto store more internal energy prior to evaporation. This is also in agreementwith what is observed in the mass spectra (see figures 2 and 3 in paper VIII)where more of the larger cluster sizes are observed for coronene cluster targetscompared to what is the case with the anthracene cluster targets.
Case Study III: Evaporation of a Log-Normal Distribution of AnthraceneClustersIn this case study I will apply the evaporation model to the case when 22.5keV 3He2+ ions collide with a log-normal distribution of neutral anthraceneclusters. In order to do so two assumptions have to be made in addition to theones already described. The first is the shape of the initial cluster distribution,and the second is the distributions of internal energies for each cluster size.The first assumption is handled by assuming the log-normal distribution fromfigure 8.4, which should serve well as an approximation for the neutral clus-ter size distribution. But the second assumption is more difficult. Since theclusters are internally cold prior to interaction with the He2+ projectile, theirexcitation energies following the interaction should resemble the distributionsof electronic stopping energies. From Postma et al. [55] and earlier discus-sions in this work it is known that the peak of electronic stopping energiesis at 40 eV for the interaction of a 22.5 keV 3He2+ projectile ion with oneanthracene molecule. This peak then trails off into a long tail-like feature forhigher stopping energies [55]. A somewhat arbitrary distribution of internalenergies, composed of two Gaussian functions, is therefore assumed. The sumof the two Gaussian functions peak at 40 eV, and one of the Gaussian func-
117

Figure 9.23: Upper panel: The initial distribution of anthracene cluster sizes assumedin the case study. Lower panel: The final distribution of anthracene clusters accordingto the model. Inset shows a comparison between the model results (in blue) and theexperimental results (in red) for 1≤ j ≤ 4, with an enlarged view for 2≤ j ≤ 4.
tions is made wide to resemble the tail feature in reference [55]. The appear-ance of the resulting internal energy distribution is shown in figure 9.22. Foran anthracene cluster the probability to hit more than one anthracene moleculeshould scale with the size of the cluster. This relation is chosen somewhat ar-bitrarily in the use of the factor
√k. With this factor a He2+ projectile would
on average pass through 1.4 molecules in a k = 2 cluster, and 10 molecules ina k = 100 cluster, which seem like reasonable figures. A more accurate scalingcould e.g. be obtained by Monte Carlo simulations of known cluster geome-tries or crystalline structures, but such calculations have not been carried outfor the present work. It should therefore be stressed that the results of thiscase study are very crude. Nonetheless, it provides an interesting test for theevaporation model.
Figure 9.23 shows the initial log-normal anthracene cluster distribution (up-per panel) and the final cluster distribution after 0.6 µs (lower panel). Inthe experiment it was found that 86 % of the total cluster intensity is in themonomer peak. The corresponding figure from the model is 88 %. The inset in
118

the lower panel shows a comparison of the experimental and the model resultsfor 1≤ j≤ 4, where the intensities have been normalized to the peak intensityof the monomer. The model underestimates the intensity in the j = 2 peak,gives good agreement for the j = 3 peak, and overestimates for j ≥ 4. Thesediscrepancies reflect the crudeness of this specific case study, but also empha-size that the model may be used to describe the bulk behavior of PAH clusterevaporations, but does not include the finer points of the processes involved inthe ion-PAH collisions.
9.2.2 Modeling Multiple Ionization of Single Stack CoroneneClustersOne surprising result from the studies of Xe20+ ions in collisions with PAHclusters is the absence of larger sized clusters in the mass spectra. In paperVIII this feature is explained as an increased propensity for multiple ion-izations with increasing cluster size, which then facilitates their destructionthrough Coulomb explosions. Clusters of coronene molecules were used inthe calculations to reach this conclusion, and the main reason for this is thatthe coronene cluster geometries, at least for smaller cluster sizes, are morewell defined for than for other PAH molecules. As long as the size of thecoronene clusters does not exceed eight molecules, the preferred structureseem to be that of single stacks [165]. This greatly facilitates calculations ofcoronene cluster ionization energies. Considering the large similarities in thefragmentation behaviors when Xe20+ projectiles collide with both anthraceneand coronene clusters (cf. papers VII and VII), but also with pyrene and flu-oranthene clusters [56], the general conclusions should be valid for all PAHclusters.
The coronene cluster stacks for which the ionization energies were cal-culated were constructed with the use of the optimized coronene monomerstructure of Zhao and Truhlar [58], who performed this calculation, as well ascalculations of several neutral coronene dimer structures, with the use of theirown developed M06-2X functional (cf. chapter 2). Because this functionalshows good agreement with high level ab initio calculations [160], and be-cause the "standard" B3LYP functional is ill suited to describe the dispersionforces important to weakly bound neutral clusters, the M06-2X functional waschosen for the calculations in paper VIII. The cluster stacks were constructedin the twisted sandwich (TS) configuration [58], i.e. parallel molecular planeswith each molecular plane rotated 30◦ with respect to neighboring planes.These planes were separated by the fixed distance of 3.4 Å – the same distanceas the optimized TS dimer structure of Zhao and Truhlar [58]. The geometryfor the k = 5 stack is shown in figure 9.25. Single point calculations of theionization energies up to the fourth ionization energy were then carried outfor cluster sizes 1 ≤ k ≤ 5. Even though this approach involved non-relaxed
119

Figure 9.24: Calculated ionization energies as functions of charge state z for coronenecluster stacks with 1≤ k≤ 5. Solid lines are linear fits to each cluster size data set anddashed lines represent extrapolations to larger cluster sizes using equation 9.23.
coronene cluster structures, it was found to agree well with calculations ofrelaxed dimer structure (cf. discussion in paper VIII).
Figure 9.24 shows the calculated ionization energies as functions of clus-ter charge state z. For each cluster size the ionization energies clearly followlinear trends. In section 9.1.1 the classical electrostatic expression for the ith
ionization energy was (in atomic units) given as
IEi =W +i−1/2
C. (9.10)
With energy in units of eV and capacitance in units of F, and with i = z+ 1,the above expression can for cluster size k be rewritten as
IEz+1k =Wk +
e2(z+1/2)Ck
(9.22)
where e is the elementary charge. The solid lines in figure 9.24 are linear fits tothe calculated ionization energies using equation 9.22. These fits display con-stant Wk and a linear increase in C with increased k (cf. table I in paper VIII),such that the ionization energies for coronene clusters may be summarized as
IEz+1k>1 = 5.457+
z+1/20.046k+0.237
eV. (9.23)
Thus, the slope of the ionization energy sequence for a given charge state willdecrease with increasing cluster size. This trend is highlighted by using equa-tion 9.23 to plot the ionization energies for k = 10, 25, and 50 as dashed linesin figure 9.24. It is important to emphasize that cluster geometries other thansingle stacks are most likely preferred for cluster sizes with k ≥ 8, and equa-tion 9.23 may not be as accurate in these cases. The general conclusion from
120

Figure 9.25: Qualitative picture illustrating that the relative cross section for multipleelectron capture increases with PAH cluster size. Left: First and multiple electroncapture cross sections for the coronene monomer. Right: First and multiple electroncapture cross sections for a coronene cluster with k = 5. The displayed k = 5 stackcorrespond to the geometry used to calculate the ionization energies for figure 9.24.
these calculations is however still valid, i.e. that multiple electron removal be-comes increasingly important in relation to single ionization with increasingcluster size. This is qualitatively visualized in figure 9.25, where the the leftcircles illustrate cross sections and capture distances for single and multipleelectron captures from a coronene monomer. For clusters (right circles) thecapture distances have increased, but the single electron capture cross sectionhas also been greatly reduced in relation to that for multiple electron capture,which thus increases the probability for multiple electron captures.
121


10. Summary of Part II
Polycyclic aromatic hydrocarbon (PAH) molecules are surprisingly stablecompounds considering their high degree of unsaturated bonds, and to largeextents they owe their stability to having sp2 hybridized carbon atomicorbitals and a system of delocalized π electrons, which generally makes PAHmolecules prefer a planar molecular structure. Studies of PAH moleculesare important, e.g., because they are model representatives of aromaticmolecules, which are essential to all living organisms, while at the same timebeing dangerous to most life in their pure PAH form. It is also generallyaccepted that PAH molecules are present in the interstellar medium, wherethey contribute greatly to the thermal and ionization balance and may be animportant base for grain formation.
This Part of the thesis has discussed various aspects of the stabilities, energyflow processes, and charge mobilities in PAH molecules as well as weaklybound PAH clusters, supported by both experimental and theoretical results.The experimental method has mainly been to collide keV ions with neutralmonomer or cluster targets, which allows different properties of the targets tobe probed depending on the type of projectile ion being used. Low charge stateprojectiles ionize the targets in small impact parameter collisions and trans-fer significant energies predominantly in electronic stopping processes. Highcharge state projectiles ionize the targets at larger impact parameters in whichelectrons are removed with little or no direct target heating. Little to moder-ately heated PAHs fragment by evaporation of smaller atomic or molecularsubunits, mainly in the form of H atoms, H2 molecules, or C2H2 molecules.In these processes structural rearrangements, often initiated by internal mi-grations by mobile H atoms, may play important roles. Strongly heated PAHsmay also fragment in multiple steps that leave smaller sized CnHx fragmentsthat are mostly singly or doubly charged, depending on the charge state of theprojectile ions. When the PAHs are multiply ionized they may fragment inCoulomb explosions, which generally favor the formation of CnH+
x fragmentswith low n. Indeed, the emission of C2H+
2 seems to determine the ultimatestability limit of multiply ionized PAH molecules.
From the studies of keV ions colliding with PAH clusters it can beconcluded that both charge and vibrational excitation energy is redistributedwithin the clusters prior to dissociation. Effective energy transfer mechanismsfor light and low charge state ion projectiles lead to internally very hotionized PAH clusters that are reduced in size through long sequences of
123

neutral monomer evaporations. The behavior is well reproduced by a simpleevaporation model, which illustrates that comparatively few molecules in thePAH clusters need to be hit by the projectile ion in order to induce completeevaporation down to the singly charged monomer – the most dominant ionin the mass spectra. Similar mass spectra are obtained with highly chargedprojectile ions, but in this case the fragmentation mechanism is most likelydifferent. Quantum chemical calculations of ionization energies illustrate thatthe probability for multiple ionizations increases with increasing cluster size,meaning that larger clusters are more prone to be multiply ionized and thusmore prone to Coulomb explosions compared to the smaller clusters wheresingle ionization is more important. The effects of Coulomb explosions arevisible in the mass spectra as increased kinetic energy releases in the detectedsingly charged PAH monomer peak, as well as an increased propensity forPAH monomer fragmentation in thermally driven processes.
124

11. Outlook
Parts of this thesis that may readily continue in future work are the calcula-tions of reaction pathways for C2H2 loss from anthracene monocations. Al-though the calculations provide an overview of the competing fragmentationchannels and highlight the importance of hydrogen shifts and isomerizationprocesses, they contain no information regarding the rates at which these pro-cesses proceed. There are several approaches to the theory of unimolecularreaction rates, and one which is widespread is the Rice-Ramsperger-Kassel-Marcus (RRKM) theory (see e.g. reference [196]). It models a molecule as acollection of coupled harmonic oscillators and assumes the redistribution ofinternal vibrational energy to be much faster than the reaction rate. It wouldbe very interesting to calculate reaction rates for C2H2 loss from anthracenecations and explore the relative importance of the calculated reaction path-ways as a function of the internal energy, as well as to explore the competitionbetween the C2H2 loss and the H loss channels.
Experimentally, more insight into the fission processes that seem to beimportant fragmentation channels for multiply ionized PAH molecules maybe gained by coincidence measurements. With information of which ionizedproducts are formed from single interactions between highly charged ions andPAH monomer targets it becomes possible to determine the branching ratiosbetween, e.g., the C2H2 loss and the C2H+
2 loss channels. Also experimentswith cluster targets have a lot to gain by coincidence measurements, as it thenbecomes possible to gain further insight into the fission processes that seem tobe so important following multiple ionizations. Efforts are currently underwayat the experimental facility in Caen to prepare coincidence measurements invarious experiments with PAH monomers and clusters.
Looking further into the future, more information about the properties andbehaviors of both biomolecules and PAH molecules may be obtain with theDouble ElectroStatic IonRing ExpEriment, or DESIREE, which is a new ex-perimental facility in its final stages of construction at Stockholm Univer-sity [197, 198]. It features two electrostatic ion storage rings joined togetherby a common straight section. Both rings are enclosed in an extremely highvacuum chamber, which can be cooled down to 10 K by the use of four closed-system helium cryogenerators. Figure 11.1 shows a schematic of the DE-SIREE chamber, a top view of the two storage rings, and a photograph of theelectrostatic elements mounted inside the chamber. For ions stored in a storagering there is sufficient time for them to relax and reach thermal equilibrium
125

a)
c)
b)
Figure 11.1: a) 3D drawing of DESIREE. b) Photo of the inner chamber with gold-plated electrostatic elements mounted. c) Top view schematic of the two electrostaticstorage rings. The lower ring is for storage of heavy ions and the upper ring is forstorage of lighter ions.
with the surrounding walls, and thus allow for better control of their internalstates. The double-ring configuration also allows for anions and cations to bestored simultaneously by having one species in each ring, and merged beamsexperiments can be carried out in the common straight section with very pre-cise relative collision energies, down to about 10 meV. The ions themselvesare stored at kinetic energies of 5-100 keV. The electrostatic configurationalso facilitates the storage of heavy ions, such as PAH molecules/clusters andbiomolecules.
To enable experiments with DESIREE on heavy ions, such as biomolecules,a new high-voltage electrospray ion source (ESI) platform is also built atStockholm University [101]. A drawing of this platform is shown in figure11.2, and it differs from the one described in chapter 4 in several respects.First, the new source has an ion funnel that allows for a more efficient col-
126

}}
}
}
heated capillary
ion funnel
octupole accumulation trap
octupole ion guide
gate valve
quadrupole mass filter
acceleration focusing/steering
focusing/steering
coldhead
detector
cold ringelectrodetrap
acceleration/decelerationfocusing/steering
quadrupole deflector
Figure 11.2: The ESI platform, which is mounted in a laboratory next to theDESIREE-lab at Stockholm University.
lection of ions from the heated capillary into the next pumping stage, whichcontains an octupole accumulation trap. The accumulated ions are then ex-tracted in bunches and are mass-to-charge selected by means of a quadrupolemass filter prior to injection into a cold ring-electrode trap. The cold trap canbe used for further accumulation of ions before ejection from the trap for sin-gle pass experiments or injection into DESIREE. This method of producingions for DESIREE allows for increased ion beam densities by accumulationand bunching of the ion beams. Furthermore, the use of cold helium buffer gasin the ring-electrode trap allows the production of internally cold molecularions even for infrared inactive species.
DESIREE together with the new ESI platform will allow for new and ex-citing experiments on both biomolecules and PAH molecules/clusters. For ex-ample, with protonated biomolecules in one storage ring and molecular anionsin the other ring, it is possible through control of their relative velocities andinternal states to bring a new dimension to the study of electron transfer dis-sociation (ETD) [199] processes, which relates strongly to electron capturedissociation (ECD) and electron capture induced dissociation (ECID). Simi-larly, DESIREE will allow for new ways to study processes relating to radi-ation damages on systems similar to the hydrated AMP anions discussed inthis thesis, and also open up for new studies on biomolecular complexes. Toaid in the formation of hydrated species, a second ion funnel for the new ESIplatform is currently under construction. It will feature a water vapor inlet
127

system to facilitate the production of hydrated biomolecules. A similar designhas been reported as successful in producing, e.g., hydrated peptides [200].
An important advantage of the new ESI platform is its modular design.It is built so that the ESI part may be exchanged for other ion sources, andthus permit the use of other kinds of ions that also would benefit from beingcooled prior to injection into DESIREE. Therefore ion sources such as elec-tron impact ion sources or sputter-type ion sources, to name only a couple,may be used to produce molecular ions for accumulation and injection intoDESIREE. With, e.g., PAH anions in one ring and highly charged cations inthe other, it is possible to study PAH charge stabilities under truly cold condi-tions. Another interesting experiment would be to produce negatively chargedPAH clusters, e.g. with a similar method used to obtain figure 8.4, and performsimilar merged beams experiments on mass-to-charge selected PAH clustersand highly charged ions.
The suggested experiments described above are only a few of the ones madepossible with DESIREE and the new ESI platform. These are sure to providenew and exciting information on the properties of both biomolecules and PAHmolecules, as well as other complex molecular systems.
128

Appendices


A. Energies and Nuclear Coordinatesfor Multiply Charged AnthraceneReaction Pathways
Cartesian coordinates of the optimized molecular structures in figures 9.6 and 9.7,calculated at the B3LYP/6-31G(d) level of theory. Energies are in units of Hartree.
Table A.1: 15+
Sum of electronic and zero-point Energies= -536.280887
Atom X Y ZC -0.748271 3.773878 -0.000002C -1.454372 2.522007 0.000002C -0.725642 1.242843 0.000007C 0.766071 1.247958 0.000007C 1.455995 2.501970 0.000002C 0.705884 3.778087 -0.000003C 1.475510 -0.000026 0.000007C 0.766009 -1.247997 0.000006C -0.725696 -1.242808 0.000007C -1.454489 -2.521944 0.000002H -2.554408 -2.535177 -0.000002C -0.748436 -3.773847 -0.000005C 0.705725 -3.778113 -0.000002C 1.455882 -2.502036 0.000002H -1.303237 4.727397 -0.000012H -2.554291 2.535289 -0.000001H 2.555210 2.556032 -0.000003H 1.261574 4.732935 -0.000009H 2.572920 -0.000059 0.000003H -1.303439 -4.727346 -0.000009H 1.261367 -4.732988 -0.000011H 2.555095 -2.556141 0.000000C -1.434037 0.000032 0.000008H -2.531097 0.000054 0.000004
Table A.2: 16+
Sum of electronic and zero-point Energies= -535.176684
Atom X Y ZC -0.697831 3.776640 0.206783C -1.412528 2.554014 -0.132619C -0.746417 1.240080 -0.050100C 0.745922 1.240190 0.036223C 1.412278 2.554251 0.115676C 0.697944 3.776259 -0.226394C 1.465343 -0.000129 -0.009664C 0.745664 -1.240346 -0.051601C -0.746133 -1.240292 0.043056C -1.411917 -2.554277 0.129314H -2.448936 -2.676647 0.534249C -0.699742 -3.776942 -0.214604C 0.698546 -3.776477 0.210578C 1.411260 -2.554637 -0.135150H -1.181660 4.680023 0.685799H -2.452058 2.676651 -0.530972H 2.451810 2.677444 0.513800H 1.181952 4.678814 -0.706704H 2.566814 -0.000153 -0.012611H -1.186538 -4.680495 -0.690166H 1.184949 -4.679121 0.688314H 2.448477 -2.677929 -0.539261C -1.465835 -0.000046 -0.001493H -2.567306 -0.000048 0.001561
131

Table A.3: 17+
Sum of electronic and zero-point Energies= -533.920275
Atom X Y ZC -0.686444 3.821261 0.288331C -1.420845 2.583207 -0.055787C -0.733014 1.237006 0.030185C 0.736898 1.235566 0.030671C 1.426959 2.580332 0.121440C 0.694400 3.820632 -0.218406C 1.472625 -0.031071 -0.022541C 0.758789 -1.303067 -0.037481C -0.759754 -1.301742 0.090292C -1.459602 -2.581183 0.177814H -2.524090 -2.741067 0.533803C -0.685442 -3.807929 -0.239838C 0.680239 -3.810479 0.284479C 1.456481 -2.583296 -0.129016H -1.139389 4.701128 0.891542H -2.457843 2.721658 -0.494719H 2.464236 2.715599 0.560741H 1.148508 4.701286 -0.819662H 2.580664 -0.021690 -0.045619H -1.098566 -4.598603 -0.994790H 1.092495 -4.605020 1.035731H 2.520752 -2.743830 -0.485133C -1.471110 -0.028612 0.079458H -2.579134 -0.017143 0.102799
Table A.4: 18+
Sum of electronic and zero-point Energies= -532.513909
Atom X Y ZC -0.668535 3.860358 0.301563C -1.467890 2.613570 -0.125378C -0.752625 1.297729 -0.011031C 0.755977 1.295596 0.049676C 1.475238 2.610111 0.156327C 0.679431 3.856560 -0.277829C 1.484881 0.000157 0.023783C 0.752247 -1.293290 -0.003124C -0.756554 -1.290982 0.055462C -1.475593 -2.604856 0.168514H -2.538540 -2.781780 0.577277C -0.679581 -3.853484 -0.257178C 0.667897 -3.853648 0.323905
Continued on next column/page
Atom X Y ZC 1.467364 -2.609964 -0.109264H -1.056370 4.633332 1.144481H -2.530040 2.793407 -0.534590H 2.537758 2.789322 0.565008H 1.069390 4.623201 -1.125528H 2.600576 -0.001492 0.024776H -1.068673 -4.625820 -1.100278H 1.054707 -4.621817 1.171864H 2.529972 -2.792204 -0.516731C -1.485350 0.004503 0.021655H -2.601050 0.006185 0.020485
Table A.5: 19+
Sum of electronic and zero-point Energies= -530.963934
Atom X Y ZC -0.688297 3.998958 0.250041C -1.447489 2.738432 -0.252405C -0.725085 1.362245 -0.024465C 0.739912 1.358400 0.078119C 1.470489 2.732239 0.291923C 0.719248 3.992223 -0.223787C 1.486917 -0.000142 0.045830C 0.732449 -1.354156 0.000687C -0.734170 -1.349353 0.079724C -1.468212 -2.720987 0.296183H -2.479987 -2.891639 0.869344C -0.708674 -3.986173 -0.194574C 0.691061 -3.987710 0.301959C 1.458328 -2.732649 -0.201075H -1.166251 4.819440 1.084476H -2.448863 2.915066 -0.841909H 2.472907 2.908845 0.879604H 1.201960 4.800745 -1.067335H 2.615203 -0.003571 0.055591H -1.178023 -4.803830 -1.036814H 1.155041 -4.799796 1.152903H 2.468936 -2.915245 -0.772691C -1.480337 0.008806 0.021806H -2.608626 0.012178 0.012449
Table A.6: (TS1-38)6+
Sum of electronic and zero-point Energies= -535.121490
132

Atom X Y ZC -0.778179 3.852660 0.255245C -1.624241 3.174644 -0.536652C -0.693556 1.001076 -0.055149C 0.700577 1.263417 -0.082285C 1.373827 2.518554 0.027510C 0.686328 3.798311 0.108765C 1.452273 -0.053734 -0.184595C 0.784812 -1.288217 -0.076323C -0.710303 -1.368753 0.044602C -1.383526 -2.651955 0.198625H -2.486757 -2.757356 0.137878C -0.623989 -3.859437 0.438958C 0.684320 -3.793228 -0.173054C 1.483632 -2.553461 -0.019660H -1.250334 4.453194 1.131151H -2.383185 3.219896 -1.376000H 2.477348 2.568613 0.080675H 1.257675 4.764094 0.143747H 2.544499 0.012256 -0.338387H -1.066612 -4.790165 0.884460H 1.039289 -4.627381 -0.857152H 2.579344 -2.664220 0.172421C -1.477455 -0.106795 0.030409H -2.585961 -0.112012 0.044810
Table A.7: (TS1-38)7+
Sum of electronic and zero-point Energies= -533.881155
Atom X Y ZC -0.753213 3.892359 0.244888C -1.661586 3.141350 -0.448200C -0.704846 1.045253 -0.036691C 0.704963 1.260351 -0.040245C 1.404691 2.540111 0.055388C 0.699348 3.868660 -0.019411C 1.458434 -0.057578 -0.097602C 0.772598 -1.328210 -0.029778C -0.736849 -1.373821 0.020022C -1.428016 -2.679986 0.067718H -2.524449 -2.838427 -0.141192C -0.623078 -3.891501 0.396895C 0.694571 -3.840817 -0.237189C 1.493415 -2.591835 0.025570H -1.165624 4.484920 1.194341H -2.519607 3.226787 -1.210755
Continued on next column/page
Atom X Y ZH 2.511637 2.606559 0.199825H 1.266353 4.839318 -0.238289H 2.565652 -0.007397 -0.179961H -0.996727 -4.746062 1.083125H 1.035309 -4.634823 -1.013574H 2.592005 -2.721970 0.257442C -1.485977 -0.100784 0.044934H -2.599176 -0.092456 0.102736
Table A.8: (TS1-38)8+
Sum of electronic and zero-point Energies= -532.486157
Atom X Y ZC -0.725313 3.969081 0.249655C -1.674028 3.115198 -0.334423C -0.721862 1.087874 -0.015479C 0.709325 1.263341 -0.008427C 1.418639 2.552185 0.123223C 0.685431 3.935873 -0.154927C 1.463638 -0.061623 -0.048297C 0.751672 -1.375293 -0.011192C -0.767697 -1.371674 0.014380C -1.460637 -2.710170 -0.059868H -2.527470 -2.917444 -0.447321C -0.613835 -3.906730 0.347772C 0.698830 -3.932462 -0.308563C 1.487792 -2.641689 0.036549H -1.081018 4.628348 1.244812H -2.616392 3.243514 -1.023505H 2.507288 2.668815 0.438554H 1.242610 4.836196 -0.680893H 2.582302 -0.030313 -0.070797H -0.912889 -4.639283 1.257735H 1.078115 -4.746175 -1.095140H 2.590370 -2.795434 0.298603C -1.498984 -0.094856 0.075017H -2.616059 -0.077277 0.172531
Table A.9: (TS1-38)9+
Sum of electronic and zero-point Energies= -530.948773
Atom X Y ZC -0.703459 4.120030 0.252427C -1.681239 3.186705 -0.264448C -0.717362 1.186511 0.003367
Continued on next column/page
133

Atom X Y ZC 0.703288 1.311235 -0.016739C 1.427987 2.665503 0.124417C 0.677741 4.051687 -0.246857C 1.465611 -0.041958 -0.078778C 0.738501 -1.422239 -0.014050C -0.733176 -1.443523 0.019853C -1.452113 -2.822681 -0.130009H -2.501118 -3.015404 -0.619055C -0.632280 -4.060682 0.302101C 0.720340 -4.044930 -0.311448C 1.498976 -2.763709 0.115441H -1.036019 4.896196 1.272871H -2.687603 3.330297 -0.898017H 2.500262 2.812533 0.542167H 1.223201 4.908358 -0.932352H 2.591589 -0.022981 -0.171328H -1.005809 -4.872541 1.185290H 1.129667 -4.851552 -1.173463H 2.564540 -2.927187 0.569347C -1.488761 -0.094471 0.136600H -2.602936 -0.085196 0.332664
Table A.10: 386+
Sum of electronic and zero-point Energies= -535.263007
Atom X Y ZC -0.358520 4.887797 -0.316763C -0.271193 6.226450 -0.499635C -1.109958 0.212822 0.481834C -0.109210 0.995556 -0.060414C 0.197027 2.357437 -0.336037C -0.615481 3.588454 -0.050791C 0.881221 -0.160311 -0.377129C 0.621036 -1.530711 -0.171824C -0.654782 -2.007975 0.417569C -0.901854 -3.435245 0.688010H -1.920189 -3.798922 0.929891C 0.135358 -4.407519 0.571869C 1.154165 -3.994903 -0.352063C 1.589093 -2.580362 -0.399373H -1.093027 6.952910 -0.154459H 0.607075 6.760726 -1.003529H 1.163994 2.535407 -0.824304H -1.612201 3.539931 0.464683H 1.829980 0.187009 -0.825655
Continued on next column/page
Atom X Y ZH 0.022904 -5.455165 0.924836H 1.573511 -4.732019 -1.091536H 2.678727 -2.395857 -0.531608C -1.618206 -0.971037 0.808550H -2.610486 -1.153536 1.295750
Table A.11: 387+
Sum of electronic and zero-point Energies= -534.069412
Atom X Y ZC -0.334563 4.963173 -0.320439C -0.251933 6.341579 -0.489537C -1.129327 0.187015 0.475770C -0.121101 0.965852 -0.055418C 0.191938 2.392864 -0.324540C -0.615181 3.663976 -0.064492C 0.857013 -0.174258 -0.384037C 0.607395 -1.591664 -0.153621C -0.685457 -2.048353 0.431522C -0.941677 -3.506868 0.664469H -1.973707 -3.930470 0.807141C 0.181068 -4.455957 0.611678C 1.163217 -4.060190 -0.391851C 1.598801 -2.621705 -0.407055H -1.098657 7.076201 -0.155623H 0.646086 6.904356 -0.969394H 1.179191 2.557479 -0.793076H -1.635808 3.637375 0.422641H 1.809895 0.154788 -0.853369H 0.232116 -5.419396 1.225586H 1.505434 -4.790908 -1.205966H 2.693919 -2.437858 -0.571875C -1.644012 -1.013460 0.802735H -2.655667 -1.172631 1.286625
Table A.12: 388+
Sum of electronic and zero-point Energies= -532.724775
Atom X Y ZC -0.321438 5.063718 -0.331162C -0.243834 6.487652 -0.466949C -1.113951 0.140649 0.479039C -0.129310 0.928298 -0.036826C 0.207867 2.483224 -0.278975C -0.633789 3.740939 -0.136892
Continued on next column/page
134

Atom X Y ZC 0.850433 -0.238762 -0.367897C 0.620884 -1.689635 -0.123111C -0.720412 -2.148800 0.470191C -1.005477 -3.579902 0.653923H -2.029999 -4.071664 0.804830C 0.228640 -4.479123 0.620774C 1.126809 -4.156438 -0.488898C 1.618444 -2.695661 -0.436282H -1.167083 7.223836 -0.275000H 0.725450 7.098809 -0.781386H 1.257031 2.627840 -0.619471H -1.731102 3.710549 0.168756H 1.811509 0.089421 -0.840913H 0.498167 -5.226673 1.504717H 1.348289 -4.871522 -1.402259H 2.719766 -2.538579 -0.664272C -1.654554 -1.082293 0.821163H -2.683358 -1.194944 1.314777
Table A.13: (TS38-39)6+
Sum of electronic and zero-point Energies= -535.131519
Atom X Y ZC -0.217094 5.581297 -0.431066C -0.059061 6.959822 -0.644961C -1.204978 0.000825 0.517801C -0.248513 0.806081 0.013155C -0.013485 2.257493 -0.223917C -0.841086 3.264126 0.087627C 0.763405 -0.301406 -0.331185C 0.565521 -1.684302 -0.123051C -0.686356 -2.204190 0.467260C -0.872656 -3.637271 0.704151H -1.859281 -4.050971 0.985238C 0.218523 -4.565609 0.496734C 1.262527 -4.117595 -0.374223C 1.579344 -2.672220 -0.433869H -0.848656 7.723873 -0.320701H 0.860566 7.415773 -1.148266H 0.947806 2.514117 -0.708809H -1.740975 3.755931 0.488191H 1.685399 0.083156 -0.801035H 0.169435 -5.610079 0.870085H 1.835749 -4.839444 -1.002182H 2.628323 -2.401618 -0.661147
Continued on next column/page
Atom X Y ZC -1.679592 -1.224921 0.840144H -2.665880 -1.431929 1.321898
Table A.14: (TS38-39)7+
Sum of electronic and zero-point Energies= -533.988309
Atom X Y ZC -0.236819 5.675560 -0.441919C -0.129291 7.040531 -0.620488C -1.210676 -0.022178 0.408046C -0.211381 0.821952 -0.016154C 0.057223 2.254503 -0.233382C -0.793934 3.321174 0.023132C 0.857189 -0.323678 -0.261011C 0.647214 -1.724655 -0.080865C -0.702381 -2.278060 0.378805C -0.936438 -3.674942 0.607570H -1.937715 -4.127915 0.822437C 0.230337 -4.585725 0.611992C 1.220486 -4.133625 -0.358887C 1.678881 -2.706943 -0.295815H 0.277405 7.757524 0.194836H -0.440587 7.580377 -1.598065H 1.057589 2.495061 -0.648118H -1.766701 3.695886 0.412178H 1.830013 0.069016 -0.627374H 0.295766 -5.540596 1.234622H 1.502052 -4.805015 -1.251530H 2.779541 -2.509961 -0.409522C -1.721227 -1.235697 0.673955H -2.767562 -1.421656 1.063431
Table A.15: (TS38-39)8+
Sum of electronic and zero-point Energies= -532.655367
Atom X Y ZC -0.236478 5.467599 -0.398699C -0.139270 6.970524 -0.577432C -1.164170 0.014849 0.465233C -0.195747 0.838731 -0.018749C 0.084396 2.363091 -0.268273C -0.747490 3.459601 0.009802C 0.823417 -0.321011 -0.328165C 0.622239 -1.757015 -0.103644C -0.719962 -2.267973 0.448982
Continued on next column/page
135

Atom X Y ZC -0.975117 -3.682093 0.646402H -1.980757 -4.178721 0.835890C 0.260294 -4.571704 0.620953C 1.170087 -4.193415 -0.458807C 1.641702 -2.740526 -0.400099H -1.015079 7.732557 -0.245590H 0.814916 7.520111 -1.061591H 1.078268 2.550715 -0.726777H -1.738241 3.761495 0.432015H 1.781556 0.040786 -0.773772H 0.489299 -5.372378 1.449370H 1.392959 -4.885165 -1.379705H 2.739662 -2.559723 -0.607671C -1.686781 -1.214190 0.782589H -2.720718 -1.355206 1.245612
Table A.16: (TS38-39)9+
Sum of electronic and zero-point Energies= -531.205386
Atom X Y ZC -0.194980 5.691816 -0.280157C -0.351047 7.106307 0.037026C -1.034789 0.066330 0.621583C -0.132182 0.811236 -0.137161C 0.119132 2.302370 -0.549924C -0.631036 3.685717 -0.672186C 0.784344 -0.390140 -0.559363C 0.577301 -1.854389 -0.175679C -0.642059 -2.229892 0.654728C -0.928594 -3.700945 0.923676H -1.966789 -4.180740 1.138680C 0.286522 -4.612856 0.797983C 1.029566 -4.389470 -0.455915C 1.526826 -2.912109 -0.552995H -0.949737 7.955475 -0.692163H 0.234301 7.718569 0.964495H 1.105531 2.457411 -1.106009H -1.426401 3.817393 -1.504891H 1.671935 -0.126676 -1.196717H 0.697327 -5.301863 1.715366H 1.139277 -5.182492 -1.349874H 2.607307 -2.791500 -0.910671C -1.497371 -1.120980 1.107281H -2.445398 -1.197633 1.770761
Table A.17: 395+
Sum of electronic and zero-point Energies= -458.682354
Atom X Y ZC -0.741775 0.270557 0.008877C 0.497896 0.815144 -0.016212C 1.037687 2.167791 -0.012266C 0.657212 3.411488 0.017809C 1.329789 -0.469461 -0.047007C 0.783928 -1.775733 -0.032422C -0.683804 -2.002507 0.001854C -1.231541 -3.321949 0.018272H -2.314280 -3.524933 -0.075639C -0.318871 -4.479729 0.137449C 1.054520 -4.288580 -0.240905C 1.642335 -2.939871 -0.069996H 2.172179 2.347636 -0.046218H 0.516896 4.529303 0.038317H 2.419379 -0.295156 -0.104357H -0.699610 -5.467698 0.482135H 1.666618 -5.124414 -0.651724H 2.738559 -2.878351 0.060800C -1.538804 -0.814351 0.034087H -2.656169 -0.804974 0.086915
Table A.18: 396+
Sum of electronic and zero-point Energies= -457.534283
Atom X Y ZC -1.297134 -0.086588 0.532935C -0.325269 0.768723 0.054558C -0.186074 2.200802 -0.119168C -0.844177 3.341958 0.081550C 0.764526 -0.302876 -0.277253C 0.602510 -1.712199 -0.097550C -0.705298 -2.313410 0.437358C -0.879208 -3.718291 0.653945H -1.847178 -4.212559 0.926560C 0.324908 -4.582304 0.571508C 1.230849 -4.090621 -0.460790C 1.650492 -2.651699 -0.397680H 0.778554 2.651994 -0.588165H -1.244869 4.420324 0.170756H 1.701961 0.124683 -0.698991H 0.478890 -5.524692 1.200377H 1.465461 -4.735843 -1.386913H 2.733679 -2.412559 -0.586532C -1.750701 -1.317472 0.813819H -2.767222 -1.546252 1.264614
Continued on next column/page
136

Atom X Y Z
Table A.19: 397+
Sum of electronic and zero-point Energies= -456.227272
Atom X Y ZC -1.293426 -0.076199 0.566693C -0.324442 0.766242 0.071915C -0.164252 2.282576 -0.110196C -0.871688 3.484900 0.082777C 0.740559 -0.305011 -0.290082C 0.583380 -1.767676 -0.085055C -0.735973 -2.324867 0.473017C -0.933960 -3.777382 0.605515H -1.930952 -4.330389 0.718653C 0.346464 -4.603311 0.565832C 1.240538 -4.183228 -0.516613C 1.646734 -2.706527 -0.406771H 0.842429 2.692112 -0.555184H -1.296450 4.612193 0.164746H 1.685470 0.099568 -0.740646H 0.636244 -5.378686 1.414188H 1.509396 -4.848620 -1.453197H 2.743638 -2.473347 -0.597169C -1.754594 -1.330349 0.855907H -2.784414 -1.530878 1.330606
Table A.20: (TS1-40)6+
Sum of electronic and zero-point Energies= -535.129613
Atom X Y ZC -0.585484 3.751755 0.218088C -1.405251 2.509814 0.109493C -0.719620 1.254239 0.060041C 0.778945 1.267707 0.052659C 1.517935 2.409566 0.039189C 0.345026 4.237198 -0.597378C 1.500431 -0.025948 0.080179C 0.758708 -1.249781 0.031047C -0.670394 -1.267380 -0.045951C -1.368781 -2.586047 -0.223390H -2.374386 -2.620631 -0.701862C -0.761211 -3.844621 0.044543C 0.665026 -3.820712 -0.165751C 1.356414 -2.621876 0.223147
Continued on next column/page
Atom X Y ZH -0.693559 4.424026 1.171946H -2.514887 2.642662 0.124961H 2.502951 2.923657 0.184648H 0.848835 4.958146 -1.325182H 2.601350 -0.040037 0.119584H -1.323444 -4.801819 0.131388H 1.199542 -4.741072 -0.538874H 2.274065 -2.763611 0.852973C -1.415736 0.014996 0.048455H -2.516642 -0.010226 0.106043
Table A.21: (TS1-40)7+
Sum of electronic and zero-point Energies= -533.896268
Atom X Y ZC -0.592363 3.765681 0.228425C -1.431782 2.539923 0.030937C -0.737671 1.252109 0.015619C 0.761532 1.273001 0.047812C 1.494210 2.460653 0.076273C 0.413816 4.260536 -0.522785C 1.495412 -0.009343 0.064392C 0.750299 -1.283862 0.027632C -0.698217 -1.287530 -0.066802C -1.408671 -2.624379 -0.225299H -2.403028 -2.721675 -0.756090C -0.758275 -3.884808 0.166874C 0.665398 -3.849025 -0.183961C 1.398612 -2.621869 0.217235H -0.711561 4.389365 1.242172H -2.548374 2.698126 -0.047010H 2.524610 2.902022 0.248760H 0.943342 5.042929 -1.204457H 2.604027 -0.020978 0.088811H -1.301399 -4.804138 0.599728H 1.154552 -4.691516 -0.813353H 2.380500 -2.776453 0.765171C -1.443851 0.005537 -0.011860H -2.551285 -0.014301 0.011771
Table A.22: (TS1-40)8+
Sum of electronic and zero-point Energies= -532.499083
Atom X Y ZC -0.629436 3.816093 0.221246
Continued on next column/page
137

Atom X Y ZC -1.450086 2.589233 -0.049508C -0.739962 1.247562 -0.003392C 0.751407 1.253182 0.056105C 1.501297 2.490675 0.140455C 0.475344 4.282811 -0.458459C 1.490682 -0.039927 0.048271C 0.743401 -1.349648 0.046864C -0.753975 -1.322619 -0.065758C -1.467319 -2.640092 -0.255299H -2.487471 -2.806145 -0.771197C -0.713690 -3.880530 0.221921C 0.670021 -3.905071 -0.274660C 1.440053 -2.657049 0.201105H -0.831536 4.453092 1.254261H -2.568453 2.751269 -0.244859H 2.558099 2.874568 0.394558H 1.030566 5.109930 -1.120396H 2.606756 -0.051696 0.051491H -1.153134 -4.644780 1.048546H 1.113023 -4.696646 -1.064656H 2.477539 -2.842128 0.663352C -1.474339 -0.016583 -0.028056H -2.588952 -0.015493 -0.011937
Table A.23: (TS1-40)9+
Sum of electronic and zero-point Energies= -530.952668
Atom X Y ZC -0.665483 3.960398 0.233364C -1.467138 2.729611 -0.073341C -0.710497 1.315040 0.011907C 0.748743 1.315086 0.026453C 1.525593 2.618469 0.126613C 0.510575 4.391778 -0.423405C 1.491102 -0.037870 -0.019524C 0.730059 -1.406525 0.021452C -0.731283 -1.390492 -0.036629C -1.472617 -2.757952 -0.252824H -2.484438 -2.922176 -0.827262C -0.719118 -4.021154 0.231698C 0.676644 -4.033165 -0.278986C 1.450831 -2.778274 0.214950H -0.938566 4.654043 1.290189H -2.588991 2.878506 -0.359702H 2.611277 2.949644 0.425666
Continued on next column/page
Atom X Y ZH 1.061034 5.274348 -1.099237H 2.617298 -0.052427 -0.081766H -1.181886 -4.834262 1.078574H 1.129902 -4.848669 -1.123391H 2.467366 -2.965253 0.770612C -1.468155 -0.019922 0.032662H -2.592419 -0.018775 0.111924
Table A.24: 406+
Sum of electronic and zero-point Energies= -535.212027
Atom X Y ZC -0.927109 3.898820 -0.281001C -0.971383 2.602060 0.056204C -0.226399 1.276863 0.089146C 1.268425 1.035166 0.205770C 2.332218 1.796280 0.360911C -1.166598 5.198723 -0.572839C 1.800679 -0.389802 0.249992C 0.911780 -1.459797 0.071742C -0.516091 -1.235908 -0.070192C -1.432877 -2.395789 -0.210878H -2.456331 -2.250655 -0.609389C -1.047808 -3.739624 0.047377C 0.355052 -3.919232 -0.188336C 1.293219 -2.869910 0.208502H -2.189057 5.686974 -0.380463H -2.037670 2.515494 0.432271H 3.311048 2.340759 0.515697H -0.417158 5.928973 -1.027452H 2.878055 -0.573802 0.394001H -1.764844 -4.584654 0.098466H 0.721982 -4.842075 -0.724352H 2.227740 -3.198037 0.725308C -1.038677 0.133727 0.025073H -2.129295 0.244469 0.002635
Table A.25: 407+
Sum of electronic and zero-point Energies= -534.006020
Atom X Y ZC -1.154476 3.796755 -0.376994C -0.634712 2.781967 0.321697C -0.053128 1.328188 0.141432C 1.410932 0.964308 0.435199
Continued on next column/page
138

Atom X Y ZC 2.492839 1.721591 0.698126C -1.708962 4.960660 -0.864495C 1.848697 -0.485274 0.444468C 0.890327 -1.524082 0.155143C -0.495441 -1.147757 -0.177015C -1.459689 -2.274705 -0.496369H -2.396068 -2.118839 -1.097444C -1.141332 -3.660666 -0.131134C 0.279456 -3.946874 -0.311554C 1.230902 -2.940301 0.255951H -2.060857 5.830994 -0.172739H -0.710808 3.104389 1.418215H 3.474085 2.285877 0.941172H -1.886793 5.207990 -1.981329H 2.906427 -0.746894 0.655760H -1.919663 -4.440609 0.186340H 0.643185 -4.837463 -0.940860H 2.140561 -3.347717 0.780106C -0.925924 0.237597 -0.141560H -1.990658 0.449887 -0.323925
Table A.26: 408+
Sum of electronic and zero-point Energies= -532.633298
Atom X Y ZC -1.196610 3.847668 -0.380999C -0.614945 2.825040 0.279985C -0.047731 1.357190 0.106004C 1.417067 0.936174 0.451915C 2.523502 1.713666 0.728880C -1.770955 5.042865 -0.819604C 1.826529 -0.520979 0.478190C 0.840661 -1.602392 0.196676C -0.547343 -1.170867 -0.215533C -1.481503 -2.289369 -0.622298H -2.398623 -2.204981 -1.308301C -1.097468 -3.667826 -0.129547C 0.295627 -4.043877 -0.369602C 1.219464 -3.002377 0.309531H -2.079580 5.939082 -0.098443H -0.570833 3.178000 1.377402H 3.528761 2.309257 0.969205H -2.033098 5.336644 -1.931696H 2.882830 -0.801596 0.715721H -1.809398 -4.306816 0.596638
Continued on next column/page
Atom X Y ZH 0.692635 -4.934787 -1.045266H 2.139958 -3.432205 0.825965C -0.942725 0.224342 -0.230365H -1.997320 0.467165 -0.466270
Table A.27: 409+
Sum of electronic and zero-point Energies= -531.126710
Atom X Y ZC -1.395332 3.926581 -0.316823C -0.424604 2.928016 0.166389C 0.035611 1.405154 0.034886C 1.521710 0.924166 0.433330C 2.713847 1.630804 0.659834C -2.136852 5.105130 -0.608383C 1.854320 -0.526266 0.544292C 0.818102 -1.632120 0.272442C -0.476360 -1.205701 -0.280088C -1.368442 -2.352067 -0.847616H -2.088671 -2.275589 -1.760220C -1.165849 -3.735417 -0.234940C 0.263016 -4.133437 -0.219402C 1.083836 -3.095160 0.587370H -2.110249 6.242370 -0.004685H 0.191043 3.525116 0.916567H 3.799362 2.158099 0.858164H -2.987150 5.337954 -1.501314H 2.895059 -0.857185 0.820586H -2.058046 -4.377904 0.333321H 0.760239 -5.059320 -0.860309H 1.796303 -3.516871 1.405989C -0.849665 0.279682 -0.334407H -1.892327 0.502986 -0.646797
Table A.28: (TS40-41)6+
Sum of electronic and zero-point Energies= -535.064207
Atom X Y ZC -0.914068 4.714246 -0.054272C -0.975849 2.202867 -0.492441C -0.164222 1.101510 -0.388141C 1.325208 0.849603 -0.185694C 2.372972 1.597505 -0.444706C -1.324970 5.994175 0.307807C 1.786928 -0.535533 0.236876
Continued on next column/page
139

Atom X Y ZC 0.890821 -1.607132 0.204480C -0.527899 -1.420472 -0.170958C -1.435607 -2.553460 -0.206968H -2.465794 -2.455788 -0.584847C -1.020718 -3.856610 0.233327C 0.398457 -4.071153 0.272527C 1.303617 -2.940816 0.573635H -2.169894 6.540294 -0.240274H -1.932163 2.517039 -0.944833H 3.335218 2.143510 -0.650967H -0.756314 6.649225 1.052105H 2.840369 -0.684684 0.516031H -1.746419 -4.683720 0.374511H 0.831433 -5.066894 -0.009320H 2.253439 -3.161379 1.102349C -1.028725 -0.092826 -0.426546H -2.096921 0.019518 -0.655488
Table A.29: (TS40-41)7+
Sum of electronic and zero-point Energies= -533.914217
Atom X Y ZC -0.966762 4.628899 -0.231428C -1.026105 2.274420 -0.143441C -0.198299 1.140074 -0.034893C 1.319203 0.864876 0.107759C 2.384546 1.649076 0.213473C -1.266552 5.975915 -0.309617C 1.828348 -0.559098 0.171427C 0.940120 -1.671787 0.073960C -0.543324 -1.462996 -0.047295C -1.473867 -2.544369 -0.037483H -2.575306 -2.443345 -0.144495C -0.986511 -3.917043 0.266977C 0.382533 -4.029636 -0.177966C 1.420294 -3.017627 0.182001H -1.319763 6.575654 -1.312676H -2.122887 2.405443 -0.237053H 3.367605 2.219948 0.316080H -1.496737 6.648114 0.619923H 2.915883 -0.741794 0.273541H -1.639176 -4.742032 0.708042H 0.584065 -4.707281 -1.101397H 2.454093 -3.360120 0.462704C -1.053665 -0.051656 -0.069852
Continued on next column/page
Atom X Y ZH -2.148839 0.065391 -0.130101
Table A.30: (TS40-41)8+
Sum of electronic and zero-point Energies= -532.549653
Atom X Y ZC -0.987735 4.563419 -0.191948C -1.006403 2.386405 -0.134681C -0.177190 1.212323 -0.052304C 1.345075 0.862545 0.039508C 2.475755 1.606496 0.103929C -1.327364 5.986421 -0.219547C 1.818915 -0.569724 0.077722C 0.877301 -1.706075 0.072754C -0.598905 -1.393319 -0.020559C -1.538605 -2.509641 -0.075936H -2.639963 -2.483440 -0.340368C -0.944859 -3.860727 0.314261C 0.363570 -4.165272 -0.235837C 1.375029 -3.062407 0.122054H -0.535766 6.894862 -0.148589H -2.112126 2.467004 -0.232808H 3.514300 2.137076 0.166091H -2.452157 6.424901 -0.335798H 2.911750 -0.790839 0.112977H -1.408434 -4.491590 1.201508H 0.622000 -5.048394 -0.968800H 2.433012 -3.403251 0.328867C -1.066582 -0.002828 -0.065366H -2.161723 0.145083 -0.098940
Table A.31: (TS40-41)9+
Sum of electronic and zero-point Energies= -531.099490
Atom X Y ZC -1.059831 4.744910 -0.059851C -0.983987 2.568266 -0.224083C -0.138399 1.209662 -0.152692C 1.409394 0.852838 -0.152537C 2.560432 1.627964 -0.295004C -1.411023 6.096123 0.051319C 1.867505 -0.565916 -0.032745C 0.882395 -1.734289 0.092647C -0.545310 -1.414764 -0.055914C -1.495492 -2.634638 -0.224716
Continued on next column/page
140

Atom X Y ZH -2.469796 -2.666117 -0.863259C -1.022823 -3.946509 0.393365C 0.360613 -4.283838 -0.019174C 1.326106 -3.149195 0.405296H -0.739386 7.015327 0.547753H -2.085850 2.513454 -0.450400H 3.616036 2.203767 -0.423180H -2.461339 6.633600 -0.364737H 2.963635 -0.817492 -0.038587H -1.646608 -4.564467 1.261265H 0.687391 -5.238586 -0.716399H 2.285802 -3.471814 0.975418C -1.008931 0.042340 -0.113741H -2.111638 0.178403 -0.121855
Table A.32: 415+
Sum of electronic and zero-point Energies= -458.646322
Atom X Y ZC -1.029893 2.091251 -0.598835C -0.328012 0.988762 -0.397266C 1.194210 0.828596 -0.264285C 2.130320 1.762238 -0.291915C 1.746375 -0.554539 -0.072703C 0.886902 -1.674484 0.003450C -0.597239 -1.515391 -0.100348C -1.446794 -2.652270 0.025486H -2.542503 -2.605085 -0.084621C -0.843235 -3.960087 0.356390C 0.566865 -4.151151 0.102533C 1.456472 -2.972003 0.152124H -1.692956 2.991205 -0.770873H 2.982417 2.505833 -0.304613H 2.837289 -0.681276 -0.002401H -1.456256 -4.759205 0.836204H 0.972717 -5.153068 -0.173124H 2.537360 -3.148683 0.276148C -1.181187 -0.242556 -0.294155H -2.274134 -0.133462 -0.362580
Table A.33: 416+
Sum of electronic and zero-point Energies= -457.491438
Atom X Y ZC 0.071929 0.167615 -0.189089
Continued on next column/page
Atom X Y ZC 0.188964 0.387239 1.228179C 1.481973 0.284651 1.921838C 2.689747 0.083480 1.093958C 2.586350 -0.087160 -0.312497H -0.940774 0.145380 -0.620714H -0.724615 0.648575 1.779997H 3.676942 0.083994 1.571535C 1.575016 0.329464 3.335887C 1.719408 0.206302 4.610347H 2.353202 -0.343003 5.337061C 0.952497 1.541000 6.392531H 1.313416 1.622186 8.613552C 0.544956 1.501633 7.770702H -0.539083 1.708759 8.075780C 1.229394 -0.003003 -0.996631C 1.135788 -0.174104 -2.421983C 2.306022 -0.625419 -3.158184H 0.201011 0.007694 -2.988535C 3.732893 -0.288978 -1.134109C 3.578988 -0.214320 -2.595018H 2.230189 -1.196854 -4.118467H 4.746194 -0.494739 -0.738868H 4.402831 0.170772 -3.251569
Table A.34: (TS42-11)7+
Sum of electronic and zero-point Energies= -534.005746
Atom X Y ZC 0.021858 0.096468 -0.317827C 0.091275 0.281976 1.160474C 1.354921 0.227830 1.886112C 2.592552 0.111390 1.105422C 2.565911 -0.062610 -0.373227H -0.988171 0.041938 -0.771074H -0.868182 0.483074 1.673162H 3.572061 0.155408 1.610377C 1.365509 0.255714 3.349253C 1.308610 0.008411 4.636902H 1.383839 -0.911947 5.272692C 1.066535 1.280580 6.577474H 1.777516 2.341104 8.427420C 0.928513 1.759986 7.870266H -0.048665 1.626651 8.500542C 1.212631 -0.022401 -1.087525C 1.183141 -0.113939 -2.526322
Continued on next column/page
141

Atom X Y ZC 2.460240 -0.594358 -3.135604H 0.303286 0.109235 -3.194371C 3.772075 -0.200981 -1.114649C 3.692273 -0.039784 -2.601260H 2.473425 -1.517821 -3.833664H 4.793072 -0.342864 -0.687654H 4.499011 0.488105 -3.221214
Table A.35: 114+
Sum of electronic and zero-point Energies= -459.688945
Atom X Y ZC -0.834484 -1.029326 -0.000126C -1.503523 1.416433 0.000170C -1.901582 -0.002558 0.000002C 0.510251 -0.639561 -0.000078H -1.120729 -2.085602 -0.000253H -2.275379 2.196584 0.000255C -3.230514 -0.335704 -0.000045C -4.465041 -0.619617 -0.000088H -5.540584 -0.869079 0.000135C 0.879694 0.806298 0.000098C 2.293226 1.180421 0.000143C 3.316101 0.188640 0.000018H 2.573239 2.240259 0.000275C 1.552252 -1.603893 -0.000197C 2.964838 -1.187199 -0.000151H 4.370707 0.488487 0.000053H 1.334182 -2.678088 -0.000330H 3.743441 -1.960893 -0.000248C -0.116934 1.793963 0.000216H 0.129414 2.860947 0.000343
Table A.36: 115+
Sum of electronic and zero-point Energies= -458.695593
Atom X Y ZC 0.845496 -1.006928 -0.003347C 1.491430 1.445193 0.081421C 1.891938 0.032670 0.020931C -0.525730 -0.630998 -0.019838H 1.130226 -2.067316 0.011744H 2.240226 2.245972 0.192649C 3.265022 -0.293371 -0.014732C 4.544062 -0.560581 -0.046352
Continued on next column/page
Atom X Y ZH 5.650148 -0.792611 -0.072132C -0.919903 0.828764 0.028115C -2.313955 1.189499 0.004236C -3.313192 0.156369 -0.257663H -2.666437 2.225795 0.172497C -1.558321 -1.612693 -0.055429C -2.953445 -1.184830 0.151531H -4.305846 0.393547 -0.715427H -1.374280 -2.690615 -0.223803H -3.701799 -1.864803 0.633258C 0.095297 1.819302 0.021804H -0.139061 2.895010 -0.013429
Table A.37: 116+
Sum of electronic and zero-point Energies= -457.517616
Atom X Y ZC 0.846705 -0.999557 -0.017639C 1.515927 1.462096 0.095430C 1.915139 0.038544 -0.002120C -0.595749 -0.614773 -0.035258H 1.126346 -2.071760 -0.007473H 2.268405 2.269332 0.245387C 3.282963 -0.312049 -0.050950C 4.581636 -0.586875 -0.093967H 5.704915 -0.832249 -0.128241C -0.951322 0.875441 0.028904C -2.356679 1.235063 0.087677C -3.280697 0.121259 -0.291734H -2.784032 2.243097 0.370793C -1.602936 -1.618921 -0.059454C -3.015509 -1.196813 0.252158H -4.012332 0.250143 -1.188283H -1.439599 -2.715788 -0.206957H -3.747652 -1.840156 0.861864C 0.070278 1.866106 0.038756H -0.143931 2.955238 -0.002860
142

B. Coronene and AnthraceneVibrational Frequencies
The vibrational frequencies for coronene and anthracene, calculated using the B3LYPfunctional and the 6-311++G(2d,p) basis set, given in units of cm−1 without scaling.A scaling factor of 0.9679 [201] was used in all calculations that utilized these fre-quencies. Scaling factors are the easiest way to compensate for anharmonicities andincomplete descriptions of the electronic structures.
Coronene88.3516 88.4293 125.5798 164.0801 226.4838 294.0650294.0852 300.5937 300.7237 370.1098 370.1913 384.7213385.5640 457.4816 458.4771 481.4077 484.3471 498.2352498.6166 534.1768 552.1503 553.1381 563.0991 566.9068646.9378 648.5380 674.5629 675.5627 680.0751 690.8326690.9669 770.4533 775.4063 776.4291 786.8914 787.1314817.6476 823.3397 823.4678 824.7029 825.9381 853.2038853.2190 872.2615 947.6665 956.1103 963.0860 963.5562971.7445 972.9902 977.4321 1009.4847 1009.5530 1048.91911156.9681 1160.2377 1161.0084 1183.0010 1183.1588 1190.06981206.6072 1235.7146 1235.7933 1243.4569 1244.8493 1244.93901261.7603 1339.8316 1339.9298 1361.7619 1368.2666 1416.86671416.9967 1420.4393 1420.6173 1450.9191 1461.4942 1461.69301480.8524 1481.3881 1512.2624 1531.9871 1532.4142 1570.71431579.9498 1634.0233 1647.7298 1648.0121 1648.2030 1648.38843153.2827 3153.9793 3154.5371 3156.0180 3156.2095 3157.07493170.1896 3171.0985 3171.6407 3173.1292 3173.3795 3174.4878
143

Anthracene90.7101 120.4775 234.3818 235.7822 266.0308 389.2266396.5766 397.8421 478.9925 484.2170 502.9348 537.0456591.8657 618.5005 643.9754 662.7339 736.2820 756.3413763.3814 764.8908 782.0208 819.4546 840.8119 862.1004900.5539 915.0695 923.2687 933.0369 965.1229 971.2014981.5289 982.9087 1023.8836 1028.7956 1127.2482 1156.25211175.4819 1189.9944 1193.1114 1213.0262 1285.6342 1295.33001298.3686 1340.9037 1374.2587 1409.8347 1420.4021 1421.37461486.6085 1488.6140 1518.1939 1575.9354 1590.1565 1620.77891662.7791 1665.6965 3153.0397 3154.9305 3157.1646 3157.97923161.5944 3162.9898 3174.2801 3174.5599 3185.9374 3186.3031
144

C. List of Additional Publications
During my years as a PhD student at Stockholm University I have had the pleasureto participate in several other projects that are not included in this thesis. A few ofthem are closely related to the systems studied in this thesis, but several concern fastion-atom and ion-molecule experiments carried out at the CRYRING storage ring inStockholm, which is where I was first introduced to experimental physics. Othersdeal with electrostatic trapping at cryogenic temperatures and the DESIREE storagering currently under construction at Stockholm University. A project that stands apartfrom the rest is the study of Martian gullies, and I am very happy to have participatedin two field expeditions to Svalbard where terrestrial gullies were studied as analogsfor the Martian ones. Below follows a list of the peer-reviewed articles based on theseprojects.
Terrestrial gullies and debris flows tracks on Svalbard as planetary analogs forMarsD. Reiss, E. Hauber, H. Hiesinger, R. Jaumann, F. Trauthan, F. Preusker, M. Zanetti,M. Ulrich, A. Johnsson, L. Johansson, M. Olvmo, E. Carlsson, H. A. B. Johansson,and S. McDanielGeological Society of America Special Papers, accepted manuscript
Periglacial landscapes on Svalbard: terrestrial analogs for cold-climate land-forms on MarsE. Hauber, D. Reiss, M. Ulrich, F. Preusker, F. Trauthan, M. Zanetti, H. Hiesinger, R.Jausmann, L. Johansson, A. Johnsson, M. Olvmo, E. Carlsson, H. A. B. Johansson,and S. McDanielGeological Society of America Special Papers, accepted manuscript
PAH-isomer fragmentation pathways: Case study for pyrene and fluoranthenemolecules and clustersF. Seitz, A. I. S. Holm, H. Zettergren, H. A. B. Johansson, S. Rosén, H. T. Schmidt,A. Ławicki, J. Rangama, P. Rousseau, M. Capron, R. Maisonny, A. Domaracka, L.Adoui, A. Méry, B. Manil, B. A. Huber, and H. CederquistJournal of Chemical Physics 135, 064302 (2011)doi: 10.1063/1.3622589
145

The double electrostatic ion ring experiment: A unique cryogenic electrostaticstorage ring for merged ion-beams studiesR. D. Thomas, H. T. Schmidt, G. Andler, M. Björkhage, M. Blom, L. Brännholm,E. Bäckström, H. Danared, S. Das, N. Haag, P. Halldén, F. Hellberg, A. I. S. Holm,H. A. B. Johansson, A. Källberg, G. Källersjö, M. Larsson, S. Leontein, L. Liljeby,P. Löfgren, B. Malm, S. Mannervik, M. Masuda, D. Misra, A. Orbán, A. Paál, P.Reinhed, K.-G. Rensfelt, S. Rosn, K. Schmidt, F. Seitz, A. Simonsson, J. Weimer, H.Zettergren, and H. CederquistReview of Scientific Instruments 82, 065112 (2011)doi: 10.1063/1.3602928
Electron capture induced dissociation of doubly protonated pentapeptides: De-pendence on molecular structure and charge separationN. Haag, A. I. S. Holm, H. A. B. Johansson, H. Zettergren, H. T. Schmidt, S. Brønd-sted Nielsen, P. Hvelplund, and H. CederquistJournal of Chemical Physics. 134, 035102. (2011)doi: 10.1063/1.3533952
Angular scattering in fast ion-atom electron transfer collisions: Projectile wavediffraction and Thomas mechanismsM. Gudmundsson, D. Fischer, N. Haag, H. A. B. Johansson, D. Misra, P. Reinhed,H. Schmidt-Böcking, R. Schuch, M. Schöffler, K. Støchkel, H. T. Schmidt, and H.CederquistJournal of Physics B 43, 185209 (2010)doi: 10.1088/0953-4075/43/18/185209
Importance of Thomas single-electron transfer in fast p-He collisionsD. Fischer, M. Gudmundsson, Z. Berényi, N. Haag, H. A. B. Johansson, D. Misra, P.Reinhed, A. Källberg, A. Simonsson, K. Støchkel, H. Cederquist, and H. T. SchmidtPhysical Review A 81, 012714 (2010)doi: 10.1103/PhysRevA.81.012714
Cryogenic keV ion-beam storage in ConeTrap-A tool for ion-temperature controlP. Reinhed, A. Orbán, S. Rosén, R. D. Thomas, I. Kashperka, H. A. B. Johansson, D.Misra, A. Fardi, L. Brännholm, M. Björkhage, H. Cederquist and H. T. SchmidtNuclear Instruments and Methods in Physics Research Section A 621, 83-90 (2010)doi: 10.1016/j.nima.2010.06.008
Magic and hot giant fullerenes formed inside ion irradiated weakly bound C60clustersH. Zettergren, H. A. B. Johansson, H. T. Schmidt, J. Jensen, P. Hvelplund, S. Tomita,Y. Wang, F. Martín, M. Alcamí, B. Manil, L. Maunoury, B. A. Huber, and H. Ced-erquistJournal of Chemical Physics 133, 104301 (2010)doi: 10.1063/1.3479584
146

Precision Lifetime Measurements of He− in a Cryogenic Electrostatic Ion-BeamTrapP. Reinhed, A. Orbán, J. Werner, S. Rosén, R. D. Thomas, I. Kashperka, H. A. B.Johansson, D. Misra, L. Brännholm, M. Björkhage, H. Cederquist, and H. T. SchmidtPhysical Review Letters 103, 213002 (2009)doi: 10.1103/PhysRevLett.103.213002
Two-Center Double-Capture Interference in Fast He2+ + H2 CollisionsD. Misra, H. T. Schmidt, M. Gudmundsson, D. Fischer, N. Haag, H. A. B. Johansson,A. Källberg, B. Najjari, P. Reinhed, R. Schuch, M. Schöffler, A. Simonsson, A. B.Voitkiv, and H. CederquistPhysical Review Letters 102, 153201 (2009)doi: 10.1103/PhysRevLett.102.153201
On the hydrogen loss from protonated nucleobases after electronic excitation orcollisional electron captureJ. A. Wyer, H. Cederquist, N. Haag, B. A. Huber, P. Hvelplund, H. A. B. Johansson,R. Maisonny, S. Brøndsted Nielsen, J. Rangama, P. Rousseau, and H. T. SchmidtEuropean Journal of Mass Spectrometry 15, 681-688 (2009)doi: 10.1255/ejms.1039
Kinetic energy release distributions and barrier heights for C2+ emission frommultiply charged C60 and C70 fullerenesN. Haag, Z. Berényi, P. Reinhed, D. Fischer, M. Gudmundsson, H. A. B. Johansson,H. T. Schmidt, and H. CederquistPhysical Review A 78, 043201 (2008)doi: 10.1103/PhysRevA.78.043201
Evidence of wave-particle duality for single fast hydrogen atomsH. T. Schmidt, D. Fischer, Z. Berényi, C. L. Cocke, M. Gudmundsson, N. Haag, H.A. B. Johansson, A. Källberg, S. B. Levin, P. Reinhed, U. Sassenberg, R. Schuch, A.Simonsson, K. Støchkel, and H. CederquistPhysical Review Letters 101, 083201 (2008)doi: 10.1103/PhysRevLett.101.083201
DESIREE as a new tool for interstellar ion chemistryH. T. Schmidt, H. A. B. Johansson, R. D. Thomas, W. D. Geppert, N. Haag, P. Rein-hed, S. Rosén, M. Larsson, H. Danared, K.-G. Rensfelt, L. Liljeby, L. Bagge, M.Björkhage, M. Blom, P. Löfgren, A. Källberg, A. Simonsson, A. Paál., H. Zettergren,and H. CederquistInternational Journal of Astrobiology 7, 205-208 (2008)doi: 10.1017/S1473550408004229
Observations of Martian gullies and constraints on potential formation mecha-nisms II: The northern hemisphereJ. L. Heldmann, E. Carlsson, H. Johansson, M. T. Mellon, and O. B. ToonIcarus 188, 324-344 (2007)doi: 10.1016/j.icarus.2006.12.010
147


Bibliography
[1] J. B. Fenn, M. Mann, C. K. Meng, S. F. Wong, and C. M. Whitehouse, “Elec-trospray Ionization For Mass-Spectrometry Of Large Biomolecules,” Science246, 64–71 (1989).
[2] D. H. Levy, “van der Waals Molecules,” in Photoselective Chemistry Part1, J. A. Jortner, R. D. Levine, and S. A. Rice, eds. (John Wiley & Sons, Inc,1981), pp. 323–361, ISBN 0-471-06275-8.
[3] S. Kristyán and P. Pulay, “Can (semi)local Density-functional Theory AccountFor the London Dispersion Forces Rid A-1902-2011,” Chemical Physics Let-ters 229, 175–180 (1994).
[4] Y. Zhao and D. G. Truhlar, “Density Functionals for Noncovalent InteractionEnergies of Biological Importance,” Journal of Chemical Theory and Compu-tation 3, 289–300 (2007).
[5] H. Alimi, T. Ertel, and B. Schug, “Fingerprinting of hydrocarbon fuel contam-inants: Literature review,” Environmental Forensics 4, 25–38 (2003).
[6] A. L. C. Lima, J. W. Farrington, and C. M. Reddy, “Combustion-Derived Poly-cyclic Aromatic Hydrocarbons in the Environment - A Review,” EnvironmentalForensics 6, 109–131 (2005).
[7] C. von Sonntag, Free-Radical-Induced DNA Damage and Its Repair –A Chemical Perspective (Springer-Verlag, Berlin, 2006), ISBN 978-3-540-26120-9.
[8] B. N. Amews, “Dietary Carcinogens and Anticarcinogens - Oxygen Radicalsand Degenerative Diseases,” Science 221, 1256–1264 (1983).
[9] J. E. Turner, Atoms, Radiation, and Radiation Protection (Wiley, 1995),2nd edn., ISBN 0-471-59581-0.
[10] K. Breuker and F. W. McLafferty, “The thermal unfolding of native cytochromec in the transition from solution to gas phase probed by native electron cap-ture dissociation,” Angewandte Chemie – International Edition 44, 4911–4914(2005).
[11] E. Vöhringer-Martinez, B. Hansmann, H. Hernandez, J. S. Francisco, J. Troe,and B. Abel, “Water catalysis of a radical-molecule gas-phase reaction,” Sci-ence 315, 497–501 (2007).
149

[12] T. Schlathölter, F. Alvarado, S. Bari, A. Lecointre, R. Hoekstra, V. Bernigaud,B. Manil, J. Rangama, and B. Huber, “Ion-induced biomolecular radiationdamage: From isolated nucleobases to nucleobase clusters,” ChemPhysChem7, 2339–2345 (2006).
[13] R. A. Zubarev, “Reactions of polypeptide ions with electrons in the gas phase,”Mass Spectrometry Reviews 22, 57–77 (2003).
[14] H. J. Cooper, K. Håkansson, and A. G. Marshall, “The role of electron capturedissociation in biomolecular analysis,” Mass Spectrometry Reviews 24, 201–222 (2005).
[15] J. Simons, “Mechanisms for S-S and N-C-alpha bond cleavage in peptide ECDand ETD mass spectrometry,” Chemical Physics Letters 484, 81–95 (2010).
[16] F. Turecek, “N–Cα bond dissociation energies and kinetics in amide and pep-tide radicals. Is the dissociation a non-ergodic process?” Journal Of The Amer-ican Chemical Society 125, 5954–5963 (2003).
[17] K. Breuker, H. B. Oh, C. Lin, B. K. Carpenter, and F. W. McLafferty, “Noner-godic and conformational control of the electron capture dissociation of proteincations,” Proceedings Of The National Academy Of Sciences Of The UnitedStates Of America 101, 14 011–14 016 (2004).
[18] E. A. Syrstad and F. Turecek, “Toward a general mechanism of electron capturedissociation,” Journal Of The American Society For Mass Spectrometry 16,208–224 (2005).
[19] C. B. Field and M. R. Raupacheds.„ Global Carbon Cycle : IntegratingHumans, Climate, and the Natural World, no. 62 in SCOPE (Island Press,Covelo, 2004), ISBN 978-15-5963-526-4.
[20] A. Luched.„ The Carcinogenic Effects of Polycyclic Aromatic Hydrocar-bons (Imperial College Press, 2005), ISBN 1-86094-417-5.
[21] N. Ohkouchi, K. Kawamura, and H. Kawahata, “Distributions of three- toseven-ring polynuclear aromatic hydrocarbons on the deep sea floor in the cen-tral Pacific,” Environmental Science & Technology 33, 3086–3090 (1999).
[22] P. Masclet, V. Hoyau, J. Jaffrezo, and H. Cachier, “Polycyclic aromatic hy-drocarbon deposition on the ice sheet of Greenland. Part I: Superficial snow,”Atmospheric Environment 34, 3195–3207 (2000).
[23] W. Wilcke, “Global patterns of polycyclic aromatic hydrocarbons (PAHs) insoil,” Geoderma 141, 157–166 (2007).
[24] T. S. Totton, D. Chakrabarti, A. J. Misquitta, M. Sander, D. J. Wales, andM. Kraft, “Modelling the internal structure of nascent soot particles,” Com-bustion and Flame 157, 909–914 (2010).
150

[25] A. G. G. M. Tielens, “Interstellar Polycyclic Aromatic HydrocarbonMolecules,” Annual Review of Astronomy and Astrophysics 46, 289–337(2008).
[26] M. S. Povich, J. M. Stone, E. Churchwell, E. G. Zweibel, M. G. Wolfire, B. L.Babler, R. Indebetouw, M. R. Meade, and B. A. Whitney, “A multiwavelengthstudy of M17: The spectral energy distribution and PAH emission morphol-ogy of a massive star formation region,” Astrophysical Journal 660, 346–362(2007).
[27] J. D. Bregman, “Observations of HII regions and planetary nebulae: The in-frared emission bands,” in Interstellar Dust, L. J. Allamandola and A. G.G. M. Tielens, eds. (Kluwer Academic Publishers, Dordrecht, 1989), pp. 109–118, ISBN 0-7923-0448-9.
[28] E. Peeters, S. Hony, C. Van Kerckhoven, A. Tielens, L. Allamandola, D. Hud-gins, and C. Bauschlicher, “The rich 6 to 9 mu m spectrum of interstellarPAHs,” Astronomy & Astrophysics 390, 1089–1113 (2002).
[29] D. M. Hudgins, S. A. Sandford, and L. J. Allamandola, “Infrared-Spectroscopyof Matrix-Isolated Polycyclic Aromatic Hydrocarbon Cations. 1. Matrix-Isolated Naphthalene and Perdeuterated Naphthalene,” Journal of ChemicalPhysics 98, 4243–4253 (1994).
[30] D. M. Hudgins and L. J. Allamandola, “Infrared-Spectroscopy of Matrix-Isolated Polycyclic Aromatic Hydrocarbon Cations. 2. The Members of theThermodynamically most Favorable Series Through Coronene,” Journal ofChemical Physics 99, 3033–3046 (1995).
[31] D. M. Hudgins and L. J. Allamandola, “Infrared-Spectroscopy of Matrix-Isolated Polycyclic Aromatic Hydrocarbon Cations. 3. The Polyacenes An-thracene, Tetracene, and Pentacene,” Journal of Chemical Physics 99, 8978–8986 (1995).
[32] H. Knorke, J. Langer, J. Oomens, and O. Dopfer, “Infrared Spectra of IsolatedProtonated Polycyclic Aromatic Hydrocarbon Molecules,” Astrophysical Jour-nal Letters 706, L66–L70 (2009).
[33] H. A. Galué, O. Pirali, and J. Oomens, “Gas-phase infrared spectra of cation-ized nitrogen-substituted polycyclic aromatic hydrocarbons,” Astronomy &Astrophysics 517, A15 (2010).
[34] D. M. Hudgins, C. W. Bauschlicher, and L. J. Allamandola, “Variations in thepeak position of the 6.2 µm interstellar emission feature: A tracer of N in theinterstellar polycyclic aromatic hydrocarbon population,” Astrophysical Jour-nal 632, 316–332 (2005).
151

[35] M. Rapacioli, C. Joblin, and P. Boissel, “Spectroscopy of polycyclic aromatichydrocarbons and very small grains in photodissociation regions,” Astronomy& Astrophysics 429, 193–204 (2005).
[36] O. Berné, C. Joblin, Y. Deville, J. D. Smith, M. Rapacioli, J. P. Bernard,J. Thomas, W. Reach, and A. Abergel, “Analysis of the emission of very smalldust particles from Spitzer spectro-imagery data using blind signal separationmethods,” Astronomy & Astrophysics 469, 575–586 (2007).
[37] S. M. Cazaux, P. Caselli, M. Walmsley, and A. G. G. M. Tielens, “H2 Forma-tion on Grain Surfaces,” in Astrochemistry: Recent Successes and CurrentChallenges, D. C. Lis, G. A. Blake, and E. Herbst, eds. (Cambridge UniversityPress, 2005), pp. 325–336.
[38] E. Herbst and E. F. van Dishoeck, “Complex Organic Interstellar Molecules,”Annual Review Of Astronomy and Astrophysics 47, 427–480 (2009).
[39] L. J. Allamandola, A. G. G. M. Tielens, and J. R. Barker, “InterstellarPolycyclic Aromatic-hydrocarbons - the Infrared-emission Bands, the Excita-tion Emission Mechanism, and the Astrophysical Implications,” AstrophysicalJournal Supplement Series 71, 733–775 (1989).
[40] J. L. Puget and A. Leger, “A New Component of the Interstellar Matter - SmallGrains and Large Aromatic-molecules,” Annual Review of Astronomy and As-trophysics 27, 161–198 (1989).
[41] O. Botta and J. L. Bada, “Extraterrestrial organic compounds in meteorites,”Surveys In Geophysics 23, 411–467 (2002).
[42] H. Sabbah, A. L. Morrow, P. Jenniskens, M. H. Shaddad, and R. N. Zare, “Poly-cyclic aromatic hydrocarbons in asteroid 2008 TC3: Dispersion of organiccompounds inside asteroids,” Meteoritics & Planetary Science 45, 1710–1717(2010).
[43] S. J. Clemett, C. R. Maechling, R. N. Zare, P. D. Swan, and R. M. Walker,“Identification Of Complex Aromatic-Molecules In Individual InterplanetaryDust Particles,” Science 262, 721–725 (1993).
[44] S. J. Clemett, S. A. Sandford, K. Nakamura-Messenger, F. Horz, and D. S.McKay, “Complex aromatic hydrocarbons in Stardust samples collected fromcomet 81P/Wild 2,” Meteoritics & Planetary Science 45, 701–722 (2010).
[45] J. Clairemidi, G. Moreels, O. Mousis, and P. Brechignac, “Identification ofanthracene in Comet 1P/Halley,” Astronomy & Astrophysics 492, 245–250(2008).
152

[46] H. W. Jochims, E. Rühl, H. Baumgärtel, S. Tobita, and S. Leach, “Size EffectsOn Dissociation Rates of Polycyclic Aromatic Hydrocarbon Cations - Lab-oratory Studies and Astrophysical Implications,” Astrophysical Journal 420,307–317 (1994).
[47] S. P. Ekern, A. G. Marshall, J. Szczepanski, and M. Vala, “Photodissociationof Gas-Phase Polycylic Aromatic Hydrocarbon Cations,” Journal of PhysicalChemistry A 102, 3498–3504 (1998).
[48] L. Robson, A. D. Tasker, K. W. D. Ledingham, P. McKenna, T. McCanny,C. Kosmidis, P. Tzallas, D. A. Jaroszynski, and D. R. Jones, “Ionisation andfragmentation dynamics of laser desorbed polycyclic aromatic hydrocarbonsusing femtosecond and nanosecond post-ionisation,” International Journal ofMass Spectrometry 220, 69–85 (2002).
[49] M. Murakami, R. Mizoguchi, Y. Shimada, T. Yatsuhashi, and N. Nakashima,“Ionization and fragmentation of anthracene with an intense femtosecond laserpulse at 1.4 µm,” Chemical Physics Letters 403, 238–241 (2005).
[50] T. Yatsuhashi and N. Nakashima, “Formation and Fragmentation of Quadru-ply Charged Molecular Ions by Intense Femtosecond Laser Pulses,” Journal ofPhysical Chemistry A 114, 7445–7452 (2010).
[51] L. Friedman and D. F. Lindow, “Electron Impact and Thermal Fragmenta-tion of Biphenylene,” Journal of the American Chemical Society 90, 2324–&(1968).
[52] S. Denifl, B. Sonnweber, J. Mack, L. T. Scott, P. Scheier, K. Becker, and T. D.Märk, “Appearance energies of singly, doubly, and triply charged coronene andcorannulene ions produced by electron impact,” International Journal of MassSpectrometry 249, 353–358 (2006).
[53] X. M. Wang, H. Becker, A. C. Hopkinson, R. E. March, L. T. Scott, and D. K.Bohme, “Collision-induced dissociation of 2- and 3-dimensional polycyclicaromatic hydrocarbon cations in a modified ion-trap detector,” InternationalJournal Of Mass Spectrometry And Ion Processes 161, 69–76 (1997).
[54] R. Arakawa, M. Kobayashi, and T. Nishimura, “High-energy collision-induceddissociation of small polycyclic aromatic hydrocarbons,” Journal Of MassSpectrometry 35, 178–182 (2000).
[55] J. Postma, S. Bari, R. Hoekstra, A. G. G. M. Tielens, and T. Schlatholter, “Ion-ization and Fragmentation of Anthracene upon Interaction with keV Protonsand α Particles,” Astrophysical Journal 708, 435–444 (2010).
[56] F. Seitz, A. I. S. Holm, H. Zettergren, J. H. A. B., S. Rosén, H. T. Schmidt,A. Ławicki, J. Rangama, P. Rousseau, M. Capron, R. Maisonny, A. Domaracka,
153

L. Adoui, A. Méry, B. Manil, B. A. Huber, and H. Cederquist, “Polycyclicaromatic hydrocarbon-isomer fragmentation pathways: Case study for pyreneand fluoranthene molecules and clusters,” Journal of Chemical Physics 135,064 302 (2011).
[57] K. B. Wiberg, “Properties of Some Condensed Aromatic Systems,” Journal ofOrganic Chemistry 62, 5720–5727 (1997).
[58] Y. Zhao and D. G. Truhlar, “A prototype for graphene material simulation:Structures and interaction potentials of coronene dimers,” Journal of PhysicalChemistry C 112, 4061–4067 (2008).
[59] M. Kohtani, G. A. Breaux, and M. F. Jarrold, “Water molecule adsorptionon protonated dipeptides,” Journal Of The American Chemical Society 126,1206–1213 (2004).
[60] M. Rapacioli, F. Spiegelman, D. Talbi, T. Mineva, A. Goursot, T. Heine, andG. Seifert, “Correction for dispersion and Coulombic interactions in molecu-lar clusters with density functional derived methods: Application to polycyclicaromatic hydrocarbon clusters,” Journal of Chemical Physics 130, 244 304(2009).
[61] M. Born and R. Oppenheimer, “Zuer Quantentheorie der Molekeln,” Annalender Physik 84, 457–484 (1927).
[62] P. Hohenberg and W. Kohn, “Inhomogeneous Electron Gas,” Physical ReviewB 136, 864–871 (1964).
[63] S. S. Iyengar, M. Ernzerhof, S. N. Maximoff, and G. E. Scuseria, “Challengeof creating accurate and effective kinetic-energy functionals,” Physical ReviewA 63, 052 508 (2001).
[64] W. Kohn and L. J. Sham, “Self-consistent Equations Including Exchange andCorrelation Effects,” Physical Review 140, 1133–1138 (1965).
[65] P. J. Stephens, F. J. Devlin, C. F. Chabalowski, and M. J. Frisch, “Ab-initioCalculation of Vibrational Absorption and Circular-dichroism Spectra UsingDensity-functional Force-fields,” Journal of Physical Chemistry 98, 11 623–11 627 (1994).
[66] A. D. Becke, “Density-functional Thermochemistry .3. the Role of Exact Ex-change,” Journal of Chemical Physics 98, 5648–5652 (1993).
[67] C. T. Lee, W. T. Yang, and R. G. Parr, “Development of the Colle-salvettiCorrelation-energy Formula Into A Functional of the Electron-density,” Phys-ical Review B 37, 785–789 (1988).
154

[68] S. H. Vosko, L. Wilk, and M. Nusair, “Accurate Spin-dependent Electron Liq-uid Correlation Energies For Local Spin-density Calculations - A Critical Anal-ysis,” Canadian Journal of Physics 58, 1200–1211 (1980).
[69] Y. Zhao and D. G. Truhlar, “The M06 suite of density functionals for maingroup thermochemistry, thermochemical kinetics, noncovalent interactions, ex-cited states, and transition elements: two new functionals and systematic testingof four M06-class functionals and 12 other functionals,” Theoretical ChemistryAccounts 120, 215–241 (2008).
[70] R. Krishnan, J. S. Binkley, R. Seeger, and J. A. Pople, “Self-consistentMolecular-orbital Methods .20. Basis Set For Correlated Wave-functions,”Journal of Chemical Physics 72, 650–654 (1980).
[71] M. M. Francl, W. J. Pietro, W. J. Hehre, J. S. Binkley, M. S. Gordon, D. J.Defrees, and J. A. Pople, “Self-consistent Molecular-orbital Methods .23.A Polarization-type Basis Set For 2nd-row Elements,” Journal of ChemicalPhysics 77, 3654–3665 (1982).
[72] M. J. Frisch, J. A. Pople, and J. S. Binkley, “Self-consistent Molecular-orbitalMethods .25. Supplementary Functions For Gaussian-basis Sets,” Journal ofChemical Physics 80, 3265–3269 (1984).
[73] M. J. Frisch, G. W. Trucks, H. B. Schlegel, G. E. Scuseria, M. A. Robb, J. R.Cheeseman, J. A. Montgomery Jr., T. Vreven, K. N. Kudin, J. C. Burant, J. M.Millam, S. S. Iyengar, J. Tomasi, V. Barone, B. Mennucci, M. Cossi, G. Scal-mani, N. Rega, G. A. Petersson, H. Nakatsuji, M. Hada, M. Ehara, K. Toy-ota, R. Fukuda, J. Hasegawa, M. Ishida, T. Nakajima, Y. Honda, O. Kitao,H. Nakai, M. Klene, X. Li, J. E. Knox, H. P. Hratchian, J. B. Cross, C. Adamo,J. Jaramillo, R. Gomperts, R. E. Stratmann, O. Yazyev, A. J. Austin, R. Cammi,C. Pomelli, J. W. Ochterski, P. Y. Ayala, K. Morokuma, G. A. Voth, P. Salvador,J. J. Dannenberg, V. G. Zakrzewski, S. Dapprich, A. D. Daniels, M. C. Strain,O. Farkas, D. K. Malick, A. D. Rabuck, K. Raghavachari, J. B. Foresman,J. V. Ortiz, Q. Cui, A. G. Baboul, S. Clifford, J. Cioslowski, B. B. Stefanov,G. Liu, A. Liashenko, P. Piskorz, I. Komaromi, R. L. Martin, D. J. Fox, T. Keith,M. A. Al-Laham, C. Y. Peng, A. Nanayakkara, M. Challacombe, P. M. W. Gill,B. Johnson, W. Chen, M. W. Wong, C. Gonzalez, and J. A. Pople, Gaussian03, Gaussian, Inc., Pittsburgh PA, Revision B.04 edn. (2003).
[74] M. J. Frisch, G. W. Trucks, H. B. Schlegel, G. E. Scuseria, M. A. Robb, J. R.Cheeseman, G. Scalmani, V. Barone, B. Mennucci, G. A. Petersson, H. Nakat-suji, M. Caricato, X. Li, H. P. Hratchian, A. F. Izmaylov, J. Bloino, G. Zheng,J. L. Sonnenberg, M. Hada, M. Ehara, K. Toyota, R. Fukuda, J. Hasegawa,M. Ishida, T. Nakajima, Y. Honda, O. Kitao, H. Nakai, T. Vreven, J. A. Mont-gomery, Jr., J. E. Peralta, F. Ogliaro, M. Bearpark, J. J. Heyd, E. Brothers, K. N.
155

Kudin, V. N. Staroverov, R. Kobayashi, J. Normand, K. Raghavachari, A. Ren-dell, J. C. Burant, S. S. Iyengar, J. Tomasi, M. Cossi, N. Rega, J. M. Millam,M. Klene, J. E. Knox, J. B. Cross, V. Bakken, C. Adamo, J. Jaramillo, R. Gom-perts, R. E. Stratmann, O. Yazyev, A. J. Austin, R. Cammi, C. Pomelli, J. W.Ochterski, R. L. Martin, K. Morokuma, V. G. Zakrzewski, G. A. Voth, P. Sal-vador, J. J. Dannenberg, S. Dapprich, A. D. Daniels, Ö. Farkas, J. B. Foresman,J. V. Ortiz, J. Cioslowski, and D. J. Fox, “Gaussian 09 Revision A.2,” GaussianInc. Wallingford CT 2009.
[75] F. Wöhler, “Ueber künstliche Bildung des Harnstoffs,” Annalen der Physik undChemie 88, 253–256 (1828).
[76] R. Uy and F. Wold, “Posttranslational covalent modification of proteins,” Sci-ence 198, 890–896 (1977).
[77] A. Ambrogelly, S. Palioura, and D. Soll, “Natural expansion of the geneticcode,” Nature Chemical Biology 3, 29–35 (2007).
[78] J. M. Berg, J. Tymoczko, and L. Stryer, Biochemistry (W. H. Freeman andCompany, 2002), 5th edn., ISBN 0-7167-4684-0.
[79] B. Alberts, D. Bray, K. Hopkin, A. Johnson, J. Lewis, M. Raff, K. Roerts, andP. Walter, Essential Cell Biology (Garland Science, 2004), 2nd edn., ISBN0-8153-3481-8.
[80] R. Aebersold and D. Goodlett, “Mass spectrometry in proteomics,” CHEMI-CAL REVIEWS 101, 269–295 (2001).
[81] P. Roepstorff and J. Fohlman, “Proposal For A Common Nomenclature ForSequence Ions In Mass-spectra of Peptides,” Biomedical Mass Spectrometry11, 601–601 (1984).
[82] S. A. McLuckey, “Principles Of Collisional Activation In Analytical Mass-Spectrometry,” Journal Of The American Society For Mass Spectrometry 3,599–614 (1992).
[83] M. W. Senko, J. P. Speir, and F. W. McLafferty, “Collisional Activation OfLarge Multiply-Charged Ions Using Fourier-Transform Mass-Spectrometry,”Analytical Chemistry 66, 2801–2808 (1994).
[84] R. A. Zubarev, N. L. Kelleher, and F. W. McLafferty, “Electron capture disso-ciation of multiply charged protein cations. A nonergodic process,” Journal OfThe American Chemical Society 120, 3265–3266 (1998).
[85] J. T. O’Brien, J. S. Prell, A. I. S. Holm, and E. R. Williams, “Effects of electronkinetic energy and ion-electron inelastic collisions in electron capture dissoci-ation measured using ion nanocalorimetry,” Journal of the American SocietyFor Mass Spectrometry 19, 772–779 (2008).
156

[86] A. Al-Khalili, R. Thomas, A. Ehlerding, F. Hellberg, W. D. Geppert,V. Zhaunerchyk, M. af Ugglas, M. Larsson, E. Uggerud, J. Vedde, C. Adl-hart, J. Semaniak, M. Kaminska, R. A. Zubarev, F. Kjeldsen, P. U. Ander-sson, F. Osterdahl, V. A. Bednarska, and A. Paal, “Dissociative recombina-tion cross section and branching ratios of protonated dimethyl disulfide andN-methylacetamide,” Journal Of Chemical Physics 121, 5700–5708 (2004).
[87] S. A. Shaffer, M. Sadilek, and F. Turecek, “Hypervalent ammonium radicals.Effects of alkyl groups and aromatic substituents,” Journal of Organic Chem-istry 61, 5234–5245 (1996).
[88] R. A. Zubarev, N. A. Kruger, E. K. Fridriksson, M. A. Lewis, D. M. Horn, B. K.Carpenter, and F. W. McLafferty, “Electron capture dissociation of gaseousmultiply-charged proteins is favored at disulfide bonds and other sites of highhydrogen atom affinity,” Journal Of The American Chemical Society 121,2857–2862 (1999).
[89] P. Hvelplund, B. Liu, S. Brøndsted Nielsen, and S. Tomita, “Electron captureinduced dissociation of peptide dications,” International Journal Of Mass Spec-trometry 225, 83–87 (2003).
[90] T. Chakraborty, A. I. S. Holm, P. Hvelplund, S. B. Nielsen, J. C. Poully, E. S.Worm, and E. R. Williams, “On the survival of peptide cations after electroncapture: Role of internal hydrogen bonding and microsolvation,” Journal OfThe American Society For Mass Spectrometry 17, 1675–1680 (2006).
[91] P. Hvelplund, B. Liu, S. Brøndsted Nielsen, S. Panja, J. C. Poully, andK. Støchkel, “Electron capture induced dissociation of peptide ions: Identi-fication of neutral fragments from secondary collisions with cesium vapor,”International Journal Of Mass Spectrometry 263, 66–70 (2007).
[92] V. Bernigaud, H. Cederquist, N. Haag, A. I. S. Holm, B. A. Huber,P. Hvelplund, U. Kadhane, M. K. Larsen, B. Manil, S. B. Nielsen, S. Panja,S. Ptasinska, J. Rangama, P. Reinhed, H. T. Schmidt, A. V. Streletskii,K. Støchkel, E. S. Worm, and H. Zettergren, “Electron capture-induced disso-ciation of AK dipeptide dications: Influence of ion velocity, crown-ether com-plexation and collision gas,” International Journal Of Mass Spectrometry 276,77–81 (2008).
[93] H. J. Cooper, S. Akbarzadeh, J. K. Heath, and M. Zeller, “Data-dependent elec-tron capture dissociation FT-ICR mass spectrometry for proteomic analyses,”Journal of Proteome Research 4, 1538–1544 (2005).
[94] V. G. Voinov, M. L. Deinzer, and D. F. Barofsky, “Radio-Frequency-Free Cellfor Electron Capture Dissociation in Tandem Mass Spectrometry,” AnalyticalChemistry 81, 1238–1243 (2009).
157

[95] C. J. Pedersen, “Cyclic polyethers and their complexes with metal salts,” Jour-nal of the American Chemical Society 89, 7017–7036 (1967).
[96] B. Boudaïffa, P. Cloutier, D. Hunting, M. A. Huels, and L. Sanche, “Resonantformation of DNA strand breaks by low-energy (3 to 20 eV) electrons,” Science287, 1658–1660 (2000).
[97] R. Barrios, P. Skurski, and J. Simons, “Mechanism for damage to DNA by low-energy electrons,” JOURNAL OF PHYSICAL CHEMISTRY B 106, 7991–7994 (2002).
[98] L. Sanche, “Low energy electron-driven damage in biomolecules,” EuropeanPhysical Journal D 35, 367–390 (2005).
[99] S. Denifl, P. Sulzer, D. Huber, F. Zappa, M. Probst, T. D. Mark, P. Scheier,N. Injan, J. Limtrakul, R. Abouaf, and H. Dunet, “Influence of functionalgroups on the site-selective dissociation of adenine upon low-energy elec-tron attachment,” Angewandte Chemie-international Edition 46, 5238–5241(2007).
[100] B. Liu, P. Hvelplund, S. Brøndsted Nielsen, and S. Tomita, “Hydrogen lossfrom nucleobase nitrogens upon electron attachment to isolated DNA and RNAnucleotide anions,” Journal of Chemical Physics 121, 4175–4179 (2004).
[101] N. Haag, Probing biomolecular fragmentation, Ph.D. thesis, StockholmUniversity, Sweden (2011).http://urn.kb.se/resolve?urn=urn:nbn:se:su:diva-54524
[102] S. G. Swarts, M. D. Sevilla, D. Becker, C. J. Tokar, and K. T. Wheeler,“Radiation-Induced DND Damage As A Function Of Hydration .1. ReleaseOf Unaltered Bases,” Radiation Research 129, 333–344 (1992).
[103] D. F. Liu, T. Wyttenbach, and M. T. Bowers, “Hydration of mononucleotides,”Journal of the American Chemical Society 128, 15 155–15 163 (2006).
[104] F. Calvo and J. Douady, “Stepwise hydration and evaporation of adenosinemonophosphate nucleotide anions: a multiscale theoretical study,” PhysicalChemistry Chemical Physics 12, 3404–3414 (2010).
[105] B. Liu, S. Brøndsted Nielsen, P. Hvelplund, H. Zettergren, H. Cederquist,B. Manil, and B. A. Huber, “Collision-induced dissociation of hydrated adeno-sine monophosphate nucleotide ions: Protection of the ion in water nanoclus-ters,” Physical Review Letters 97, 133 401 (2006).
[106] O. V. Boltalina, P. Hvelplund, T. J. D. Jorgensen, M. C. Larsen, M. O. Larsson,and D. A. Sharoitchenko, “Electron capture by fluorinated fullerene anions incollisions with Xe atoms,” Physical Review A 62, 023 202 (2000).
158

[107] T. J. D. Jørgensen, J. U. Andersen, P. Hvelplund, and M. Sørensen, “High-energy collisions of multiply charged lysozyme ions in gases,” InternationalJournal Of Mass Spectrometry 207, 31–39 (2001).
[108] M. Dole, L. L. Mack, and R. L. Hines, “Molecular Beams Of Macroions,”Journal Of Chemical Physics 49, 2240–& (1968).
[109] M. Yamashita and J. B. Fenn, “Electrospray Ion-Source - Another Variation OnThe Free-Jet Theme,” Journal Of Physical Chemistry 88, 4451–4459 (1984).
[110] G. Taylor, “Disintegration Of Water Drops In Electric Field,” Proceedings OfThe Royal Society Of London Series A-Mathematical And Physical Sciences280, 383–397 (1964).
[111] L. Rayleigh, “On the Equilibrium of Liquid Conducting Masses charged withElectricity,” Philisophical Magazine 14, 184–186 (1882).
[112] J. Zeleny, “Instability of Electrified Liquid Surfaces,” Phys. Rev. 10, 1–6(1917).
[113] J. V. Iribarne and B. A. Thomson, “Evaporation Of Small Ions From ChargedDroplets,” Journal Of Chemical Physics 64, 2287–2294 (1976).
[114] B. A. Thomson and J. V. Iribarne, “Field-Induced Ion Evaporation From LiquidSurfaces At Atmospheric-Pressure,” Journal Of Chemical Physics 71, 4451–4463 (1979).
[115] P. Kebarle, “A brief overview of the present status of the mechanisms involvedin electrospray mass spectrometry,” Journal Of Mass Spectrometry 35, 804–817 (2000).
[116] M. Gamero-Castano and J. F. de la Mora, “Kinetics of small ion evaporationfrom the charge and mass distribution of multiply charged clusters in electro-sprays,” Journal Of Mass Spectrometry 35, 790–803 (2000).
[117] S. Nguyen and J. B. Fenn, “Gas-phase ions of solute species from chargeddroplets of solutions,” Proceedings Of The National Academy Of Sciences OfThe United States Of America 104, 1111–1117 (2007).
[118] T. Nohmi and J. B. Fenn, “Electrospray Mass-Spectrometry Of Poly(EthyleneGlycols) With Molecular-Weights Up To 5 Million,” Journal Of The AmericanChemical Society 114, 3241–3246 (1992).
[119] J. F. de la Mora, “Electrospray ionization of large multiply charged species pro-ceeds via Dole’s charged residue mechanism,” Analytica Chimica Acta 406,93–104 (2000).
159

[120] A. T. Iavarone and E. R. Williams, “Mechanism of charging and supercharg-ing molecules in electrospray ionization,” Journal Of The American ChemicalSociety 125, 2319–2327 (2003).
[121] F. Turecek and E. A. Syrstad, “Mechanism and energetics of intramolecularhydrogen transfer in amide and peptide radicals and cation-radicals,” Journalof the American Chemical Society 125, 3353–3369 (2003).
[122] J. S. Prell, J. T. O’Brien, A. I. S. Holm, R. D. Leib, W. A. Donald, and E. R.Williams, “Electron capture by a hydrated gaseous peptide: Effects of wateron fragmentation and molecular survival,” Journal of the American ChemicalSociety 130, 12 680–12 689 (2008).
[123] B. Liu, S. Tomita, J. Rangama, P. Hvelplund, and S. Brøndsted Nielsen, “Elec-tron attachment to "naked" and microsolvated nucleotide anions: Detection oflong-lived dianions,” Chemphyschem 4, 1341–1344 (2003).
[124] Y. H. Ho and P. Kebarle, “Studies of the dissociation mechanisms of depro-tonated mononucleotides by energy resolved collision-induced dissociation,”International Journal Of Mass Spectrometry 165, 433–455 (1997).
[125] S. Brøndsted Nielsen and A. M. Ejsing, “On the negative vertical detachmentenergies of SO2−
4 , SeO2−4 , and SO2−
4 (H2O),” Chemical Physics Letters 441,213–215 (2007).
[126] M. Faraday, “On New Compounds of Carbon and Hydrogen, and on CertainOther Products Obtained during the Decomposition of Oil by Heat,” Philo-sophical Transactions of the Royal Society of London 115, 440–466 (1825).
[127] E. Mitscherlich, “Über das Benzol und die Säuren der Oel- und Talgarten,”Annalen der Pharmacie 9, 39–48 (1834).
[128] W. Kauzmann, Quantum Chemistry (Academic Press Inc., New York, 1957).
[129] S. H. Maron and J. B. Lando, Fundamentals of Physical Chemistry (CollierMacmillan Publishers, London, 1974), ISBN 0-02-376120-2.
[130] D. A. McQuarrie, Quantum Chemistry (University Science Books, Sausalito,1983), ISBN 0-935702-13-X.
[131] J. N. Murrell, S. F. A. Kettle, and J. M. Tedder, The Chemical Bond (JohnWiley & Sons Ltd., Chichester, 1978), ISBN 0-471-99577-0.
[132] C. Bosetti, P. Boffetta, and C. La Vecchia, “Occupational exposures to poly-cyclic aromatic hydrocarbons, and respiratory and urinary tract cancers: aquantitative review to 2005,” Annals of Oncology 18, 431–446 (2007).
160

[133] S. Leach, “Photophysics, Electronic Spectroscopy and Relaxation of Molecu-lar Ions and Radicals with Special Reference to Polycyclic Aromatic Hydrocar-bons,” in Polocyclic Aromatic Hydrocarbons and Astrophysics, A. Léger,L. d’Hendecourt, and N. Boccara, eds. (D. Reidel Publishing Company, Dor-drecht, Holland, 1987), pp. 99–127.
[134] A. Yokoyama, X. Zhao, E. J. Hintsa, R. E. Continetti, and Y. T. Lee,“Molecular-beam Studies of the Photodissociation of Benzene At 193 and 248Nm,” Journal of Chemical Physics 92, 4222–4233 (1990).
[135] Y. Gotkis, M. Oleinikova, M. Naor, and C. Lifshitz, “Time-dependent Mass-spectra and Breakdown Graphs .17. Naphthalene and Phenanthrene,” Journalof Physical Chemistry 97, 12 282–12 290 (1993).
[136] Y. P. Ho, R. C. Dunbar, and C. Lifshitz, “C-H Bond Strength of NaphthaleneIon. A Reevaluation Using New Time-Resolved Photodissociation Results,”Journal of the American Chemical Society 117, 6504–6508 (1995).
[137] Y. Ling, Y. Gotkis, and C. Lifshitz, “Time-dependent Mass-spectra and Break-down Graphs .18. Pyrene,” European Mass Spectrometry 1, 41–49 (1995).
[138] Y. Ling and C. Lifshitz, “Time-dependent Mass-spectra and BreakdownGraphs .19. Fluoranthene,” Journal of Physical Chemistry 99, 11 074–11 080(1995).
[139] Y. Ling and C. Lifshitz, “Time-dependent mass spectra and breakdown graphs.21. C14H10 isomers,” Journal of Physical Chemistry A 102, 708–716 (1998).
[140] Y. A. Dyakov, C. K. Ni, S. H. Lin, Y. T. Lee, and A. M. Mebel, “Ab initioand RRKM study of photodissociation of azulene cations,” Physical ChemistryChemical Physics 8, 1404–1415 (2006).
[141] H. W. Jochims, H. Rasekh, E. Ruhl, H. Baumgartel, and S. Leach, “ThePhotofragmentation of Naphthalene and Azulene Monocations In the Energy-range 7-22 Ev,” Chemical Physics 168, 159–184 (1992).
[142] W. G. Cole, D. H. Williams, and A. N. H. Yeo, “Studies In Mass Spectrometry.33. Hydrogen Scrambling In Methylpyridines and Quinoline,” Journal of theChemical Society B-physical Organic pp. 1284–& (1968).
[143] R. G. Cooks, I. Howe, S. W. Tam, and D. H. Williams, “Studies In MassSpectrometry .29. Hydrogen Scrambling In Some Bicyclic Aromatic Systems .Randomization Over 2 Rings,” Journal of the American Chemical Society 90,4064–& (1968).
[144] K. D. Rand and T. J. D. Jorgensen, “Development of a peptide probe for theoccurrence of hydrogen (1H/2H) scrambling upon gas-phase fragmentation,”Analytical Chemistry 79, 8686–8693 (2007).
161

[145] S. J. Pachuta, H. I. Kenttamaa, T. M. Sack, R. L. Cerny, K. B. Tomer, M. L.Gross, R. R. Pachuta, and R. G. Cooks, “Excitation and Dissociation of Iso-lated Ions Derived From Polycyclic Aromatic-hydrocarbons,” Journal of theAmerican Chemical Society 110, 657–665 (1988).
[146] B. A. Mansoori, “Isomeric identification and quantification of polycyclic aro-matic hydrocarbons in environmental samples by liquid chromatography tan-dem mass spectrometry using a high pressure quadrupole collision cell,” RapidCommunications In Mass Spectrometry 12, 712–728 (1998).
[147] Y. Ling, J. M. L. Martin, and C. Lifshitz, “Energetics of acetylene loss fromC14H•+10 cations: A density functional calculation,” Journal of Physical Chem-istry A 101, 219–226 (1997).
[148] P. J. Linstrom and W. G. Mallardeds.„ NIST Chemistry WebBook, NISTStandard Reference Database Number 69 (National Institute of Standardsand Technology, Gaithersburg MD, 20899, retrieved July 5 2011).http://webbook.nist.gov/
[149] D. Biermann and W. Schmidt, “Diels-Alder Reactivity of Polycyclic Aromatic-hydrocarbons .1. Acenes and Benzologs,” Journal of the American ChemicalSociety 102, 3163–3173 (1980).
[150] J. W. Hager and S. C. Wallace, “2-laser Photoionization Supersonic Jet Mass-spectrometry of Aromatic-molecules,” Analytical Chemistry 60, 5–10 (1988).
[151] E. Clar, J. M. Robertson, R. Schlögl, and W. Schmidt, “Photoelectron-spectraof Polynuclear Aromatics .6. Applications To Structural Elucidation: "Cir-cumanthracene",” Journal of the American Chemical Society 103, 1320–1328(1981).
[152] S. Tobita, S. Leach, H. W. Jochims, E. Rühl, E. Illenberger, and H. Baumgärtel,“Single-ionization and Double-ionization Potentials of Polycyclic Aromatic-hydrocarbons and Fullerenes By Photon and Electron-impact,” Canadian Jour-nal of Physics 72, 1060–1069 (1994).
[153] D. Schröder, J. Loos, H. Schwarz, R. Thissen, D. V. Preda, L. T. Scott,D. Caraiman, M. V. Frach, and D. K. Böhme, “Single and double ionizationof corannulene and coronene,” Helvetica Chimica Acta 84, 1625–1634 (2001).
[154] K. S. Kim, P. Tarakeshwar, and J. Y. Lee, “Molecular clusters of π-systems:Theoretical studies of structures, spectra, and origin of interaction energies,”Chemical Reviews 100, 4145–4185 (2000).
[155] F. X. Desert, F. Boulanger, and J. L. Puget, “Interstellar Dust Models For Ex-tinction and Emission,” Astronomy and Astrophysics 237, 215–236 (1990).
162

[156] D. Cesarsky, J. Lequeux, C. Ryter, and M. Gerin, “ISO observations of thereflection nebula Ced 201: evolution of carbonaceous dust,” Astronomy & As-trophysics 354, L87–L91 (2000).
[157] P. Boissel, C. Joblin, and P. Pernot, “Singular value decomposition: A tool toseparate elementary contributions in ISOCAM spectral maps,” Astronomy &Astrophysics 373, L5–L8 (2001).
[158] F. Piuzzi, I. Dimicoli, M. Mons, P. Millie, V. Brenner, Q. Zhao, B. Soep, andA. Tramer, “Spectroscopy, dynamics and structures of jet formed anthraceneclusters,” Chemical Physics 275, 123–147 (2002).
[159] B. Bouvier, V. Brenner, P. Millié, and J. M. Soudan, “A model potential ap-proach to charge resonance phenomena in aromatic cluster ions,” Journal ofPhysical Chemistry A 106, 10 326–10 341 (2002).
[160] T. Janowski, A. R. Ford, and P. Pulay, “Accurate correlated calculation of theintermolecular potential surface in the coronene dimer,” Molecular Physics108, 249–257 (2010).
[161] D. W. J. Cruickshank, “A Detailed Refinement of the Crystal and MolecularStructure of Anthracene,” Acta Crystallographica 9, 915–923 (1956).
[162] J. Jortner, S. A. Rice, and R. Silbey, Excitons and Energy Transfer in Molec-ular Crystals (Academic Press, New York and London, 1965), pp. 139–160.
[163] J. K. Song, N. K. Lee, J. H. Kim, S. Y. Han, and S. K. Kim, “Anion clustersof anthracene, An−n (n=1-16),” Journal of Chemical Physics 119, 3071–3077(2003).
[164] D. E. Williams and Y. L. Xiao, “Benzene, Naphthalene and Anthracene Dimersand Their Relation To the Observed Crystal-structures,” Acta Crystallograph-ica Section A 49, 1–10 (1993).
[165] M. Rapacioli, F. Calvo, F. Spiegelman, C. Joblin, and D. J. Wales, “Stackedclusters of polycyclic aromatic hydrocarbon molecules,” Journal of PhysicalChemistry A 109, 2487–2497 (2005).
[166] T. Chakraborty and E. C. Lim, “Study of Van-der-waals Clusters of AnthraceneBy Laser-induced Fluorescence In A Supersonic Jet: Evidence For Two Struc-turally Different Dimers,” Journal of Physical Chemistry 97, 11 151–11 153(1993).
[167] T. Matsuoka, K. Kosugi, K. Hino, M. Nishiguchi, K. Ohashi, N. Nishi, andH. Sekiya, “Electronic spectra of jet-cooled anthracene dimer: Evidence of twoisomers in the electronic ground state,” Journal of Physical Chemistry A 102,7598–7602 (1998).
163

[168] S. D. Chakarova-Käck, A. Vojvodic, J. Kleis, P. Hyldgaard, and E. Schröder,“Binding of polycyclic aromatic hydrocarbons and graphene dimers in densityfunctional theory,” New Journal of Physics 12, 013 017 (2010).
[169] T. S. Totton, A. J. Misquitta, and M. Kraft, “A First Principles Developmentof a General Anisotropic Potential for Polycyclic Aromatic Hydrocarbons,”Journal of Chemical Theory and Computation 6, 683–695 (2010).
[170] O. I. Obolensky, V. V. Semenikhina, A. V. Solov’yov, and W. Greiner, “Inter-play of electrostatic and van der Waals forces in coronene dimer,” InternationalJournal of Quantum Chemistry 107, 1335–1343 (2007).
[171] R. Podeszwa, “Interactions of graphene sheets deduced from properties ofpolycyclic aromatic hydrocarbons,” Journal of Chemical Physics 132, 044 704(2010).
[172] M. Rapacioli and F. Spiegelman, “Modelling singly ionized coronene clusters,”European Physical Journal D 52, 55–58 (2009).
[173] F. Chandezon, B. Huber, and C. Ristori, “A new-regime Wiley-McLaren Time-of-flight mass-spectrometer,” Review of Scientific Instruments 65, 3344–3353(1994).
[174] T. Bergen, X. Biquard, A. Brenac, F. Chandezon, B. A. Huber, D. Jalabert,H. Lebius, M. Maurel, E. Monnand, J. Opitz, A. Pesnelle, B. Pras, C. Ris-tori, and J. C. Rocco, “Multiply charged cluster ion crossed-beam apparatus:Multi-ionization of clusters by ion impact,” Review of Scientific Instruments70, 3244–3253 (1999).
[175] H. Cederquist, A. Fardi, K. Haghighat, A. Langereis, H. T. Schmidt, and S. H.Schwartz, “Highly charged ions colliding with atoms, surfaces and clusters,”Physica Scripta T80A, 46–51 (1999).
[176] L. Maunoury, R. Leroy, T. Been, G. Gaubert, L. Guillaume, D. Leclerc, A. Lep-outre, V. Mouton, J. Y. Pacquet, J. M. Ramillon, and R. Vicquelin, “LIMBE:A new facility for low energy beams,” Review of Scientific Instruments 73,561–563 (2002).
[177] B. E. Wolf, Handbook of Ion Surces (CRC Press, 1995), ISBN 0-8493-2502-1.
[178] W. Wiley and I. McLaren, “Time-of-flight mass spectrometer with improvedresolution,” Review of Scientific Instruments 26, 1150–1157 (1955).
[179] N. R. Daly, “High Sensitivity Mass Spectrometer Leak Detector,” Review ofScientific Instruments 31, 720–723 (1960).
[180] R. E. Olson and A. Salop, “Electron-transfer Between Multicharged Ions andNeutral Species,” Physical Review A 14, 579–585 (1976).
164

[181] A. Bárány, G. Astner, H. Cederquist, H. Danared, S. Huldt, P. Hvelplund,A. Johnson, H. Knudsen, L. Liljeby, and K. G. Rensfelt, “Absolute Cross-sections For Multi-electron Processes In Low-energy Arq+-Ar Collisions -Comparison With Theory,” Nuclear Instruments & Methods In Physics Re-search Section B: Beam Interactions With Materials and Atoms 9, 397–399(1985).
[182] F. Folkmann, R. Mann, and H. F. Beyer, “Excited-states of Few-electron Re-coil Ions From Ion Impact On Neon Studied By X-ray and Electron Measure-ments,” Physica Scripta T3, 88–95 (1983).
[183] B. Forsberg, “Classical over-the-barrier model for ionization of poly-cyclicaromatic hydrocarbons in keV-collisions with atomic ions,” (2011).http://urn.kb.se/resolve?urn=urn:nbn:se:su:diva-60168
[184] H. Zettergren, H. T. Schmidt, H. Cederquist, J. Jensen, S. Tomita, P. Hvelplund,H. Lebius, and B. A. Huber, “Static over-the-barrier model for electron transferbetween metallic spherical objects,” Physical Review A 66, 032 710 (2002).
[185] F. T. Smith, “Capacitive Energy and Ionization of Aromatic Hydrocarbons,”Journal of Chemical Physics 34, 793 (1961).
[186] A. P. Scott and L. Radom, “Harmonic vibrational frequencies: An evaluationof Hartree-Fock, Moller-Plesset, quadratic configuration interaction, densityfunctional theory, and semiempirical scale factors,” Journal of Physical Chem-istry 100, 16 502–16 513 (1996).
[187] J. Lindhard, M. Scharff, and Schiøtt, “Range Concepts and Heavy Ion Ranges,”Matematisk-fysiske Meddelelser Udgivet Af Det Kongelige Danske Vidensk-abernes Selskab 33, 1 (1963).
[188] J. Lindhard, V. Nielsen, and M. Scharff, “Approximation Method In Classi-cal Scattering By Screened Coulomb Fields,” Matematisk-fysiske MeddelelserUdgivet Af Det Kongelige Danske Videnskabernes Selskab 36, 1 (1968).
[189] D. Stahl and F. Maquin, “Charte-stripping mass-spectrometry of molecularions from polyacenes and molecular orbital theory,” Chemical Physics Letters108, 613–617 (1984).
[190] R. M. Acheson, R. T. Aplin, and R. G. Bolton, “Electron-impact-induced Frag-mentation of Acridine,” Organic Mass Spectrometry 8, 95–102 (1974).
[191] A. Van Orden and R. J. Saykally, “Small carbon clusters: Spectroscopy, struc-ture, and energetics,” Chemical Reviews 98, 2313–2357 (1998).
[192] J. R. Heath, Q. Zhang, S. C. O’Brien, R. F. Curl, H. W. Kroto, and R. E. Smal-ley, “The formation of long carbon chain molecules during laser vaporizationof graphite,” Journal of the American Chemical Society 109, 359–363 (1987).
165

[193] T. Schlathölter, M. W. Newman, T. R. Niedermayr, G. A. Machicoane, J. W.McDonald, T. Schenkel, R. Hoekstra, and A. V. Hamza, “Hydrogenated car-bon clusters produced by highly charged ion impact on solid C84,” EuropeanPhysical Journal D 12, 323–327 (2000).
[194] M. Schmidt, A. Masson, and C. Bréchignac, “Coronene cluster experiments:Stability and thermodynamics,” International Journal of Mass Spectrometry252, 173–179 (2006).
[195] S. Elliott, The Physics and Chemistry of Solids (John Wiley & Sons Ltd.,Chichester, 1998), ISBN 0-471-98195-8.
[196] J. H. Beynon and J. R. Gilbert, Application of Transition State Theory toUnimolecular Reactions – An Introduction (John Wiley & Sons Ltd., 1984),ISBN 0-471-90316-7.
[197] H. T. Schmidt, J. H. A. B., R. D. Thomas, W. D. Geppert, N. Haag, P. Rein-hed, S. Rosén, M. Larsson, H. Danared, K.-G. Rensfelt, L. Liljeby, L. Bagge,M. Björkhage, M. Blom, P. Löfgren, A. Källberg, A. Simonsson, A. Paál,H. Zettergren, and H. Cederquist, “DESIREE as a new tool for interstellar ionchemistry,” International Journal of Astrobiology 7, 205–208 (2008).
[198] R. D. Thomas, H. T. Schmidt, G. Andler, M. Björkhage, M. Blom,L. Brännholm, E. Bäckstrom, H. Danared, S. Das, N. Haag, P. Halldén, F. Hell-berg, A. I. S. Holm, H. A. B. Johansson, A. Källberg, G. Källersjö, M. Lars-son, S. Leontein, L. Liljeby, P. Löfgren, B. Malm, S. Mannervik, M. Masuda,D. Misra, A. Orbán, A. Paál, P. Reinhed, K. G. Rensfelt, S. Rosén, K. Schmidt,F. Seitz, A. Simonsson, J. Weimer, H. Zettergren, and H. Cederquist, “Thedouble electrostatic ion ring experiment: A unique cryogenic electrostatic stor-age ring for merged ion-beams studies,” Review of Scientific Instruments 82(2011).
[199] J. E. P. Syka, J. J. Coon, M. J. Schroeder, J. Shabanowitz, and D. F. Hunt,“Peptide and protein sequence analysis by electron transfer dissociation massspectrometry,” Proceedings Of The National Academy Of Sciences Of TheUnited States Of America 101, 9528–9533 (2004).
[200] T. Wyttenbach, P. R. Kemper, and M. T. Bowers, “Design of a new electrosprayion mobility mass spectrometer,” International Journal Of Mass Spectrometry212, 13–23 (2001).
[201] M. P. Andersson and P. Uvdal, “New scale factors for harmonic vibrationalfrequencies using the B3LYP density functional method with the triple-xi basisset 6-311+G(d,p),” Journal of Physical Chemistry A 109, 2937–2941 (2005).
166

Acknowledgments
I am very grateful for the five years I have spent studying for my PhD atStockholm University. It has been a very challenging experience, but also amost rewarding one. I feel that I have grown a lot during this time, both as aperson and as a scientist, but I would never have made it this far if not for thehelp of friends and family, colleagues and collaborators.
First of all I would like to thank my supervisors, of which I have been luckyenough to have had three: Henning T. Schmidt, who was the first to introduceme to the world of experimental physics and who always have shown greatenthusiasm, patience, and joy in answering all my numerous questions. HenrikCederquist, with whom I have had many enlightening discussions and who hasbeen very inspiring, especially when it comes to scientific writing. HenningZettergren, who grew to be one of the people I depended on the most for mywork and who has ever been a source for great ideas and terrific thinking.Thank you all for your confidence and encouragement, and for all the helpand knowledge you have given me.
I would like to give special thanks to Nicole Haag, with whom I haveworked closely on several projects and admire for having a wonderful spiritand a keen intellect. And a special thank you to Anne I. S. Holm for all herhelp in executing both the Aarhus and the Caen experiments, as well as inanalyzing the results.
The work in this thesis was carried out in collaboration with two researchgroups, and to these I would also like to give special thanks. To PrebenHvelplund, Steen Brøndsted Nielsen, Bo Liu (now at Henan University,China), and all the other past and present members of the Aarhus team, andto Bernd A. Huber, Patrick Rousseau, Arkadiusz Ławicki, Elie Lattouf, aswell as all the others of the CIMAP team in Caen, France: Thank you for thehospitality, many good laughs, and for all your invaluable help and expertisein performing the experiments and analysis.
Thank you to Fabian Seitz for all the help in reducing huge data files, andfor many good discussions.
Many thanks to Magnus Gudmundsson for being such a great guy. Eventhough we only shared a few joint projects, I always enjoyed our discussions.
Thank you to Peter Reinhed, with whom it has been a joy to share an office.Thank you for all your help in both small and large matters.
A big thank you to Björn Forsberg for his excellent work on the PAH discmodel, and for taking the time to explain it to me.
167
For the work related to the new ESI platform, which was only briefly men-tioned in this thesis, but nonetheless has been an important part of the past fiveyears, I would like to thank Mikael Björkhage, Stefan Rosén, Gunnar Kjäl-larsjö, Lasse Brännholm, Jan Weimer, Sven Leontein, Mats Engström, andLeif Liljeby for all their technical support and many excellent suggestions forimprovements. The work carries on thanks to the efforts of John Alexander,who I think is just the man for the job!
Thank you to everyone involved in the Astrobiology Graduate School. Ifeel very happy, proud, and privileged to have been part of this school, and Iam grateful for all the work and effort you have put in to it. A special thankyou to Wolf D. Geppert for creating memorable events on so many locations.And to all my fellow astrobiology graduate students – Marc P. Höppner, AnnaNeubeck, Ricky Nilsson, Nguyen Duc, Josefin Plathan, Sandra Siljeström, andErik Vigren – I have truly enjoyed all the times we have spent together, bothon and off work.
Many great thanks to the past, present, and occasional members of the"lunch group", including, but not limited to, Sven Mannervik, Peter Lundin,Jonas Gurell, Erik Bäckström, Andreas Solders, and Markus Suhonen Linné.Thank you for all the wonderful company and all the interesting discussions!
A very special thanks to Ella Carlsson Sjöberg, who is not only a goodfriend but also a great source for wisdom. Thank you for believing in me. Youinspired me and without your encouragement I would probably never haveembarked on the path towards a PhD in the first place.
And to the Svalbard gang – Andreas Johnsson, Ernst Hauber, Dennis Reiss,Mats Olvmo, Steve McDaniel, Mike Zanetti, and Lars Johansson – thank youfor providing some of the most exciting and memorable experiences duringmy PhD studies. But most of all, thank you for all the excellent field work!
I got my first taste of real science from a stay at NASA Ames ResearchCenter about a year before I began my PhD studies, and from this brief period,which was a huge inspiration for me, I would like to thank Christopher P.McKay and Jennifer Heldmann – two of the greatest people I have ever met!
And to everyone not mentioned here by name but nonetheless have con-tributed to various aspects of my PhD: I am sorry, but one has to draw the linesomewhere, and I have recently learned that having extra pages in a thesis canbe quite expensive. However, you can be sure that you all have my deepestthanks!
There are not words enough to express the gratitude I feel towards my fam-ily for their undemanding, unselfish, and never waning support throughout allmy choices in life.
Last, but in life my first, I wish to thank Bibbi, for everything.
Stockholm, October 2011Henrik A. B. Johansson
168


![2011, 307-327 307 Predicting the p of Small Molecules · Predicting the pKa of Small Molecules ... In silico prediction of ionization (theory and software) [6] ... dimensionless activity](https://static.fdocuments.in/doc/165x107/5ae77ffe7f8b9ae1578f1c79/2011-307-327-307-predicting-the-p-of-small-the-pka-of-small-molecules-in-silico.jpg)