Ionic liquid-based nanofluids (ionanofluids) for thermal ...
33
Ionic liquid-based nanofluids (ionanofluids) for thermal applications: an experimental thermophysical characterization Oster, K., Hardacre, C., Jacquemin, J., Ribeiro, A. P. C., & Elsinawi, A. (2019). Ionic liquid-based nanofluids (ionanofluids) for thermal applications: an experimental thermophysical characterization. Pure and Applied Chemistry, 91(8), 1309-1340. https://doi.org/10.1515/pac-2018-1114 Published in: Pure and Applied Chemistry Document Version: Publisher's PDF, also known as Version of record Queen's University Belfast - Research Portal: Link to publication record in Queen's University Belfast Research Portal Publisher rights Copyright 2019 the authors. This is an open access article published under a Creative Commons Attribution-NonCommercial-NoDerivs License (https://creativecommons.org/licenses/by-nc-nd/4.0/), which permits distribution and reproduction for non-commercial purposes, provided the author and source are cited General rights Copyright for the publications made accessible via the Queen's University Belfast Research Portal is retained by the author(s) and / or other copyright owners and it is a condition of accessing these publications that users recognise and abide by the legal requirements associated with these rights. Take down policy The Research Portal is Queen's institutional repository that provides access to Queen's research output. Every effort has been made to ensure that content in the Research Portal does not infringe any person's rights, or applicable UK laws. If you discover content in the Research Portal that you believe breaches copyright or violates any law, please contact [email protected]. Download date:06. Apr. 2022
Transcript of Ionic liquid-based nanofluids (ionanofluids) for thermal ...

Ionic liquid-based nanofluids (ionanofluids) for thermal applications:an experimental thermophysical characterization
Oster, K., Hardacre, C., Jacquemin, J., Ribeiro, A. P. C., & Elsinawi, A. (2019). Ionic liquid-based nanofluids(ionanofluids) for thermal applications: an experimental thermophysical characterization. Pure and AppliedChemistry, 91(8), 1309-1340. https://doi.org/10.1515/pac-2018-1114
Published in:Pure and Applied Chemistry
Document Version:Publisher's PDF, also known as Version of record
Queen's University Belfast - Research Portal:Link to publication record in Queen's University Belfast Research Portal
Publisher rightsCopyright 2019 the authors.This is an open access article published under a Creative Commons Attribution-NonCommercial-NoDerivs License(https://creativecommons.org/licenses/by-nc-nd/4.0/), which permits distribution and reproduction for non-commercial purposes, provided theauthor and source are cited
General rightsCopyright for the publications made accessible via the Queen's University Belfast Research Portal is retained by the author(s) and / or othercopyright owners and it is a condition of accessing these publications that users recognise and abide by the legal requirements associatedwith these rights.
Take down policyThe Research Portal is Queen's institutional repository that provides access to Queen's research output. Every effort has been made toensure that content in the Research Portal does not infringe any person's rights, or applicable UK laws. If you discover content in theResearch Portal that you believe breaches copyright or violates any law, please contact [email protected].
Download date:06. Apr. 2022

Pure Appl. Chem. 2019; 91(8): 1309–1340
Conference paper
Kamil Oster*, Christopher Hardacre*, Johan Jacquemin, Ana P. C. Ribeiro and Abdulaziz Elsinawi
Ionic liquid-based nanofluids (ionanofluids) for thermal applications: an experimental thermophysical characterizationhttps://doi.org/10.1515/pac-2018-1114
Abstract: Heat transfer fluids materials are manufactured for the purpose of transfer, distribution and storage of heat. Several of their important properties can be listed (for example flash point, thermal expansivity or technical safety). However, to assess the thermal exchange performance of these fluids, a prior knowledge of their heat capacity, density, viscosity and thermal conductivity is obligatory. The most popular heat transfer fluids are based on organic liquids, such as ethylene glycol. However, new technologies and development require more efficient materials. Ionanofluids, mixtures of ionic liquids and nanoparticles, were proposed as a viable replacement for those commonly used fluids due to the properties of ionic liquids (wide liquid range or low vapour pressure and flammability) combined with enhanced thermophysical properties of nanofluids caused by the dispersion of nanoparticles (mainly thermal conductivity and heat capacity). Very few authors reported the extensive analysis of those systems thermophysical properties and impact on the heat exchange efficiency. Moreover, the availability of published data is very limited. The aim of this work is to investigate ionanofluids based on the trihexyl(tetradecyl)phosphonium cation paired with the acetate, butanoate, hexanoate, octanoate or decanoate anion, mixed with carbon nanotubes, boron nitride, graphite or mesoporous carbon as nanoparticles with concentration up to 3 wt %. The density, heat capacity, thermal stability, thermal conductivity and viscosity of selected ionanofluids were determined experimentally as functions of the temperature (up to 363.15 K) and compared with theoretical tools to evaluate the predictive capability. Based on the experimental results, lubrication, heat storage potential and economic analysis were also discussed and compared to commercial heat transfer fluids.
Keywords: heat transfer fluids; ionanofluids; ionic liquids; ISSP18; nanofluids; nanoparticles; thermophysical properties.
Article note: A collection of invited papers based on presentations at the 18th International Symposium on Solubility Phenomena and Related Equilibrium Processes (ISSP-18), Tours, France, 15–20 July 2018.
*Corresponding authors: Kamil Oster and Christopher Hardacre, The University of Manchester, School of Chemical Engineering and Analytical Science, Sackville Street, M13 9PL, Manchester, United Kingdom of Great Britain and Northern Ireland; and Queen’s University Belfast, School of Chemistry and Chemical Engineering, Stranmillis Road, BT9 5AG, Belfast, United Kingdom of Great Britain and Northern Ireland, e-mail: [email protected] (K. Oster); [email protected] (C. Hardacre) Johan Jacquemin: Queen’s University Belfast, School of Chemistry and Chemical Engineering, Stranmillis Road, BT9 5AG, Belfast, United Kingdom of Great Britain and Northern Ireland; and Université François Rabelais, Laboratoire PCM2E, Parc de Grandmont 37200, Tours, FranceAna P. C. Ribeiro: Universidade de Lisboa, Centro de Química Estrutural, Instituto Superior Técnico, Av. Rovisco Pais 1, 1049-001 Lisbon, PortugalAbdulaziz Elsinawi: King Fasial University, Materials Engineering Department, College of Engineering, Al-Hasa, 31982, Hofuf, Saudi Arabia
© 2019 IUPAC & De Gruyter. This work is licensed under a Creative Commons Attribution-NonCommercial-NoDerivatives 4.0 International License. For more information, please visit: http://creativecommons.org/licenses/by-nc-nd/4.0/

1310 K. Oster et al.: Ionic liquid-based nanofluids (ionanofluids) for thermal applications
IntroductionHeat transfer fluids (HTFs) have the purpose of transferring, distributing and storing the heat. To describe the thermal performance properly, the most following properties are necessary – thermal conductivity, heat capacity, density and viscosity [1]. Based on these properties, information on the heat transfer rate, the capability to store the energy as the heat or pumpability can be determined [2]. In the case of HTFs, the molecular design is one of the most challenging tasks [3]. It can be performed in two ways – experimentally or theoretically via predictions. Predictions are the most robust, easiest and readily available approach. However, experimental details are still needed to establish the models. Current HTF technologies include organic compounds (glycols, silicones or aromatic compound) and water [1, 2]. In the case of organic compounds, several disadvantages can be listed, for example biotoxicity or flammability. They can be also divided into three main groups depending on the temperature of operation: low temperature (up to 563.15 K), medium temperature (563.15–863.15 K) and high temperature (above 863.15 K) [1, 2]. Other properties of HTFs should be also considered during the design process, i.e. corrosivity, flash point, durability, maintenance time or environmental impact [4].
One of the replacement solutions for current HTFs to address these issues is ionic liquids (ILs). These are defined as compounds consisting entirely of ions with melting point below 373.15 K [5]. Due to their ionic structure, strong Coulombic interactions can be distinguished [6]. Moreover, a large variety of hydrogen bonding and van der Waals interactions can be found [7, 8]. These features strongly influence the physical properties of ILs, namely low vapour pressure (and flammability), wide liquid range with low freezing point and relatively high thermal stability, ionic conductivity [9]. ILs have been studied as potential HTFs by many authors, including understanding their advantages and disadvantages [10–14]. For example, Wu et al. reported several ILs consisting of 1alkyl3methylimidazolium cations with various anions in terms of their heat capacity, and further heat storage capacity, structureproperty relationship, feasibility and economic analyses [15]. The authors showed that ILs might have very beneficial physical properties as HTFs [15]. Holbrey et al. presented the comparison between 1alkyl3methylimidazolium ILs and commercial HTFs concentrating on their heat capacity [16]. Van Valkenburg et al. investigated 1alkyl3methylimidazolium tetrafluoroborate ILs in terms of their physical properties (thermal stability, heat storage and transfer), and demonstrated that they might be a suitable replacement for conventional HTFs [17]. An extensive review by Chernikova et al. discussed the values of stability associated with the desired low vapour pressure, varied viscosity and corrosivity [18]. The main drawback mentioned was the high cost of production and maintenance. Musiał et al. presented the results of thermophysical properties of pyrrolidiniumbased ILs and their comparison to commercial HTFs as a wide range of the temperature and the pressure, and showed that this class of ILs might be a real replacement for currently used HTFs [19]. Zorębski et al. discussed the heat capacity of ILs as the main advantage as HTFs [20]. Our recent work on thermophysical properties of tetraalkylphosphonium carboxylate ILs showed that the viscosity might be a limiting factor to their application [21].
Another solution that has been proposed is mixing liquids with nanoparticles, creating socalled nanofluids [22]. The very first work on nanofluids addressing their potential thermal conductivity, heat transfer coefficient enhancements and pumping power savings caused by dispersion of nanoparticles in liquids was reported by Choi and Eastman [23]. The addition of nanoparticles resulted in enhanced thermal conductivity [24] and heat capacity [25, 26] which are very beneficial for industrial applications. These enhancements were unusual because the mechanism of heat transfer found for liquids nor solids was not able to explain the behaviour in nanofluids. The reasons proposed in the literature are based on Brownian motions of nanoparticles, liquid layering at the liquid/particle interface, nature of heat transport across nanoparticles, nanoparticle clustering. However, it has been shown by several authors based on both theoretical (molecular modelling) [27, 28] and experimental (thermal conductivity measurement) [25, 26] results that interfacial nanolayering seems to be the most influencing factor for the unusual enhancements. Moreover, several potential applications of nanofluids have been indicated, for example exfoliation [29], cold storage systems [30], solar collectors [31].
K. Oster et al.: Ionic liquid-based nanofluids (ionanofluids) for thermal applications 1311
Further improvements were achieved by mixing ILs with nanoparticles, denoted as ionanofluids [32]. The unique properties of ILs are conserved, and the enhancement of physical properties is also obtained. These offer HTFs with low vapour pressure, low flammability, wide liquid range, enhanced thermal conductivity and heat capacity. The aforementioned enhanced thermophysical properties were repeated in further reports for thermal conductivity [33–35], heat capacity [33, 34, 36], and density [37]. Unfortunately, this area is still very poorly developed, and very few studies have been reported, to date [32, 35, 38, 39]. Therefore, besides the poor understanding of their physical properties behaviour, the prediction of those is also very limited. However, the thermal conductivity was studied by Atashrouz et al. [40, 41], and the density and heat capacity by Oster et al. [42].
The aim of this work is to investigate trihexyl(tetradecyl)phosphonium based ILs together with acetate, [P14,6,6,6][AcO], butanoate, [P14,6,6,6][ButO], hexanoate, [P14,6,6,6][HexO], octanoate, [P14,6,6,6][OctO], or decanoate, [P14,6,6,6][DecO] anion. As shown in our previous work, these ILs were selected based on their very promising properties as heat transfer fluids [21]. To investigate them in further details, ionanofluids with multiwalled carbon nanotubes (MWCNT), boron nitride (BN), graphite (G) and mesoporous carbon (MC), up to 3 wt %, were also chosen. Such concentration of nanoparticles was imposed by the industrial applicability, further addition of nanoparticles can result in sedimentation [43], and increasing cost of materials [44]. The above systems were studied herein in terms of their physical properties behaviour. The physical properties measured and correlated during this work were the density, dynamic viscosity, thermal conductivity, isobaric heat capacity and thermal stability. The evaluation of investigated properties has also been undertaken during this work in order to evaluate predictive tools for such materials. Finally, further derivative features (kinematic viscosity and lubrication properties, volumetric heat capacity and energy storage ability, economic analysis) are also presented and depicted during this work.
Experimental
Materials
Ionic liquids
Trihexyl(tetradecyl)phosphonium carboxylate ionic liquids, [P14,6,6,6][RO], were synthesized in accordance to the procedure in [21]. Generally, the primary ionic liquid, trihexyl(tetradecyl)phosphonium chloride, [P14,6,6,6][Cl] (Cytec Industries Inc., product code: Cyphos IL101, CAS: 258864549, mass purity: >95 %) is mixed with ethanol (SigmaAldrich, absolute, CAS: 64175, mass purity: ≥99.8 %) at a concentration of 30 % (w/w). Thereafter, this mixture is passed through a strongly basic anion exchange resin (Alfa Aesar, product code: IRN78, CAS: 11128953), at least three times to ensure complete chloride exchange to hydroxide anion which is checked with the silver nitrate test (CAS: 7761888, SigmaAldrich, mass purity ≥99.9999 %). Finally, the obtained trihexyl(tetradecyl)phosphonium hydroxide, [P14,6,6,6][OH], undergoes the reaction with carboxylic acid to create [P14,6,6,6][RO] (as in Fig. 1), at 328 K on stirring overnight. Trihexyl(tetradecyphosphonium) acetate, [P14,6,6,6][AcO] (CAS: 872700588), butanoate, [P14,6,6,6][ButO] (CAS: 1393375568), hexanoate, [P14,6,6,6][HexO] (CAS: 1393375579), octanoate, [P14,6,6,6][OctO] (CAS: 1393375580), and decanoate, [P14,6,6,6][DecO] (CAS: 465527655) were obtained. Acetic acid (SigmaAldrich, ReagentPlus, CAS: 64197, mass purity: ≥99 %), butanoic acid (SigmaAldrich, CAS: 107926, mass purity: ≥99 %), hexanoic acid (SigmaAldrich, CAS: 142621,
Fig. 1: The general synthesis route for [P14,6,6,6][RO].

1312 K. Oster et al.: Ionic liquid-based nanofluids (ionanofluids) for thermal applications
mass purity: ≥99.5 %), octanoic acid (SigmaAldrich, CAS: 124072, mass purity: ≥99 %) and decanoic acid (SigmaAldrich, CAS: 334485, mass purity: ≥98 %) were used in the synthesis in slight molar excess to the amount of chloride salt used in the first step, accordingly. Finally, the product was purified under high vacuum (10−3 Pa) at elevated temperature (338 K) for at least 72 h. The summary of all materials used/obtained in this work can be found in Table 1.
1Octyl3methylimidazolium bis[(trifluoromethyl)sulfonyl]imide, [C8C1Im][NTf2] (CAS: 178631044) was also synthesized for the purpose of thermal conductivity calibration following the procedure found in reference [45]. The product was washed with deionised water (18 MΩ cm) 5 times, and the chloride content was checked with the silver nitrate test. The IL was dried under high vacuum (10−3 Pa) at 328.15 K for at least 72 h. This IL was accurately described in the literature in terms of the thermal conductivity, therefore, it was selected to check the calibration in this work [46]. The purity of all the investigated ionic liquids was checked with 1H, 13C and 31P NMR (B400 Bruker Avance III 400 MHz, ILs dissolved in CDCl3, Fig. S1–S3, Supporting Information SI1), Karl Fisher titration (Metrohm 899 Coulometer with 803 Ti Stand and Hydranal Coulomat AG) and CHNS elemental analysis (for carbon and hydrogen content, Perkin Elmer PE2400CHNS). The water content was checked before and after measurements, however, no changes were observed after the experiment. The water content for all samples was <100 ppm. The results of purity control can be found elsewhere [21], however, the final purity was summarized in Table 1.
Nanoparticles
The multiwalled carbon nanotubes (MWCNT) used in this work were Bayer Material Science Baytubes C150 HP (CAS: 308068566, mass purity ≥99 %, 3–15 number of walls, 13–16 nm outer mean diameter, 5–20 nm outer diameter distribution, 4 nm inner mean diameter, 2–6 nm inner diameter distribution, 1–10 mm length, 140–230 kg m−3 bulk density; according to the specifications provided by the supplier). Hexagonal boron nitride (BN, CAS: 10043115, mass purity ≥99.8 %, 70–80 nm size, 2290 kg m−3 theoretical true density, <0.03 % Fe2O3, <0.002 % CaO, <0.04 % MgO, <0.1 % B2O3), graphite (G, CAS: 7782425, ≥99.9 % mass purity, 400–1200 nm size, <0.1 % impurities, ~0.2 % water) and mesoporous carbon (MC, CAS: 7440440, mass purity: >95 %, 20–40 nm average pore size, <5 % water, <2 % ash, 7–10 pH) were obtained from US Research Nanomaterials, Inc. Before preparation of ionanofluids, the boron nitride and graphite were processed by using ball milling to reduce the particle size (Retsch Mixer Mill MM 400, frequency 20 Hz, 3 times for 1800 s). The size of the particles was ascertained with scanning electron microscope (650 FEI Quanta FEG, 15–20, <90, <100, and <50 nm for carbon nanotubes, boron nitride, graphite and mesoporous carbon, respectively, Fig. S4, Supporting Information SI1), and with light scattering (Mastersizer Malvern, dispersion with water, stabilized with sodium laureth sulfate as anionic surfactant, refractive index of 1.330 for water, 1.650 for boron nitride and 2.420 for all carbonbased nanomaterials; 26.60 ± 0.15 nm, 154.5 ± 1.7 nm, 159.1 ± 3.1 nm and 46.23 ± 0.62 nm for carbon nanotubes, boron nitride, graphite and mesoporous carbon, respectively, Fig. S5, Supporting Information SI1). The purity of nanomaterials was checked with Xray diffractometry (XPert Powder PANalytical, 15–90° scan range, 0.0084° scan step size, Fig. S6, Supporting Information SI1).
Ionanofluids
The preparation of (io)nanofluids is a very delicate process, therefore, a systematic procedure is essential and the standard literature protocol was used to prepare the ionanofluids [32, 35, 38, 42]. The proper mass of nanoparticles was weighted and added to ionic liquid with magnetic stirring for 30 min. Finally, the mixture was submitted to the 1 h of ultrasonication which is necessary to break up the nanoparticles agglomeration, stabilisation and preventing creating a socalled buckygel. The concentrations of nanoparticles in the investigated ionanofluids were (0.5, 1.0 and 3.0) % by weight. The samples were kept under high vacuum (10−3 Pa) to prevent water absorption from the air and removal of trapped air/water in the nanoparticles.

K. Oster et al.: Ionic liquid-based nanofluids (ionanofluids) for thermal applications 1313
Table 1: Chemicals summary.
Chemical name [CAS] Supplier Mass fraction purity
Purification method
Analysis method Halide/water content (ppm)
Trihexyl(tetradecyl)phosphonium chloride [258864-54-9]
Cytec Industries Inc.
>0.95 – – –
Ethanol [64-17-5] Sigma-Aldrich >0.998 – – –Acetic acid [64-19-7] Sigma-Aldrich ≥0.99 – – –Butanoic acid [107-92-6] Sigma-Aldrich ≥0.99 – – –Hexanoic acid [142-62-1] Sigma-Aldrich ≥0.995 – – –Octanoic acid [124-07-2] Sigma-Aldrich ≥0.99 – – –Decanoic acid [334-48-5] Sigma-Aldrich ≥0.98 – – –Trihexyl(tetradecyl)phosphonium acetate [872700-58-8]
In house ≥0.98 Washing-extraction vacuum
1H, 13C and 31P NMR Elemental analysis Karl Fisher titration
<5/<100
Trihexyl(tetradecyl)phosphonium butanoate [1393375-56-8]
In house ≥0.98 Washing-extraction vacuum
1H, 13C and 31P NMR elemental analysis Karl Fisher titration
<5/<100
Trihexyl(tetradecyl)phosphonium hexanoate [1393375-57-9]
In house ≥0.98 Washing-extraction vacuum
1H, 13C and 31P NMR elemental analysis Karl Fisher titration
<5/<100
Trihexyl(tetradecyl)phosphonium octanoate [1393375-58-0]
In house ≥0.98 Washing-extraction vacuum
1H, 13C and 31P NMR elemental analysis Karl Fisher titration
<5/<100
Trihexyl(tetradecyl)phosphonium decanoate [465527-65-5]
In house ≥0.98 Washing-extraction vacuum
1H, 13C and 31P NMR elemental analysis Karl Fisher titration
<5/<100
1-octyl-3-methylimidazolium bis[(trifluoromethyl)sulfonyl]imide [178631-04-4]
In house ≥0.98 Washing-extraction vacuum
1H, 13C and 31P NMR Karl Fisher titration
<5/<100
Toluene [108-88-3] Sigma-Aldrich ≥0.995 – – –Glycerine [56-81-5] Sigma-Aldrich ≥0.99 – – –Sodium chloride [7647-14-5] Sigma-Aldrich ≥0.99 – – –Water [7732-18-5] Deionised Ultrapure,
type 1 Deionisation UV, conductivity
measurement (Merck Millipore Direct-Q 3 UV equipment)
–
Synthetic sapphire [1317-82-4]
TA Instruments Ultrapure (NIST SRM 720)
– – –
Strongly basic anion resin IRN-78 [11128-95-3]
Alfa Aesar ≤0.0005 Cl−;≤0.0001 SiO2;≤0.0006 SO4
– – –
Silver nitrate [7761-88-8] Sigma-Aldrich ≥0.999999 – – –Multi-walled carbon nanotubes [308068-56-6]
Bayer Material Science
≥0.99 – Supplier: Ashing, TEM, SEM, EN ISO 60;This work: XRD, laser diffraction technique
–
Boron nitride [10043-11-5] US Research Nanomaterials, Inc.
≥0.998 – This work: SEM, XRD –
Graphite [7782-42-5] US Research Nanomaterials, Inc.
≥0.999 – This work: SEM, XRD –
Mesoporous carbon [7440-44-0]
US Research Nanomaterials, Inc.
≥0.95 – This work: SEM, XRD

1314 K. Oster et al.: Ionic liquid-based nanofluids (ionanofluids) for thermal applications
Techniques
Density
The density, ρ, was measured as a function of temperature, T = (298.15–363.15) K, using Anton Paar DMA 4500M densitometer (calibrated on ultrapure degassed water and dry air, relative standard uncertainty of density, ur(ρ) = 0.1 %, relative standard uncertainty of temperature, ur(T) = 0.01 K, approximate volume of sample 1.5 cm3, 3 independent repeats of measurement, viscosityinduced errors reduced by correction with viscosity), and correlated with temperature with the secondorder equation:
=
= ∑2
0
( ) ii
i
T aTρ (1)
where ai is the regression parameter determined by the leastsquare method, along with the standard uncertainty, δai, while the coefficient of determination, R2, was used to describe the fit. As a prerequisite for the ionanofluids density calculation, the nanoparticles density was previously determined for multiwalled carbon nanotubes, boron nitride and graphite [42]. However, those for mesoporous carbon have not been reported and, therefore, were determined using the following empirical formulae, in a similar procedure as for carbon nanotubes, boron nitride and graphite [47]:
+ − −=
)1(IL NP IL NPNP
NP
ww
ρ ρρ (2)
where w is mass fraction, subscripts IL and NP refer to ionic liquids and nanoparticles, respectively. Equation (2) was also used to calculate the density of ionic liquid + nanoparticles mixtures, as a prediction of the property. To represent the physical properties as a function of the nanoparticles loading, the mass fraction, wm,NP was recalculated to volume fraction, ϕNP, with the following equation:
= = =−+
+ +
,
, ,1
m NPNP
NP NP NPNP
NP IL m NP m ILNP IL
NP IL NP IL
wmV
m m w wV Vρ ρ
ϕ
ρ ρ ρ ρ
(3)
where m is a mass, V is a volume, density of nanoparticles was calculated using Eq. (2) for mesoporous carbon, and from the available literature data for the multiwalled carbon nanotubes, boron nitride and graphite. The density of the ionic liquids, ρIL, was determined experimentally in our previous work [21].
Viscosity
The viscosity, η, was measured as a function of the temperature, T, using TA Instruments AR2000 rheometer (angular displacement resolution 40 nRad, torque resolution 0.1 nN m, temperature standard uncertainty u(T) = 0.01 K) with stainless steel 20 mm parallel plate geometry and shear rate of 10 s−1. The measurement temperature range was (298.15–363.15) K. The viscosity standards Cannon S600 oil (1100 mPa s at 298.15 K), PTB 1000A (780 mPa s at 298.15 K) and ultrapure water (0.88992 mPa s at 298.15 K) were used to ascertain the reported viscosity relative standard uncertainty, ur(η) = 3 %. The viscosity was correlated with temperature by using VogelFulcherTammann (VFT) equation:
= − 0
0
( ) exp BTT T
η η (4)
where η0, B and T0 are fitting parameters, determined by the nonlinear curve fitting algorithm in OriginPro 2017 software.

K. Oster et al.: Ionic liquid-based nanofluids (ionanofluids) for thermal applications 1315
Specific heat capacity
The isobaric heat capacity, cp, was measured by using differential scanning calorimeter (DSC) equipment, Q100 TA Instruments in the temperature range of (298.15–363.15) K (modulated differential scanning calorimetry technique, MDSC, calibrated on synthetic sapphire (CAS: 1317824, TA Instruments, ultrapure in accordance to the reference standards NIST SRM 720) and checked with 1hexyl3methylimidazolium bis(trifluoromethylsulfonyl)imide as a classified ionic liquid NIST standard [48], under a nitrogen gas flow of 50 cm3 min−1, heating rate dT/dt = 3 K min−1, amplitude ±0.5 K and a modulation period 60 s. The results of calibration and postcalibration procedure ascertained that the relative standard uncertainty of measurement as ur(cp) = 3 %, temperature standard uncertainty u(T) = 0.01 K. 3 independent repeats of measurement were performed with 5 % repeatability. The specific heat capacity reported in our previous work was measured by DSC equipment Q1000 TA Instruments which enables the automatic heat capacity determination [21, 42]. In this work we used DSC equipment Q100 TA Instruments which does not allow this measurement, however, the results obtained are similar to those reported previously. Therefore, for pure ionic liquids the data from our previous work are used. The specific heat capacity was correlated with temperature with secondorder equation:
=
= ∑2
0
( ) ip i
i
c T aT (5)
where ai is the regression parameter determined by the leastsquare method, along with the standard uncertainty, δai, while the coefficient of determination, R2, was used to describe the fit. Moreover, the heat capacity of ionanofluids (more specifically the enhancement) was predicted using the following empirical correlations for carbon nanotubes, boron nitride and graphitedoped ionanofluids [49]:
− −= ± + ± ⋅ − ± − ± ⋅ + ±4 2 6 2(6.00 0.43) (32.6 8.7) 10 (109 14) (5.5 1.3) 10 (0.55 0.14)INFMWCNT MWCNT
IL
T Tλ
ϕ ϕλ
(6)
− −= ± + ± ⋅ − ± − ± ⋅ + ±4 2 6 2(28.99 0.85) (17.0 1.5) 10 (894 34) (2.5 2.1) 10 (0.70 0.24)INFBN BN
IL
T Tλ
ϕ ϕλ
(7)
− −= ± + ± ⋅ − ± − ± ⋅ + ±4 2 6 2(29.5 1.2) (23.4 2.3) 10 (829 42) (2.5 1.3) 10 (0.58 0.38)INFG G
IL
T Tλ
ϕ ϕλ
(8)
Thermal conductivity
The thermal conductivity measurements were performed using a KD2 Pro Thermal Properties Analyzer (Decagon company), based on transient hotwire principle (KS1 sensor, 60 mm length, 1.3 mm diameter) with the standard uncertainty of temperature, u(T) = 0.05 K. To ensure that the proper heat transfer occurred between the sensor and investigated material during the measurement, an approximate volume of sample of 30 cm3 was used. The cell was completely closed against the environment, immersed in bath circulator (Grant TC120, 50 % (V/V) ethylene glycol/water, thermal stability ±0.05 K and uniformity ±0.1 K). The time gap between each measurement after the temperature stabilisation was at least 15 min. The temperature range of measurement was (~278 to ~358) K. To obtain accurate results, the calibration procedure, as described in our previous work, was used [21] using glycerine and its water solutions (as a range of viscosity), water (as a range of high thermal conductivity), NaCl water solutions (as electrical conductive materials), toluene (as low viscous material). The calibration constant obtained was 0.9932 ± 0.0075, which results in calibration constant standard uncertainty of 1.50 %, and standard uncertainty of thermal conductivity values of about 3.44 % [49]. Finally, the calibration was checked with the welldescribed (in terms of thermal conductivity)

1316 K. Oster et al.: Ionic liquid-based nanofluids (ionanofluids) for thermal applications
ionic liquid [C8C1Im][NTf2], achieving an excellent repeatability of 0.27 % [21]. The thermal conductivity, λ, was also correlated with temperature by the following linear equation:
=
= ∑1
0
( ) ii
i
T aTλ (9)
where ai is the fitting coefficient. The standard deviation of ai parameters, δai, were calculated based on the leastsquare approach, and coefficient of determination, R2, was used to describe the fit. To predict the thermal conductivity of ionanofluids (more specifically enhancement), the only available model for ionic liquid – based nanofluids, Atashrouz model, was used [40]:
=
NP
INF NP
IL IL
ϕλ λ
λ λ (10)
where the thermal conductivity coefficients of nanoparticles are (3223.4, 874.1, 35.7 and ~12.0) W m−1 K−1 for carbon nanotubes [50], boron nitride [51], graphite [52], and mesoporous carbon [53], respectively.
Thermogravimetric analysis
The thermogravimetric analysis (TGA) was carried out on TA Instruments TGA 550 equipment with platinumHT pan (calibrated on Curie point with alumel and nickel, nitrogen gas flow 10 cm3 min−1, heating rate of 5 K min−1, samples mass of approximately 25 mg, weighting standard uncertainty of 0.01 %, standard uncertainty of signal resolution 0.01 μg, standard uncertainty of temperature u(T) = 0.5 K). An important factor influencing the significance of thermogravimetric results is the methodology to determine the onset temperature. Differentiation of the obtained thermogravimetric curve produces a Gaussianlike peak function which is used to determine the onset temperature as the crossing point of baseline and extrapolated linear function, while the percentage of weight loss is an equivalent to curve area. Furthermore, as reported by Maton et al. [54], Ton is determined by the derivative function (dm/dT vs. T) which has been recognized as a sufficiently accurate parameter of thermal stability, and this is commonly used to describe the thermal decomposition [55, 56]. Moreover, the overestimation of the onset temperature is reduced. Isothermal thermogravimetric studies were also conducted for [P14,6,6,6][DecO] (temperatures of 400 K, 450 K, 500 K, 550 K, for 200 min).
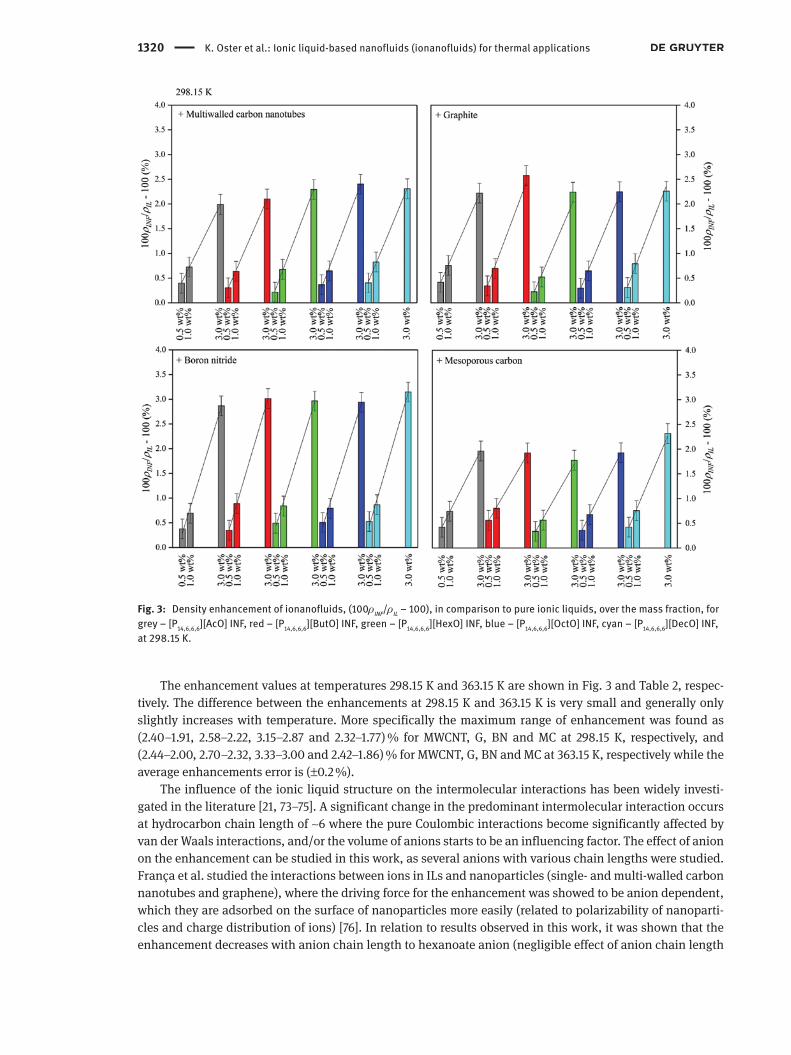
Economic analysis
The information concerning whether the considered heat transfer fluids have sufficiently promising properties is discussed as a combination of all the physical properties measured (thermal conductivity, isobaric heat capacity, density and viscosity). There are a few approaches for such assessment, for example Mouromtseff introduced a factor as an implicit function with some basic limitations [57], and Murakami and Mikic proposed figureofmerit property [58]. Unfortunately, the latter is not sensitive enough to distinguish particular commercial heat transfer fluids, the ionic liquids or ionanofluids [58]. The most novel approach was proposed by Mendonca et al. [59]. Therein, the authors considered an exemplary application as shell and tube heat transfer unit type, prescribing the external constraints and neglecting the pressure drop across the fluid ducts as it does not affect the performance. Thereafter, the only factor which has the influence is heat transfer area expressed by Newton’s law of cooling:
0 0( )lmQ U A T= ∆ (11)

K. Oster et al.: Ionic liquid-based nanofluids (ionanofluids) for thermal applications 1317
where Q is rate of heat transfer (Q = 1 MW), U0 is overall heat transfer coefficient, A0 is heat transfer area, and (ΔT)lm is logarithmic mean temperature difference between inlet and outlet stream temperatures ((ΔT)lm = 20 K). In the case of circular tubes, U0 can be calculated by the following equation:
= + + + +
0
1 1o i ow o
i i o i
D rDr r
U h D h D (12)
where Do is outside tube diameter (Do = 0.020 m), hi is the heat transfer coefficient for the inside film of fluid, Di is the inside tube diameter (Di = 0.018 m), ho is heat transfer coefficient for the outside film of fluid (ho = 2000 W m−2 K−1), rw is the thermal resistance of the tube wall, ro is the outside fouling resistance, ri is the inside fouling resistance. This can be also simplified in the following form:
= + +
0
1 1
o
o i i
DR
U h h D (13)
where R stands for all the factors related to the resistance (combined resistance constant, therefore R = 0 indicates an ideal flow by placing baffles in the shell part of the exchanges and controlling the fluid velocity in the tubes) [60]. The major assumption in this methodology is that turbulent flow is required for the efficient and accurate optimization. The most recognized correlation for the heat transfer coefficients for smooth circular tube was proposed by Sieder and Tate [61]:
= =
0.1410.8 30.027i i
w
h DNu Re Pr η
λ η (14)
where Nu is the Nusselt number, λ is the thermal conductivity coefficient, η is the dynamic viscosity, ηw is the dynamic viscosity at the wall temperature (assumption: ηw = η), Re is the Reynolds number, Pr is the Prandtl number. As Eq. (13) assumes that turbulent flow is required, the Eq. (14) is applicable for values >100 [62]. Pr number can be calculated by the following equation:
= pcPr
η
λ (15)
where cp is the specific isobaric heat capacity. Whereas the Reynolds number can be determined as follows:
= iuD
Reρ
η (16)
where ρ is the density, u is the mean velocity over the tube cross section (u = 0.5 m s−1). França et al. reported that an efficient way to study the cost of a new design was to divide it into five parts, namely the battery limits, utility, offsite, engineering fees and working capital [60]. The main influence herein is the battery limits investment which is related to the cost of individual parts of the equipment, along with the installation [63]. This cost, CE, is a function of the size (heat transfer area), material of the construction, design pressure, temperature:
=
m
E BB
XC CX (17)
where CB is the cost of a reference equipment, X is the capacity of the equipment (in this case heat transfer area, A0), XB is the capacity of the reference equipment (heat transfer area of reference) and m is a constant depending on the equipment type (m = 0.68). Following the work of França et al., the reference equipment is carbon steel shell and tube heat exchanger with a reference heat transfer area of 80 m2 and cost of (3.28 · 104)

1318 K. Oster et al.: Ionic liquid-based nanofluids (ionanofluids) for thermal applications
US$ [63]. When the factors of materials type, pressure and temperature are included in Eq. (17), the following equation is obtained:
= ′
m
E B M P TB
XC C f f fX (18)
where ′BC is the cost of the above described reference equipment ( = ⋅′ 43.28 10BC US$), fM is the correction factor for materials type (fM = 3.4), fP is the correction factor for pressure (fP = 1.5), and fT is the correction factor for temperature (fT = 1.3) [63]. Finally, the equation for the cost of the heat exchange unit is derived as follows:
= ⋅ = ⋅ ⋅ ⋅ ⋅
0.68 0.68
4 50 03.28 10 3.4 1.5 1.3 2.18 1080 80E
A AC (19)
Statistical analysis
All the experimental and calculated values were compared to each other using the relative deviation, RD, and absolute average relative deviation, AARD values:
−= calc exp
exp
100( )x xRD
x (20)
=
−= ∑ calc exp
exp1
100 n
i
x xAARD
n x (21)
To ascertain the influence of the thermophysical properties, the uncertainties in the enhancement values, the errors of isobaric heat capacity, density and viscosity enhancements, ε, were calculated by using the chain rule of differentiation:
∂ ∂= +∂ ∂, ,
, ,p INF p IL
p INF p IL
c cc c
ε εδε δ δ (22)
In the case of the thermal conductivity enhancement, the sample covariance can be neglected (due to low numerical values of thermal conductivity and the standard uncertainty, consequently), therefore, excessive numerical artefacts are not propagated:
∂ ∂= + ∂ ∂
2 22 2( ) ( )INF IL
INF IL
ε εδε δλ δλ
λ λ (23)
Results and discussion
Density
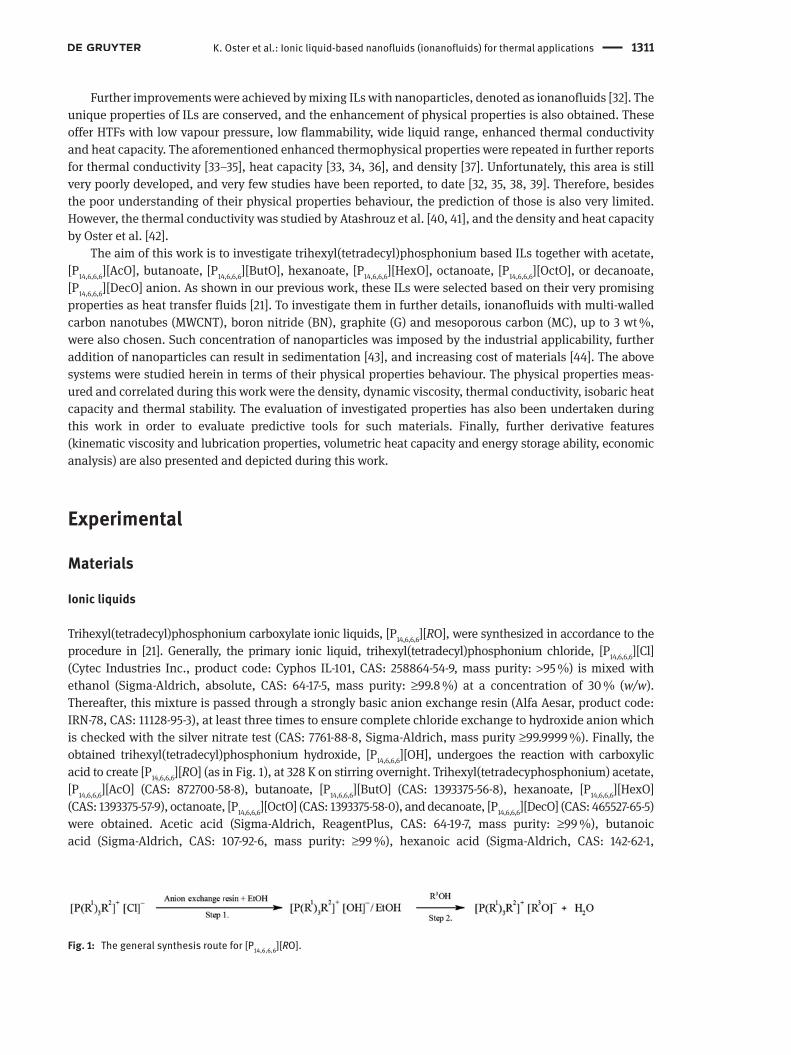
The density, ρ, was measured as a function of temperature over the range of (298.15–363.15) K. All the results for the pure ionic liquids were previously reported in [21]. The experimental data can be found in Supporting Information SI2, also presented in Fig. 2a. The comparison of values in this work and those in
K. Oster et al.: Ionic liquid-based nanofluids (ionanofluids) for thermal applications 1319
the literature can be found in Fig. 2b. Relative deviations of (−0.37 [64], −0.45 [65], −0.98 [66]) % for [P14,6,6,6][AcO], and 0.38 % for [P14,6,6,6][DecO] [67], at 298.15 K, were obtained. The purity of ILs can be a significant factor influencing the thermophysical properties, for example Seddon et al. reported that the residual solvent and halide content affect the values of density, therefore, those should be monitored. Tariq et al. reported the chloride content of [P14,6,6,6][AcO] in a range of (20–150) ppm, whilst in this work the chloride content was below 5 ppm [64]. Esperança et al. used [P14,6,6,6][AcO] from the same source as Tariq et al. [65], and it can be seen that the results are consistently similar – negative relative deviations (which indicated higher chloride content of the value from literature, especially by comparing the density of [P14,6,6,6][Cl] and those reported in this work) [68]. Similar results can be seen in the work of Fillion et al. [66]. On the other hand, Neves et al. did not report the chloride content [67]. However, the water content reported by Neves et al. is almost 3 times higher than the value reported in this work [67]. This also in a good agreement with the densitywater dependence reported by Seddon et al. [69]. As can be seen, the purity of ILs used in this work is very high (low water and chloride contents), in comparison to other reports, therefore, the results presented herein are of high quality.
The comparison of density values to those of commercial heat transfer fluids depends on the type of material, for example the values in this work are similar to synthetic aromatic hydrocarbon mixtures (Therminol ADX10 or Dynalene SF), slightly lower than water and significantly lower than glycolbased HTFs (for example Dowtherm 4000 or Dynalene EG series) [70–72].
The density was also correlated with temperature. The parameters of the secondorder equation, ρ(T), can be found in Table S1 (Supporting Information SI3). The density was found to be a decreasing function of temperature as noted for other ILs, while the differences between the lowest (298.15 K) and the highest temperature (363.15 K) are similar for all ILs, (4.67, 4.72, 4.74, 4.73 and 4.76) % for [P14,6,6,6][AcO], [P14,6,6,6][ButO], [P14,6,6,6][HexO], [P14,6,6,6][OctO] and [P14,6,6,6][DecO], respectively.
The density of the ionic liquids containing nanoparticles were also measured (Fig. S7–S11, Supporting Information SI1 and Excel File Supporting Information SI2). The parameters of the ρ(T) equation can be found in Table S1 (Supporting Information SI3). The values of the slope for all systems are very similar for the pure ionic liquids and the ionanofluids.
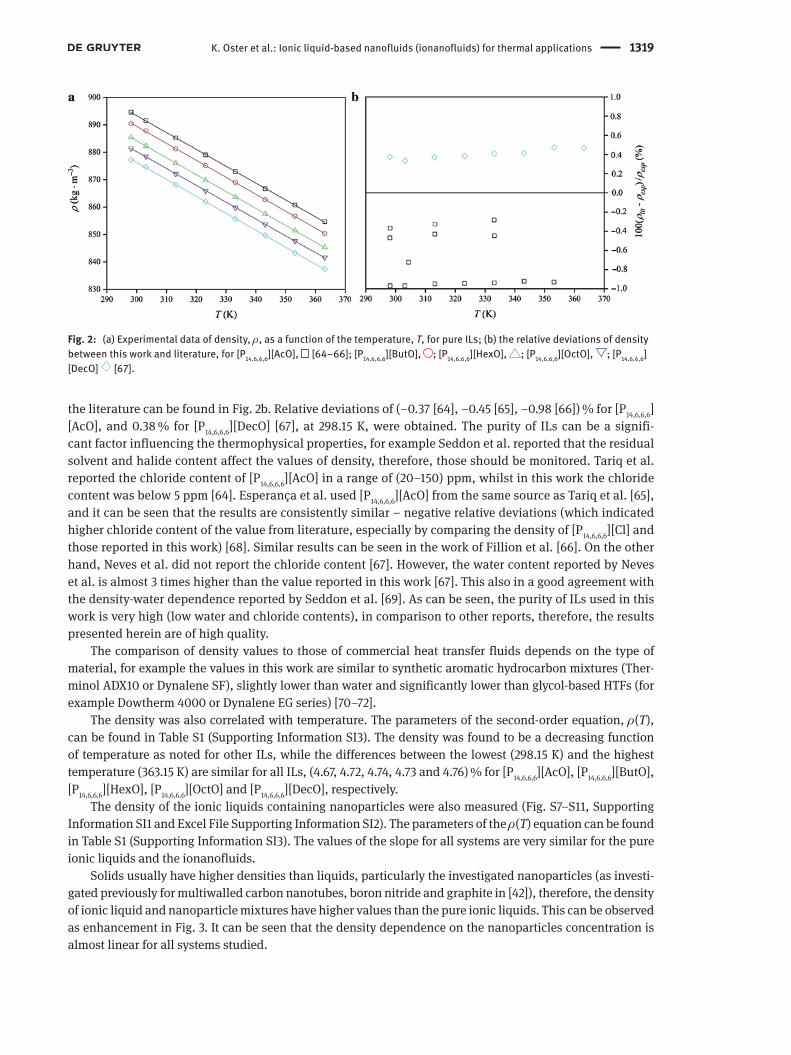
Solids usually have higher densities than liquids, particularly the investigated nanoparticles (as investigated previously for multiwalled carbon nanotubes, boron nitride and graphite in [42]), therefore, the density of ionic liquid and nanoparticle mixtures have higher values than the pure ionic liquids. This can be observed as enhancement in Fig. 3. It can be seen that the density dependence on the nanoparticles concentration is almost linear for all systems studied.
Fig. 2: (a) Experimental data of density, ρ, as a function of the temperature, T, for pure ILs; (b) the relative deviations of density between this work and literature, for [P14,6,6,6][AcO], [64–66]; [P14,6,6,6][ButO], ; [P14,6,6,6][HexO], ; [P14,6,6,6][OctO], ; [P14,6,6,6][DecO] [67].
1320 K. Oster et al.: Ionic liquid-based nanofluids (ionanofluids) for thermal applications
The enhancement values at temperatures 298.15 K and 363.15 K are shown in Fig. 3 and Table 2, respectively. The difference between the enhancements at 298.15 K and 363.15 K is very small and generally only slightly increases with temperature. More specifically the maximum range of enhancement was found as (2.40–1.91, 2.58–2.22, 3.15–2.87 and 2.32–1.77) % for MWCNT, G, BN and MC at 298.15 K, respectively, and (2.44–2.00, 2.70–2.32, 3.33–3.00 and 2.42–1.86) % for MWCNT, G, BN and MC at 363.15 K, respectively while the average enhancements error is (±0.2 %).
The influence of the ionic liquid structure on the intermolecular interactions has been widely investigated in the literature [21, 73–75]. A significant change in the predominant intermolecular interaction occurs at hydrocarbon chain length of ~6 where the pure Coulombic interactions become significantly affected by van der Waals interactions, and/or the volume of anions starts to be an influencing factor. The effect of anion on the enhancement can be studied in this work, as several anions with various chain lengths were studied. França et al. studied the interactions between ions in ILs and nanoparticles (single and multiwalled carbon nanotubes and graphene), where the driving force for the enhancement was showed to be anion dependent, which they are adsorbed on the surface of nanoparticles more easily (related to polarizability of nanoparticles and charge distribution of ions) [76]. In relation to results observed in this work, it was shown that the enhancement decreases with anion chain length to hexanoate anion (negligible effect of anion chain length
Fig. 3: Density enhancement of ionanofluids, (100ρINF/ρIL – 100), in comparison to pure ionic liquids, over the mass fraction, for grey – [P14,6,6,6][AcO] INF, red – [P14,6,6,6][ButO] INF, green – [P14,6,6,6][HexO] INF, blue – [P14,6,6,6][OctO] INF, cyan – [P14,6,6,6][DecO] INF, at 298.15 K.

K. Oster et al.: Ionic liquid-based nanofluids (ionanofluids) for thermal applications 1321
Table 2: The enhancements of density, ρ, dynamic viscosity, η, thermal conductivity, λ, isobaric heat capacity, cp, for ionanofluids in comparison to pure ionic liquids.
Enhnancement (%) Density (±0.20 %) Viscosity (0.5 wt % = ± 2.4 %, 1.0 wt % = ± 9.0 %, 3.0 wt % = ± 13.3 %)
Thermal conductivity (±4.5 %)
Heat capacity (± 5.3 %)
298.15 K 363.15 K 298.15 K 363.15 K 278.15 K 358.15 K 298.15 K 363.15 K[P14,6,6,6][AcO] + 0.5 wt % MWCNT 0.40 0.45 19.1 27.9 2.8 0.8 6.1 3.6[P14,6,6,6][AcO] + 1.0 wt % MWCNT 0.72 0.72 41.3 41.5 6.3 3.2 7.1 4.7[P14,6,6,6][AcO] + 3.0 wt % MWCNT 1.99 2.05 116.2 135.4 19.9 18.0 11.7 9.3[P14,6,6,6][AcO] + 0.5 wt % G 0.42 0.48 23.0 28.0 2.0 1.4 11.0 14.5[P14,6,6,6][AcO] + 1.0 wt % G 0.76 0.83 39.7 50.4 4.4 4.5 17.1 21.9[P14,6,6,6][AcO] + 3.0 wt % G 2.22 2.36 121.9 155.9 11.3 12.3 29.2 34.5[P14,6,6,6][AcO] + 0.5 wt % BN 0.38 0.42 12.8 14.7 2.0 1.3 3.9 4.5[P14,6,6,6][AcO] + 1.0 wt % BN 0.69 0.75 28.5 31.0 4.4 3.9 10.9 11.5[P14,6,6,6][AcO] + 3.0 wt % BN 2.87 3.00 119.5 93.4 14.9 13.0 21.6 21.5[P14,6,6,6][AcO] + 0.5 wt % MC 0.42 0.39 26.5 17.2 2.0 0.6 8.8 11.6[P14,6,6,6][AcO] + 1.0 wt % MC 0.74 0.73 51.4 40.7 3.8 3.2 16.7 20.8[P14,6,6,6][AcO] + 3.0 wt % MC 1.96 2.06 117.5 94.2 8.8 7.2 25.1 28.1[P14,6,6,6][ButO] + 0.5 wt % MWCNT 0.30 0.27 21.8 23.0 3.8 4.6 5.2 3.1[P14,6,6,6][ButO] + 1.0 wt % MWCNT 0.64 0.62 50.5 52.0 5.7 6.6 7.5 3.6[P14,6,6,6][ButO] + 3.0 wt % MWCNT 2.10 2.14 156.7 154.0 22.6 21.4 10.3 7.0[P14,6,6,6][ButO] + 0.5 wt % G 0.34 0.34 16.4 20.1 2.6 3.9 12.1 15.9[P14,6,6,6][ButO] + 1.0 wt % G 0.70 0.71 29.5 38.9 5.1 5.9 18.3 22.4[P14,6,6,6][ButO] + 3.0 wt % G 2.58 2.70 130.2 137.9 9.5 10.7 31.5 36.1[P14,6,6,6][ButO] + 0.5 wt % BN 0.35 0.35 16.1 20.5 1.9 1.9 3.5 4.1[P14,6,6,6][ButO] + 1.0 wt % BN 0.89 0.90 42.1 58.3 5.1 5.3 9.6 10.3[P14,6,6,6][ButO] + 3.0 wt % BN 3.01 3.11 102.0 119.5 15.1 16.0 20.6 20.8[P14,6,6,6][ButO] + 0.5 wt % MC 0.56 0.56 15.9 21.6 2.6 1.8 10.1 13.3[P14,6,6,6][ButO] + 1.0 wt % MC 0.80 0.81 39.2 53.3 5.1 3.5 15.0 18.7[P14,6,6,6][ButO] + 3.0 wt % MC 1.92 1.98 136.3 135.5 11.4 9.3 27.4 30.9[P14,6,6,6][HexO] + 0.5 wt % MWCNT 0.22 0.23 28.8 31.5 3.8 2.3 5.7 3.3[P14,6,6,6][HexO] + 1.0 wt % MWCNT 0.68 0.71 58.4 66.9 5.7 5.0 7.3 3.5[P14,6,6,6][HexO] + 3.0 wt % MWCNT 2.29 2.29 133.1 138.2 21.4 20.0 11.4 8.1[P14,6,6,6][HexO] + 0.5 wt % G 0.22 0.20 19.5 23.6 3.1 3.7 11.5 15.2[P14,6,6,6][HexO] + 1.0 wt % G 0.52 0.51 50.6 63.6 5.0 6.4 18.7 23.1[P14,6,6,6][HexO] + 3.0 wt % G 2.24 2.32 143.6 145.4 10.1 11.2 30.3 35.3[P14,6,6,6][HexO] + 0.5 wt % BN 0.49 0.52 25.9 24.7 3.8 5.0 3.7 4.3[P14,6,6,6][HexO] + 1.0 wt % BN 0.84 0.88 47.2 53.0 5.0 5.7 11.5 12.0[P14,6,6,6][HexO] + 3.0 wt % BN 2.96 3.08 99.1 102.5 15.1 17.3 20.3 20.6[P14,6,6,6][HexO] + 0.5 wt % MC 0.33 0.36 21.0 25.7 1.9 2.3 9.5 12.4[P14,6,6,6][HexO] + 1.0 wt % MC 0.56 0.60 44.4 54.0 3.2 3.0 15.9 19.8[P14,6,6,6][HexO] + 3.0 wt % MC 1.56 1.86 97.4 108.4 10.1 10.3 27.0 30.2[P14,6,6,6][OctO] + 0.5 wt % MWCNT 0.37 0.36 17.8 20.2 1.9 1.6 5.1 2.8[P14,6,6,6][OctO] + 1.0 wt % MWCNT 0.65 0.69 36.8 40.1 7.4 7.1 6.2 4.6[P14,6,6,6][OctO] + 3.0 wt % MWCNT 2.40 2.45 92.9 98.5 19.8 19.1 11.5 10.0[P14,6,6,6][OctO] + 0.5 wt % G 0.29 0.34 17.2 31.3 1.9 1.6 9.8 14.0[P14,6,6,6][OctO] + 1.0 wt % G 0.65 0.71 43.6 59.1 4.7 3.6 15.8 19.9[P14,6,6,6][OctO] + 3.0 wt % G 2.25 2.38 121.0 159.3 12.0 11.6 28.7 32.7[P14,6,6,6][OctO] + 0.5 wt % BN 0.51 0.50 24.1 27.7 2.5 3.6 3.5 4.5[P14,6,6,6][OctO] + 1.0 wt % BN 0.79 0.78 38.3 46.1 5.6 5.6 1.4 12.6[P14,6,6,6][OctO] + 3.0 wt % BN 2.94 3.08 78.2 94.5 14.9 15.6 20.3 20.8[P14,6,6,6][OctO] + 0.5 wt % MC 0.36 0.36 13.5 28.5 1.8 1.4 10.0 12.7[P14,6,6,6][OctO] + 1.0 wt % MC 0.68 0.80 33.1 55.7 3.8 3.2 16.2 18.3[P14,6,6,6][OctO] + 3.0 wt % MC 1.93 2.08 97.3 92.6 7.6 9.5 25.2 27.5[P14,6,6,6][DecO] + 0.5 wt % MWCNT 0.40 0.41 27.6 25.3 3.3 2.5 5.2 3.3[P14,6,6,6][DecO] + 1.0 wt % MWCNT 0.83 0.89 50.7 45.8 7.2 6.4 7.0 3.8

1322 K. Oster et al.: Ionic liquid-based nanofluids (ionanofluids) for thermal applications
size but caused by the bulkier properties so as a result less favoured adsorption on the surface of nanoparticles), and then increasing again (driven by decreasing the electrostatic forces between cations and anions, therefore, more favoured adsorption onto the surface of nanoparticles).
The density of ionanofluids was previously investigated for a range of ionic liquids, 1butyl3methylimidazolium dicyanamide, 1butyl3methylimidazolium bis[(trifluoromethyl)sulfonyl]imide, 1butyl1methylpyrrolidinium bis[(trifluoromethyl)sulfonyl]imide, 1hexyl3methylimidazolium hexafluorophosphate, 1ethyl3methylimidazolium ethylsulfate, with multiwalled carbon nanotubes, boron nitride and graphite [42]. Similar results were found therein namely that the anion size of the ionic liquid was the influencing factor for the enhancement values. The enhancement, as presented above, was also found to increase by increasing the nanoparticles size as follows: MWCNT < MC < BN < G.
The highest value of density repoted in this work is 920.24 kg m−3 for [P14,6,6,6][AcO] + 3 wt % BN at 298.15 K compared with 894.6 kg m−3 of the pure ionic. Even though the addition of nanoparticles to ionic liquids increases the density, the enhancement is still not a vast improvement when compared to commercial heat transfer fluids.
The density of ionanofluids was also calculated by using the additivity model Eq. (2). Unfortunately, the data for pure mesoporous carbon were not available, therefore, similar calculations to those in the work of Oster et al. were needed to be performed [42] which are reported in Supporting Information SI2, and the density for mesoporous carbon is 1477.50 kg m−3 at 298.15 K. It was found that the density of carbonaceous nanoparticles is similar, to remind, the density values for investigated carbon nanotubes and graphite are (1626.34 and 1711.99) kg m−3 at 298.15 K. It can be seen that the density of mesoporous carbon is very similar to those previously studied, whilst the slight decrease is caused by the high porosity. The deviations between experimental and calculated values can be found in Fig. 4. It should be noted that the data of those ionanofluids containing mesoporous carbon were calculated based on the determined density in this work.
Average absolute relative deviations of (0.21, 0.31, 0.32 and 0.10) % were found for MWCNT, G, BN and MC, respectively and maximum deviations of (0.66, 0.67, 0.58 and 0.31) % were found for [P14,6,6,6][HexO] + 3 wt % MWCNT at 363.15 K, [P14,6,6,6][HexO] + 3 wt % G at 363.15 K, [P14,6,6,6][OctO] + 3 wt % BN at 358.15 K and [P14,6,6,6][DecO] + 3 wt % MC at 348.15 K, respectively. Interestingly, all relative deviations between experimental and calculated values are positive. The reason for this might originate from the existing interfacial nanolayering of higher density values (which shifts the calculated results to higher values) and is in a good agreement with work of Shin et al. [25].
Such deviations illustrate that we are able to calculate the density of ionanofluids with high accuracy, with an error of <1 % which is good considering that it is a complex system of two phases mixture (nanosolid + liquid). It should be also noted that the calculations for the pure ionic liquids densities with the most accurate approach, i.e. the fluctuation theorybased Taitlike equation of state (FTEoS), have deviations of up to 6 % [77].
Enhnancement (%) Density (±0.20 %) Viscosity (0.5 wt % = ± 2.4 %, 1.0 wt % = ± 9.0 %, 3.0 wt % = ± 13.3 %)
Thermal conductivity (±4.5 %)
Heat capacity (± 5.3 %)
[P14,6,6,6][DecO] + 3.0 wt % MWCNT 2.31 2.44 137.8 144.9 22.0 20.6 11.6 8.9[P14,6,6,6][DecO] + 0.5 wt % G 0.31 0.37 20.6 23.6 3.4 3.3 9.8 14.2[P14,6,6,6][DecO] + 1.0 wt % G 0.79 0.88 50.9 57.0 5.9 6.4 18.7 22.1[P14,6,6,6][DecO] + 3.0 wt % G 2.26 2.41 121.0 135.0 20.6 8.8 29.0 32.7[P14,6,6,6][DecO] + 0.5 wt % BN 0.52 0.58 26.1 38.8 1.9 2.5 4.3 4.2[P14,6,6,6][DecO] + 1.0 wt % BN 0.87 0.94 52.0 60.7 6.2 7.0 11.4 12.2[P14,6,6,6][DecO] + 3.0 wt % BN 3.15 3.33 106.4 117.2 13.2 13.5 20.5 20.7[P14,6,6,6][DecO] + 0.5 wt % MC 0.42 0.51 32.6 38.9 1.7 0.8 8.8 11.7[P14,6,6,6][DecO] + 1.0 wt % MC 0.75 0.80 57.9 69.0 4.3 2.9 15.4 18.8[P14,6,6,6][DecO] + 3.0 wt % MC 2.32 2.42 144.0 153.1 9.2 7.3 26.4 29.4
Table 2 (continued)

K. Oster et al.: Ionic liquid-based nanofluids (ionanofluids) for thermal applications 1323
Dynamic viscosity
The dynamic viscosity, η, was measured as a function of the temperature over the range (298.15–363.15) K, as reported previously [21]. The experimental data for pure ionic liquids can be found in Supporting Information SI2, and Fig. 5a. The measured viscosity was also compared to the previously reported data (Fig. 5b) for the two studies available for [P14,6,6,6][AcO] and [P14,6,6,6][DecO] [66, 67]. The maximum observed deviations are 106.93 % for [P14,6,6,6][AcO] (196.2 mPa s in this work and 406 mPa s in [66], at 298.15 K) and 15.18 % for [P14,6,6,6][DecO] (409.8 mPa s in this work and 472 mPa s in [67], at 298.15 K).
In addition, the viscosity values of investigated systems are higher than commercial HTFs for example (16.9, 6.19 or 3.71) mPa s for Dowtherm MX, Dynalene PG60 or Dowtherm A at 298.15 K, respectively [71, 72].
Fig. 4: Experimental vs. calculated density of ionanofluids as relative deviations against the temperature, for [P14,6,6,6][RO] + MWCNT, ; [P14,6,6,6][RO] + G, ; [P14,6,6,6][RO] + BN, ; [P14,6,6,6][RO] + MC .
Fig. 5: (a) Experimental data of viscosity, η, as a function of the temperature, T, for pure ILs; (b) the deviations of viscosity between this work and literature for [P14,6,6,6][AcO], [66]; [P14,6,6,6][ButO], ; [P14,6,6,6][HexO], ; [P14,6,6,6][OctO], ; [P14,6,6,6][DecO] [67].

1324 K. Oster et al.: Ionic liquid-based nanofluids (ionanofluids) for thermal applications
Viscosity was found to depend on the anion chain length in the following sequence: [P14,6,6,6][AcO] < [P14,6,6,6][ButO] < [P14,6,6,6][HexO] < [P14,6,6,6][OctO] < [P14,6,6,6][DecO], as expected [78].
The viscosity was correlated with temperature by exponential VFT equation of which parameters can be found in Table S1 (Supporting Information SI3). The effect of temperature on viscosity is enormous in ILs (around 1000 % decrease from 298.15 K to 363.15 K) and, at high temperature the viscosity of ILs and commercial HTFs become similar (at 423.15 K, 0.96 mPa s for Dowtherm MX and 4.65 mPa s for [P14,6,6,6][AcO]) [72]. The analysis of each VFT equation leads to the most recognized parameter of socalled glass transition, T0. The rise in viscosity occurs when the system is cooled toward the glass transition, T0, at which a sharp (superArrhenius) viscosity increase can be observed, accompanied with very little structural change, as discussed by Mauro et al. [79]. As a further consequence, below the glass transition temperature, the long structural relaxation times can be caused by a lower mobility of the species. Using the results summarized in Table S2 (Supporting Information SI3), it can be observed that an increase of the anion chain length of ionic liquids results in a decrease of T0 which reflects to a decrease of their mobility.
The viscosity was also measured for the ionic liquids mixed with nanoparticles (Fig. S12–S16, Supporting Information SI1 and data are reported in Supporting Information SI2). It is wellknown that the viscosity increases by adding nanoparticles in ILs [80, 81], as shown herein in Fig. 6 and in Table 2 for the data collected at 298.15 K, and at 298.15 and 363.15 K, respectively. This behaviour can be seen as an enhancement
Fig. 6: Viscosity enhancement of ionanofluids, (100ηINF/ηIL – 100), in comparison to pure ionic liquids, over the mass fraction, for grey – [P14,6,6,6][AcO] INF, red – [P14,6,6,6][ButO] INF, green – [P14,6,6,6][HexO] INF, blue – [P14,6,6,6][OctO] INF, cyan – [P14,6,6,6][DecO] INF, at 298.15 K.

K. Oster et al.: Ionic liquid-based nanofluids (ionanofluids) for thermal applications 1325
in the ionanofluids viscosity in comparison to the pure ILs. Furthermore, as shown in Fig. 6, in most cases a linear correlation can be used to evaluate accurately the viscosity enhancement caused by the addition of nanoparticles in ILs. In addition, this viscosity enhancement was found to increase with temperature in the ranges of (17.78–28.80, 16.37–22.98, 12.78–26.06, 13.51–32.63) % for 0.5 wt % MWCNT, G, BN and MC at 298.15 K, respectively, and (20.22–31.49, 20.07–31.26, 14.73–38.76, 17.18–38.92) % for 0.5 wt % MWCNT, G, BN and MC at 363.15 K, respectively. For 1 wt % of MWCNT, G, BN and MC, the following enhancements were found (36.79–62.07, 28.52–60.93, 28.51–65.98, 33.07–57.89) % at 298.15 K, respectively, and (40.09–66.91, 38.88–63.63, 30.98–60.71, 40.67–68.97) % at 363.15 K, respectively. The enhancements at a nanoparticle concentration of 3.0 wt % MWCNT, G, BN and MC are much higher (92.88–156.70, 120.95–143.64, 78.15–119.47, 97.35–144.03) % at 298.15 K, respectively, and (98.49–153.96, 135.02–159.27, 93.36–119.49, 92.57–153.10) % at 363.15 K, respectively. It should be noted that the average enhancements errors are (2.4, 9.0, 13.3) % for systems with 0.5 wt %, 1.0 wt % and 3.0 wt % loading of nanoparticles, respectively, as explained in the Experimental part.
The VFT can give an insight into the dependence of the ionic liquid structure onto the viscosity (Table S1, Supporting Information SI3). The influence of pure ionic liquid structure was discussed above, moreover, the addition of the nanoparticles (as well as increasing those concentration) results in a further decrease in the T0. Unfortunately, there was no dependence found between the covered nanoparticle types and concentrations and their T0.
Kinematic viscosity
For industrial purposes, the lubrication properties of the HTFs are very important. The selection of lubricating material for a specific application is essential. Materials are classified in several groups, depending on the lubrication abilities. The property on which the classification is performed is called kinematic viscosity, ν, calculated from dynamic viscosity and density (ν = η/ρ) at 313.15 K [82–84]. The ISO classification (ISO 3448:1992) includes a wide range of materials from kinematic viscosity of 2.2 mm2 s−1 (ISO VG 2) to 1500 mm2 s−1 (ISO VG 1500) [85, 86].
The results of kinematic viscosity calculations and assignments to lubrication properties are shown in Fig. 7. The kinematic viscosities for pure ionic liquids were (104.2, 130.5, 177.9, 205.6 and 218.6) mm2 s−1 for
Fig. 7: The ISO lubrication properties classification based on the kinematic viscosity, the bold coloured lines represent the mid-point kinematic viscosity of the class, whereas the borders of coloured field represent the minimum and maximum kinematic viscosity of the class.

1326 K. Oster et al.: Ionic liquid-based nanofluids (ionanofluids) for thermal applications
[P14,6,6,6][AcO], [P14,6,6,6][ButO], [P14,6,6,6][HexO], [P14,6,6,6][OctO] and [P14,6,6,6][DecO], respectively. As can be seen, the kinematic viscosity is increasing with the anion chain length which is driven by the dynamic viscosity.
The addition of nanoparticles shifts the kinematic viscosity to higher values, as expected. The maximum kinematic viscosity was found as 547.5 mm2 s−1, corresponding to the mixture of [P14,6,6,6][DecO] + 3 wt % MC. The lubrication properties are also analysed based on the friction force coefficients, however, it does not relate to industrial assignment of material (in accordance to ISO classification). Nevertheless, the previous reports show that ionic liquids have promising lubricative properties (based on the friction coefficients) [87, 88]. In this work, we additionally showed that ionic liquids are very useful as lubricates (due to high variety in ISO classification), moreover, the possibility of doping the ionic liquids with nanoparticle enables the kinematic viscosity to be tailored, starting from relatively low kinematic viscosity (as 104.2 mm2 s−1 for [P14,6,6,6][AcO]) up to higher values (as 547.5 mm2 s−1 for [P14,6,6,6][DecO] + 3 wt % MC).
Thermal conductivity
The thermal conductivity was measured in the temperature range of (278–358) K. The results for the pure ionic liquids were previously published in [21], also presented in Fig. 8a and collected in Supporting Information SI2. The coefficients of linear equation λ(T) are reported in Table S2 (Supporting Information SI3).
To remind, the thermal conductivity decreases by increasing the temperature linearly, while the slopes for all ionic liquids remain similar. The thermal conductivity differences between the lowest and highest temperature investigated herein are (6.71, 7.24, 7.79, 7.62 and 7.23) % for [P14,6,6,6][AcO], [P14,6,6,6][ButO], [P14,6,6,6] [HexO], [P14,6,6,6][OctO] and [P14,6,6,6][DecO], respectively. By increasing the chain length on the anion from acetate to decanoate induces a linear increase on their volume [21]. In fact, a linear decrease in their thermal conductivity could be also expected (based on the approach for simple molecular solvents), however, no dependence was found for investigated ILs.
The difference in thermal conductivity between the largest and smallest anions is ~2.41 % which is well below the standard uncertainty of the measurement (3.44 %), therefore, it can be assumed that all thermal conductivity values are very similar irrespective of the investigated anion. Thermal conductivity was also measured for the ionanofluids with carbon nanotubes, boron nitride, graphite and mesoporous with a loading up to 3 wt %. The results are presented in Fig. S17–S21, (Supporting Information SI1), reported in Supporting Information SI2, and the coefficients of linear equation as a function of temperature can be found in Table S2 (Supporting Information SI3).
The thermal conductivity was found to linearly decrease with the temperature, and the same dependence was found for the nanoparticledoped ionic liquids, while the slope was consistently the same, however, the
Fig. 8: (a) Thermal conductivity as a function of the temperature; (b) Isobaric heat capacity as a function of the temperature, for [P14,6,6,6][AcO], ; [P14,6,6,6][ButO], ; [P14,6,6,6][HexO], ; [P14,6,6,6][OctO], ; [P14,6,6,6][DecO] .

K. Oster et al.: Ionic liquid-based nanofluids (ionanofluids) for thermal applications 1327
values of thermal conductivity were shifted to higher values. This gives, in fact, the opportunity to tune the thermal conductivity profile for a specific application, for example selection of IL influences the temperature profile whilst the addition of nanoparticles shifts the thermal conductivity to higher values.
The enhancements of thermal conductivity values caused by the addition of nanoparticles is shown in Fig. 9 for 278.15 K and Table 2 for 358.15 K. The thermal conductivity of solids is higher than liquids, and for nanoparticles particularly [25]. In the case of the investigated nanoparticles, the thermal conductivity coefficients are (3223.4, 874.1, 35.7 and ~12.0) W m−1 K−1 for carbon nanotubes, boron nitride, graphite and mesoporous carbon, respectively [51–53, 89]. Therefore, the expectation of mixing ionic liquids and nanoparticles is that the thermal conductivity of mixture is higher than for the pure IL. Moreover, increasing the amount of nanoparticle results in higher thermal conductivity. Furthermore, as shown in Fig. 9, this dependence is generally linear.
The range of maximum enhancements observed in this work is (19.81–22.62, 9.52–12.03, 15.12–13.22 and 7.64–11.36) % for MWCNT, G, BN and MC at 278.15 K, respectively, (17.98–21.37, 8.80–12.27, 12.97–17.27 and 7.19–10.27) % for MWCNT, G, BN and MC at 358.15 K, respectively. In general, the changes in the enhancements with temperature are below than the measurement errors (4.5 %) and can be neglected. This supports the ascertain that the temperature profile of thermal conductivity originates from the liquid and not the nanoparticles.
Fig. 9: Thermal conductivity enhancement of ionanofluids, (100λINF/λIL – 100), in comparison to pure ionic liquids, over the mass fraction, for grey – [P14,6,6,6][AcO] INF, red – [P14,6,6,6][ButO] INF, green – [P14,6,6,6][HexO] INF, blue – [P14,6,6,6][OctO] INF, cyan – [P14,6,6,6][DecO] INF, at 298.15 K.

1328 K. Oster et al.: Ionic liquid-based nanofluids (ionanofluids) for thermal applications
The thermal conductivity of ionic liquids was not found to influence the thermal conductivity enhancements as those are very similar for different anions (as shown above in the ranges of enhancements). However, a significant impact can be observed for different types and size of nanoparticles. In this work, 4 different types of nanoparticles were used with a wide range of thermal conductivity (from a very high for carbon nanotubes to relatively low for mesoporous carbon). Carbon nanotubes were found to increase the thermal conductivity the most (as corresponding to their highest thermal conductivity, 3223.4 W m−1 K−1), followed by boron nitride (874.1 W m−1 K−1), graphite (35.7 W m−1 K−1) and mesoporous carbon (~12.0 W m−1 K−1), as expected. Similar results were found for other systems, for example 3.71 % for 1butyl1methylpyrrolidinium dicyanamide + 0.5 wt % MWCNT at 293.1 K (0.84–4.58 % in this work) [38], 4.8 % for 1hexyl3methylimidazolium tetrafluoroborate + 1 wt % MWCNT at 293 K (3.18–7.45 % in this work) [32], or 20.46 % for 1ethyl3methylimidazolium ethylsulfate + 3 wt % MWCNT at 293.77 K (17.98–22.62 % in this work) [35].
To date, only one model was developed to predict the thermal conductivity of ionanofluids (more specifically their enhancement) socalled the Atashrouz model [40]. Oster et al. investigated this model for ionanofluids with several types of ionic liquids [41]. This model is expected to reproduce the thermal conductivity with high accuracy because it is fully based on thermodynamics (modified geometry mean), and the interactions between ionic liquids and nanoparticles are also included in its development [40]. During this work, this approach has been further tested for selected ionanofluids. The results of calculations (experimental enhancement vs. calculated enhancement) are presented in Fig. 10a and collected in Supporting Information SI2.
The average standard uncertainty of the determined enhancements is 4.5 %. All values are well within the linear relation (solid line in Fig. 10a) between the experimental and calculated values of the enhancement. More specifically, in Fig. 10b, the relative deviations are presented. None of the calculated values exceed the standard uncertainty of determined enhancement (all of them are below 4 %). The average absolute relative deviation was found to be (0.66, 1.8, 1.2 and 0.54) % for MWCNT, G, BN and MC, respectively, while the maximum values of relative deviation were (3.82, 3.61, 3.65 and 2.82) % for [P14,6,6,6][ButO] + 3 wt % MWCNT at 278.15 K, [P14,6,6,6][ButO] + 1 wt % G at 338.15 K, [P14,6,6,6][HexO] + 3 wt % BN at 328.15 K and [P14,6,6,6][ButO] + 3 wt % MC at 278.15 K, respectively. Overall, one can appreciate that the Atashrouz model can be used to predict the thermal conductivity of ionanofluids accurately [40].
Isobaric heat capacity
Isobaric heat capacity was measured over the temperature range (298.15–363.15) K. The results for pure ionic liquids are presented in Fig. 8b and reported in Supporting Information SI2. The parameters of linear
Fig. 10: (a) experimental vs. calculated thermal conductivity of ionanofluids; (b) relative deviations between calculated and experimental values of ionanofluids thermal conductivity against the temperature, for [P14,6,6,6][RO] + MWCNT, ; [P14,6,6,6][RO] + G,
; [P14,6,6,6][RO] + BN, ; [P14,6,6,6][RO] + MC .

K. Oster et al.: Ionic liquid-based nanofluids (ionanofluids) for thermal applications 1329
equation cp(T) are collected in Table S2 (Supporting Information SI3). In comparison to commercial heat transfer fluids, the values of heat capacity presented in this work are similar to the commercial HTFs, for example (1.93, 1.90 or 1.63) kJ kg−1 K−1 Therminol ADX10, Dynalene LO170, Dowtherm Q at 298.15 K, respectively, while the values in this work are (2.02, 1.95, 1.91, 1.84 and 1.82) kJ kg−1 K−1 for [P14,6,6,6][AcO], [P14,6,6,6][ButO], [P14,6,6,6][HexO], [P14,6,6,6][OctO] and [P14,6,6,6][DecO] at 298.15 K, respectively [70–72].
The heat capacity is found to increase with temperature, as expected. The cp(T) changes from 298.15 K to 363.15 K are (6.87, 7.49, 8.18, 8.39 and 8.80) % for [P14,6,6,6][AcO], [P14,6,6,6][ButO], [P14,6,6,6][HexO], [P14,6,6,6][OctO] and [P14,6,6,6][DecO], respectively. In other words, the temperature effect on the Δcp is increasing with the anion chain length. Heat capacity acts as a representation of the bonds energy in the molecules, therefore, an increase of the anion chain length should result in a larger effect of the temperature on their cp values.
The isobaric heat capacity was also studied for mixtures of the ionic liquids with carbon nanotubes, boron nitride, graphite and mesoporous carbon up to 3 wt % as shown in Fig. S22–S26 (Supporting Information SI1) with data tabulated in Supporting Information SI2. The more insight discussion can be made based on the enhancements of ionanofluids heat capacity in comparison to equivalent ionic liquids heat capacity. In accordance to traditional mixing rules in which the resulting heat capacity is made by the contribution of mixed materials (solids – lower heat capacity, liquids – higher heat capacity), the heat capacity
Fig. 11: Isobaric heat capacity enhancement of ionanofluids, (100cp,INF/cp,IL – 100), in comparison to pure ionic liquids, over the mass fraction, for grey – [P14,6,6,6][AcO] INF, red – [P14,6,6,6][ButO] INF, green – [P14,6,6,6][HexO] INF, blue – [P14,6,6,6][OctO] INF, cyan – [P14,6,6,6][DecO] INF, at 298.15 K.

1330 K. Oster et al.: Ionic liquid-based nanofluids (ionanofluids) for thermal applications
of ionanofluids should be lower than that of pure ILs. In reality, for ionic liquid – based nanofluids, the heat capacity increases with the addition of nanoparticle in solution. This behaviour could be associated to the interfacial nanolayers created by adhered liquid molecules on the surface of nanoparticles [42]. The results of these enhancements are presented in Fig. 11 and Table 2. In all cases, a linear correlation could be used again to accurately represent the qualitative dependence of the nanoparticle concentration on the cp enhancement for each mixture investigated herein.
The maximum cp enhancements observed were (10.26–11.67, 28.71–31.50, 20.26–21.58 and 25.07–27.40) % for MWCNT, G, BN and MC at 298.15 K, respectively, and (7.00–10.00, 32.67–36.10, 20.61–21.49 and 27.54–30.90) % for MWCNT, G, BN and MC at 363.15 K, respectively. As reported previously [42], the enhancements as a function of temperature depend on the properties of nanoparticles, more specifically, their size. It can be seen that for carbon nanotubes the enhancement decreases with the temperature, which might be related to an increase of the hydrophobicity i.e. less favoured attraction of the liquid molecules [90]. In the case of graphite, the cp enhancement increases with the temperature due to a hydrophobicity decrease which leads to easier creation of nanolayers [91], whilst with boron nitride it is approximately constant with temperature due to the diversely charged surface of charge distribution between nitrogen and boron [92]. Mesoporous carbon has a relatively high hydrophobicity at room temperature as found with graphite, therefore, it has a similar behaviour to that graphite [93].
However, herein, no dependence of the anion chain length on the cp enhancement was found. Nevertheless, the type of nanoparticles, or more specifically their size, seems to be an influencing factor to the cp enhancement. The following dependence of enhancements, MWCNT < BN < MC < G, was observed. In a previous work, it was shown that increasing the size of nanoparticles resulted in increasing the enhancement caused by larger number of liquid molecules adhered on the surface of nanoparticles (investigated for MWCNT, BN and G), which is in a good agreement with results presented in this work [42]. However, in case of mesoporous carbon, the enhancement is higher than for boron nitride but lower than graphite. This change may be the result of the very high porosity of mesoporous carbon (as in the Experimental Section, average pore size 20–40 nm) which influences the adsorption of liquid molecules and, therefore, the enhancement.
The heat capacity of investigated ionanofluids was also calculated by using fully empirical correlations from work of Oster et al. [42]. Unfortunately, the only available models are fully empirical based on data of ionanofluids with carbon nanotubes, boron nitride and graphite. Therefore, only those data were further simulated in this work. The representation of experimental data versus those calculated can be found in Fig. 12a. In addition, the differences can be found in Fig. 12b. The average absolute relative deviations are (0.47, 0.96
Fig. 12: (a) experimental vs. calculated isobaric heat capacity of ionanofluids; (b) relative deviations between calculated and experimental values of ionanofluids isobaric heat capacity against the temperature, for [P14,6,6,6][RO] + MWCNT, ; [P14,6,6,6][RO] + G, ; [P14,6,6,6][RO] + BN .

K. Oster et al.: Ionic liquid-based nanofluids (ionanofluids) for thermal applications 1331
and 0.87) % for ionanofluids with MWCNT, G and BN, respectively, while all the relative deviations were well below 2 %. It should be noted that the calculated cp enhancements are below the heat capacity uncertainty (3 %). Thus, it is possible to calculate the heat capacity of ionanofluids with carbon nanotubes, boron nitride and graphite accurately.
Volumetric heat capacity
The most important property in the case heat transfer fluids is the ability to store the energy (as heat). This can be represented with the volumetric heat capacity, cV, which is calculated based on isobaric specific heat capacity, cp, and specific density, ρ, cV = cp · ρ [19]. One can describe it as a viability to store the heat in a volume of a material, as a change in temperature. Higher values of volumetric heat capacity result in increased ability to store the heat, therefore, these are favoured. As expected, high isobaric heat capacity and high density contribute to the high volumetric heat capacity.
The ionic liquids investigated in this work have a relatively low density (below 1000 kg m−3), however, they have relatively high specific heat capacity (1.82–2.91 kJ kg−1 K−1). The volumetric heat capacity at 298.15 K and 363.15 K are shown in Fig. 13 and Table 3. The volumetric heat capacity found in this work was in the range of (1.60–2.39 and 1.66–2.54) MJ K−1 m−3 at 298.15 K and 363.15 K, respectively. The maximum was found as 2.39 MJ K−1 m−3 for [P14,6,6,6][AcO] + 3.0 wt % G at 298.15 K and 2.54 MJ K−1 m−3 for [P14,6,6,6][AcO] + 3.0 wt % G at 363.15 K, respectively. While the minimum was as 1.60 MJ K−1 m−3 for [P14,6,6,6][DecO] at 298.15 K and 1.66 MJ K−1 m−3 for [P14,6,6,6][DecO] at 363.15 K, respectively. For the pure ILs, the cV is increasing with the anion chain length, also driven by the isobaric heat capacity.
The temperature effect was found to be similar for all systems, with an approximate 4 % increase in volumetric heat capacity from 298.15 K to 363.15 K (driven by the increase of isobaric heat capacity). As can
Fig. 13: Volumetric heat capacity, cV, for all investigated systems and some commercially available heat transfer [70–72], for the comparison, at 298.15 K and 363.15 K.

1332 K. Oster et al.: Ionic liquid-based nanofluids (ionanofluids) for thermal applications
be seen the values of volumetric heat capacity of systems in this work are relatively high. The addition of nanoparticles increases the cV, for example the minimum cV enhancement at 298.15 K was found as 3.16 % for [P14,6,6,6][OctO] + 0.5 wt % MWCNT, and maximum as 39.78 % for [P14,6,6,6][ButO] + 3.0 wt % G. Generally, the cV enhancement was observed to be strictly dependent on the isobaric heat capacity. Therefore, the enhancements were found in the following sequence: MWCNT < BN < MC < G.
As a comparison, some commercially available heat transfer fluids were selected. There are several heat transfer fluids whose volumetric heat capacity is lower that the ILs studied in this work. For example, 1.47 MJ K−1 m−3 at 298.15 K and 1.54 MJ K−1 m−3 at 363.15 for Therminol VLT; values close to 1.56 MJ K−1 m−3 at 298.15 K and to 1.68 MJ K−1 m−3 at 363.15 for Dowtherm MX, and values close to 1.57 MJ K−1 m−3 at 298.15 K and 1.66 MJ K−1 m−3 at 363.15 for Therminol LT, 1.58 MJ K−1 m−3 at 298.15 K and 1.67 MJ K−1 m−3 at 363.15 for Dowtherm J, 1.62 MJ K−1 m−3 at 298.15 K and 1.71 MJ K−1 m−3 at 363.15 for Therminol D12, or 1.68 MJ MJ K−1 m−3 at 298.15 K and 1.78 MJ K−1 m−3 at 363.15 for Dowtherm A [70, 72]. These heat transfer fluids are mainly based on organic compounds (synthetics, aromatics, silicones and carbohydrates). Obviously, there are some heat transfer fluids that have higher values of volumetric heat capacity, for example 3.43 MJ K−1 m−3 at 298.15 K and 3.53 MJ K−1 m−3 at 363.15 for Dynalene PG60, 3.46 MJ K−1 m−3 at 298.15 K and 3.52 MJ K−1 m−3 at 363.15 for Dynalene FCEG, 3.55 MJ K−1 m−3 at 298.15 K and 3.61 MJ K−1 m−3 at 363.15 for Dynalene CaCl232 [71]. The major impact in their high values is originated from water. Even though water has moderate density (or in comparison to other liquid quite low), the isobaric heat capacity of this material is very high (4.18 kJ kg−1 K−1 at 298.15 K), and all of those heat transfer fluids are based on water.
Thermogravimetric analysis – thermal stability
The thermogravimetric analysis (TGA) was used to investigate the thermal decomposition profile of the pure ILs and mixtures with carbon nanotubes, boron nitride, graphite and mesoporous carbon. The results of thermogravimetric curves can be found in Fig. S28–S87 (Supporting Information SI1). Those figures also include the derivative thermogravimetric curve (dm/dT vs. T). The determined onset temperatures were collected in Table S3 (Supporting Information SI3), and these were also presented against the nanoparticles weight concentration in Fig. 14.
It can be seen (Fig. 14) that the determined Ton increases with increasing the number of nanoparticles which is understandable as these nanomaterials have higher thermal stability than the investigated ILs, as can be shown in Fig. S27 (Supporting Information SI1). The nanoparticles were significantly more stable than the investigated ILs (by estimation Ton > 750 K). Moreover, the Ton exhibits an approximately linear dependence with the nanoparticles concentration. The enhancement range of onset temperatures caused by the addition of nanoparticles was (2.02–5.74, 2.71–7.15, 2.49–6.40, 2.38–5.23) % for boron nitride, carbon
Table 3: A comparison of maximum temperature of operation and volumetric heat capacity, cV, between commercially available heat transfer fluids and fluids in this work.
Maximum temperature of operation (K) cv at 298.15/363.15 K (MJ K − 1 m − 3)
Dynalene PG-60 [71] 450 3.43/3.53Dynalene FC-PG [71] 353 3.46/3.52Dynalene HC-50 [71] 383 3.62/3.70Dynalene BioGlycol-60 [71] 450 3.54/3.60Dynalene Calcium Chloride-32 [71] 373 3.55/3.61Dowtherm SR-1 [72] 393 3.54/3.58Dowtherm A [72] 673 1.68/1.78Dowtherm J [72] 588 1.58/1.67Dowtherm MX [72] 603 1.56/1.68Therminol VLT [70] 448 1.47/1.54Therminol LT [70] 453 1.57/1.66Systems studied in this work ~400 1.60–2.54

K. Oster et al.: Ionic liquid-based nanofluids (ionanofluids) for thermal applications 1333
nanotubes, graphite and mesoporous carbondoped ionic liquids, respectively, or (2.13–5.14, 2.81–5.81, 2.02–5.31, 3.04–7.15, 2.49–5.02) % for [P14,6,6,6][AcO], [P14,6,6,6][ButO], [P14,6,6,6][HexO], [P14,6,6,6][OctO] and [P14,6,6,6][DecO]based ionanofluids, respectively. As can be seen, all shifts of Ton are similar (nanoparticle and ionic liquiddependence) which means that the driving force for the enhancement is purely caused by the addition of more stable species (nanoparticles) into the ionic liquids.
To the best of our knowledge, there are no published data which take into consideration the thermal stability of nanofluids with different type basefluids or nanoparticles, particularly when ionic liquids are used as basefluids. Therefore, the analysis and comparison to previously reported results become more difficult. The linearlike dependence of Ton on the nanoparticles concentration shows that the thermal stability is rather dependent on the addition/type of nanoparticles instead of some more sophisticated mechanism. The specific structure of nanofluids, particularly the surface of nanoparticles (i.e. solidliquid nanolayering) is the cause for unusual behaviour of thermophysical properties of such systems. In case of thermal stability this was not found to be an influencing factor, probably due to not sufficient sensitivity of such measurements.
The thermal decomposition was also found to depend on the anion chain length in the following sequence: [AcO] > [ButO] > [DecO] > [HexO] > [OctO]. [P14,6,6,6][DecO] exhibits a discrepancy from the linear relationship. The possible cause of this behaviour is that decanoic acid is a solid at room temperature, therefore, it influences the molecular structure of [P14,6,6,6][DecO], inducing different molecular recognition than in comparison to other ionic liquids with carboxylate anion. Moreover, similar sequences were found for ionanofluids based on these ionic liquids.
A number of conclusions can be drawn: 1) the onset temperature for all samples is dependent on type of ionic liquid and only the amount of added nanoparticles, 2) the onset temperature is a point at which advanced decomposition can be observed (even up to 20 % of weight change, for example [P14,6,6,6][AcO] + 1.0 wt % G [P14,6,6,6][OctO] + 0.5 wt % MWCNT or [P14,6,6,6][DecO] + 1.0 wt % MC, thus, the onset temperature cannot be considered as the descriptor of sample thermal stability, 3) the common feature of all samples is that the decomposition begins to be detectable at about 400 K. The one with the lowest onset temperature was selected, [P14,6,6,6][DecO] and isothermal TGA measurements were then conducted at 400 K, 450 K, 500 K and 550 K, as shown in Fig. 15.
The weight losses observed are (0.1, 2.9, 6.4 and 11.8) % at 400 K, 450 K, 500 K and 550 K, respectively. It can be seen in Fig. 15 that the [P14,6,6,6][DecO] is stable at 400 K, and the weight loss is probably caused by some water removal (absorbed from the air during sample preparation and transportation). Further increase of the temperature leads to more extensive weight loss due to its decomposition (or evaporation).
Fig. 14: The onset temperature, Ton, determined from thermogravimetric analysis for all investigated ionic liquids and ionanofluids.

1334 K. Oster et al.: Ionic liquid-based nanofluids (ionanofluids) for thermal applications
In terms of practical application of these systems, a consideration as heat transfer fluids is a viable option, as can be seen in Table 3. There are several different types of heat transfer fluids – based on glycols (i.e. Dynalene PG/EG series, Dowcal 100), alkanes (i.e. Therminol VLT), aromatic compounds (i.e. Therminol LT), water (i.e. Dynalene Calcium Chloride series) [70–72]. Some examples of commercially available heat transfer fluids with lower thermal stability can be found (as well as those with higher thermal stability) indicating that the investigated ionic liquids could be successfully considered as replacements. Even though the addition of nanoparticles increases the onset temperature, the maximum temperature of operation is still limited by the thermal stability of ionic liquids.
Ionanofluids economic viability
Physical properties are very important to ascertain whether some material can be used as heat transfer fluid. The most important are thermal conductivity, isobaric heat capacity, density and viscosity. Further investigation of these properties can lead to estimation of the heat exchange reactor.
The comparison of ionic liquids thermal conductivity depends on the composition of commercial fluid, for example waterbased materials have higher thermal conductivity (i.e. Dynalene PG series, Dowtherm 4000 or Dynalene EG series), while those based on organic compounds have lower thermal conductivity (i.e. Therminol ADX10 or Dynalene SF) [70–72]. For the density, the comparison also depends on the type of material, for example the values in this work are similar to synthetic aromatic hydrocarbon mixtures (i.e. Therminol ADX10 or Dynalene SF), slightly lower than water, or significantly lower than glycolbased HTFs (for example Dowtherm 4000 or Dynalene EG series) [70–72]. Unfortunately, the viscosity is significantly higher than commercial heat transfer fluids, which is a major drawback.
Based on that qualitative analysis, the price of heat exchange unit for materials in this work should be higher than commercial heat transfer fluids (due to high viscosity). The results can be seen in Fig. 16 and quantitative values in Table 4.
Firstly, the prices for all pure ionic liquids are higher than those of selected heat transfer fluids, for example (1130.7, 1245.8, 1385.7, 1460.9 and 1482.4) k$ for [P14,6,6,6][AcO], [P14,6,6,6][ButO], [P14,6,6,6][HexO], [P14,6,6,6][OctO] and [P14,6,6,6][DecO] at 298.15 K, and (542.2, 584.1, 643.2, 668.4 and 696.1) k$ for [P14,6,6,6][AcO], [P14,6,6,6][ButO], [P14,6,6,6][HexO], [P14,6,6,6][OctO] and [P14,6,6,6][DecO] at 363.15 K, respectively. While the
Fig. 15: Isothermal thermogravimetric results as decomposition weight loss over the time at different temperatures for [P14,6,6,6][DecO].

K. Oster et al.: Ionic liquid-based nanofluids (ionanofluids) for thermal applications 1335
Fig. 16: The results of economic analysis in the meaning of the heat exchange reactor, CE, at 298.15 K and 363.15 K [70–72].
values for selected HTFs are for example (285.4, 612.1 or 362.8) k$ for Therminol VLT, Dowtherm MX or Dowtherm A at 298.15 K, and (255.6, 365.3 or 272.6) k$ for Therminol VLT, Dowtherm MX or Dowtherm A at 363.15 K, respectively. The ILs are more expensive by up to 5 times which is also caused by their higher viscosity [70, 72].
On the other hand, the price of the pure ionic liquids decreases with temperature, and over 100 K this drops by over 100 %. The decrease for commercial heat transfer fluids is not that significant as they already have quite low viscosity, and as discussed before, the viscosity in this work is decreasing for about 1000 % within the investigated temperature range. At higher temperatures, the price for ionic liquids and commercial heat transfer fluids would be very similar. Moreover, for industrial purposes the fluids are usually used at high temperature which is more applicable for ionic liquids.
Despite the decreasing viscosity, other properties also contribute to the decrease of the price, for instance the isobaric heat capacity (7–9 % of increase within 100 K temperature change). Unfortunately, thermal conductivity and density counteract the beneficial changes in viscosity and isobaric heat capacity. For example– approximately 5 % and 7 % decreases in the density and thermal conductivity over a 100 K temperature change are observed, respectively.
Despite the high cost of the ILs, they also have other important properties, namely low vapour pressure [94], low freezing point [95], high thermal stability [54], or wide liquid range [96]. Therefore, the application of them as HTFs is beneficial as they can help to overcome many limitations associated with the engineering issues of the heat exchange, for example pressure control.
Furthermore, the addition of nanoparticles causes an increase in the price. It was observed that the enhancement was independent on the type of ionic liquid or nanoparticle, average as (3.1, 6.8 and 13.7) % for ionanofluids containing 0.5 wt %, 1.0 wt % and 3.0 wt % nanoparticles, respectively. This is a very significant shift, for example 13.7 % is at least 155 000 $. These shifts are mainly caused be the increase in viscosity (of even up to 150 %), even though the other properties are improved, for example density (up to ~3 %), isobaric heat capacity (up to ~35 %) and thermal conductivity (up to ~20 %). Unfortunately, as can be seen, the viscosity is still a remaining problem and it influences the thermal performance of ionanofluids, even though other
1336 K. Oster et al.: Ionic liquid-based nanofluids (ionanofluids) for thermal applications
Table 4: The results of economic analysis in the meaning of the heat exchange reactor, CE, at 298.15 K and 363.15 K, along with the temperature effect, Eq. (19).
CE at 298.15 K (k$) CE at 363.15 K (k$) Temperature effect (%)
[P14,6,6,6][AcO] Neat 1130.7 542.2 108.54[P14,6,6,6][AcO] + 0.5 wt % MWCNT 1163.0 575.0 102.26[P14,6,6,6][AcO] + 1.0 wt % MWCNT 1234.5 596.3 107.03[P14,6,6,6][AcO] + 3.0 wt % MWCNT 1280.6 632.1 102.59[P14,6,6,6][AcO] + 0.5 wt % G 1166.0 565.2 106.30[P14,6,6,6][AcO] + 1.0 wt % G 1180.4 573.0 106.00[P14,6,6,6][AcO] + 3.0 wt % G 1286.3 632.2 103.46[P14,6,6,6][AcO] + 0.5 wt % BN 1155.2 555.1 108.11[P14,6,6,6][AcO] + 1.0 wt % BN 1164.9 562.4 107.13[P14,6,6,6][AcO] + 3.0 wt % BN 1273.0 591.2 115.32[P14,6,6,6][AcO] + 0.5 wt % MC 1181.5 552.6 113.81[P14,6,6,6][AcO] + 1.0 wt % MC 1217.7 566.2 115.07[P14,6,6,6][AcO] + 3.0 wt % MC 1311.9 601.4 118.14[P14,6,6,6][ButO] Neat 1245.8 584.1 113.29[P14,6,6,6][ButO] + 0.5 wt % MWCNT 1280.6 604.6 111.81[P14,6,6,6][ButO] + 1.0 wt % MWCNT 1351.3 636.7 112.23[P14,6,6,6][ButO] + 3.0 wt % MWCNT 1482.4 691.9 114.25[P14,6,6,6][ButO] + 0.5 wt % G 1251.5 587.0 113.20[P14,6,6,6][ButO] + 1.0 wt % G 1262.7 599.8 110.52[P14,6,6,6][ButO] + 3.0 wt % G 1432.8 668.5 114.33[P14,6,6,6][ButO] + 0.5 wt % BN 1279.9 606.1 111.17[P14,6,6,6][ButO] + 1.0 wt % BN 1359.9 638.3 113.05[P14,6,6,6][ButO] + 3.0 wt % BN 1375.2 654.9 109.99[P14,6,6,6][ButO] + 0.5 wt % MC 1257.0 596.5 110.73[P14,6,6,6][ButO] + 1.0 wt % MC 1308.7 631.5 107.24[P14,6,6,6][ButO] + 3.0 wt % MC 1459.9 678.1 115.29[P14,6,6,6][HexO] Neat 1385.7 643.2 115.44[P14,6,6,6][HexO] + 0.5 wt % MWCNT 1450.3 685.5 111.57[P14,6,6,6][HexO] + 1.0 wt % MWCNT 1540.4 726.0 112.18[P14,6,6,6][HexO] + 3.0 wt % MWCNT 1604.2 750.0 113.89[P14,6,6,6][HexO] + 0.5 wt % G 1411.3 654.0 115.80[P14,6,6,6][HexO] + 1.0 wt % G 1477.4 692.3 113.40[P14,6,6,6][HexO] + 3.0 wt % G 1626.2 744.9 118.31[P14,6,6,6][HexO] + 0.5 wt % BN 1447.9 664.9 117.76[P14,6,6,6][HexO] + 1.0 wt % BN 1488.9 692.9 114.88[P14,6,6,6][HexO] + 3.0 wt % BN 1521.8 701.8 116.84[P14,6,6,6][HexO] + 0.5 wt % MC 1422.0 663.9 114.19[P14,6,6,6][HexO] + 1.0 wt % MC 1477.7 693.0 113.23[P14,6,6,6][HexO] + 3.0 wt % MC 1542.5 719.3 114.44[P14,6,6,6][OctO] Neat 1460.9 668.4 118.57[P14,6,6,6][OctO] + 0.5 wt % MWCNT 1508.8 696.0 116.78[P14,6,6,6][OctO] + 1.0 wt % MWCNT 1539.1 708.7 117.17[P14,6,6,6][OctO] + 3.0 wt % MWCNT 1596.0 737.0 116.55[P14,6,6,6][OctO] + 0.5 wt % G 1492.5 699.1 113.49[P14,6,6,6][OctO] + 1.0 wt % G 1549.6 724.9 113.77[P14,6,6,6][OctO] + 3.0 wt % G 1663.3 789.4 110.70[P14,6,6,6][OctO] + 0.5 wt % BN 1529.5 700.0 118.50[P14,6,6,6][OctO] + 1.0 wt % BN 1533.0 710.4 115.79[P14,6,6,6][OctO] + 3.0 wt % BN 1555.6 724.9 114.60[P14,6,6,6][OctO] + 0.5 wt % MC 1476.7 700.4 110.84[P14,6,6,6][OctO] + 1.0 wt % MC 1513.8 725.4 108.68[P14,6,6,6][OctO] + 3.0 wt % MC 1641.8 734.9 123.40[P14,6,6,6][DecO] Neat 1482.4 696.1 112.96[P14,6,6,6][DecO] + 0.5 wt % MWCNT 1553.9 730.2 112.80[P14,6,6,6][DecO] + 1.0 wt % MWCNT 1604.5 749.8 113.99
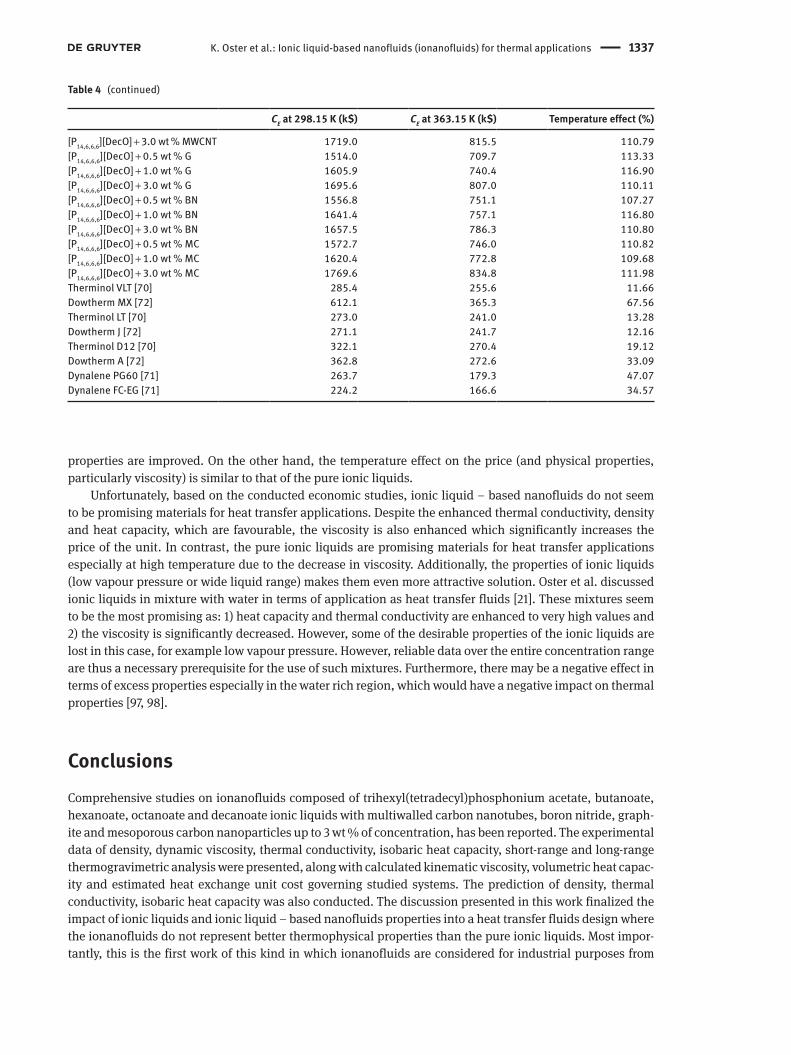
K. Oster et al.: Ionic liquid-based nanofluids (ionanofluids) for thermal applications 1337
properties are improved. On the other hand, the temperature effect on the price (and physical properties, particularly viscosity) is similar to that of the pure ionic liquids.
Unfortunately, based on the conducted economic studies, ionic liquid – based nanofluids do not seem to be promising materials for heat transfer applications. Despite the enhanced thermal conductivity, density and heat capacity, which are favourable, the viscosity is also enhanced which significantly increases the price of the unit. In contrast, the pure ionic liquids are promising materials for heat transfer applications especially at high temperature due to the decrease in viscosity. Additionally, the properties of ionic liquids (low vapour pressure or wide liquid range) makes them even more attractive solution. Oster et al. discussed ionic liquids in mixture with water in terms of application as heat transfer fluids [21]. These mixtures seem to be the most promising as: 1) heat capacity and thermal conductivity are enhanced to very high values and 2) the viscosity is significantly decreased. However, some of the desirable properties of the ionic liquids are lost in this case, for example low vapour pressure. However, reliable data over the entire concentration range are thus a necessary prerequisite for the use of such mixtures. Furthermore, there may be a negative effect in terms of excess properties especially in the water rich region, which would have a negative impact on thermal properties [97, 98].
ConclusionsComprehensive studies on ionanofluids composed of trihexyl(tetradecyl)phosphonium acetate, butanoate, hexanoate, octanoate and decanoate ionic liquids with multiwalled carbon nanotubes, boron nitride, graphite and mesoporous carbon nanoparticles up to 3 wt % of concentration, has been reported. The experimental data of density, dynamic viscosity, thermal conductivity, isobaric heat capacity, shortrange and longrange thermogravimetric analysis were presented, along with calculated kinematic viscosity, volumetric heat capacity and estimated heat exchange unit cost governing studied systems. The prediction of density, thermal conductivity, isobaric heat capacity was also conducted. The discussion presented in this work finalized the impact of ionic liquids and ionic liquid – based nanofluids properties into a heat transfer fluids design where the ionanofluids do not represent better thermophysical properties than the pure ionic liquids. Most importantly, this is the first work of this kind in which ionanofluids are considered for industrial purposes from
Table 4 (continued)
CE at 298.15 K (k$) CE at 363.15 K (k$) Temperature effect (%)
[P14,6,6,6][DecO] + 3.0 wt % MWCNT 1719.0 815.5 110.79[P14,6,6,6][DecO] + 0.5 wt % G 1514.0 709.7 113.33[P14,6,6,6][DecO] + 1.0 wt % G 1605.9 740.4 116.90[P14,6,6,6][DecO] + 3.0 wt % G 1695.6 807.0 110.11[P14,6,6,6][DecO] + 0.5 wt % BN 1556.8 751.1 107.27[P14,6,6,6][DecO] + 1.0 wt % BN 1641.4 757.1 116.80[P14,6,6,6][DecO] + 3.0 wt % BN 1657.5 786.3 110.80[P14,6,6,6][DecO] + 0.5 wt % MC 1572.7 746.0 110.82[P14,6,6,6][DecO] + 1.0 wt % MC 1620.4 772.8 109.68[P14,6,6,6][DecO] + 3.0 wt % MC 1769.6 834.8 111.98Therminol VLT [70] 285.4 255.6 11.66Dowtherm MX [72] 612.1 365.3 67.56Therminol LT [70] 273.0 241.0 13.28Dowtherm J [72] 271.1 241.7 12.16Therminol D12 [70] 322.1 270.4 19.12Dowtherm A [72] 362.8 272.6 33.09Dynalene PG60 [71] 263.7 179.3 47.07Dynalene FC-EG [71] 224.2 166.6 34.57

1338 K. Oster et al.: Ionic liquid-based nanofluids (ionanofluids) for thermal applications
both molecular and engineering perspective, including a comprehensive analysis and comparison to commercial heat transfer fluids.
As expected, the limiting factor in terms of heat transfer fluid design in the case of ionic liquids is their viscosity whereas many of the other physical properties are positive. The addition of nanoparticles into the ionic liquids results in the beneficial enhancements of heat capacity, thermal conductivity and density, however, such an addition causes a drastic increase of their viscosity, which negatively overrides the other enhancements. Temperature was found to affect the enhancement, as well as type of ionic liquid and nanoparticles/nanoparticles concentration.
It should be noted that discussion on whether a material is good or not is strongly dependent on the specific application for the heat transfer fluid. The recommendation from this study is to use ionic liquids at moderately high temperatures (up to 400 K) in which pressure control is problematic and can be overcome by the very low vapour pressure of the ionic liquids.
The modelling of physical properties of materials considered as heat transfer fluids might result in a significant reduction in time and cost of ionanofluids design. In this work, the presented calculations and the comparison to experimental data (density and thermal conductivity) show that the presented models are capable to predict those physical properties. In terms of heat capacity, empirical equations designed for specific nanomaterials were used successfully, however, this shows that more versatile models are still needed to allow the design of other types of nanomaterials.
Acknowledgments: The project was supported by King Faisal University (Saudi Arabia) through a research fund from the International Cooperation and Knowledge Exchange Administration department at KFU.
References[1] N. Canter. Tribol. Lubr. Technol. 65, 28 (2009).[2] J. Singh. Heat Transfer Fluids and Systems for Process and Energy Applications, Boca Raton, CRC Press (1985).[3] G. Sidebotham. Heat Transfer Modeling, Springer, New York (2015).[4] K. Vignarooban, X. Xu, A. Arvay, K. Hsu, A. M. Kannan. Appl. Energy 146, 383 (2015).[5] D. R. MacFarlane, A. L. Chong, M. Forsyth, M. Kar, R. Vijayaraghavan, A. Somers, J. M. Pringle. Faraday Discuss. 206, 9
(2018).[6] C. A. Angell, Y. Ansari, Z. Zhao. Faraday Discuss. 154, 9 (2012).[7] R. P. Matthews, T. Welton, P. A. Hunt. Phys. Chem. Chem. Phys. 17, 14437 (2015).[8] P. A. Hunt, C. R. Ashworth, R. P. Matthews. Chem. Soc. Rev. 44, 1257 (2015).[9] Z. Lei, B. Chen, Y.-M. Koo, D. R. MacFarlane. Chem. Rev. 117, 6633 (2017).
[10] J. F. Brennecke, E. J. Maginn. AIChE J. 47, 2384 (2001).[11] H. Zhao. Chem. Eng. Commun. 193, 1660 (2006).[12] D. R. MacFarlane, N. Tachikawa, M. Forsyth, J. M. Pringle, P. C. Howlett, G. D. Elliott, J. H. Davis, M. Watanabe, P. Simon,
C. A. Angell. Energy Environ. Sci. 7, 232 (2014).[13] J. F. Wishart. Energy Environ. Sci. 2, 956 (2009).[14] S. Aparicio, M. Atilhan, F. Karadas. Ind. Eng. Chem. Res. 49, 9580 (2010).[15] B. Wu, R. Reddy, R. Rogers. Novel Ionic Liquid Thermal Storage for Solar Thermal Electric Power Systems, Proceedings of
Solar Forum 2001 Solar Energy: The Power to Choose, Washington, DC (2001).[16] J. D. Holbrey, W. M. Reichert, R. G. Reddy, R. D. Rogers. “Heat capacities of ionic liquids and their applications as thermal
fluids”, in Ionic Liquids as Green Solvents, R. D. Rogers, K. R. Seddon (Eds.), ACS Publications, Washington, DC (2003).[17] M. E. Van Valkenburg, R. L. Vaughn, M. Williams, J. S. Wilkes. Thermochim. Acta 425, 181 (2005).[18] E. A. Chernikova, L. M. Glukhov, V. G. Krasovskiy, L. M. Kustov, M. G. Vorobyeva, A. A. Koroteev. Russ. Chem. Rev. 84, 875
(2015).[19] M. Musiał, K. Malarz, A. Mrozek-Wilczkiewicz, R. Musiol, E. Zorebski, M. Dzida. ACS Sustain. Chem. Eng. 5, 11024 (2017).[20] E. Zorebski, M. Zorebski, M. Dzida, P. Goodrich, J. Jacquemin. Ind. Eng. Chem. Res. 56, 2592 (2017).[21] K. Oster, P. Goodrich, J. Jacquemin, C. Hardacre, A. P. C. Ribeiro, A. Elsinawi. J. Chem. Thermodyn. 121, 97 (2018).[22] J. A. Eastman, U. S. Choi, S. Li, L. J. Thompson, S. Lee. MRS Online Proc. Libr. Arch. 457 (1996).[23] S. U. S. Choi, J. A. Eastman, Enhancing Thermal Conductivity of Fluids with Nanoparticles, Proceedings of ASME
International Mechanical Engineering Congress & Exposition, San Francisco, CA (1995).

K. Oster et al.: Ionic liquid-based nanofluids (ionanofluids) for thermal applications 1339
[24] X.-Q. Wang, A. S. Mujumdar. Int. J. Therm. Sci. 46, 1 (2007).[25] D. Shin, D. Banerjee. Int. J. Heat Mass Transf. 54, 1064 (2011).[26] R. Hentschke. Nanoscale Res. Lett. 11, 88 (2016).[27] W. Cui, Z. Shen, J. Yang, S. Wu, M. Bai. RSC Adv. 4, 55580 (2014).[28] M. J. Javanmardi, K. Jafarpur. J. Heat Transfer 135, 42401 (2013).[29] V. V Chaban, E. E. Fileti, O. V. Prezhdo. J. Phys. Chem. C 121, 911 (2017).[30] M. M. MacDevette, T. G. Myers. Int. J. Heat Mass Transfer 92, 550 (2016).[31] I. M. Mahbubul, M. M. A. Khan, N. I. Ibrahim, H. M. Ali, F. A. Al-Sulaiman, R. Saidur. Renew. Energy 121, 36 (2018).[32] C. A. Nieto de Castro, M. J. V Lourenço, A. P. C. Ribeiro, E. Langa, S. I. C. Vieira, P. Goodrich, C. Hardacre. J. Chem. Eng. Data
55, 653 (2009).[33] A. P. C. Ribeiro, S. I. C. Vieira, J. M. França, C. S. Queirós, E. Langa, M. J. V Lourenço, S. M. S. Murshed, C. A. N. de Castro.
“Thermal properties of ionic liquids and ionanofluids”, in Ionic Liquids: Theory, Properties, New Approaches, A. Kokorin (Ed.), InTech, London (2011).
[34] C. A. N. De Castro, S. M. S. Murshed, M. J. V Lourenço, F. J. V Santos, M. L. M. Lopes, J. M. P. França. Int. J. Therm. Sci. 62, 34 (2012).
[35] J. M. P. França, S. I. C. Vieira, M. J. V Lourenço, S. M. S. Murshed, C. A. Nieto de Castro. J. Chem. Eng. Data 58, 467 (2013).[36] A. G. M. Ferreira, P. N. Simões, A. F. Ferreira, M. A. Fonseca, M. S. A. Oliveira, A. S. M. Trino. J. Chem. Thermodyn. 64, 80
(2013).[37] M. P. Shevelyova, Y. U. Paulechka, G. J. Kabo, A. V Blokhin, A. G. Kabo, T. M. Gubarevich. J. Phys. Chem. C 117, 4782 (2013).[38] J. M. P. França, F. Reis, S. I. C. Vieira, M. J. V Lourenço, F. J. V Santos, C. A. N. De Castro, A. A. H. Padua. J. Chem. Thermodyn.
79, 248 (2014).[39] A. P. C. Ribeiro, S. I. C. Vieira, P. Goodrich, C. Hardacre, M. J. V Lourenço, C. A. de Castro. J. Nanofluids 2, 55 (2013).[40] S. Atashrouz, M. Mozaffarian, G. Pazuki. Ind. Eng. Chem. Res. 54, 8600 (2015).[41] K. Oster, C. Hardacre, J. Jacquemin, A. P. C. Ribeiro, A. Elsinawi. Aust. J. Chem. 72, 21 (2018).[42] K. Oster, C. Hardacre, J. Jacquemin, A. P. C. Ribeiro, A. Elsinawi. J. Mol. Liq. 253, 326 (2018).[43] A. Ghadimi, R. Saidur, H. S. C. Metselaar. Int. J. Heat Mass Transf. 54, 4051 (2011).[44] C. N. de Castro, A. P. C. Ribeiro, S. I. C. Vieira, J. M. P. França, M. J. V Lourenço, F. V Santos, S. M. S. Murshed, P. Goodrich, C.
Hardacre. “Synthesis, properties and physical applications of ionanofluids”, in Ionic Liquids-New Aspects for the Future, J-i Kadokawa (Ed.), InTech, London (2013).
[45] J. D. Holbrey, K. R. Seddon, R. Wareing. Green Chem. 3, 33 (2001).[46] R. Ge, C. Hardacre, P. Nancarrow, D. W. Rooney. J. Chem. Eng. Data 52, 1819 (2007).[47] R. S. Vajjha, D. K. Das, B. M. Mahagaonkar. Pet. Sci. Technol. 27, 612 (2009).[48] N. G. Polikhronidi, R. G. Batyrova, I. M. Abdulagatov, J. W. Magee, J. T. Wu. Phys. Chem. Liq. 52, 657 (2014).[49] K. Oster, J. Jacquemin, C. Hardacre, A. P. C. Ribeiro, A. Elsinawi. J. Chem. Thermodyn. 118, 1 (2018).[50] P. Kim, L. Shi, A. Majumdar, P. L. McEuen. Phys. B Condens. Matter 323, 67 (2002).[51] E. K. Sichel, R. E. Miller, M. S. Abrahams, C. J. Buiocchi. Phys. Rev. B 13, 4607 (1976).[52] R. Taylor. Philos. Mag. 13, 157 (1966).[53] D. Feng, Y. Feng, X. Zhang, G. Wang. ASME 17334, 1 (2013).[54] C. Maton, N. De Vos, C. V Stevens. Chem. Soc. Rev. 42, 5963 (2013).[55] H. L. Ngo, K. LeCompte, L. Hargens, A. B. McEwen. Thermochim. Acta 357, 97 (2000).[56] J. G. Huddleston, A. E. Visser, W. M. Reichert, H. D. Willauer, G. A. Broker, R. D. Rogers. Green Chem. 3, 156 (2001).[57] I. E. Mouromtseff. Proc. IRE 30, 190 (1942).[58] Y. Murakami, B. B. Mikic. IEEE Trans. Components Packag. Technol. 24, 2 (2001).[59] A. J. F. Mendonca, C. A. Nieto de Castro, M. J. Assael, W. A. Wakeham. Rev Port Quím 23, 7 (1981).[60] J. M. P. França, C. A. Nieto de Castro, M. M. Lopes, V. M. B. Nunes. J. Chem. Eng. Data 54, 2569 (2009).[61] E. N. Sieder, G. E. Tate. Ind. Eng. Chem. 28, 1429 (1936).[62] T. L. Bergman, F. P. Incropera, D. P. DeWitt, A. S. Lavine. Fundamentals of Heat and Mass Transfer, John Wiley & Sons,
Hoboken (2011).[63] R. Smith. Chemical Process: Design and Integration, John Wiley & Sons, Hoboken (2005).[64] M. Tariq, P. A. S. Forte, M. F. C. Gomes, J. N. C. Lopes, L. P. N. Rebelo. J. Chem. Thermodyn. 41, 790 (2009).[65] J. M. S. S. Esperança, H. J. R. Guedes, M. Blesic, L. P. N. Rebelo. J. Chem. Eng. Data 51, 237 (2006).[66] J. J. Fillion, H. Xia, M. A. Desilva, M. Quiroz-Guzman, J. F. Brennecke. J. Chem. Eng. Data 61, 2897 (2016).[67] C. M. S. S. Neves, P. J. Carvalho, M. G. Freire, J. A. P. Coutinho. J. Chem. Thermodyn. 43, 948 (2011).[68] F. J. Deive, M. A. Rivas, A. Rodríguez. J. Chem. Thermodyn. 62, 98 (2013).[69] K. R. Seddon, A. Stark, M.-J. Torres. Pure Appl. Chem. 72, 2275 (2000).[70] Specification available on the company’s website at <https://www.therminol.com/>.[71] Specification available on the company’s website at <https://www.dynalene.com/>.[72] Specification available on the company’s website at <https://www.dow.com/en-us/heat-transfer>.[73] J. Jacquemin, R. Ge, P. Nancarrow, D. W. Rooney, M. F. Costa Gomes, A. A. H. Pádua, C. Hardacre. J. Chem. Eng. Data 53, 716
(2008).

1340 K. Oster et al.: Ionic liquid-based nanofluids (ionanofluids) for thermal applications
[74] A. Heintz, J. K. Lehmann, C. Wertz, J. Jacquemin. J. Chem. Eng. Data 50, 956 (2005).[75] J. Jacquemin, P. Husson, V. Mayer, I. Cibulka. J. Chem. Eng. Data 52, 2204 (2007).[76] J. França, C. A. N. de Castro, A. A. H. Padua. Phys. Chem. Chem. Phys. 19, 17075 (2017).[77] M. Chorążewski, E. B. Postnikov, B. Jasiok, Y. V Nedyalkov, J. Jacquemin. Sci. Rep. 7, 5563 (2017).[78] H. Tokuda, K. Hayamizu, K. Ishii, M. A. B. H. Susan, M. Watanabe. J. Phys. Chem. B 109, 6103 (2005).[79] J. C. Mauro, Y. Yue, A. J. Ellison, P. K. Gupta, D. C. Allan. Proc. Natl. Acad. Sci. USA 106, 19780 (2009).[80] B. Wang, X. Wang, W. Lou, J. Hao. J. Phys. Chem. C 114, 8749 (2010).[81] J. Liu, F. Wang, L. Zhang, X. Fang, Z. Zhang. Renew. Energy 63, 519 (2014).[82] G. Knothe, K. R. Steidley. Fuel 84, 1059 (2005).[83] D. Li, H. Zhen, L. Xingcai, Z. Wu-gao, Y. Jian-Guang. Renew. Energy 30, 967 (2005).[84] S. Z. Erhan, S. Asadauskas. Ind. Crops Prod. 11, 277 (2000).[85] R. R. Gonnelli. US9072828B2, Filed 18 June 2009, Issued 07 July 2015.[86] D. G. Placek, C. D. Neveu, R. Schweder, R. P. Simko, C. W. Hyndman. US7648950B2, Filed 26 October 2006, Issued 19
January 2010.[87] C. Ye, W. Liu, Y. Chen, L. Yu. Chem. Commun. 2244 (2001). DOI: 10.1039/B106935G.[88] M.-D. Bermúdez, A.-E. Jiménez, J. Sanes, F.-J. Carrión. Molecules 14, 2888 (2009).[89] Y. U. Paulechka, A. V Blokhin, G. J. Kabo. Thermochim. Acta 604, 122 (2015).[90] G. Hummer, J. C. Rasaiah, J. P. Noworyta. Nature 414, 188 (2001).[91] T. Morimoto, K. Miura. Langmuir 1, 658 (1985).[92] G. Giovannetti, P. A. Khomyakov, G. Brocks, P. J. Kelly, J. Van Den Brink. Phys. Rev. B 76, 73103 (2007).[93] G. Tao, L. Zhang, Z. Hua, Y. Chen, L. Guo, J. Zhang, Z. Shu, J. Gao, H. Chen, W. Wu. Carbon NY 66, 547 (2014).[94] M. J. Earle, J. M. S. S. Esperança, M. A. Gilea, J. N. C. Lopes, L. P. N. Rebelo, J. W. Magee, K. R. Seddon, J. A. Widegren. Nature
439, 831 (2006).[95] S. Zhang, N. Sun, X. He, X. Lu, X. Zhang. J. Phys. Chem. Ref. Data 35, 1475 (2006).[96] M. Freemantle. An Introduction to Ionic Liquids, Royal Society of Chemistry, Cambridge (2010).[97] G. García-Miaja, J. Troncoso, L. Romaní. J. Chem. Thermodyn. 41, 161 (2009).[98] L. E. Ficke, H. Rodríguez, J. F. Brennecke. J. Chem. Eng. Data 53, 2112 (2008).
Supplementary Material: The online version of this article offers supplementary material (https://doi.org/10.1515/pac-2018-1114).