ION VI FOUNDATION SRI LANKA SCIENCE & …thakshana.nsf.ac.lk/slstic/NA-361/NA361.pdf · Sri Lanka...
62
900c* - *tooqpu»H J »3 »*£?WS A"2ojouipaj_ ^ aotiaps p^inrj US \ \1 I O N VI s( n \ ( i. FOUNDATION SRI LANKA SCIENCE & TECHNOLOGY N a t i o n a l S c i e n c e Foundation 47/5, Maitland Place. Colombo 07 Sri Lanka. www.nsf.ac.lk
Transcript of ION VI FOUNDATION SRI LANKA SCIENCE & …thakshana.nsf.ac.lk/slstic/NA-361/NA361.pdf · Sri Lanka...
1 - C O I - 0 6 S Q S 6 - 8 Z 5 N8SI payuj.-i 'Siaiuud) AuedujoQ ? euaseunr , Q • Aq pa iu iy s p a u f t s a c
> j | o e j s u ' M M M
/ oqLUO|OQ 9 0 B | d pUB|ilB|AJ S/lp
u o | j e p u n o j e o u e p s I B U O I J B N
900c* - *tooqpu»H J»3»*£?WS A"2ojouipaj_ ^ aot iaps p^inrj US
\ \1 I O N VI
s( n \ ( i. FOUNDATION
SRI LANKA SCIENCE & TECHNOLOGY
N a t i o n a l S c i e n c e F o u n d a t i o n 47/5, Maitland Place.
Colombo 07 Sri Lanka.
www.nsf.ac.lk
Copyright © National Science Foundation, Sri Lanka. All nghts reserved. Price : SL Rs. 300.00 (Sri Lankans), US $ 10.00 (Foreign nationals)
For a copy of the Publication or suggestions for improvements, please write to:
Head, Science and Technology Policy Research D iv i s ion Nat iona l Science Foundat ion 4 7 / 5 , Mai t land Place C o l o m b o 7 Sri Lanka.
T e l / f a x : 0112675841 , 2679209 E-mai l : [email protected] Website : www.mis.nsf.ac.lk
Ap r i l 2009
I S B N 978 - 955-590 - 1 0 3 - 1
Sri Lanka Science & Technology Statistical Handbook
2006
N A T I O N A L SCIENCE F O U N D A T I O N
4 7 / 5 , Maitland Place Colombo 7 Sri Lanka.
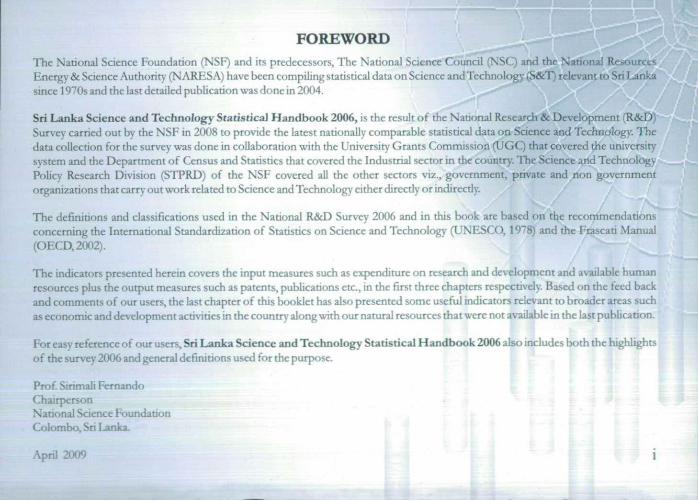
FOREWORD The National Science Foundation (NSF) and its predecessors, The National Science Council (NSC) and the National Resources Energy & Science Authority (NARESA) have been compiling statistical data on Science and Technology (S&T) relevant to Sri Lanka since 1970s and the last detailed publication was done in 2004.
Sri Lanka Science and Technology Statistical H a n d b o o k 2006, is the result o f the National Research & Development ( R & D ) Survey carried out by the N S F in 2008 to provide the latest nationally comparable statistical data on Science and Technology. The data collection for the survey was done in collaboration with the University Grants Commission (UGC) that covered the university system and the Department o f Census and Statistics that covered the Industrial sector in the country. The Science and Technology Policy Research Division (STPRD) of the N S F covered all the other sectors viz., government, private and non government organizations that carry out work related to Science and Technology either directly or indirectly.
The definitions and classifications used in the National R & D Survey 2006 and in this book are based on the recommendations concerning the International Standardization of Statistics on Science and Technology (UNESCO, 1978) and the Frascati Manual ( O E C D , 2002).
The indicators presented herein covers the input measures such as expenditure on research and development and available human resources plus the output measures such as patents, publications etc., in the first three chapters respectively. Based on the feed back and comments of our users, the last chapter o f this booklet has also presented some useful indicators relevant to broader areas such as economic and development activities in the country along with our natural resources that were not available in the last publication.
For easy reference of our users, Sri Lanka Science and Technology Statistical H a n d b o o k 2006 also includes both the highlights o f the survey 2006 and general definitions used for the purpose.
Prof. Sirimali Fernando Chairperson National Science Foundation Colombo, Sri Lanka.
April 2009
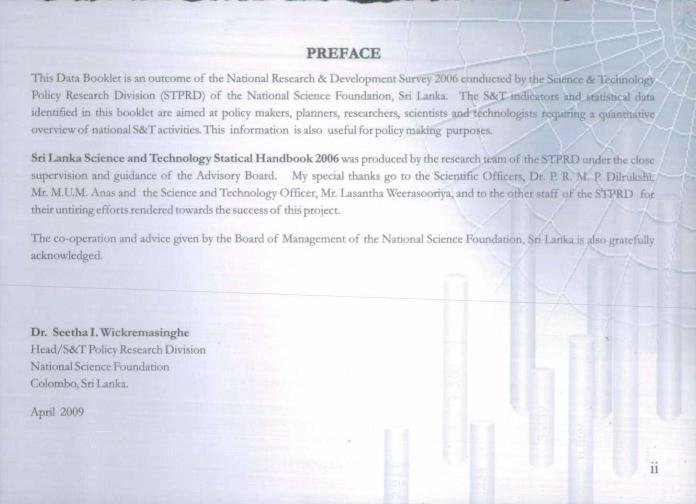
P R E F A C E
This Data Booklet is an outcome o f the National Research & Development Survey 2 0 0 6 conducted by the Science & Technology
Policy Research Division ( S T P R D ) o f the National Science Foundation, Sri 1-anka. T h e S & T indicators and stanstic.il data
identified in this booklet are aimed at policy makers, planners, researchers, scientists and technologists requiring a quantitative
overview o f national S & T activities. This information is also useful for policy making purposes.
Sri L a n k a S c i e n c e and T e c h n o l o g y Sta t ica l H a n d b o o k 2 0 0 6 was produced by the research team o f the S T P R D under the close
supervision and guidance o f the Advisory Board. My special thanks go to the Scientific Officers, Dr. P. R. M. P. Dilrtikshi.
Mr. M.U.M. Anas and the Science and Technology Officer, Mr. Iasantha Weerasooriya, and to the other staff o f the S T P R D for
their untiring efforts rendered towards the success o f this project.
T h e co-operation and advice given by the Board o f Management o f the National Science Foundation, Sri Lanka is also gratefully
acknowledged.
Dr. S e e t h a l . W i c k r e m a s i n g h e
H e a d / S & T Policy Research Division
National Science Foundation
Colombo, Sri I.anka.
April 2009
II
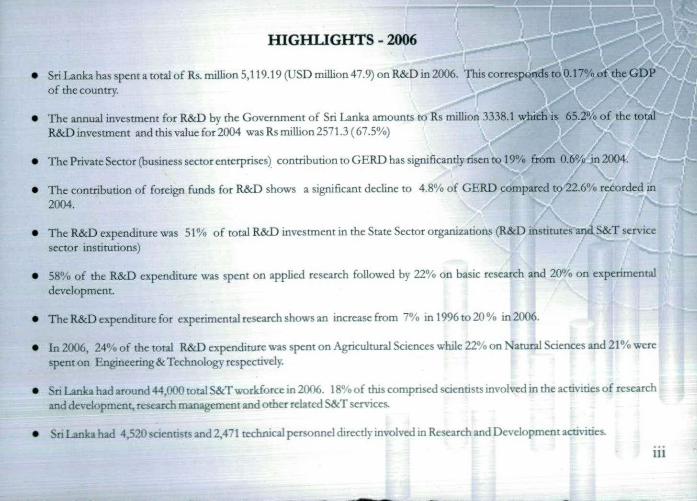
HIGHLIGHTS - 2006
Sri Lanka has spent a total of Rs. million 5,119.19 (I SD milli. >n 4"\9; . >n R&D in 2006. This corresponds to 0.17% of the GDP of the country. \ ^ ^ " ^
The annual investment for R&D by the Government of Sri I-anka amounts to Rs million 3338.1 which is 65.2% of the total R&D investment and this value for 2004 was Rs million 2571.3 (67.5%)
The Private Sector (business sector enterprises) contribution to GERD has significantly risen to 19% from 0.6% in 2004.
The contribution of foreign funds for R&D shows a significant decline to 4.8% of GERD compared tt>'22.6% recorded in 2004.
The R&D expenditure was 51% of total R&D investment in the State Sector organizations (R&D institutes and S&T service sector institutions)
58% of the R&D expenditure was spent on applied research followed by 22% on basic research and 20% on experimental development.
The R&D expenditure for experimental research shows an increase from 7% in 1996 to 20% in 2006.
In 2006, 24% of the total R&D expenditure was spent on Agricultural Sciences while 22% on Natural Sciences and 21% were spent on Engineering & Technology respectively.
Sri Lanka had around 44,000 total S&T workforce in 2006. 18% of this comprised scientists involved in the activities of research and development, research management and other related S&T services.
Sri Lanka had 4,520 scientists and 2,471 technical personnel directly involved in Research and Development activities.
iii

• 41.7% o f the R&D scientists were employed in state sector S&T organizations; 32.7% in higher education sector and 25.61 o in private sector organizations (business enterprises and NGOs).
• The highest number of research scientists (30%) were engaged in research in natural sciences. This was followed by medical sciences 27% .agricultural sciences 19% and engineering and technology 16%.
• I n 2006,41.5 % of the total R&D scientists were female.
• The total number of Full-Time Equivalent researchers was 1,833 and 41.13% of this was represented by female scienti--t-.
• The number of patents registered by the Patent Office of Sn I-anka was 129 and of that, 66 were registered by Sri I-ankan residents and 63 were by non- residents.
• In 2006, 231 articles were published by the Sri Lankan scientists in the SCI cited journals and 60.2 % of that had foreign scientists as co-authors.
• The highest number (30%) of articles published in SCI cited journals was in the field of medical and health sciences followed by biological sciences (13%), chemical sciences (13%), agricultural sciences (12%) and physical sciences (11 %).
• 1044 completed their post graduate degrees including 26 Ph.Ds, 38 M.Phils, 542, M.Sc /MJEng, 224 MD/MS and 214 postgraduate diplomas.
iv
C O N T E N T S
1. Financial Resources for Research and Development
1.1
1.2
1.3
1.4
1.5
1.6
1.7
1.8
1.9
Gross Expenditure on R&D (GERD) in Sri Lanka
R&D Expenditure in selected Countries
Science, Technology and Innovation indicators in selected countries 2002-2004
National Expenditure on Research and Development (GERD) by Source of Funding 2006
National R&D Expenditure trends by Source of Funding 1996-2006
Trend in R&D Expenditure (%GDP) by source of funding 1996 - 2006
National R&D Expenditure by Sectors
National R&D Expenditure by Nature of Research Activity
National R&D Expenditure by Discipline 1996-2006
H u m a n Resources in Science and Technology Personnel
2.1
2.2
2.3
2.4
2.5
2.6
2.7
2.8
2.9
Science and Technology Personnel (STP) by Category
R&D Manpower Resources in selected Countries
Number of S&T Personnel (STP) by Sector 2006
Number of STP by Discipline 1996-2006
Number of R&D Scientists (Head Count) by Sector
Number of R&D Scientists (Head Count) by Discipline and Sex
Educational Qualifications of R&D Scientists 2006
Number of F T E of R&D Scientists by Sector 2006
Number of F T E of R&D Scientists by Discipline 2006
3. Performance Indicators for Science and Technology
3.1 : Number of Patents registered locally during 1997-2006
3.2 Number of Patents registered by residents during the period 2003-2006 by sector
3.3 Distribution of Patents
3.4 Number of Technological Innovations and New Processes Developed during 2001 -2006
3.5 Other relevant indicators of S&T sector during 2005-2006
3.6 Main Fields of Sri I^ankan papers in SCI for years 2005 - 2006
3.7 Postgraduate output in 2004 and 2006
3.8 Numberof SLAAS Presentations at Annual Proceedings and Number of Scientists involved during 2002-2006 3.9 Performance of NSF Research Grants Scheme 2006
4.1 Demography
4.2 Human Development Indicators - Comparative Statistics
4.3 Trends in Economic Activity in Sri Lanka
4.4 Economic Activity in South Asia, 2001 and 2006
4.5 Gross National Product by Industrial Origin of Major Economic Activities
4.6 Realised Investments through BOI Projects in 2005-2006
vi
4.7 : Composition of Exports 2004-2006 4.8 Composition of Imports 2004-2006 4.9 Key Indicators on Household Income 1985-2005 4.10 • Salient Features of Telecommunications and Postal Services 2003-2006
4.11 Employment by Economic Activity
4.12 Statistics on Secondary Education 2003-2006 4.13 Statistics on University Education
4.14 Salient Features of Health Services
4.15 Agriculture Research and Development -Some relevant indicators 2006
4.16 Ecosystem diversity and their extents in Sri Lanka
4.17 Number of threatened species of selected groups of plants and animals
Definitions
Abbreviations
Financial Resources for Research & Development 2
1.1: Gross Expendi ture on R & D ( G E R D ) in Sri L a n k a
Year GDP Current
Prices Rs.million
GERD Rs.million
(USS)
GERD as Percent of
GDP
Total Population
million
G E R D per million
population Rs.million
1966 7,529 20 (4.2) 0.30 11.5 1.7
1975 11,100 45 (6.4) 0.40 13.5 3.3
1984 142,700 257 (9.7) 0.18 15.6 16.5
1993 499,800 649 (13.1) 0.13* 17.6 36.8
1996 769,900 1,410 (23) 0.18 18.3 77.0
2000 1,258,000 1,810(22.9) 0.14* 18.4 98.4
2004 1,800,750 3,807 (40.9) 0.21 19.4 196.2
2006 2,939,000 5,119(47.9) 0.17 19.8 258.5
S o u r c e : N a t i o n a l R & D S u r v e y s S n L a n k a 1996 ( N A R E S A ) ; 2000 ,2004 & 2006 ( N S F )
I-.stimates
Figure 1 : Gross Expenditure on R&D
Financial Resources for Research & Development
Financial Resources for Research & Development 4
1.2 : R&D Expenditure in selected countries
Country Year R&D Expenditure As percentage (%) Per capita (PPP$) Country 000 PPP$ of GDP
Brazil 2005 13,057,225.70 0.82 69.88 Canada 2006 23,563,512.63 1.97 723.32 China 2006 86,758,233.48 1.42 65.68 Germany 2006 67,143,260.74 2.52 812.47 India 2004 14,956,223.18 0.69 13.38 Indonesia 2001 251,609.91 0.05 1.17 Israel 2006 7,689,762.19 4.53 1,129.18 Japan 2006 138,767,293.00 3.39 1,084.51 Malaysia 2004 1,661,347.41 0.59 65.94 Mongolia 2005 17,331.56 0.26 6.72 Myanmar 2002 48,964.44 0.16 1.05 New Zealand 2005 1,189,315.58 1.17 290.28 Pakistan 2005 1,486,576.28 0.44 9.40 Republic of Korea 2006 35,897,697.03 3.23 747.08 Russian Federation 2006 20,123,587.82 1.08 140.51 Singapore 2006 4,782,486.88 2.39 1,091.42 Sri Lanka 2004 115,524.90 0.19 6.08 Sweden 2006 11,867,333.68 3.82 1,307.23 Thailand 2004 1,055,221.76 026 16.87 United Kingdom 2006 36,035,852.84 1.79 595.52 United States 2006 343,747,500.00 2.61 1,135.08
Adapted from UNESCO Statistic* 2006
1.3 : Science, Technology and Innovation indicators in selected countries 2002-2004
G E R D / G D P 2002-04
G E R D / Bus iness E n t e r p r i s e
G E R D % Government
G E R D % Higher Educat ion
High-Tech E x p o r t s as % of manufactured exports
R&D Researchers per million persons
China 1.44 62 27.0 - 11.0 27 633 India 1.11 23 74.6 2.4 11* 143** Japan 3.15 77 9.3 13.7 24 5,085 Malaysia 0.69 65 20.0 15.0 58 294 New Zealand 1.16 62 29.0 29.0 10 2,593 Pakistan 0.24 - 80.0 20.0 1 88 Phillipines 0.11 61 22.0 17.0 74 -
Rep. of Korea 2.64 T L 13.0 10.0 32 2,979 Thailand 0.26 47 22.0 31.0 3 . 289 Australia - 54 19.0 28.7 14 3,446
Sri Lanka 0.21 0 61.0 33.5 NA 214
Source : Tim Turpin and V. V. Krishna (2(K)7), Science, Technology Policy and the Diffusion of knowledge, Edward Elgar Publishing Ltd, U.K. • for 2004-05 including software products : Source: Centre for studies in Science policy, Jawaharlal Nehru University, New Delhi. " for 2000 : source : www.uncsco.org/sacnce/knowlcdgc_societies.pdf NA - Not available for 2002 - 2004
Financial Resources for Research & Development
Financial Resources for Research & Development 6
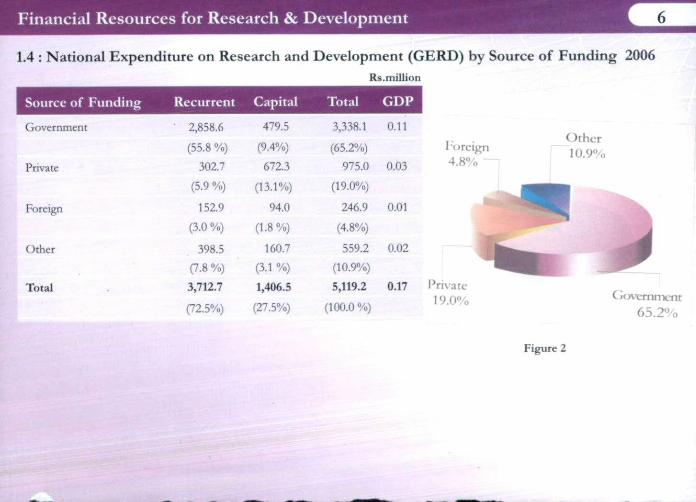
1.4 : National Expenditure on Research and Development (GERD) by Source of Funding 2006 Rs.million
Source of Funding Recurrent Capital Total G D P
Government
Private
Foreign
Other
Total
2,858.6 (55.8 %)
302.7 (5.9 %)
152.9 (3.0 %)
398.5 (7.8 %) 3,712.7
(72.5%)
479.5 (9.4%) 672.3
(13.1%) 94.0
(1.8 %)
160.7 (3.1 %) 1,406.5
(27.5%)
3,338.1
(65.2%) 975.0
(19.0%) 246.9
(4.8%)
559.2 (10.9%) 5,119.2
(100.0%)
0.11
0.03
0.01
0.02
0.17
Foreign 4.8% ~
Private 1 9 . 0 %
O t h e r 1 0 . 9 %
CkjvTernrnenr 65 .2%
Figure 2
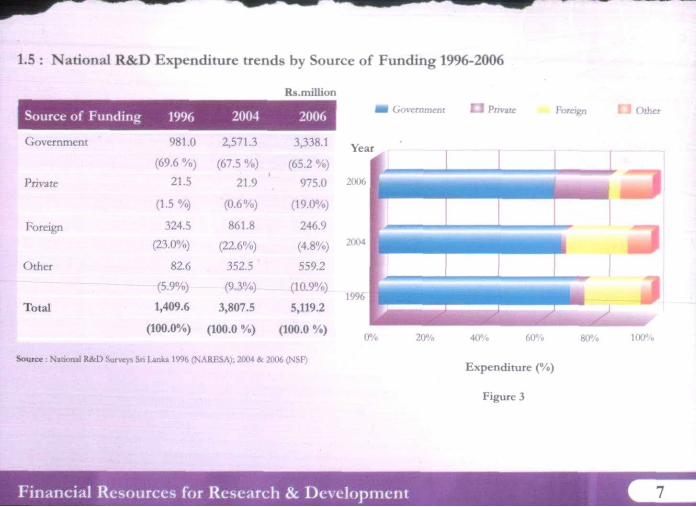
1.5 : National R&D Expenditure trends by Source of Funding 1996-2006
Rs.million
1996 2004 2006
981.0 2,5713 3,338.1
(69.6 %) (67.5 %) (65.2 %) 21.5 21.9 975.0
(1.5 %) (0.6%) (19.0%)
324.5 861.8 246.9 (23.0%) (22.6%) (4.8%)
82.6 352.5 559.2
(5.9%) (9,3%) (10.9%)
1,409.6 3,807.5 5,119.2
(100.0%) (100.0 %) (100.0 %)
Source o f F u n d i n g
Government
Private
Foreign
Other
Total
Source : National R&D Surveys Sn 1-anlca 1996 (NARESA); 2004 & 2006 (NSF)
Government D Private Foreign I I Other
Year
1996
0% 20% 40% 60% 80% 100%
Expenditure (%)
Figure 3
Financial Resources for Research & Development 7
Financial Resources for Research & Development
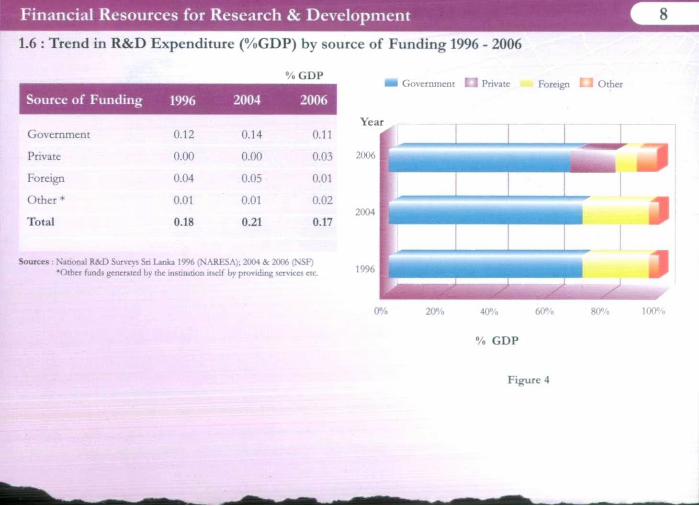
1.6 : Trend in R & D Expendi ture (%GDP) by source of Funding 1996 - 2006
% GDP
Source of Funding 1996 2004 2006
Government 0.12 0.14 0.11
Private 0.00 0.00 0.03
Foreign 0.04 0.05 0.01
Other* 0.01 0.01 0.02
Total 0.18 0.21 0.17
Government D Private Foreign I 1 Other
Sources : National R&D Surveys Sh Lanka 1996 (NARESA); 2004 & 2006 (NSF) •Other funds generated by the insrituuon itself by providing services etc
Figure 4
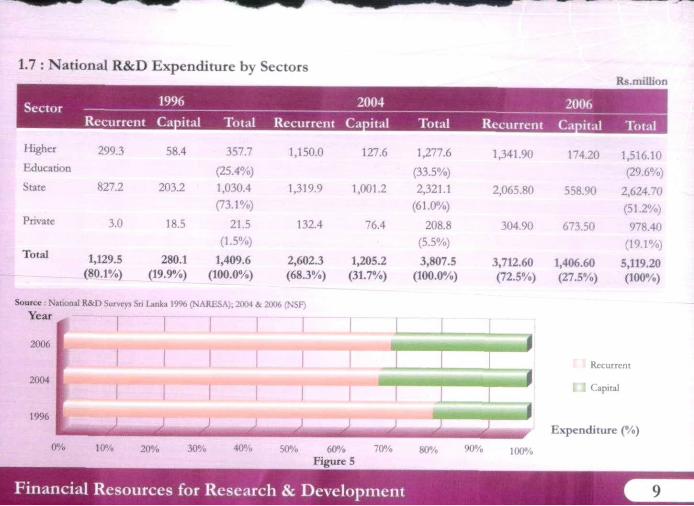
1.7 : National R&D Expenditure by Sectors Rs.million
Sector 1 9 % 2 0 0 4 2 0 0 6
Recurrent Capital Total Recurrent Capital Total R e c u r r e n t Capital Total 1 Higher 299.3 58.4 357.7 1,150.0 127.6 1,277.6 1,341.90 174.20 1,516.10 Education (25.4%) (33.5%) (29.6%) State 827.2 203.2 1,030.4 1,319.9 1,001.2 2,321.1 2 ,065.80 558 .90 2 ,624.70
(73.1%) (61.0%) (51.2%)
978 .40 Private 3.0 18.5 21.5 132.4 76 .4 208.8 304 .90 673 .50
(51.2%)
978 .40 (1.5%) (5.5%) (19.1%)
Total 1,129.5 280.1 1,409.6 2 ,602 .3 1,205.2 3 ,807 .5 3 ,712.60 1,406.60 5,119.20 (80 .1%) (19 .9%) (100 .0%) ( 6 8 . 3 % ) (31.7%) (100 .0%) (72 .5%) (27 .5%) (100%)
Source : National R&D Surveys Sn Lanka 19% (NARESA); 2004 & 2006 (NSF) Year
1996
Recurrent
i ] Capital
Expenditure (%)
0% 10" „ 20% 30% 60% Figure 5
Financial Resources for Research & Development
s for Research & Development
1.8 : National R&D Expenditure by Nature of Research Activity Rs .mi l l ion
N a t u r e o f Research 19%
A m o u n t
2004
A m o u n t %
2006
A m o u n t %
Basic Research 446.3 32 .0 519.6 13.6 1,143.1 22 .4
Applied Research 867.3 61 .0 2,886.1 75.8 2,950.1 57.6
Experimental Development 96 .0 7.0 401 .8 10.6 1,026.0 20 .0
Total 1,409.6 100.0 3,807.5 100.0 5,119.2 100.0
Source : National R&D Surveys Sn Lanka 1996 (NARESA); 2004 Be 2006 (NSF)
Experimental Development Applied Research Basic Research
1.9 : National R&D Expenditure by Discipline 1996-2006 Rs.million
Discipline
Natural Sciences
Engineering & Technology
Medical Sciences
Agricultural Sciences
Social Sciences & Humanities
Other
Total
Source | National R&D Surveys Sn I^nka 19% (NARESA); 2004 & 2006 (NSF)
Year c n n n
1996 2004 2006 JU.KaJ -
4 5 . 0 0 -
318.3 627.6 1,148.7 4 0 . 0 0 -
w 3 5 . 0 0 .
(22.6%) (16.5%) (22.4%) 4 0 . 0 0 -
w 3 5 . 0 0 . 164.3 614.1 1,096.5
4 0 . 0 0 -
w 3 5 . 0 0 .
(11.6%) (16.1%) (21.4%) 2 3 0 . 0 0 .
136.6 531.4 726.7 c ^ 2 5 . 0 0 -
(9.7%) (14.0%) (14.2%) | B 2 0 . 0 0 . 669.2 1,002.5 1,258.9 M 2 1 5 - 0 0 -
(47.5%) (26.3%) (24.6%) J 0 5 1 0 . 0 0 . 121.2 999.5 393.9 J 0 5 1 0 . 0 0 .
(8.6%) (26.2%) (7.7%) 5 . 0 0 .
32.4 494.7 0 . 0 0 -
(0.9%) (9.7%)
1,409.6 3,807.5 5,119.2 • Natural
1996 2004 2006 Year
nce» fl Engineering 8c Technology Medical Sciences
| Agnculturai Sciences __ Social Sciences & Humanities fl Other
Figure 7
Financial Resources for Research & Deve lopment 11
Human Resources in Science and Technology Personnel 14
2.1 : S c i e n c e a n d T e c h n o l o g y P e r s o n n e l ( S T P ) b y C a t e g o r y
2004 2006
STP Category Total
number
Per cent
of STP
Per million
inhabitants
Total
number
Percent
of STP
Per million
inhabitants
S&T Scientists 9,746 34.3 502.3 7,907 17.9 399.3
Technicians 12,302 43.3 634.1 9,803 22.2 495.1
Other Supporting Staff 6,384 22.4 329.1 26,358* 59.9 1,331.2
Total STP 28,432 100.0 1,465.5 44,068 100.0 2,225.6
S o u r c e : N a t i o n a l R & D Surveys S n L a n k a 2004 & 2006 (NSF) * includes skilled a n d unski l led s u p p o r t i n g staff in C e y l o n Electricity B o a r d a n d C e y l o n T r a n s p o r t B o a r d that w a s not c o v e r e d in the 2004 survey.
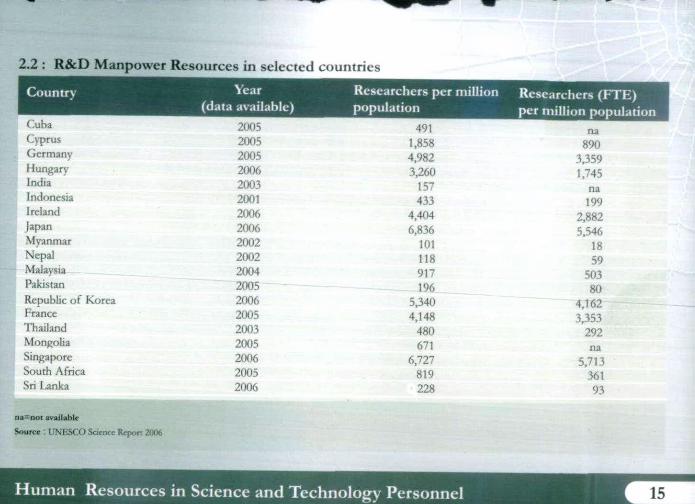
2.2 : R & D M a n p o w e r R e s o u r c e s i n s e l e c t e d c o u n t r i e s
Country Year (data available)
Researchers per million population
Researchers ( F T E ) per million population
Cuba 2005 491 na Cyprus 2005 1,858 890 Germany 2005 4,982 3,359 Hungary 2006 3,260 1,745 India Indonesia Ireland
2003 2001 2006
157 433
4,404
na India Indonesia Ireland
2003 2001 2006
157 433
4,404 199
2,882 Japan 2006 6,836 5,546 Myanmar 2002 101 18 Nepal Malaysia Pakistan Republic of Korea France
2002 2004 2005 2006 2005
118 917
59 503
Nepal Malaysia Pakistan Republic of Korea France
2002 2004 2005 2006 2005
196 5,340 4,148
80 4,162 3,353
Thailand 2003 480 292 Mongolia 2005 671 na Singapore 2006 6,727 5,713 South Africa 2005 819 361 Sri Lanka 2006 228 93
n a = n o t a v a i l a b l e
S o u r c e : UNESCO Science Report 2(106
H u m a n Resources in Science and Techno logy Personnel 15
i T L U I l i a n r v c S U U r t C S 111 J C l C l i C C a i m l t c n i i u i u g v M. v . i d u i m v . 1
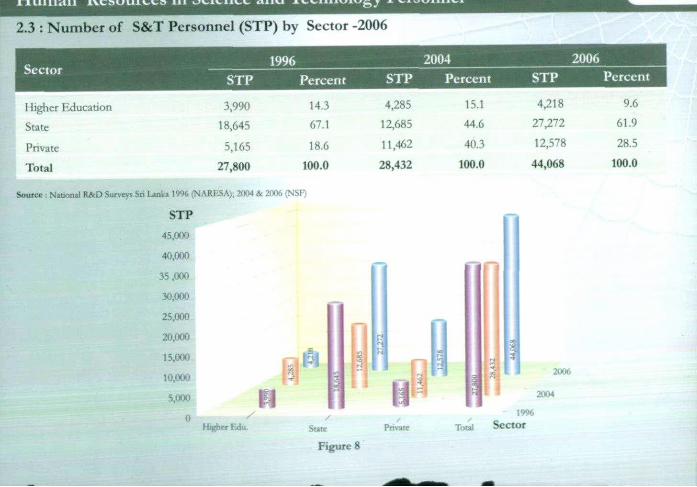
2.3 : N u m b e r of S & T Personnel ( S T P ) by Sector -2006
c . 1996 2004 2006 sector STP Percent STP Percent STP Percent
Higher Education 3,990 14.3 4,285 15.1 4,218 9.6
State 18,645 67.1 12,685 44.6 27,272 61.9
Private 5,165 18.6 11,462 40.3 12,578 28.5
Total 27,800 100.0 28,432 100.0 44,068 100.0
2006
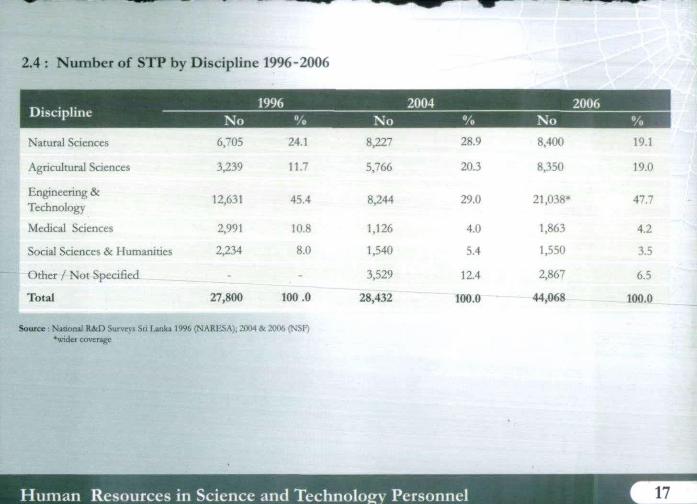
2.4 : N u m b e r of S T P by Discipline 1996-2006
Natural Sciences
Agricultural Sciences
Engineering & Technology
Medical Sciences
Social Sciences & Humanities
Other / Not Specified
Total
6,705
3,239
12,631
2,991
2,234
2 7 , 8 0 0
24.1
11.7
45.4
10.8
8.0
1 0 0 . 0
Source : National R&D Surveys Sri Lanka 1996 (NARESA); 2004 Be 2006 (NSF) •wider coverage
8,227
5,766
8,244
1,126
1,540
3,529
28,432
28.9
20.3
29.0
4.0
5.4
12.4
1 0 0 . 0
8,400
8,350
21,038*
1,863
1,550
2,867
4 4 , 0 6 8
19.1
19.0
47.7
4.2
3.5
6.5
1 0 0 . 0
H u m a n Resources in Science and Techno logy Personnel 18
N u m b e r of S T P by Discipl ine 1996 - 2006
2006
2004 year
y y y y A / * y /f / s y y
Discipline
Figure 9
2 . 5 : N u m b e r of R & D Scientists ( H e a d Count ) by Sector
2004 2006 Sector Scientists Technicians Scientists Technicians
No. % No. 0/_
/o No. % No. % Higher Education 2,920 62.3 622 30.6 2,839 62.8 807 32.7
State 1,413 31.9 1,043 51.3 1,479 32.9 1,031 41.7
Private and NGO 269 5.8 369 18.1 202 4.5 633 25.6
Total 4,602 100.0 2,034 100.0 4,520 100.0 2,471 100.0
Source : National R&D Surveys Sn Lanka 2004 & 2006 (NSF;
H u m a n Resources in Science and Techno logy Personnel
H u m a n Resources in Science and Techno logy Personnel 20
2.6 : N u m b e r o f R & D S c i e n t i s t s ( H e a d C o u n t ) b y D i s c i p l i n e a n d Sex
H e a d Count of R & D Scientists H e a d Count of R & D Scientists
Discipline Male F e m a l e Tota l Male F e m a l e Total
N o % N o % N o % N o . % N o . % N o . % Natural Sciences 1,032 35 696 43 1,728 37 698 26 645 34 1,343 30 Agricultural Sciences 569 19 288 18 857 19 507 20 335 17 842 19
Engineering & Technology 774 26 193 12 967 21 741 28 320 17 1,061 23
Medical Sciences 369 12 318 19 687 15 480 18 410 22 890 20
Social Sciences & Humanities
167 6 109 7 276 6 177 7 155 9 332 7
Other / Not Specified 63 2 24 1 87 2 39 1 13 1 52 1
Total 2,974 100 1,628 100 4,602 100 2,642 100 1,878 100 4,520 100
Source : National R&D Surveys Sri Lanka 2004 & 2006 (NSF)
2.7 : Educat ional Qualifications of R&D Scientists - 2006
Ph.D. 796 30.0 367 20.0 1,163 25.7
M.Phil./M.Sc 710 26.0 540 29.3 1,250 27.6
BSc. + P.G. Diploma KH 3.7 82 4.5 183 4.0
B.Sc. (Special) 462 17.2 293 16.0 755 16.7
B.Sc (General) 421 16.0 477 26.0 898 19.8
Q t h c r 193 7.1 78 4.2 271 6.2
Total 2,683 100.0 1,837 100.0 4,520 100.0
H u m a n Resources in Science and Techno logy Personnel
Human Resources in Science and Technology Personnel
2.8 : N u m b e r of F T E o f R&D Scientists by Sector - 2006
Full Time Equivalent of R&D Scientists Male Female Total % Female
Higher Education 406 303 709 16.5
State 516 406 922 22.1
Private & NGO 157 45 202 2.4
Total 1,079 754 1,833 41.0
2 .9 : N u m b e r of F T E of R&D Scientists by Discipline - 2006
Full Time Equivalent of R&D Scientists Discipline Male Female Total % Female
Natural Sciences 223 191 414 46
Agricultural Sciences 327 246 573 43
Engineering & Technology 274 134 408 33
Medical Sciences
Social Sciences & Humanities
122
96
95
75
217
171
44
44
Other / Not Specified
Total
37
1,079
13
754
50
1,833
26
41
Performance Indicators for Science and Technology 3 . 1 : N u m b e r o f P a t e n t s r e g i s t e r e d l o c a l l y d u r i n g 1997 - 2 0 0 6
Year Resident Non resident* Total
1997 65 96 161 1998 44 97 141 1999 78 101 179 2000 59 69 128 2001 71 104 175 2002 62 56 118 2003 59 53 112 2004 99 91 190 2005 63 122 185 2006 66 63 129
Source : adapted from information of Nanonal Intellectual Property Office of Sri Lanka * Foreign countnes / individuals.
3.2 : N u m b e r o f P a t e n t s r e g i s t e r e d b y r e s i d e n t s d u r i n g t h e p e r i o d 2003 - 2006 b y s e c t o r
Category 2003 2004 2005 2006
S&T Institutes 8 5 2 3
Higher Education Institutes 4 4 3 1 Private Institutes 8 13 8 4
Individuals
Total
39
59
77
99
50
63
58
66
3 3 : D i s t r i b u t i o n o f P a t e n t s
Classification 2002 2003 2004 2005 2006 T o t a l
Dryers /Dehydration Technology 0 1 1 1 2 5
Food and Beverage Process Technology 2 4 5 8 9 28 Rubber Production and Processing Technology 3 0 2 0 i . 4 Agnculrural Systems and Development Technology 5 5 7 12 ii 40 Construction Technology and Materials 1 3 4 6 5 19 Packaging and Packing Materials 1 1 7 2 1 12 Energy Saving/ Generating Devices 9 3 5 3 3 23 Process Technology - Manufacturing Sector 2 4 5 2 6 19 Process Technology - Miscellaneous 3 6 5 2 1 17 Innovations in Domestic Appliances/Utilities 19 7 13 4 5 48 Innovations in IT and Telecommunication 8c Other 7 11 19 21 16 74 Drugs, Cosmetics 8c Other Product Development 10 14 26 2 6 58 Total 62 61 97 63 66 349
Source ; adapted from information of National Intellectual Property Office of Sn Lanka
3.4 : N u m b e r o f T e c h n o l o g i c a l I n n o v a t i o n s a n d N e w P r o c e s s e s s D e v e l o p e d i n 2001-2006
T y p e 2001 - 2002 2 0 0 3 - 2 0 0 4 2005 -2006
Technological Innovations 39 70 72 New Processes Developed 22 45 52 High Technology Products Produced 24 44 38 Technology Transfer Activities 1,572 2,324 3,347
Source : National R&D Surveys Sn Lanka 1996 (NARESA); 2004 8c 2006 (NSF)
Performance Indicators for Science and Technology
Performance Indicators for Science and Techno logy
3.5 : Other related indicators of S& T sector during 2005-2006
National 2005 -2006
International 2005-2006
Total
Book and book chapters 612 44 656 Journal Articles 3,769 1,950 5,719 Other publications 796 120 916 No. of Seminars presentations 3,494 698 4,192 Resource Persons at Workshops 4,017 115 4,132 No. of Training programs conducted for public 2,630 798 3,428 No. of Consultancies involved 3,813 904 4,717 No. of Special Awards received 63 7 70 Other Communications 16 4 20
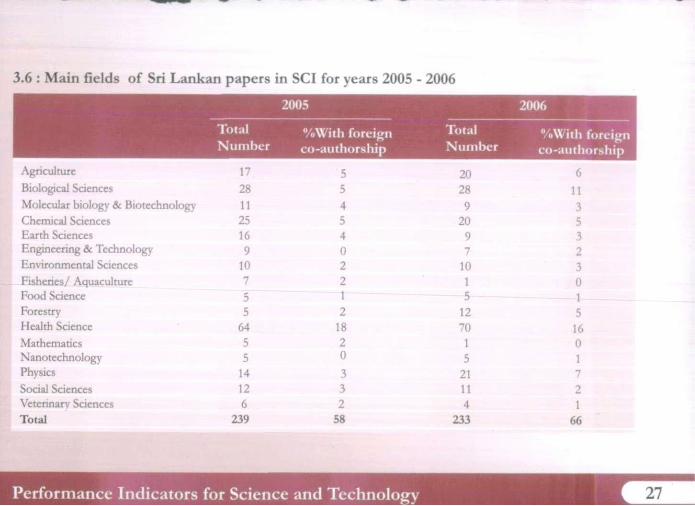
3.6 : M a i n fields of Sri Lankan papers in SCI for years 2005 - 2006
2005 2000
Total Number
%With foreign co-authorship
Total Number
•/.With foreign co-authorship
Agriculture 17 5 20 6 Biological Sciences 28 5 28 11 Molecular biology & Biotechnology 11 4 9 3 Chemical Sciences 25 5 20 5 Earth Sciences 16 4 9 3 Engineering & Technology 9 0 7 2 Environmental Sciences 10 2 10 3 Fisheries/ Aquaculture Food Science Forestry
7 ~ 5 ~
5
2 "~t~~
2
1 — 5 —
12
0 1 5
Health Science 64 18 70 16 Mathematics 5 2 1 0 N anotechnology 5 0 5 1 Physics 14 3 21 7 Social Sciences 12 3 11 2 Veterinary Sciences 6 2 4 1 Total 239 58 233 66
Performance Indicators for Science and Techno logy

Performance Indicators for Science and Techno logy
3.7 : Postgraduate output in 2004 and 2006
D e g r e e Year M e d i c a l C o m p u t e r A g r i c u l t u r e Science E n g i n e e r i n g T o t a l
PG Dip. 2004 167 20 2 5 105 299
PG Dip. 2006 11 82 12 91 18 214
MSc/MEng. 2004 37 44 130 83 206 500
MSc/MEng. 2006 63 103 220 116 40 542
M.Phil. 2004 5 - 11 8 18 42
M.Phil. 2006 1 13 21 3 38
MS/MD 2004 203 - - - 203
MS/MD 2006 224 - - - - 224
Ph.D 2004 2 _ 1 4 2 9
Ph.D 2006 1 - 4 21 - 26
Total 2004 414 64 144 100 331 1053
2006 300 185 249 249 61 1044
Source : University Statistics 2006, UGC
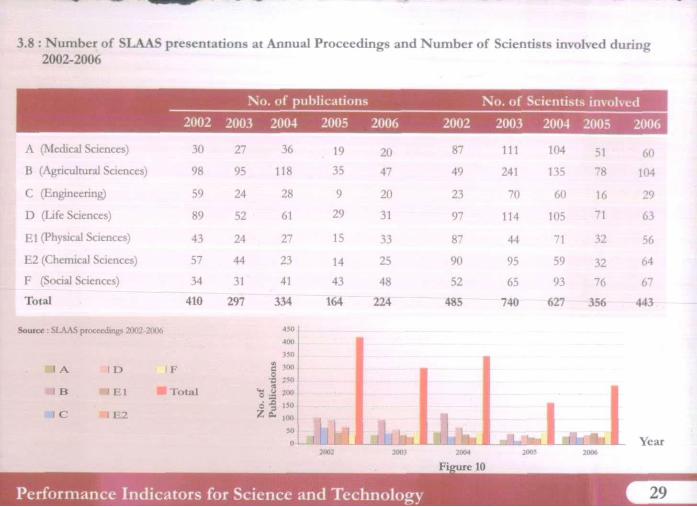
3.8 : N u m b e r of SLAAS presentat ions at Annual P r o c e e d i n g s and N u m b e r o f Scientists involved during 2 0 0 2 - 2 0 0 6
N o . o f publ icat ions N o . o f Scientists involved
2 0 0 2 2 0 0 3 2 0 0 4 2 0 0 5 2 0 0 6 2 0 0 2 2 0 0 3 2 0 0 4 2 0 0 5 2 0 0 6
A (Medical Sciences) 30 27 36 19 20 87 111 104 51 60 B (Agricultural Sciences) 98 95 118 35 47 49 241 135 78 104
C (Engineering) 59 24 28 9 20 23 70 60 16 29
D (Life Sciences) 89 52 61 29 31 97 114 105 71 63
El (Physical Sciences) 43 24 27 15 33 87 44 71 32 56
E2 (Chemical Sciences) 57 44 23 14 25 90 95 59 32 64
F (Social Sciences) 34 31 41 43 48 52 65 93 76 67
Total 410 297 334 164 224 485 740 627 356 443
Source : SLAAS proceedings 2002-2006
I A I D
B • E l
' C i E 2
2002 2003 2004 2005 2006 Figure 10
Performance Indicators for Science and Technology 2 9
Performance Indicators for Science and Technology 3 0
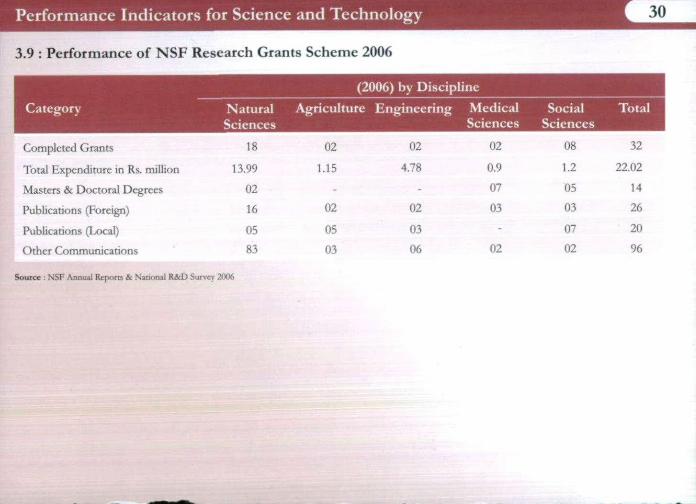
3.9 : P e r f o r m a n c e o f N S F R e s e a r c h G r a n t s S c h e m e 2 0 0 6
(2006) by Discipline
Category Natural Sciences
Agriculture Engineering Medical Sciences
Social Sciences
Total
Completed Grants 18 02 02 02 08 32
Total Expenditure in Rs. million 13.99 1.15 4.78 0.9 1.2 22.02
Masters & Doctoral Degrees 02 - - 07 05 14
Publications (Foreign) 16 02 02 03 03 26
Publications (Local) 05 05 03 - 07 20
Other Communications 83 03 06 02 02 96
Source ! NSF Annual Reports 8c Nanonal R&D Survey 2006
KEY S O C I O - E C O rilivTiirr' l l l r v l l i N ^ A - ~
K e y Socio - E c o n o m i c Indicators - General 3 2
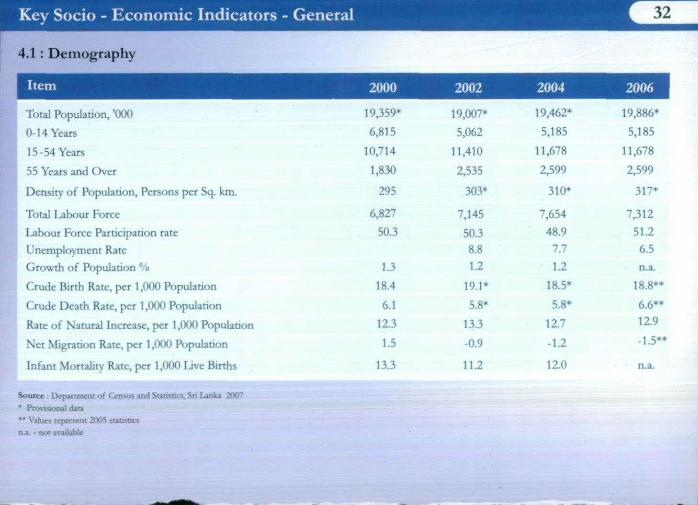
4.1 : Demography
I tem 2000 2002 2004 2006
Total Population, '000 19,359* 19,007* 19,462* 19,886*
0-14 Years 6,815 5,062 5,185 5,185
15-54 Years 10,714 11,410 11,678 11,678
55 Years and Over 1,830 2,535 2,599 2,599
Density of Population, Persons per Sq. km. 295 303* 310* 317*
Total Labour Force 6,827 7,145 7,654 7,312
Labour Force Participation rate 50.3 50.3 48.9 5 1 2 Unemployment Rate 8.8 7.7 6.5
Growth of Population % 1.3 1.2 1.2 n.a.
Crude Birth Rate, per 1,000 Population 18.4 19.1* 18.5* 18.8**
Crude Death Rate, per 1,000 Population 6.1 5.8* 5.8* 6.6**
Rate of Natural Increase, per 1,000 Population 12.3 13.3 12.7 12.9
Net Migration Rate, per 1,000 Population 1.5 -0.9 -1.2 -1.5**
Infant Mortality Rate, per 1,000 Live Births 13 J 11.2 120 n.a.
Source : Department of Census and Statistics, Sn Lanka 2007 • Provisional data •* Values represent 2005 statistics n x • not available
4.2 : H u m a n D e v e l o p m e n t I n d i c a t o r s - C o m p a r a t i v e S t a t i s t i c s
Indicator Sri Lanka India Pakistan Bangladesh Malaysia Singapore UK Japan Life expectancy at birth (2000 - 2005) 76.1 63.7 64.6 61.3 73.7 79.4 79.0 82.3 Human Development Index (2005)
0.743 0.619 0.551 0.547 0.811 0.922 0.946 0.953
GDP per Capita (US$) 2005 4,595 3,452 2,370 2,053 10,882 29,663 33,238 31,267 Health Expenditure (*PPP US$) 2004 163 91 48 64 402 1,118 2,560 2,293
H e a l t h Public Expenditure
2.0 0.9 0.4 0.9 2.2 1.3 7.0 6.3
(% of GDP) 2004 P n v a t c 2.3 4.1 1.8 2.2 1.6 2.4 1.1 1.5
Education Expenditure Public (% of GDP) 2002 - 2005
2.9** 3.8 2.3 2.5 6.2 3.7 5.4 3.6
Physicians (per 100,000 people) 2000-2004
55 601 74 26 70 140 230 198
Adult literacy Rate (% ages 15 and above) (1995 - 2000)
90.7 61.0 49.9 47.5 88.7 92.5 -
Source : Human Development Report 2 0 0 7 / 2 0 0 8 . UNDP; • PPP - Purchasing Power Parity "University statistics 2 0 0 7 , UGC
K e y Socio - E c o n o m i c Indicators - General
Key Socio - Economic Indicators - General 34
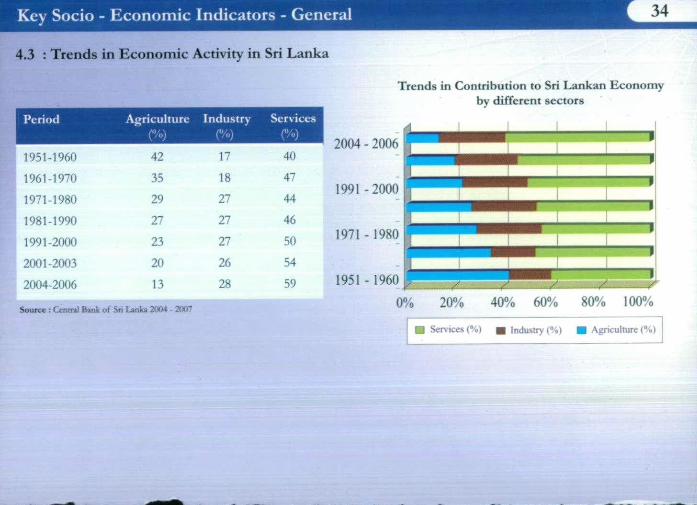
4.3 : T r e n d s i n E c o n o m i c A c t i v i t y i n Sr i L a n k a
Period Agriculture (%)
Indusir\
(%) Services
1951-1960 42 17 40
1961-1970 35 18 47
1971-1980 29 27 44
1981-1990 27 27 46
1991-2000 23 27 50
2001-2003 20 26 54
2004-2006 13 28 59
Source : Central Bank of Sn Lanka 2004 - 2007
Trends in Contribution to Sri Lankan Economy by different sectors
2 0 0 4 - 2 0 0 6
1991 - 2 0 0 0
1971 - 1 9 8 0
1951 - 1 9 6 0
Services (%) Industry (%) Agriculture (%)
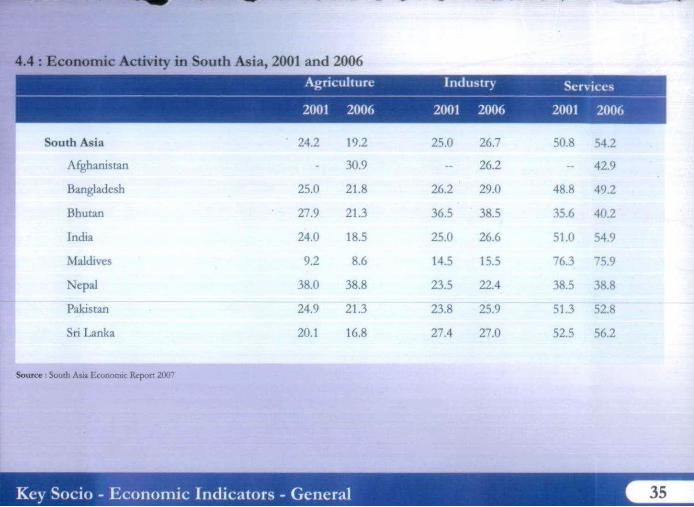
.4 : E c o n o m i c A c t i v i t y i n S o u t h A s i a , 2001 a n d 2006
A g r i c u l t u r e I n d u s t r y Serv ices
2001 2006 2001 2006 2001 2006
South Asia 24.2 19.2 25.0 26.7 50.8 54.2
Afghanistan - 30.9 - 26.2 - 42.9
Bangladesh 25.0 21.8 26.2 29.0 48.8 49.2
Bhutan 27.9 21.3 36.5 38.5 35.6 40.2
India 24.0 18.5 25.0 26.6 51.0 54.9
Maldives 9.2 8.6 14.5 15.5 76.3 75.9
Nepal 38.0 38.8 23.5 22.4 38.5 38.8
Pakistan 24.9 21.3 23.8 25.9 51.3 52.8
Sri Lanka 20.1 16.8 27.4 27.0 52.5 56.2
Source : South Asia Economic Report 2007
Key Socio - Economic Indicators - General
Key Socio - Economic Indicators - General
4.5 : Gross Nat ional Product by Industrial Or igin of Major Econon
Current Price S e c t o r 2 0 0 4 2 0 0 5 2 0 0 6
Agriculture 262,271 289,906 333,114 Agriculture, Livestock and Forestry 228,760 270,679 297,863 Fishing 33,511 19,227 35,251 Industry 598,359 740,448 900,479 Mining and Quarrying 30,129 35,932 46,202 Manufacturing 391,421 478,611 564,987
Electricity, Gas and water 49,116 57,908 72,457
Construction 127,692 167,999 216,833 Services 1,230,211 1,422,428 1,705,064 Wholesale and Retail Trade 513,498 569,255 659,597
Hotels and Restaurants 11,763 14,218 16,646 Transport and Communication 240,307 287,491 344,909 Banking, Insurance and Real Estate etc. 178,119 205,322 266,972 Ownership of Dwellings 77,676 88,759 103,201 Government Services 163,474 206,497 257,837
Private Services Gross Domestic Product
45,375 2,090,841
50,886 2,452,782
55,902 2,938,656
Gross National Product 2,070,109 2,422,733 2,898,232
Source : Central Bank ot Sn Lanka 200"
36
ic Activities Rs. million
2 0 0 4 2 0 0 5 2 0 0 6
237,536 241,851 257,131 213,246 228,006 235,872
24,290 13,846 21,260 505,602 545,981 590,298
24,439 28,791 35,769 330,459 350,886 370,355
40,445 46,108 52,926 110,259 120,196 131,248
1,084,459 1,153,839 1,243,119 451,633 480,402 514,511
10,691 9,186 9,411 210,495 230,597 259,546 153,143 163,863 177,817 70,008 70,749 71,533
146,030 153,866 161,611 42,460 45,177 48,689
1,827,597 1,941,671 2,090,548 1,809,475 1,917,884 2,061,791
4.6 : Realised Investments through B O I Projects in 2005 - 2006
Number of Foreign Total Investment Projects Investment Potential
Rs.million Rs.million
Category 2005 2006 2005 2006 2005 2006
Food, beverages and tobacco products 147 142 16,765 20,375 27,105 32,174 Textiles, wearing apparel and leather products 492 481 30,278 36,970 45,879 55,767 Wood and wood products 25 26 5,619 5,715 5,877 6,111 Paper and paper products 30 29 788 747 1,771 1,769
Chemical, petroleum, coal, rubber and plastic products 144 135 19,042 21,931 28,516 33,447
Non-metallic mineral products 64 65 9,621 11,400 17,942 19,792 Basic metal products - - - - - -
Fabricated metal products, machinery, and transport equipment 83 84 9,827 13,153 12,383 16,424
Manufactured products (n.es.) 156 154 8,403 10,750 11,534 14,487
Services 793 856 133,180 164,325 229,122 288,046
Source Central Bank of Sn l-anka 2007
Key Socio - Economic Indicators - General

Key Socio - Economic Indicators - General
4 . 7 : C o m p o s i t i o n o f E x p o r t s 2 0 0 4 - 2 0 0 6
Industrial Exports (Total) Textiles and Garments Petroleum Products Rubber Based Products Diamonds
Agricultural Exports Tea Rubber Coconut Products
Minor Agricultural Products
Gems
Other
Total
S o u r c e : Central Bank o f Sn Lanka 2011 7
Rs. million
285,172 291,087 320,829 10,133 13,169 19,580 28,727 39,693 44,529 24,950 26,594 32,440
74,897 81,482 91,667 5,155 4,724 9,674
11,453 11,400 12,898 16,446 18,439 20,242
10,939 12,088 10,714
6,738 10,134 7,198
583,967 638,276 716,579
4.8 : C o m p o s i t i o n o f I m p o r t s 2004 - 2006
Consumer Goods Rice Flour and Sugar Milk and Milk Products Fish and Fish Products Other Food Products Other Consumer Goods
Intermediate Goods Petroleum Textiles Fertiliser Chemical Elements, Dyeing and Colounng Materials Other Intermediate Goods
Investment Goods Machinery and Equipments Building Materials and Transport Equipments Other Investment Goods
Unclassified Imports
Total Imports
Source : Central Bank of Sri l-anka 2007
Key Socio - Economic Indicators - General
Rs. million
146,073 151,021 185,461 6,186 1,554 577
11,339 16,503 23,577 1 2 3 3 8 13,401 17,761
5,849 6,989 9,647 24,736 22,963 27,294 85,626 89,611 106,607
489,688 549,004 640,810 122,732 166,562 215,168 153,476 153,957 160,987
10,902 13,552 17,036 26,707 31,348 34,555
175,871 183,585 213,064
169,0% 188,061 233,637 86,709 86,567 110,853 66,717 83,710 94,750 15,670 17,785 28,035
6,280 3,272 6,781
811,138 891,359 1,066,689
K e y Socio - E c o n o m i c Indicators - General
4.9 : Key Indicators on Household I n c o m e 1985 - 2005
Survey period
Variable Units 1985/86 1990/91 1995/96 2002 2005
Rs. 2012 3549 6476 12803 20048 Mean household income per month
Rs. 1322 2547 3793 8482 13617 Median Household income per month Rs. 395 724 1439 3056 4896 Per capita income per month
Rs. 1195 1125 1177 1362 1649 Real income (based year 1980/81)
Rs. 941 1819 3367 6959 10563 Income receivers mean income per month
Rs.
No of income receivers per household Nos. 2 2 1.8 1.8 1.9
Household size Nos. 5.1 4.9 4.5 4.2 4.1
Monetary income per month per household Rs. 1334 2963 5264 10386 17089
Non monetary income per month per household Rs. 678 586 1212 2419 2959
Gini coefficient of household income 0.46 0.43 0.46 0.47 0.47
Gini coefficient of household expenditure 0.36 0.41 0.4
Gini coefficient of income receivers income 0.52 0.52 0.53 0.55
Mean household expenditure per month Rs. 2079 3905 6525 13147 19151
Expenditure on food and drink Rs. 1198 2377 3552 5848 7593 Expenditure on non food items
Rs. 802 1384 2753 6993 11079 (excluding liquor and tobacco)
7 Q 1 A A "711) 479 Expenditure on Liquor & Tobacco Rs. 17
% 57.6 64.6 54.4 44.5 39.6 Food Ratio (as a percentage) % 64.6 54.4 44.5 39.6
S o u r c e Househo ld I n c o m e and Expendi ture Survey - 2 0 0 6 / 0 7 . Depar tment o f Census and Statistic!, Sri Lanka
4.10 : S a l i e n t F e a t u r e s o f T e l e c o m m u n i c a t i o n s a n d P o s t a l S e r v i c e s 2003 - 2006
Telecomrnunications Services 1. Fixed access services
Wirelines in Service (No.) Wireless Access (No.) Telephone Density (Telephones per 100 persons)
2. Other Services Cellular Phones (No. of Subscribers) Public Pay Phones (No. of Booths) Radio Paging Services (No. of Subscribers) Internet & Email (No. of Subscribers)
Postal Services 1. Delivery Areas (No.) 2. Post Offices (No.)
Public Private
3. Area Served by a Post Office (Sq. Km.) 4. Population Served by a Post Office (No.) 5. Letters per Inhabitant (No.)
2003 2004 2005 2006
817,750 860,468 919,040 909,894 (a) 116,021 130,771 324,953 974,184
4.88 5.09 6.26 9.53
1,393,403 2,211,158 3,361,775 5,412,496 6,440 6,095 6,285 7,561 2,851 828 n.a. n.a.
85,500 93,300 115,000 130,000
6,729 6,729 6,729 6,729 4,630 4,711 4,704 4,727 4,050 4,049 4,041 4,043
580 662 663 684 14.1 13.9 13.9 13.8
4,084 4,100 4,100 4,167 24 24 25 24
Source : Central Bank of Sri Lanka 2007 (a) Wire lines declined in 2006 due to shift of tome subscribers to CDMA
Key Socio - Economic Indicators - General 41
Key Socio - Economic Indicators - General
4 . 1 1 : E m p l o y m e n t b y E c o n o m i c A c t i v i t y ( a )
S e c t o r P e r s o n s ( 0 0 0 ' ) P e r c e n t a g e o f E m p l o y m e n t
2 0 0 5 ( b ) 2 0 0 6 2 0 0 5 2 0 0 6
Agriculture 2,059 2,287 30.3 32.2
Industry 1,787 1,890 26.3 26.6
Manufacturing 1,293 1,363 19.0 19.2
Construction 494 527 7.3 7.4
Services 2,941 2,928 43.3 41.2
Trade and hotels etc. 932 1,084 13.7 15.3
Transport, Storage and Communication 448 430 6.6 6.1
Finance, Insurance and real estate 226 221 3.3 3.1
Personal Services and other 1,335 1,192 19.7 16.8
Total employment 6,788 7,105 100.0 100.0
Source: Department of Census and Statistic* (a) Data exclude both Northern and Eastern Provinces. (b) Quarterly Report of the Labour Force Survey (August 2005)
4 . 1 2 : S t a t i s t i c s o n S e c o n d a r y E d u c a t i o n 2 0 0 3 - 2 0 0 6
I t e m 2 0 0 3 2 0 0 4 2 0 0 5 2 0 0 6
General Education 1. Schools (No.) 10,473 10,501 10,461 10,461
1.1 Government Schools 9,790 9,765 9,723 9,714 o/w National Schools 323 324 324 327
1.2 Other Schools 683 736 738 747 Private 85 85 85 93 Pirivenas 598 651 653 654
2. Students (No.) 4,098,465 4,028,186 4,103,512 4,000,714 2.1 Government Schools 3,941,685 3,870,628 3,942,077 3,837,548 2.2 Other Schools 156,780 157,558 161,435 163,166
Private 101,047 100,683 106,262 107,874 Pirivenas 55,733 56,875 55,173 55,292
3. New Admissions (No.) 316,344 303,269 (a) 319,078 (a) 322,431 (a) 4. Teachers 196,588 197,697 199,715 217,369
4.1 Government Teachers 186,695 187,337 189,234 206,559 4.2 Others 9,893 10,360 10,481 10,810
5. Student/Teacher Ration (Government Schools) 21 21 21 19 6. Expenditure on Education (Rs.mn.) (b) 39,116 42,340 63,557 78,344
6.1 Current 31,673 33,792 50,697 61,144 6.2 Capital 7,443 8,548 12,860 17,200
7. Expenditure as a % of GDP 2.15(c) 2.03 (c) 2 .59(c) 2.67 (c)
Source: Ministry of Education, University Grants Commission, Ministry of Finance and Planning, and Centra] Bank of Sri Ijnka (a) Government schools only, (b) Government expenditure on Ciencra] and Higher Education
Data based on estimates compiled by the Department of Census and Statistics
K e y Socio - E c o n o m i c Indicators - General 43
K e y Socio - E c o n o m i c Indicators - General 44
4.13 : S t a t i s t i c s o n U n i v e r s i t y E d u c a t i o n
Item 2003 2004 2005 2006
University Education 1. Universities (No.) 13 13 15 15 2. Students (No.) (e) 64,191 64,801 66,386 65,206 3. Lecturers (No.) 3,543 3,725 3,875 4,016 4. Number Graduating 10.730(f) 10.525(g) 7,154(h) 1 1 , 7 1 3 ®
4.1 Art and oriental Studies 3,456 3,366 1,652 4,405 4.2 Commerce & Management Studies 2,121 3,091 1,436 2,198 4.3 Law 307 166 345 327 4.4 Science 1,876 1,323 1,250 2,348 4.5 Engineering 652 984 755 809 4.6 Medicine 1,273 964 805 896 4.7 Dental Surgery 74 84 74 123 4.8 Agriculture 394 388 554 430 4.9 Veternary Science 61 42 74 64 4.10 Architecture & Quantity Surveying 81 69 59 13
5. New Admissions for Basic Degrees (No.) 25,471© 13,396 14,520 16,585
Source: University Grants Commission; Ministry of Finance and Planning ; and Central Bank of Sn Lanka (e) In all Universities, excluding the Open University of Sri Lanka if; Including Fine Arts (359) and Ayurvedic/Unani/Sidda Medicine (76) (g) Including Ayurvedic/Unam/Sidda Medicine (48) (h) Including Ayurvedic/Unani/Sidda Medicine (134) and Computer SC/rr/lCT/MIT (16) (i) Including Computer SC/IT/ICT/MIT (100) (j)Qualified students from two GCE (A/L)
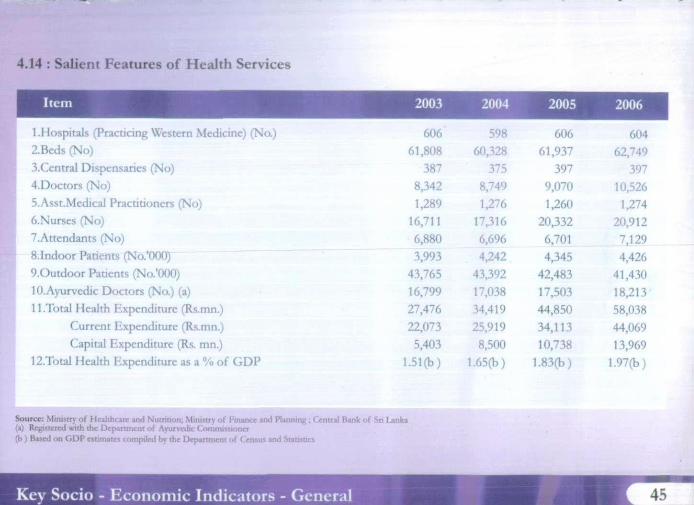
4.14 : S a l i e n t F e a t u r e s o f H e a l t h S e r v i c e s
I tem 2003 2004 2005 2006
1 .Hospitals (Practicing Western Medicine) (No.) 606 598 606 604 2.Beds (No) 61,808 60^28 61,937 62,749 3.Central Dispensaries (No) 387 375 397 397 4.Doctors (No) 8,342 8,749 9,070 10,526 5.Asst.Medical Practitioners (No) 1,289 1,276 1,260 1,274 6.Nurses (No) 16,711 1 7 3 1 6 20,332 20,912 7.Attendants (No) 6,880 6,696 6,701 _7,129 8.1ndoor Patients (No.'OOO) 3,993 4,242 4,345 4,426 9.0utdoor Patients (No.'OOO) 43,765 43,392 42,483 41,430 10.Ayurvedic Doctors (No.) (a) 16,799 17,038 17,503 18,213 11.Total Health Expenditure (Rs.mn.) 27,476 34,419 44,850 58,038
Current Expenditure (Rs.mn.) 22,073 25,919 34 ,113 44,069 Capital Expenditure (Rs. mn.) 5,403 8,500 10,738 13,969
12Total Health Expenditure as a % of GDP 1.51(b) 1.65(b) 1.83(b) 1.97(b)
Source: Ministry- of Healthcare and Nutrition; Ministry of Finance and Planning ; Central Bank of Sn Lanka (a) Registered with the Department of Ayurvedic Commissioner (b ) Based on GDP estimates compiled by the Department of Census and Statistics
Key Socio - Economic Indicators - General
Key Socio - Economic Indicators - General
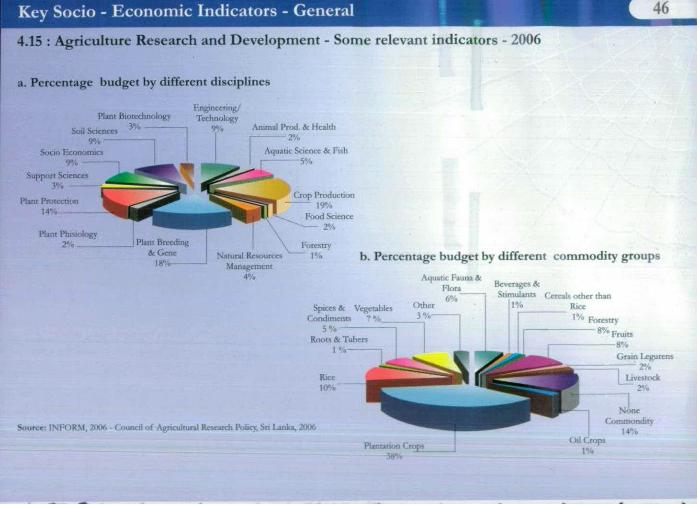
4 . 1 5 : A g r i c u l t u r e R e s e a r c h a n d D e v e l o p m e n t - S o m e r e l e v a n t i n d i c a t o r s - 2 0 0 6
a. Percentage budget by different disciplines
Soil Sciences 9%
Socio Economics 9%
Support Sciences 3%
Plant Protecnon 14%
Plant Phisiology 2%
Plant Biotechnology 3V«
Engineering/ Technology
9% Animal Prod. & Health 2%
Aquatic Science & Fish | 5 %
Crop Production 19%
Food Science 2%
Natural Resources Management
4%
b. Percentage budget by different commodity groups
Aquatic Fauna & Flora 64/c
Spices & Vegetables Condiments 7 %
5»/< Roots & Tubers
Beverages ic Stimulants Cereals other than
1% Rice , 0 / o Forestry
^•Fruits 8 %
Grain Legurcns ' 2%
Source: INFORM, 2006 - Council of Agnculrural Research Policy. Sn I-anka, 2006
Plantation Crops 38%
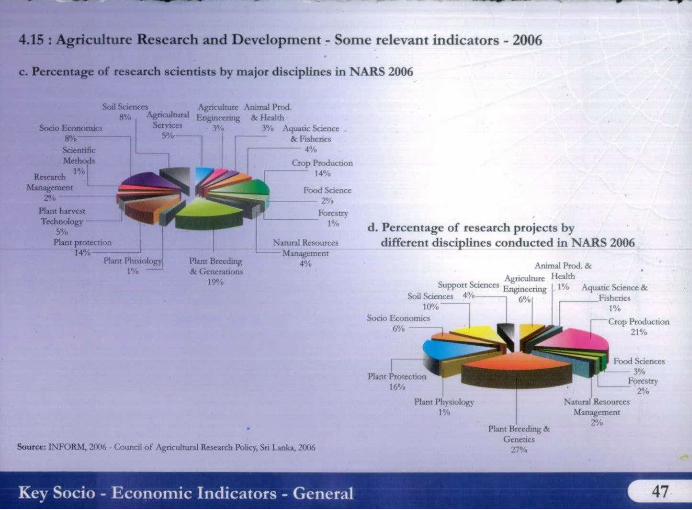
4.15 : Agriculture Research and Development - Some relevant indicators - 2006
C. Percentage o f research scientists by m a j o r disc ipl ines in NARS 2006
Socio Economics 8%
Scientific Methods
Research ' Management
2% Plant harvest Technology
5% Plant protection
14%
Soil Sciences Agriculture Animal Prod. 8%, Agricultural Engineering & Health
3% Aquatic Science — 6c Fisheries
4%
Services 5%-
Plant Phisiologyj 1%
Crop Production 14%
Food Science 2%
Fores try 1%
Natural Resources Management
4%
d. Percentage of research projects by different disciplines conducted in NARS 2006
Support Sciences fc^™ Soil Sciences 4%
10%
Animal Prod. & Agriculture Health
1% Aquatic Science tV _Fishenes
1% Socio Economics
6%
Plant Protection 16%
Crop Production 21%
Food Sciences 3%
Plant Physiology 1%
Source: INFORM, 2006 - Council of Agncultural Research Policy, Sri Lanka, 2006
Plant Breeding & Genetics
27%
Natural Resources Management
2%
K e y Socio - E c o n o m i c Indicators - General 47
Key Socio - E c o n o m i c Indicators - General 48
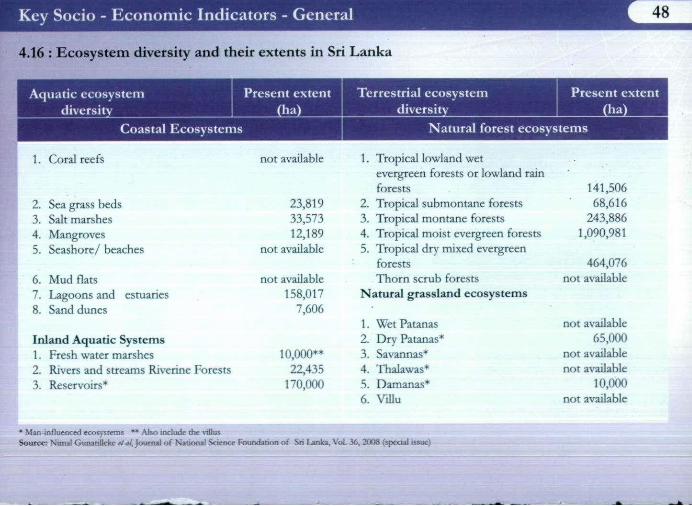
4.16 : Ecosystem diversity and their extents in Sri Lanka
Aquatic ecosystem Present extent Terrestrial ecosystem Present extent diversity (ha) diversity (ha)
Coastal Ecosystems Natural forest ecosystems
1. Coral reefs not available 1. Tropical lowland wet evergreen forests or lowland rain forests 141,506
2. Sea grass beds 23,819 2. Tropical submontane forests 68,616 3. Salt marshes 33,573 3. Tropical montane forests 243,886 4. Mangroves 12,189 4. Tropical moist evergreen forests 1,090,981 5. Seashore/ beaches not available 5. Tropical dry mixed evergreen
forests 464,076 6. Mud flats not available Thorn scrub forests not available 7. Lagoons and estuaries 158,017 Natural grassland ecosystems 8. Sand dunes 7,606
1. Wet Patanas not available Inland Aquatic Systems 2. Dry Patanas* 65,000 1. Fresh water marshes 10,000** 3. Savannas* not available 2. Rivers and streams Riverine Forests 22,435 4. Thalawas* not available 3. Reservoirs* 170,000 5. Dam anas* 10,000
6. ViUu not available
* Man-influenced ecosystems *" Also include the villus
Source: Nimal Gunatilleke tt al, Journal of National Science Foundation of Sri Lanka, VoL 36, 2008 (special issue)
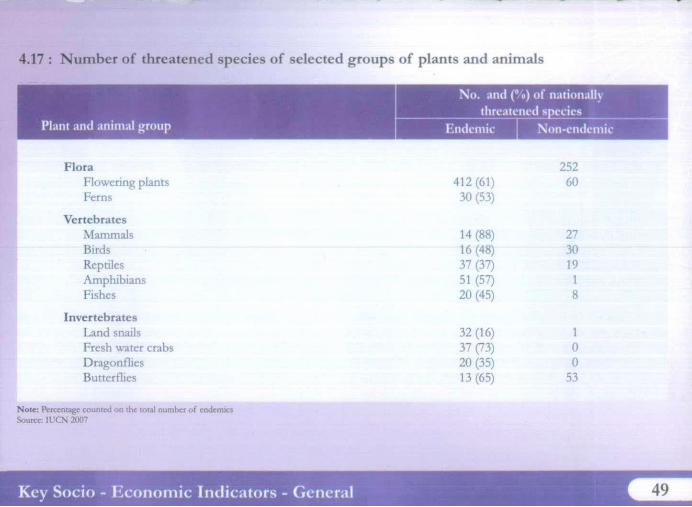
4.17 : N u m b e r o f t h r e a t e n e d s p e c i e s o f s e l e c t e d g r o u p s o f p l a n t s a n d a n i m a l s
No. and (" •) of national!) threatened species I
Plant and animal group Endemic Non-endemic
Flora 252 Flowering plants 412 (61) 60 Ferns 30 (53)
Vertebrates Mammals 14 (88) 27 Birds 16 (48) 30 Reptiles 37 (37) 19 Amphibians 51 (57) 1 Fishes 20 (45) 8
Invertebrates Land snails 32 (16) t Fresh water crabs 37 (73) 0 Dragonflies 20 (35) 0 Butterflies 13 (65) 53
Note: Percentage counted on the total number of endemics Source: IUCN 2()07
Key Socio - Economic Indicators - General 49
DEFINITIONS
The definitions and classifications used in the National R&D Survey 2006 and this Handbook are based on the recommendations o f the I n t e r n a t i o n a l Standardization o f Statistics on Science and Technology (UNESCO, 1978) and the Frascati M a n u a l (OECD, 2002).
1. Research & Experimental Development (R&D) comprise creative work undertaken on a systematic basis in order to increase the stock knowledge, including knowledge o f humanity, culture and society, and the use o f this stock of knowledge to device new applications. The term R&D covers three activities: basic research, applied research and experimental development.
Basic research is the experimental or theoretical work undertaken primarily to acquire new knowledge o f the underlying foundations phenomena and observed facts, without any particular application or use in view.
A p p l i e d research includes original investigation undertaken in order to acquire new knowledge. It is, however, directed primarily towards a speci fie practical aim or objective.
E x p e r i m e n t a l d e v e l o p m e n t is the systematic work, drawing on existing knowledge gained from research and practical experience that is directed to producing new materials, products and devices; to installing new process, systems and services; or to improving substantially those already produced or installed.
2. Sectors f
G o v e r n m e n t sector includes : all departments, offices and other bodies which furnish, but normally' do not sell to the community , those common services. H i g h e r E d u c a t i o n sector includes all universities, colleges of technology and other institutions providing tertiary education, whatever their sources o f funds or legal status. P r i v a t e sector includes all firms, organizations and institutions whose primary activity is the market production o f the goods or services (other than higher education) for sale to the general public at an economically significant price and to the private non profit institutions mainly serving them
3. R&D Expenditures
R&D Expenditures are all expenditures for R&D performed within a sector o f the economy, including both
a. Current cost (labour cost, non capital purchases of materials, supplies of R&D equipments, water, fuel, gas electricity, library materials etc.)
b. Capital expenditure (reported in full for the period when they took place and should not register as element of depreciation)
4. Human Resources in Research and Development Science and Technology Personnel (STP); It is defined according to the Canberra Manual (OECD, as persons fulfilling one of the following conditions: • Successfully completed education at the tertiary level in an S&T field of study (seven broad S&T fields of study are Natural Science,
Engineering and Technology, Medical Sciences, Agriculture Sciences, Social Sciences, Humanities and other fields). • Not formally qualified as above but employed in an occupation where the above qualifications are normally required. • Working in the above fields providing technical services or supporting services.
R&D Personnel are all persons employed directly on R&D, as well as those providing direct services such as R&D managers, administrators, and clerical staff excluding persons providing an indirect service such as canteen and security.
Researchers are professionals engaged in the conception or creation o f new knowledge, product processes, methods and systems and also in the management of the projects concerned. Postgraduates students at the Ph.D. level engaged in R&D are also considered as researchers.
Technicians and equivalent staff are persons whose main tasks require technical knowledge and experience in one or more fields of engineering, physical and life sciences (technicians) or social sciences and humanities (equivalent staff). They participate in the R&D by performing scientific and technical tasks involving the application o f concepts and operational methods normally under the supervision of researchers.
Other supporting staff includes skilled and unskilled craftsmen, secretarial and clerical staff participating in R&D projects or directly associated with (or providing services to researchers involved in) such projects.
Headcount data reflect the total number of persons employed in R&D, independently from their dedication. These data allow links to be made with other data series, such as education and employment data or the results of population censuses. They are also based for calculating indicators analyzing the characteristics of the R&D workforce, with respect to age, gender or national origin.
One Full-time equivalent is one person-year. (e.g. a person normally spends 3 0 % of his/her time on R&D and the rest on other activities such as teaching, administration and counseling, the FTE is then counted as 0.3). Similarly, i f full time R&D worker employed at an R&D unit for only for six months period the FTE is calculated as 0.5.
Abbreviat ions
F T E Full Time Equivalent GERD Gross Expenditure on R&D GDP Gross Domestic Product GNP Gross National Product HND Higher National Diploma IT Information Technology na Not available NA Not Applicable NGO Non Government Organization NSF National Science Foundation R&D Research and Development S&T Science and Technology SCI Science Citation Index SLAAS Sri Lanka Association for the Advancement of Science STP Science and Technology Personnel STPRD Science & Technology Policy Research Division UGC University Grants Commission
1-COI-06SQS6-8Z5 N8SI payuj.-i 'Siaiuud) AuedujoQ ? euaseunr, Q • Aq paiuiy s pauftsac
>j|oejsu'MMM
/ oqLUO|OQ 90B|d pUB|ilB|AJ S/lp
uo|jepunoj eoueps IBUOIJBN
900c* - *tooqpu»H J»3»*£?WS A"2ojouipaj_ ^ aotiaps p^inrj US
\ \1 ION VI
s( n\( i. FOUNDATION
SRI LANKA SCIENCE & TECHNOLOGY
National Science Foundation 47/5, Maitland Place.
Colombo 07 Sri Lanka.
www.nsf.ac.lk